

Abstract
Background
Without timely diagnosis and treatment, tachycardia, also called tachyarrhythmia, can cause serious complications such as heart failure, cardiac arrest, and even death. The predictive performance of conventional clinical diagnostic procedures needs improvement in order to assist physicians in detecting risk early on.
Objective
We aimed to develop a deep tachycardia onset prediction (TOP-Net) model based on deep learning (ie, bidirectional long short-term memory) for early tachycardia diagnosis with easily accessible data.
Methods
TOP-Net leverages 2 easily accessible data sources: vital signs, including heart rate, respiratory rate, and blood oxygen saturation (SpO2) acquired continuously by wearable embedded systems, and electronic health records, containing age, gender, admission type, first care unit, and cardiovascular disease history. The model was trained with a large data set from an intensive care unit and then transferred to a real-world scenario in the general ward. In this study, 3 experiments incorporated merging patients’ personal information, temporal memory, and different feature combinations. Six metrics (area under the receiver operating characteristic curve [AUROC], sensitivity, specificity, accuracy, F1 score, and precision) were used to evaluate predictive performance.
Results
TOP-Net outperformed the baseline models on the large critical care data set (AUROC 0.796, 95% CI 0.768-0.824; sensitivity 0.753, 95% CI 0.663-0.793; specificity 0.720, 95% CI 0.645-0.758; accuracy 0.721; F1 score 0.718; precision 0.686) when predicting tachycardia onset 6 hours in advance. When predicting tachycardia onset 2 hours in advance with data acquired from our hospital using the transferred TOP-Net, the 6 metrics were 0.965, 0.955, 0.881, 0.937, 0.793, and 0.680, respectively. The best performance was achieved using comprehensive vital signs (heart rate, respiratory rate, and SpO2) statistical information.
Conclusions
TOP-Net is an early tachycardia prediction model that uses 8 types of data from wearable sensors and electronic health records. When validated in clinical scenarios, the model achieved a prediction performance that outperformed baseline models 0 to 6 hours before tachycardia onset in the intensive care unit and 2 hours before tachycardia onset in the general ward. Because of the model’s implementation and use of easily accessible data from wearable sensors, the model can assist physicians with early discovery of patients at risk in general wards and houses.
Keywords: tachycardia onset, early prediction, deep neural network, wearable monitoring system, electronic health record
Introduction
Tachycardia, a heart rhythm disorder, is defined as an adult resting heart rate that exceeds 100 bpm [1]. According to the mechanisms, causes, expressions and outcomes, tachycardia can be classified as sinus tachycardia, atrial fibrillation, atrial flutter, ventricular tachycardia, or ventricular fibrillation [2]. Spontaneous ventricular tachyarrhythmia is a major cause of sudden cardiac death; approximately 180,000 to 300,000 people suffer from this condition in the US yearly [3,4]. Atrial fibrillation is a risk factor for stroke, congestive heart failure, and premature death. Patients suffering from atrial fibrillation for the first time have a high rate of mortality [5,6]. In addition, tachycardia has been correlated to poor outcomes [7]. Conventional tachycardia detection depends on cardiologists or clinical experts reading electrocardiogram (ECG) signals. Due to limited numbers of measurements and the intermittent nature of the diseases, the symptoms of tachycardia might not be captured when ECGs are recorded in hospitals [8]. Therefore, continuous monitoring enables clinicians to early diagnose, predict the disease, and have enough time to prevent patients from deteriorating.
Recently, several hospitals have attempted to utilize wearable devices for continuous monitoring of vital signs such as heart rate, respiration rate, and oxygen saturation (SpO2) [9,10]. The adoption of wearable devices in hospitals facilitates the acquisition of patient status anywhere and anytime to reduce the workload of nurses. Compared with the use of single-threshold alarm monitoring devices and commonly used early warning scores defined by clinical experts [11], machine learning methods can automatically discover patterns and relationships within data without human instructions. Thus, machine learning has been proven as an effective clinical tool to identify abnormal events or provide early warning of diseases based on electronic health record, biomarker, gene expression, and imaging data [12-14]. Forkan et al [15] leveraged a hidden Markov model to predict 7 clinical onsets, including tachycardia onset, and further improved performance by using random forest algorithms to forecast events within 1 to 2 hours [16]. Lee et al [17] developed an artificial neural network to predict ventricular tachycardia within 1 hour. Szep et al [18] utilized an archetypal cardiac monitoring system with regression and boosting models to detect arrhythmia and predict the fatal arrhythmia several minutes before onset.
With nonlinear computation and flexible feature extraction, deep learning models show strong performances in representation learning and exploration of unknown information [19]. Researchers have recently used deep learning models for disease diagnosis and prediction based on physiological signals or electronic health records [20-22]. Since measuring and acquiring vital signs are easily measured and some open-source, labeled physiological signal (especially ECG signals) data sets are available [23,24], there exist many studies employing deep learning in cardiology [25]. Hannun et al [26] reported a convolutional neural network algorithm that detects heart arrhythmias using ECG signals acquired with a single-lead wearable sensor. Shashikumar et al [27] also presented a convolutional neural network model that detects and monitors atrial fibrillation. Teijeiro et al [28] introduced a long short-term memory (LSTM) network based on a set of features extracted from ECG records to classify normal sinus rhythm, atrial fibrillation, and anomalies. Gotlibovych et al [8] constructed a model combining a convolutional neural network and LSTM to achieve nearly real-time identification of atrial fibrillation. Cho et al [29] obtained a convolutional neural network model to predict atrial fibrillation within 4 to 6 minutes using ECG signals.
Cardiovascular diseases are complex and heterogeneous; multiple factors such as genetics, environment, age, and gender can affect the occurrence and severity of cardiovascular disease [30,31]. Age has been proven to be an independent risk factor, and being female is a greater risk factor for cardiovascular disease when elderly [31]. Few studies have attempted to develop a prediction tachycardia onset model that accounts for the patient’s personal information. Respiratory dysfunction and common lung diseases, such as asthma, chronic obstructive pulmonary disease, and lung fibrosis are significantly more likely to cause cardiovascular disease [32]. Abnormal respiratory rate and its relative changes are a critical indicator to predict cardiac arrest [33], and SpO2 has also been shown as a diagnostic marker of acute heart failure [34]. However, this useful information has not been used effectively, though it can be easily acquired with wearable sensors.
The aim of this study was to develop a bidirectional long short-term memory (BiLSTM) model—TOP-Net—that is applicable to both intensive care units and general wards [35], leverages easily accessible data, enables real-time evaluation and early prediction of tachycardia onset with a long forecast range, and is based on vital signs and electronic health record data with the following contributions: (1) combining electronic health record (sparse records) and biosensor data (high frequency records) to accomplish early prognosis and real-time prediction of tachycardia onset, and its performance of early prediction; (2) being the first to consider 2 other important vital signs and explore their different combinations being with deep learning models to predict tachycardia onset, which can improve the precision of early forecast; and (3) utilizing a large critical care data set and a model that is transferrable to real clinical scenarios wards where patients are monitored by medical-grade wearable embedded systems, for example, transferable between different countries (US to China), ethnicities (multiracial to Asian), and medical departments (intensive care unit to general ward).
Methods
Overview
We leveraged a large data set from the Medical Information Mart for Intensive Care III (MIMIC-III) [24] and its matched physiological waveform database (recorded with monitors) [36] to develop the TOP-Net model (codes available [37]). The pretrained model was transferred to a relatively small data set, from patients who were continuously monitored with a medical-grade wearable embedded system (SensEcho, Beijing SensEcho Science & Technology Co Ltd) in a real clinical environment [38]. The process is presented in Figure 1.
Figure 1.
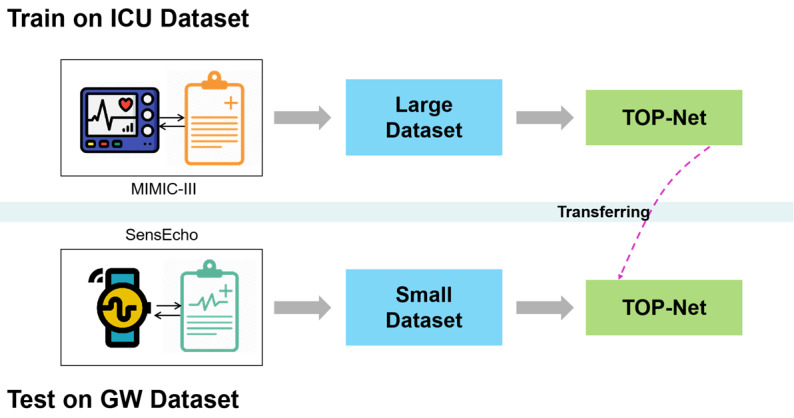
The process of developing and transferring the early tachycardia onset model, TOP-Net. GW: general ward; ICU: intensive care unit.
Methodology
We combined 2 types of data to develop TOP-Net: (1) information from biological sensors (wearable), including heart rate, respiratory rate and SpO2; (2) patients’ personal information from electronic health records, which represents their individual health status when admitted to the hospital, including age, gender, admission type, first care unit, and history of cardiovascular disease.
TOP-Net Tachycardia Onset Early Prediction Using BiLSTM Model
Model Overview
BiLSTM [39], a sequential model, can capture the complex and multivariate dynamics in longitudinal electronic health record data and continuously collected physiological signals that is typically used in acute condition prediction, classification, and subphenotype identification [40]. We developed the model (Figure 2) using BiLSTM to take advantage of potential long-term and short-term changes and associated characteristics of physiological state.
Figure 2.
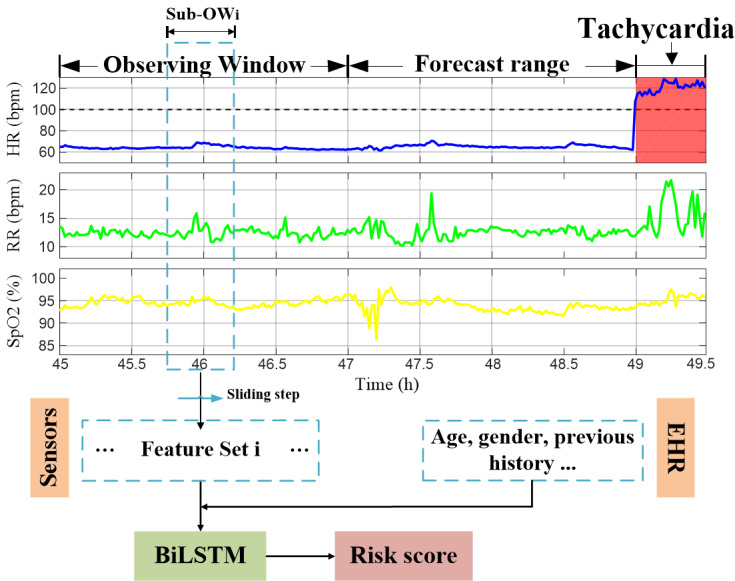
An overview of TOP-Net using the cohort admission and personal measurement data in hospital. BiLSTM: bidirectional long short-term memory; EHR: electronic health record; HR: heart rate; RR: respiratory rate; SpO2: blood oxygen saturation.
Step 1: Calculate Statistical Features
We used a BiLSTM algorithm to represent the relationship between the multiple timeseries collected by biological sensors. Data from an observing window before tachycardia onset were used to train the model. Inspired by convolutional-LSTM model [41], we designed the model to use the statistical features of the raw timeseries signals as inputs within a sliding sub–observing window. The results for all sub–observing windows were concatenated along the time and fed into the model.
We explored 8 types of statistical features—mean, standard deviance, slope, quantiles, sum, absolute energy (ƒ1), aggregation function of autocorrelation (ƒ2), and measurement of discrimination power (ƒ3)—that are commonly used to describe the timeseries characteristics. Herein, we focus on explaining the calculation process of ƒ1, ƒ2, and ƒ3.
The absolute energy of the timeseries is calculated as
The correlation of a timeseries and its time lag is described by ƒ2,
 |
which is a similarity measurement index where Xi is a timeseries value at one time point, n is the length of X, σ2 and μ are estimations of the timeseries variance and mean, respectively, and l is the time lag [42].
The nonlinearity of a timeseries is quantized using
 |
where lag is a time delay operator (equal to l) [43].
Step 2: Fuse Patient Characteristics
We extracted the previously mentioned static patient information which was merged with the statistical features. The concatenated vectors were normalized and input to the BiLSTM model.
Step 3: Obtain Tachycardia Onset Risk Score
In this step, TOP-Net determines a real-time risk score that evaluates an individual risk probability of tachycardia onset. When the risk score continuously exceeds the threshold set by the doctor for a period of time, the caregiver is alerted.
Medical Information Mart for Intensive Care (MIMIC)
MIMIC III is a large, publicly available critical care database (version 1.4 [24]), with 38,557 adult patients’ (52,955 ICU admissions) detailed hospital information such as demographic information, laboratory test results, and diagnosis codes. Patients’ multiple physiological signals (waveforms) and corresponding numeric format of vital signs are stored in the MIMIC III Waveform Database, which contains 10,282 patients’ time alignment information and 22,247 numeric records that can be matched to the clinical database [36]. The basic information is stored in the tables of admissions, patients’ hospital admission information; icustays, ICU transfer (in and out) information; patients, individual birth and death dates; and diagnoses_icd, diagnosis codes during hospitalization. All of the tables can be associated with subject_id, a unique identity of patients. The waveform database includes the header files (name, unit, and recording frequency) and segments of recordings (numeric signals). Figure 3 presents the method used to link tables of information with the temporal waveforms.
Figure 3.
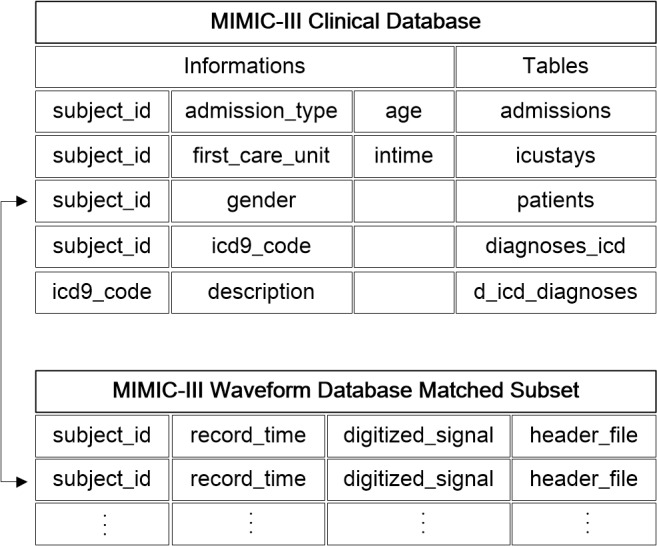
The connection between clinical and waveform information in the MIMIC-III database.
Continuous Monitoring Database for the General Ward
The use of general ward data was approved by the ethics committee of the General Hospital of PLA (S2018-095-01). In the general ward, we utilized a SensEcho medical-grade monitoring system, which can monitor patients anytime and anywhere. SensEcho contains 3 parts (Figure 4): a wearable multisensor system unit, a wireless network and data transmission unit, and a central monitoring system [35,38]. The multisensors include a single-lead ECG sensor (200 Hz), a sensor for respiratory inductive plethysmography (25 Hz), a noninvasive photoplethysmogram sensor for SpO2 monitoring (1 Hz) based on near-infrared spectroscopy, and a posture recognition sensor using a 3-axis accelerometer. These signals are collected and stored in a data logger. The logger has an ultra–low power Wi-Fi module and supports long-term data transmission by relying upon hospital networks. The central monitoring system receives information, processes data, and delivers and displays information. The algorithms deployed on the system included signal quality evaluation, signal processing, real-time abnormal event monitoring and early prediction, and patients’ health assessment, which were packaged as a toolkit (Midas). The accuracy, stability, and effectiveness of our system have been validated in previous studies [44-46].
Figure 4.
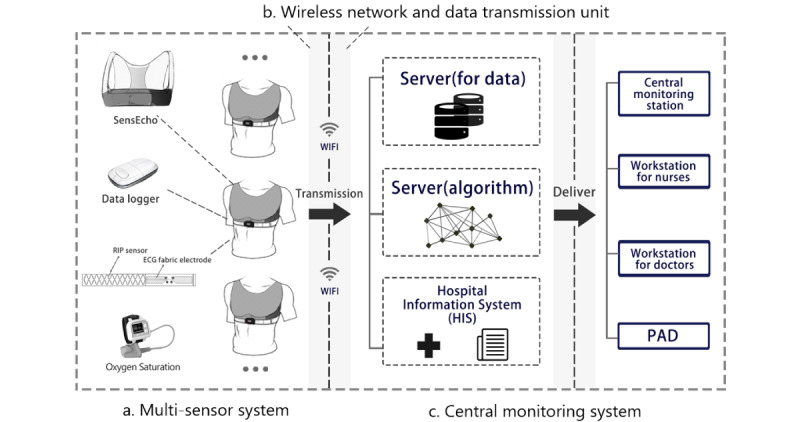
Overview of the SensEcho system.
Patients admitted to the hospital were assessed by a doctor using the system. Continuous monitoring physiological signals were transmitted to the hospital server and the data in numeric format were acquired based on the waveform processing function in Midas. The clinical information was stored separately in the hospital information system. Data from the different sources were linked (Figure 5) using patient_id, a unique identification of patients similar to subject_id in MIMIC III.
Figure 5.
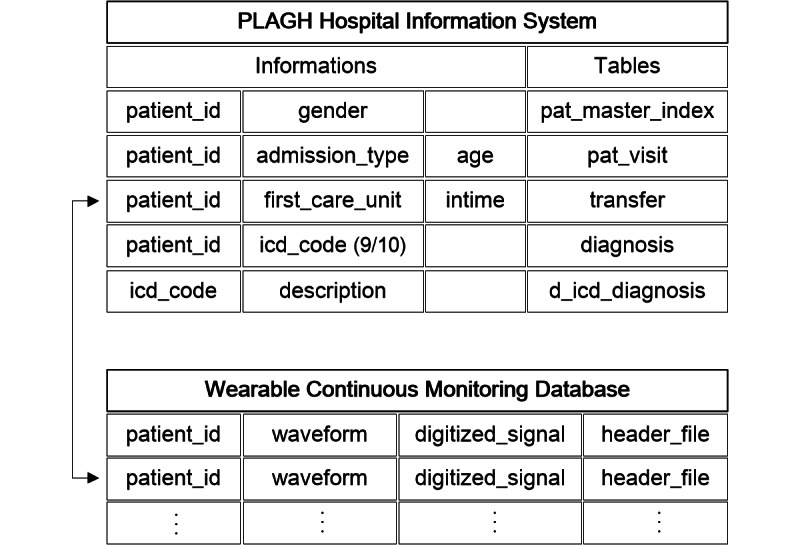
The connection between clinical and waveform information monitored by SensEcho.
Tachycardia Onset Diagnostic Criteria
Diagnostic tachycardia onset criteria were determined by 3 clinical experts from the Emergency Department, the general ward, and surgical ICU. A tachycardia event was defined as any of the following: (1) heart rate above 100 bpm sustained over 30 minutes; (2) heart rate above 130 bpm sustained over 20 minutes; (3) heart rate above 150 bpm sustained over 5 minutes. The initial timepoint meeting of any of these conditions was recognized as tachycardia onset.
Experiments
Data Set
In the ICU environment, we selected 5699 patients with the following criteria: age over 18 years old, admitted to the hospital and ICU for the first time, monitoring data longer than 14 hours with heart rate, respiratory rate, and SpO2 recordings. The size of the observing window was chosen as 2 hours, which was used to extract the statistical features. The negative sample set was built by extracting information in the observing window with a 1-hour sliding step throughout monitoring for patients without tachycardia. The positive sample set was acquired by selecting the same features in the observing window before the occurrence of tachycardia with a forecast range. To balance the ratio of positive and negative samples, we kept extracting positive samples with a 5-minute delay based on the former (for target replication), which is a method used in a previous study [47]. The data were downsampled from per second to per minute by averaging. If more than 30% were null or 0 values of all variables at a certain time, the missing values were filled using the forward interpolation method. We randomly picked the number of negative samples close to the positive samples to further decrease class imbalances. There were 2748 and 2130 negative and positive samples, respectively.
In the general ward, we deployed the wearable grade monitoring system (Figure 6a) in a cardiovascular disease department in January 2018. We collected data from 367 patients for research. The inclusion criteria for monitoring duration was reduced to from 14 hours to 4 hours to take into account patient length of stay. A total of 259 patients were included, and 2300 negative samples and 270 positive samples were extracted. Figure 6b shows a patient wearing a multisensor shirt, and Figure 6c shows an example of a patient encountering tachycardia.
Figure 6.
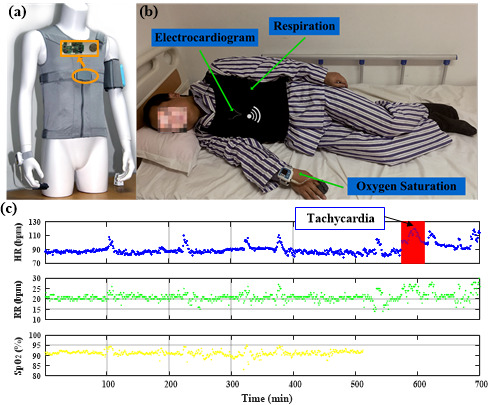
Continuous monitoring using (a) SensEcho system with (b) example of a patient with sensors attached, and (c) sample data. HR: heart rate; RR: respiratory rate; SpO2: blood oxygen saturation.
Developing the Prediction Model
In the early prediction model, developed from the MIMIC-III data set, predictions (forecast ranges) with TOP-Net were explored from 0 hour to 6 hours with a 2-hour interval. A total of 21 statistical features were included (Table 1). The size of sub–observing window and sliding step were individually set to 20 minutes and 5 minutes, respectively. We calculated all statistical values in sub–observing windows, sequentially amalgamated, and fed them into the model. The data set was randomly split to 80% of the training set and 20% of the testing set according to the patient’s hospitalization number. The 5-fold cross-validation together with random search was used to tune the hyperparameters based on the training set considering the sample size [48]. The hidden size was set to 32. We tested learning rates ranging from 1-4 to 1-2 with an interval of 1-4 and training epochs from 5 to 100 with an interval of 10. The best hyperparameters were determined by minimizing validation loss. We retrained the model using the optimal hyperparameters on the training set, and the performance of the model was assessed on the test set.
Table 1.
Statistical features constructed in this study.
| Feature type and name | Feature description | |
| Heart rate (n=10) |
|
|
|
|
hr_mean | Mean heart rate |
|
|
hr_std | Heart rate SD |
|
|
hr_sum | Sum of heart rate |
|
|
hr_slope | Slope of heart rate |
|
|
hr_abs_energy | ƒ1 of heart rate |
|
|
hr_c2 | ƒ3 of heart rate with lag=2 |
|
|
hr_c3 | ƒ3 of heart rate with lag=3 |
|
|
hr_quantiles_01 | 10% quantile of heart rate |
|
|
hr_quantiles_03 | 30% quantile of heart rate |
|
|
hr_quantiles_07 | 70% quantile of heart rate |
| Respiratory rate (n=5) |
|
|
|
|
resp_mean | Mean respiration rate |
|
|
resp_std | Respiration rate SD |
|
|
resp_slope | Slope of respiration rate |
|
|
resp_abs_energy | ƒ1 of respiration rate |
|
|
resp_c3 | ƒ3 of respiration rate with lag=3 |
| SpO2a (n=5) |
|
|
|
|
spo2_mean | Mean SpO2 |
|
|
spo2_std | SD of SpO2 |
|
|
spo2_slope | Slope of SpO2 |
|
|
spo2_c3 | ƒ3 of SpO2 with lag=3 |
|
|
spo2_abs_energy | ƒ1 of SpO2 |
| Together (heart rate, respiratory rate, SpO2) (n=1) |
|
|
|
|
all_autocorrelation | Mean value of ƒ2 using all vital signs with the default l=40 |
aSpO2: blood oxygen saturation.
Comparison With Baseline Models
To further investigate the performance of TOP-Net, we designed subexperiments 1, 2, and 3 to obtain a comprehensive assessment. In subexperiment 1, the model was acquired without considering personal information and bidirection memory functions. That is, LSTM and convolutional neural network models were obtained in a total cohort without considering the personal information of patients. The structure of the LSTM was consistent with that of a BiLSTM, and the convolutional neural network model had 2 convolutional layers. In subexperiment 2, conventional machine learning methods, including extreme gradient boosting [49], multilayer perceptron, and random forest, were compared with TOP-Net with default model parameters. In subexperiment 3, different feature combinations were examined: (1) all vital signs, (2) heart rate, (3) heart rate and respiratory rate, and (4) heart rate and SpO2.
Performance Evaluation Metrics
Prediction performance was measured with 6 metrics: sensitivity, specificity, accuracy, F1 score, precision, and area under the receiver operating characteristic curve (AUROC).
Model Validation and Transfer to the General Ward
The performance of TOP-Net was validated using the data collected in the general ward (small data set obtained within 1 year) by the SensEcho system. A transferrable model suitable for non-ICU patients was acquired by finetuning the ICU scenario model. The model performance was also assessed with the 6 metrics using 5-fold cross-validation due to the small sample size.
Experimental Platform
We utilized PostgreSQL (version 9.6; PostgreSQL Global Development Group) to extract the clinical data. All data processing and analyses, model development, and result visualization was performed with Python (version 3.7.1) and CUDA (version 10.0).
Results
Data Sets
Table 2 shows admission information summary statistics for the study cohorts. The patients’ ages were slightly higher in the ICU cohort and most of them were admitted to the hospital for emergencies. A large proportion of patients were admitted for elective reasons in the cardiovascular disease department of our hospital. Furthermore, a higher proportion of patients had a history of cardiovascular diseases in the general ward.
Table 2.
Study cohorts.
|
|
ICUa cohort (n=5699) | General ward cohort (n=259) | |
| Age (years), median (IQR) | 66.15 (53.97, 77.78) | 61.00 (53.00, 67.50) | |
| Gender, n (%) |
|
|
|
|
|
Female | 3262 (57.2) | 105 (40.5) |
|
|
Male | 2437 (42.8) | 154 (59.5) |
| Admission type, n (%) |
|
|
|
|
|
Elective | 979 (17.2) | 227 (87.6) |
|
|
Emergency | 4550 (79.8) | 32 (12.4) |
|
|
Urgent | 170 (3.0) | —b |
| First care unit, n (%) |
|
|
|
|
|
Coronary care | 1190 (20.9) | — |
|
|
Cardiac surgery recovery | 1118 (19.6) | — |
|
|
Medical ICU | 1501 (26.3) | — |
|
|
Surgical ICU | 1320 (23.2) | — |
|
|
Trauma/surgical ICU | 570 (10.0) | — |
| Cardiovascular diseases, n (%) | 4933 (86.6) | 234 (90.3) | |
aICU: intensive care unit.
bNo data.
Model Performance
Evaluation Based on the ICU Cohort
We leveraged 5-fold cross-validation to select optimal hyperparameters with the training set and assessed the performance of the model on the test set. The hyperparameter values that we selected were learning rate =0.0002, epoch=20, and batch size=64. Figure 7 and Table 3 summarize the results from subexperiment 1 and subexperiment 2. The AUROC and F1 score for TOP-Net were consistently better than those of other models, with the exception of F1 score (TOP-Net’s was slightly lower than that of the LSTM model for 6 hours prediction, though TOP-Net’s sensitivity was slightly higher than of the LSTM at this time).
Figure 7.
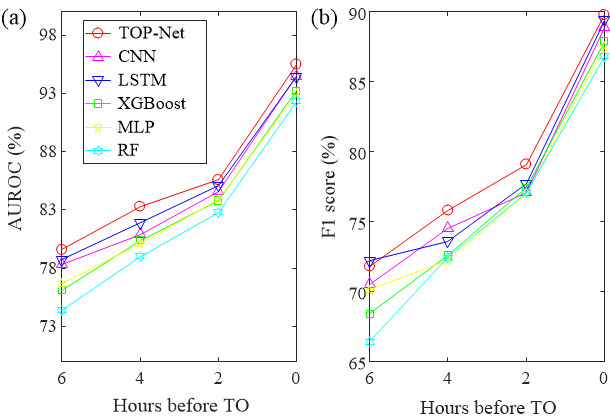
TOP-Net performance: (a) AUROC and (b) F1 score. AUROC: area under the receiver operating characteristic curve; CNN: convolutional neural network; LSTM: long short-term memory; XGBoost: extreme gradient boosting; MLP: multilayer perceptron; RF: random forest; TO: tachycardia onset.
Table 3.
The detailed information of performance comparison (TOP-Net vs other models).
| Forecast range and model | AUROCa (%) (95% CI) | Accuracy (%) | Sensitivity (%) (95% CI) | Specificity (%) (95% CI) | F1 score (%) | Precision (%) | |||||||
| 0 hours |
|
|
|
|
|
|
|||||||
|
|
TOP-Net | 95.5 (94.2-96.8) | 90.1 | 89.1 (81.9-91.8) | 92.1 (85.9-94.3) | 89.8 | 90.5 | ||||||
| CNNb | 94.5 (93.0-96.0) | 89.3 | 85.9 (80.7-89.4) | 92.3 (87.0-95.1) | 88.9 | 92.1 | |||||||
| LSTMc | 94.4 (92.9-96.0) | 89.8 | 88.9 (83.9-91.8) | 90.8 (81.1-93.8) | 89.4 | 89.9 | |||||||
| XGBoostd | 93.2 (91.5-94.9) | 88.3 | 81.9 (75.7-85.6) | 93.0 (87.4-96.0) | 87.9 | 94.9 | |||||||
| MLPe | 93.0 (91.3-94.8) | 87.9 | 85.6 (80.2-88.9) | 89.9 (84.6-93.2) | 87.5 | 89.5 | |||||||
| Random forest | 92.3 (90.5-94.2) | 87.3 | 85.1 (80.2-88.8) | 89.0 (82.1-92.8) | 86.8 | 88.6 | |||||||
| 2 hours |
|
|
|
|
|
|
|||||||
|
|
TOP-Net | 85.6 (83.2-88.0) | 79.6 | 77.6 (70.8-81.3) | 81.6 (74.2-85.1) | 79.1 | 80.6 | ||||||
| CNN | 84.6 (82.1-87.1) | 77.6 | 78.6 (71.3-83.2) | 77.8 (71.2-81.4) | 77.1 | 75.6 | |||||||
| LSTM | 85.1 (82.7-87.5) | 78.2 | 88.6 (81.0-92.0) | 67.4 (56.8-71.5) | 77.7 | 76.8 | |||||||
| XGBoost | 83.8 (81.2-86.3) | 78.0 | 74.5 (66.7-79.1) | 80.9 (73.9-84.5) | 77.4 | 80.5 | |||||||
| MLP | 83.9 (81.4-86.4) | 77.5 | 78.3 (71.3-82.2) | 77.7 (69.9-82.0) | 77.0 | 75.8 | |||||||
| Random forest | 82.8 (80.2-85.4) | 77.7 | 71.5 (63.6-76.6) | 82.3 (76.4-86.0) | 77.1 | 83.7 | |||||||
| 4 hours |
|
|
|
|
|
|
|||||||
|
|
TOP-Net | 83.3 (80.7-85.8) | 76.3 | 83.5 (75.5-85.9) | 72.2 (63.8-74.7) | 75.8 | 69.4 | ||||||
| CNN | 80.9 (78.2-83.7) | 75.2 | 71.5 (63.6-76.3) | 78.8 (70.0-82.5) | 74.5 | 77.8 | |||||||
| LSTM | 81.9 (79.2-84.5) | 74.2 | 73.1 (65.5-77.9) | 76.3 (69.6-80.1) | 73.6 | 74.1 | |||||||
| XGBoost | 80.4 (77.7-83.2) | 73.4 | 68.1 (60.2-72.7) | 78.5 (72.0-82.8) | 72.6 | 77.8 | |||||||
| MLP | 80.1 (77.3-82.8) | 72.9 | 73.9 (66.9-78.7) | 72.0 (65.1-76.3) | 72.2 | 70.6 | |||||||
| Random forest | 79.0 (76.1-81.9) | 73.3 | 64.5 (60.6-71.4) | 79.9 (73.4-84.8) | 72.4 | 82.5 | |||||||
| 6 hours |
|
|
|
|
|
|
|||||||
|
|
TOP-Net | 79.6 (76.8-82.4) | 72.1 | 75.3 (66.3-79.3) | 72.0 (64.5-75.8) | 71.8 | 68.6 | ||||||
| CNN | 78.3 (75.4-81.1) | 70.9 | 79.3 (72.8-83.7) | 64.1 (57.1-69.1) | 70.5 | 63.5 | |||||||
| LSTM | 78.7 (75.9-81.5) | 72.5 | 74.0 (67.0-78.4) | 71.8 (64.1-76.0) | 72.2 | 70.5 | |||||||
| XGBoost | 76.1 (73.1-79.0) | 69.1 | 76.3 (69.5-75.4) | 64.1 (55.1-68.9) | 68.4 | 62.0 | |||||||
| MLP | 76.7 (73.8-79.6) | 70.6 | 71.9 (65.1-76.7) | 69.4 (61.7-74.5) | 70.1 | 68.4 | |||||||
| Random forest | 74.4 (71.4-77.5) | 67.2 | 69.1 (59.0-74.3) | 66.7 (59.3-70.6) | 66.4 | 63.9 | |||||||
aAUROC: area under the receiver operating characteristic curve.
bCNN: convolutional neural network.
cLSTM: long short-term memory.
dXGBoost: extreme gradient boosting.
eMLP: multilayer perceptron.
Although the 95% CI in subexperiment 1 overlaps, TOP-Net has better performance than LSTM and convolutional neural network in each prediction range above 0.5%-1%. Therefore, fusing patient personal information and bidirection memory makes the prediction model more accurate and robust. In subexperiment 2, TOP-Net was consistently superior to the other machine learning models, especially 6 hours before tachycardia onset; TOP-Net performs well (AUROC 0.796, 95% CI 0.768-0.824; sensitivity 0.753, 95% CI 0.663-0.793; specificity 0.720, 95% CI 0.645-0.758; and F1 score 0.718).
In Table 4, the results for models using heart rate (n=10), heart rate and respiratory rate (n=15), heart rate and SpO2 (n=15), and statistical features of all vital signs (n=21) are shown. For 2- to 6-hour forecast ranges the model with all of the features input has the best performance with highest AUROC values. The performance is slightly reduced when inputting heart rate and respiratory rate, or heart rate and SpO2. The performance was the worst when including only heart rate statistical features. The statistical characteristics of heart rate play a dominant role in real-time diagnosis. Furthermore, we employed the extreme gradient boosting algorithm to rank the importance of 21 designed features for a forecast range of 6 hours. The top 8 features (Figure 8) were hr_abs_energy, hr_quantiles_01, hr_c3, hr_c2, hr_quantiles_03, resp_c3, hr_mean, and hr_quantiles_07. The nonlinearity features—hr_c3 and hr_c2 (ƒ3 with lag=3 and lag=2)—were ranked third and fourth, respectively. The respiratory feature resp_c3 was ranked sixth.
Table 4.
Performance of TOP-Net with the different types of features.
| Forecast range and feature type | AUROCa (%) (95% CI) | Accuracy (%) | Sensitivity (%) (95% CI) | Specificity (%) (95% CI) | F1 score (%) | Precision (%) | |||||||
| 0 hours |
|
|
|
|
|
|
|||||||
|
|
All | 95.5 (94.2-96.8) | 90.1 | 89.1 (81.9-91.8) | 92.1 (85.9-94.3) | 89.8 | 90.5 | ||||||
| HRb+SpO2c | 95.2 (93.8-96.6) | 90.4 | 89.4 (84.7-93.1) | 91.9 (85.9-94.1) | 90.1 | 90.8 | |||||||
| HR+RRd | 95.3 (93.9-96.7) | 90.0 | 89.6 (84.7-92.3) | 91.0 (84.8-94.3) | 89.6 | 89.6 | |||||||
| HR | 95.5 (94.2-96.9) | 90.1 | 89.1 (83.9-92.3) | 92.1 (86.5-94.9) | 89.8 | 80.6 | |||||||
| 2 hours |
|
|
|
|
|
|
|||||||
|
|
All | 85.6 (83.2-88.0) | 79.6 | 77.6 (70.8-81.3) | 81.6 (74.2-85.1) | 79.1 | 80.6 | ||||||
| HR+SpO2 | 83.3 (80.8-85.9) | 76.9 | 77.1 (70.6-81.0) | 76.4 (69.4-80.4) | 76.1 | 75.1 | |||||||
| HR+RR | 84.4 (81.9-86.9) | 79.1 | 75.4 (69.1-79.3) | 82.0 (75.3-86.5) | 78.6 | 82.1 | |||||||
| HR | 82.9 (80.3-85.5) | 76.9 | 78.6 (71.8-82.7) | 73.9 (66.7-78.0) | 76.3 | 74.1 | |||||||
| 4 hours |
|
|
|
|
|
|
|||||||
|
|
All | 83.3 (80.7-85.8) | 76.3 | 83.5 (75.5-85.9) | 72.2 (63.8-74.7) | 75.8 | 69.4 | ||||||
| HR+SpO2 | 82.3 (79.6-84.9) | 75.8 | 76.5 (70.0-81.3) | 74.9 (67.6-79.2) | 75.0 | 73.6 | |||||||
| HR+RR | 82.1 (79.5-84.8) | 75.6 | 72.7 (66.4-77.7) | 77.9 (70.0-82.3) | 75.0 | 77.5 | |||||||
| HR | 80.4 (77.6-83.2) | 73.6 | 75.5 (67.2-79.9) | 72.7 (66.0-77.0) | 72.9 | 70.5 | |||||||
| 6 hours |
|
|
|
|
|
|
|||||||
|
|
All | 79.6 (76.8-82.4) | 72.1 | 75.3 (66.3-79.3) | 72.0 (64.5-75.8) | 71.8 | 68.6 | ||||||
| HR+SpO2 | 77.6 (74.7-80.5) | 71.9 | 70.0 (62.6-74.4) | 74.5 (66.5-78.6) | 71.5 | 73.0 | |||||||
| HR+RR | 78.7 (75.8-81.5) | 72.0 | 78.8 (71.6-83.3) | 67.6 (61.2-72.0) | 71.6 | 65.6 | |||||||
| HR | 75.5 (72.5-78.6) | 70.0 | 67.2 (59.5-72.1) | 73.3 (66.9-77.7) | 69.4 | 71.7 | |||||||
aAUROC: area under the receiver operating characteristic curve.
bHR: heart rate.
cSpO2: blood oxygen saturation.
dRR: respiration rate.
Figure 8.
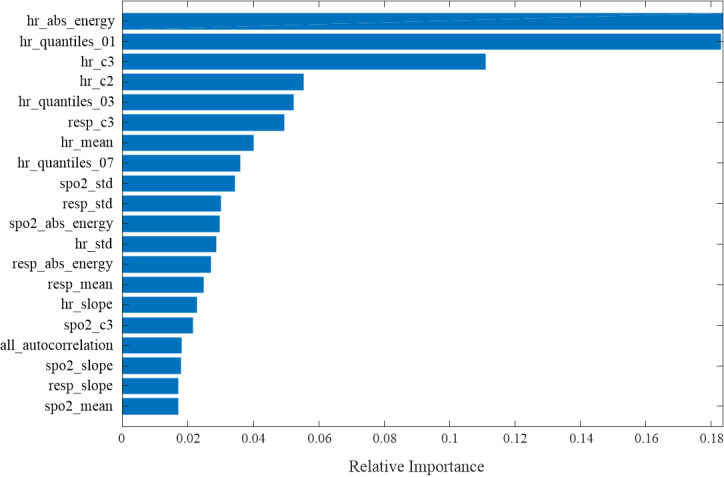
Statistical feature rankings.
Model Validation in the General Ward
We assessed the performance of the model 2 hours before tachycardia onset because the interval between the tachycardia onset and the admission time to the department was short in our scenario of the general ward. Given the limited training data, we used the transfer learning method to finetune the model. The parameters were learning rate=0.0002, epoch=18, and batch size=32. The 5-fold cross-validation was also used to assess the performance and prevent possible overfitting. The retraining results can be seen in Table 5. TOP-Net had a stable outcome and outperformed the other 5 models (AUROC 0.965, accuracy 0.937, sensitivity 0.955, specificity 0.881, F1 score 0.793, and precision 0.680. Compared with the model in ICU, the difference in prediction performance might be caused by the difference in the severity of the patient’s disease. Although convolutional neural network’s F1 score was much higher, its sensitivity, to which clinicians pay more attention, was lower than that of TOP-Net.
Table 5.
TOP-Net performance based on transfer learning in the general ward (2-hour forecast range).
| Model | AUROCa, mean (SD) | Accuracy (%), mean (SD) | Sensitivity (%), mean (SD) | Specificity (%), mean (SD) | F1 score (%), mean (SD) | Precision (%), mean (SD) |
| TOP-Net | 96.5 (1.92) | 93.7 (1.02) | 95.5 (4.85) | 88.1 (4.28) | 79.3 (4.33) | 68.0 (5.99) |
| CNNb | 93.8 (2.02) | 95.3 (1.43) | 90.1 (2.88) | 88.1 (8.4) | 83.8 (5.38) | 78.8 (9.85) |
| LSTMc | 93.2 (1.89) | 92.6 (0.61) | 93.6 (2.76) | 81.5 (5.6) | 73.0 (3.4) | 60.0 (4.89) |
| XGBoostd | 89.9 (2.1) | 92.9 (1.1) | 83.4 (5.2) | 82.6 (7.9) | 73.7 (3.7) | 66.6 (6.8) |
| MLPe | 84.2 (4.1) | 91.0 (0.7) | 75.9 (9.6) | 78.9 (9.1) | 62.6 (2.0) | 54.0 (2.9) |
| Random forest | 87.3 (3.0) | 92.5 (1.0) | 76.6 (5.2) | 86.8 (4.7) | 75.0 (3.7) | 73.8 (4.9) |
aAUROC: area under the receiver operating characteristic curve.
bCNN: convolutional neural network.
cLSTM: long short-term memory.
dXGBoost: extreme gradient boosting.
eMLP: multilayer perceptron.
Figure 9 shows real-time risk scores of tachycardia onset and an example of early tachycardia onset prediction with TOP-Net. In Figure 9a, the patient encountered a tachycardia event after admission from 675 to 725 minutes. The risk probability was assessed every 5 minutes; Figure 9b presents real-time risk. We set the alarm threshold to 0.40 with a trade-off predictive effect of sensitivity and specificity. The risk score begins to rise after the 555th minute, showing that our model can predict the tachycardia event 125 minutes beforehand.
Figure 9.
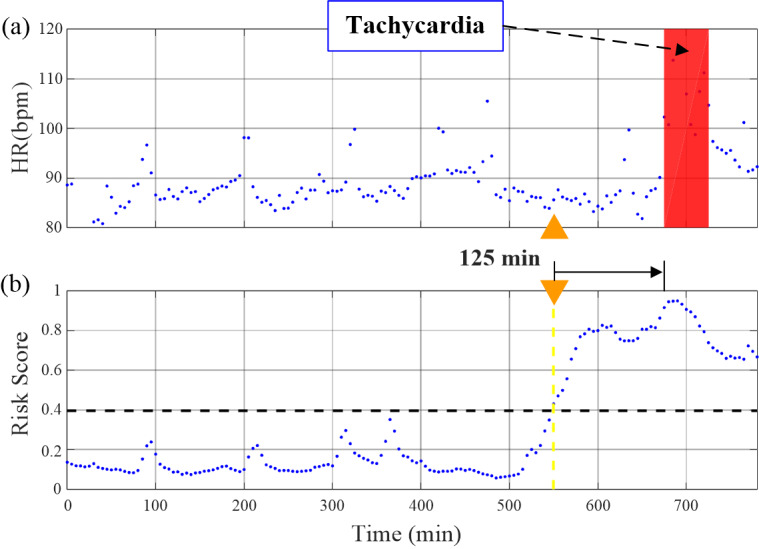
Example of a tachycardia event and our risk score of predicting tachycardia onset. HR: heart rate.
Discussion
General
In this study, we developed a model using a publicly accessible data set and transferred it to a real clinical scenario. The performance of TOP-Net for predicting tachycardia onset 0 to 6 hours in advance was better than that of the baseline models (timeseries prognosis methods and conventional machine learning methods without timing characteristics); TOP-Net outperformed benchmarks of 2 deep learning models, 2 ensemble, and 1 neural network models for predictions 6 hour in advance.
Many continuous monitoring physiological status studies have indicated the deterioration of vital signs occurred more than 6 to 12 hours before serious adverse events [50]. Continuous monitoring, early prediction, and intervention tachycardia can reduce the occurrence of heart failure, cardiac arrest, and death. This paper proposed TOP-Net, a tachycardia onset early prediction model leveraging the BiLSTM algorithm with 8 easily accessible vital signs and personal information. TOP-Net was trained using a large ICU data set and transferred to the general ward scenario with patients monitored by wearable sensors. TOP-Net has been validated to be consistently superior to the baseline models when predicting tachycardia onset from 0 to 6 hours in advance. Including patient characteristics allowed more accurate tachycardia onset prediction than those by other models without this information. Moreover, TOP-Net achieved forecasting tachycardia onset 6 hours beforehand, and the transferred model also performed well in our clinical scenario.
In recent years, some novel models for early risk prediction of adverse events have been developed based on electronic health records or physiological signals. Pan et al [51] utilized a self-correcting deep learning approach to predict whether acute kidney injury would occur in a subsequent 6 hours. Futoma et al [52] developed a multitask Gaussian process recurrent neural network classifier to early detect sepsis achieving 4 hours in advance. Tonekaboni et al [53] trained a convolutional neural network and LSTM fusion model to predict cardiac arrest from physiological signals 24 hours in advance. For tachycardia onset prediction, Lee et al [17] used an artificial neural network–based model and 104 samples to predict ventricular tachycardia 1-hour before occurrence. Yoon et al [54] adopted a random forest–based model and 1494 samples achieving detection 75 minutes in advance. Our real-time prediction model, using the deep neural architecture on 4878 sample sets, demonstrated better and more robust performance than those of multiple baseline models, which included artificial neural network and random forest models, when predicting tachycardia onset 0 to more than 6 hours beforehand.
It is necessary for clinicians to combine a patient’s current symptoms, basic information, and past medical history to diagnose disease severity [55]. For example, the proportion who might have cardiovascular disease and the risk of sustained high heart rate is not the same for patients of different ages with different histories of disease. This useful information is usually recorded in electronic health records. Recently, several researchers have tried to combine the analysis of 2 kinds of materials to represent comprehensive information and improve the performance of the models: Xu et al [56] proposed a model to predict physiological decompensation and length of ICU stay by analyzing ECG and medical records data, and Nemati et al [57] employed high-resolution vital signs and electronic health records to achieve early sepsis prediction. However, little attention has been paid to tachycardia prognosis. In this paper, we integrated electronic health record and biosensor data to accomplish early prediction. The results of subexperiment 1 show that fusing electronic health record information can improve the accuracy of early prediction compared with the LSTM and convolutional neural network models.
Risk prediction is a core task in the artificial intelligence–assisted medical domain. Cardiovascular disease prediction models based on electronic health record analysis have been studied [58-60]. Doctor AI [58] requires diagnosis codes, medication codes, or procedure codes to achieve multilabel predictions including heart failure. Jin et al [60] utilized 1864 diagnostic events to train a sequential model to predict the risk of heart failure but because they were limited by the need to obtain more information, the model cannot be used in hospitals with low information integration or in homes. Deep learning models using ECG signals have also been used for predictive health care tasks [61]. While ECG signals are susceptible to interference from physical artifacts, sensors can obtain heart rate using photoplethysmography instead of ECG signals. Therefore, models based on core vital signs can easily be used and to improve prediction performance. We selected 3 vital signs and 5 types of personal information that can easily be acquired from wearable sensors and hospital information systems, respectively. TOP-Net was developed using a large data set and transferred to our actual demand scenario. The results show that it has the potential to be used in ICU and the general ward, which also can be extended to home use. Table 6 presents a comparison between TOP-Net and other state-of-the-art approaches based on input information, model types, scenario for evaluating the model, sample sizes, and performance.
Table 6.
Review of the performance of related algorithms.
| Reference | Information | Model types | Scenario | Sample sizes | Performance |
| Lee et al 2016 [17] | High-frequency vital signs (1) | Nontemporal, classic machine learning | ICUa | 52 (positive records); 52 (negative records) | 1 hour before ventricular tachycardia: sensitivity 88%; specificity 82%; AUROCb 93% |
| Forkan et al 2017 [16] | High-frequency vital signs (6) | Nontemporal, classic machine learning | ICU | 4893 (positive and negative records) | 1-2 hours before tachycardia onset: accuracy 95.85% |
| Yoon et al 2019 [54] | High-frequency vital signs (3) | Nontemporal, classic machine learning | ICU | 787 (positive records); 707 (negative records) | 75 minutes before tachycardia onset: accuracy 84.7%-78.2%; AUROC 92.1%-84.2 % |
| TOP-Net | High-frequency vital signs (3) and electronic health record data (5) | Temporal, deep learning | ICU and the general ward | 2130+270 (positive records); 2748+2300 (negative records) | 6 hours before tachycardia onset: accuracy 72.1%; AUROC 79.6% |
aICU: intensive care unit.
bAUROC: area under the receiver operating characteristic curve.
Limitations
This study had some limitations. Because SensEcho was deployed in the clinic for only 1 year after our research project began, the limited data collected prevented us from directly developing a general ward model. Moreover, interventions such as beta-blocker medication may affect the occurrence of tachycardia onset and cause it to not be captured by the input features. Electronic health records contain rich information such as laboratory tests, clinical orders, and nursing notes that can characterize a patient’s health status and depict the trajectory of diseases. Further studies involving the integration of multivariate timeseries from electronic health records are expected to improve the prediction performance of tachycardia onset, and more data from the general ward for TOP-Net performance evaluation are required.
Conclusions
TOP-Net for real-time evaluation and early prediction of the risk of tachycardia onset, which made it possible to achieve an early forecast of tachycardia onset 6 hours in advance with clinically acceptable performance. TOP-Net was assessed using 6 metrics, 3 subexperiments, different prediction times from 0 to 6 hours. The comparison between the TOP-Net and the other 5 approaches (2 deep learning models, 2 ensemble models, and 1 artificial neural network model) showed that TOP-Net was superior to the other models. The model with personal information from electronic health records had better performance than those without. The easily accessible input data of the model (3 vital signs and 5 types of personal information) and the good performance of the transferred model in the general ward indicated the early prediction of tachycardia onset using wearable sensors is possible in hospitals or houses.
Acknowledgments
We thank Yunkai Yu (Beijing Institute of Technology) for helping us train models and arrange data. We also thank Dr Alistair Johnson and Dr Tom Pollard (Massachusetts Institute of Technology) for useful suggestions and comments. This project was funded by National Key Research and Development Program (2016YFC1304305), National Natural Science Foundation of China (61471398), Beijing Municipal Science and Technology Project (Z181100001918023), Big Data Research and Development Project of Chinese PLA general hospital (2018MBD-009, 2018MBD-058) and in part by the China Education and Research Network Innovation Project (NGII20160701).
Abbreviations
- AUROC
area under the receiver operating characteristic curve
- BiLSTM
bidirectional long short-term memory
- ECG
electrocardiogram
- ICU
intensive care unit
- LSTM
long short-term memory
- MIMIC-III
Medical Information Mart for Intensive Care III
- SpO2
blood oxygen saturation
Footnotes
Authors' Contributions: This work was performed during ZY's internship at Beijing SensEcho Science & Technology Co Ltd as a PhD candidate at University of California. All authors came up with the study concept. XL, TL, and ZZ contributed to collecting data, designing models, and drafting the manuscript. P-CK, HX, and PL contributed to further analyzing and interpreting data. P-CK, ZY, KL, and YLN contributed to cleaning data and revising the manuscript. WY and DL contributed to statistical analysis. All coauthors had the opportunity to comment on the manuscript before submission and approved the final version for submission.
Conflicts of Interest: None declared.
References
- 1.Awtry E, Jeon C, Ware MG. Blueprints Cardiology. United States: Lippincott Williams & Wilkins; 2006. pp. 1–20. [Google Scholar]
- 2.Arzbaecher R, Bump T, Jenkins J, Glick K, Munkenbeck F, Brown J, Nandhakumar N. Automatic tachycardia recognition. Pacing Clin Electrophysiol. 1984 May;7(3 Pt 2):541–7. doi: 10.1111/j.1540-8159.1984.tb04948.x. [DOI] [PubMed] [Google Scholar]
- 3.Au-Yeung WM, Reinhall PG, Bardy GH, Brunton SL. Development and validation of warning system of ventricular tachyarrhythmia in patients with heart failure with heart rate variability data. PLoS One. 2018 Nov 14;13(11):e0207215. doi: 10.1371/journal.pone.0207215. https://dx.plos.org/10.1371/journal.pone.0207215. [DOI] [PMC free article] [PubMed] [Google Scholar]
- 4.Srinivasan NT, Schilling RJ. Sudden cardiac death and arrhythmias. Arrhythm Electrophysiol Rev. 2018;7(2):111. doi: 10.15420/aer.2018:15:2. [DOI] [PMC free article] [PubMed] [Google Scholar]
- 5.Wang TJ, Larson MG, Levy D, Vasan RS, Leip EP, Wolf PA, D’Agostino RB, Murabito JM, Kannel WB, Benjamin EJ. Temporal relations of atrial fibrillation and congestive heart failure and their joint influence on mortality. Circulation. 2003 Jun 17;107(23):2920–2925. doi: 10.1161/01.cir.0000072767.89944.6e. [DOI] [PubMed] [Google Scholar]
- 6.Miyasaka Y, Barnes ME, Bailey KR, Cha SS, Gersh BJ, Seward JB, Tsang TS. Mortality trends in patients diagnosed with first atrial fibrillation: a 21-year community-based study. J Am Coll Cardiol. 2007 Mar 06;49(9):986–92. doi: 10.1016/j.jacc.2006.10.062. https://linkinghub.elsevier.com/retrieve/pii/S0735-1097(06)03025-7. [DOI] [PubMed] [Google Scholar]
- 7.Gardner-Thorpe J, Love N, Wrightson J, Walsh S, Keeling N. The value of Modified Early Warning Score (MEWS) in surgical in-patients: a prospective observational study. Ann R Coll Surg Engl. 2006 Oct;88(6):571–575. doi: 10.1308/003588406x130615. [DOI] [PMC free article] [PubMed] [Google Scholar]
- 8.Gotlibovych I, Crawford S, Goyal D. End-to-end deep learning from raw sensor data: atrial fibrillation detection using wearables. arXiv. Preprint posted online on July 27, 2018 https://arxiv.org/abs/1807.10707. [Google Scholar]
- 9.Dunn J, Runge R, Snyder M. Wearables and the medical revolution. Per Med. 2018 Sep;15(5):429–448. doi: 10.2217/pme-2018-0044. https://www.futuremedicine.com/doi/abs/10.2217/pme-2018-0044?url_ver=Z39.88-2003&rfr_id=ori:rid:crossref.org&rfr_dat=cr_pub%3dpubmed. [DOI] [PMC free article] [PubMed] [Google Scholar]
- 10.Kroll RR, McKenzie ED, Boyd JG, Sheth P, Howes D, Wood M, Maslove DM, WEARable Information Technology for hospital INpatients (WEARIT-IN) study group Use of wearable devices for post-discharge monitoring of ICU patients: a feasibility study. J Intensive Care. 2017 Nov 21;5(1):64–8. doi: 10.1186/s40560-017-0261-9. https://jintensivecare.biomedcentral.com/articles/10.1186/s40560-017-0261-9. [DOI] [PMC free article] [PubMed] [Google Scholar]
- 11.Alam N, Hobbelink E, van Tienhoven A, van de Ven P, Jansma E, Nanayakkara P. The impact of the use of the Early Warning Score (EWS) on patient outcomes: a systematic review. Resuscitation. 2014 May;85(5):587–94. doi: 10.1016/j.resuscitation.2014.01.013. [DOI] [PubMed] [Google Scholar]
- 12.Henry KE, Hager DN, Pronovost PJ, Saria S. A targeted real-time early warning score (TREWScore) for septic shock. Sci Transl Med. 2015 Aug 05;7(299):299ra122–299ra122. doi: 10.1126/scitranslmed.aab3719. [DOI] [PubMed] [Google Scholar]
- 13.Desautels T, Calvert J, Hoffman J, Jay M, Kerem Y, Shieh L, Shimabukuro D, Chettipally U, Feldman MD, Barton C, Wales DJ, Das R. Prediction of sepsis in the intensive care unit with minimal electronic health record data: a machine learning approach. JMIR Med Inform. 2016 Sep 30;4(3):e28. doi: 10.2196/medinform.5909. https://medinform.jmir.org/2016/3/e28/ [DOI] [PMC free article] [PubMed] [Google Scholar]
- 14.Chen JH, Asch SM. Machine learning and prediction in medicine — beyond the peak of inflated expectations. N Engl J Med. 2017 Jun 29;376(26):2507–2509. doi: 10.1056/nejmp1702071. [DOI] [PMC free article] [PubMed] [Google Scholar]
- 15.Forkan ARM, Khalil I. A probabilistic model for early prediction of abnormal clinical events using vital sign correlations in home-based monitoring. 2016 IEEE International Conference on Pervasive Computing and Communications; March 14-19; Sydney, Australia. 2016. pp. 1–9. [DOI] [Google Scholar]
- 16.Forkan ARM, Khalil I, Atiquzzaman M. ViSiBiD: a learning model for early discovery and real-time prediction of severe clinical events using vital signs as big data. Computer Networks. 2017 Feb;113:244–257. doi: 10.1016/j.comnet.2016.12.019. [DOI] [Google Scholar]
- 17.Lee H, Shin S, Seo M, Nam G, Joo S. Prediction of ventricular tachycardia one hour before occurrence using artificial neural networks. Sci Rep. 2016 Aug 26;6(1):32390–7. doi: 10.1038/srep32390. doi: 10.1038/srep32390. [DOI] [PMC free article] [PubMed] [Google Scholar]
- 18.Szep J, Hariri S, Khalpey Z. Predictive diagnosis of fatal heart rhythms using wearables. 2019 Spring Simulation Conference; April 29-May 2; Tucson, Arizona. 2019. pp. 1–10. [DOI] [Google Scholar]
- 19.LeCun Y, Bengio Y, Hinton G. Deep learning. Nature. 2015 May 28;521(7553):436–44. doi: 10.1038/nature14539. [DOI] [PubMed] [Google Scholar]
- 20.Hannun AY, Rajpurkar P, Haghpanahi M, Tison GH, Bourn C, Turakhia MP, Ng AY. Cardiologist-level arrhythmia detection and classification in ambulatory electrocardiograms using a deep neural network. Nat Med. 2019 Jan 7;25(1):65–69. doi: 10.1038/s41591-018-0268-3. http://europepmc.org/abstract/MED/30617320. [DOI] [PMC free article] [PubMed] [Google Scholar]
- 21.Shickel B, Tighe PJ, Bihorac A, Rashidi P. Deep EHR: a survey of recent advances in deep learning techniques for electronic health record (EHR) analysis. IEEE J Biomed Health Inform. 2018 Sep;22(5):1589–1604. doi: 10.1109/jbhi.2017.2767063. [DOI] [PMC free article] [PubMed] [Google Scholar]
- 22.Ghassemi M, Pimentel MAF, Naumann T. A multivariate timeseries modeling approach to severity of illness assessment and forecasting in ICU with sparse, heterogeneous clinical data. Proceedings of the Twenty-Ninth AAAI Conference on Artificial Intelligence; January 25-30; Austin, Texas. 2015. [PMC free article] [PubMed] [Google Scholar]
- 23.Moody G, Mark R. The impact of the MIT-BIH arrhythmia database. IEEE Eng Med Biol Mag. 2001;20(3):45–50. doi: 10.1109/51.932724. [DOI] [PubMed] [Google Scholar]
- 24.Johnson AE, Pollard TJ, Shen L, Lehman LH, Feng M, Ghassemi M, Moody B, Szolovits P, Celi Leo Anthony, Mark RG. MIMIC-III, a freely accessible critical care database. Sci Data. 2016 May 24;3(1):160035–9. doi: 10.1038/sdata.2016.35. doi: 10.1038/sdata.2016.35. [DOI] [PMC free article] [PubMed] [Google Scholar]
- 25.Bizopoulos P, Koutsouris D. Deep learning in cardiology. IEEE Rev Biomed Eng. 2019;12:168–193. doi: 10.1109/rbme.2018.2885714. [DOI] [PubMed] [Google Scholar]
- 26.Hannun Awni Y, Rajpurkar Pranav, Haghpanahi M, Tison Geoffrey H, Bourn Codie, Turakhia Mintu P, Ng Andrew Y. Cardiologist-level arrhythmia detection and classification in ambulatory electrocardiograms using a deep neural network. Nat Med. 2019 Jan;25(1):65–69. doi: 10.1038/s41591-018-0268-3. http://europepmc.org/abstract/MED/30617320. [DOI] [PMC free article] [PubMed] [Google Scholar]
- 27.Shashikumar SP, Shah AJ, Li Q. A deep learning approach to monitoring and detecting atrial fibrillation using wearable technology. IEEE EMBS International Conference on Biomedical & Health Informatics (BHI); February 16-19; Orlando, Florida. 2017. pp. 141–144. [DOI] [Google Scholar]
- 28.Teijeiro T, García CA, Castro D. Arrhythmia classification from the abductive interpretation of short single-lead ECG records. Computing in Cardiology; September 24-27; Rennes, France. 2017. pp. 1–4. [DOI] [Google Scholar]
- 29.Cho J, Kim Y, Lee M. Prediction to atrial fibrillation using deep convolutional neural networks. In: Rekik I, Unal G, Adeli E, Park S, editors. Predictive Intelligence in Medicine. Cham: Springer; 2018. Sep 16, pp. 164–171. [Google Scholar]
- 30.Krittanawong C, Zhang H, Wang Z, Aydar M, Kitai T. Artificial intelligence in precision cardiovascular medicine. J Am Coll Cardiol. 2017 May 30;69(21):2657–2664. doi: 10.1016/j.jacc.2017.03.571. https://linkinghub.elsevier.com/retrieve/pii/S0735-1097(17)36845-6. [DOI] [PubMed] [Google Scholar]
- 31.Rodgers JL, Jones J, Bolleddu SI, Vanthenapalli S, Rodgers LE, Shah K, Karia K, Panguluri SK. Cardiovascular risks associated with gender and aging. J Cardiovasc Dev Dis. 2019 Apr 27;6(2):19. doi: 10.3390/jcdd6020019. https://www.mdpi.com/resolver?pii=jcdd6020019. [DOI] [PMC free article] [PubMed] [Google Scholar]
- 32.Carter P, Lagan J, Fortune C, Bhatt DL, Vestbo J, Niven R, Chaudhuri N, Schelbert EB, Potluri R, Miller CA. Association of cardiovascular disease with respiratory disease. J Am Coll Cardiol. 2019 May 07;73(17):2166–2177. doi: 10.1016/j.jacc.2018.11.063. https://linkinghub.elsevier.com/retrieve/pii/S0735-1097(19)30457-7. [DOI] [PubMed] [Google Scholar]
- 33.Cretikos MA, Bellomo R, Hillman K, Chen J, Finfer S, Flabouris A. Respiratory rate: the neglected vital sign. Med J Aust. 2008 Jun 02;188(11):657–9. doi: 10.5694/j.1326-5377.2008.tb01825.x. [DOI] [PubMed] [Google Scholar]
- 34.Masip J, Gayà M, Páez J, Betbesé A, Vecilla F, Manresa R, Ruíz P. Pulse oximetry in the diagnosis of acute heart failure. Revista Española de Cardiología (English Edition) 2012 Oct;65(10):879–884. doi: 10.1016/j.rec.2012.02.021. [DOI] [PubMed] [Google Scholar]
- 35.Lan K, Liu X, Xu H. DeePTOP: personalized tachycardia onset prediction using bi-directional LSTM in wearable embedded systems. International Conference on Embedded Wireless Systems and Networks; February 25-27; Beijing, China. 2019. pp. 216–217. [Google Scholar]
- 36.Goldberger AL, Amaral LAN, Glass L, Hausdorff JM, Ivanov PC, Mark RG, Mietus JE, Moody GB, Peng C, Stanley HE. PhysioBank, PhysioToolkit, and PhysioNet: components of a new research resource for complex physiologic signals. Circulation. 2000 Jun 13;101(23):E215–20. doi: 10.1161/01.cir.101.23.e215. [DOI] [PubMed] [Google Scholar]
- 37.TOP-Net. GitHub. [2021-04-09]. https://github.com/liuxiaoliXRZS/TOP-Net.
- 38.Xu H, Li P, Yang Z, Liu X, Wang Z, Yan W, He M, Chu W, She Y, Li Y, Cao D, Yan M, Zhang Z. Construction and application of a medical-grade wireless monitoring system for physiological signals at general wards. J Med Syst. 2020 Sep 04;44(10):182–15. doi: 10.1007/s10916-020-01653-z. http://europepmc.org/abstract/MED/32885290. [DOI] [PMC free article] [PubMed] [Google Scholar]
- 39.Schuster M, Paliwal K. Bidirectional recurrent neural networks. IEEE Trans Signal Process. 1997;45(11):2673–2681. doi: 10.1109/78.650093. [DOI] [Google Scholar]
- 40.Xiao. Choi Edward, Sun Jimeng. Opportunities and challenges in developing deep learning models using electronic health records data: a systematic review. J Am Med Inform Assoc. 2018 Oct 01;25(10):1419–1428. doi: 10.1093/jamia/ocy068. http://europepmc.org/abstract/MED/29893864. [DOI] [PMC free article] [PubMed] [Google Scholar]
- 41.Shi X, Chen Z, Wang H, Yeung DY, Wong WK, Woo WC. Convolutional LSTM network: a machine learning approach for precipitation nowcasting. Advances in neural information processing systems; December 7-12; Montreal, Canada. 2015. pp. 802–810. https://papers.nips.cc/paper/2015/file/07563a3fe3bbe7e3ba84431ad9d055af-Paper.pdf. [Google Scholar]
- 42.Bence JR. Analysis of short time series: correcting for autocorrelation. Ecology. 1995;76(2):628–639. doi: 10.2307/1941218. [DOI] [Google Scholar]
- 43.Schreiber T, Schmitz A. Discrimination power of measures for nonlinearity in a time series. Phys Rev E. 1997 May 1;55(5):5443–5447. doi: 10.1103/physreve.55.5443. [DOI] [Google Scholar]
- 44.Li P, Yang Z, Yan W, Yan M, He M, Yuan Q, Lan K, Zheng J, Liu T, Cao D, Zhang Z. Mobicardio: a clinical-grade mobile health system for cardiovascular disease management. IEEE International Conference on Healthcare Informatics; June 10-13; Xi'an, China. 2019. pp. 1–6. [DOI] [Google Scholar]
- 45.Zhang Y, Yang Z, Zhang Z, Liu X, Cao D, Li P, Zheng K, Lan J. Automated sleep period estimation in wearable multi-sensor systems. Proceedings of the 16th ACM Conference on Embedded Networked Sensor Systems; ACM SenSys 2018; November 4-7; Shenzhen, China. 2018. pp. 305–306. [DOI] [Google Scholar]
- 46.Zhang Y, Yang Z, Lan K, Liu X, Zhang Z, Li P, Cao D, Xheng J, Pan J. Sleep stage classification using bidirectional lstm in wearable multi-sensor systems. IEEE Conference on Computer Communications Workshops; April 29-May 2; Paris. 2019. [DOI] [Google Scholar]
- 47.Futoma J, Hariharan S, Heller K, Sendak M, Brajer N, Clement M, Bedoya A, O'Brien C. An improved multi-output gaussian process RNN with real-time validation for early sepsis detection. Proceedings of the 2nd Machine Learning for Healthcare Conference; Machine Learning for Healthcare Conference; August 18-19; Boston, Massachusetts. 2017. pp. 243–254. http://proceedings.mlr.press/v68/futoma17a/futoma17a.pdf. [Google Scholar]
- 48.Ge Wendong, Huh Jin-Won, Park Yu Rang, Lee Jae-Ho, Kim Young-Hak, Turchin Alexander. An interpretable ICU mortality prediction model based on logistic regression and recurrent neural networks with LSTM units. AMIA Annu Symp Proc. 2018;2018:460–469. http://europepmc.org/abstract/MED/30815086. [PMC free article] [PubMed] [Google Scholar]
- 49.Chen T, Carlos G. XGBoost: a scalable tree boosting system. Proceedings of the 22nd ACM SIGKDD International Conference on Knowledge Discovery and Data Mining 2016; International Conference on Knowledge Discovery and Data Mining; August 13-17; San Francisco, California. 2016. pp. 785–794. [DOI] [Google Scholar]
- 50.Welch J, Kanter B, Skora B, McCombie S, Henry I, McCombie D, Kennedy R, Soller B. Multi-parameter vital sign database to assist in alarm optimization for general care units. J Clin Monit Comput. 2016 Dec 6;30(6):895–900. doi: 10.1007/s10877-015-9790-8. http://europepmc.org/abstract/MED/26439830. [DOI] [PMC free article] [PubMed] [Google Scholar]
- 51.Pan Z, Du H, Ngiam KY, Wang F, Shum P, Feng M. A self-correcting deep learning approach to predict acute conditions in critical care. arXiv. Preprint posted online on July 14, 2019 https://arxiv.org/abs/1901.04364. [Google Scholar]
- 52.Futoma J, Harihan S, Heller K. Learning to detect sepsis with a multitask Gaussian process RNN classifier. 34th International Conference on Machine Learning; August 6-11; Sydney, Australia. 2017. [Google Scholar]
- 53.Tonekaboni S, Mazwi M, Laussen P, Eytan D, Greer R, Goodfellow SD, Goodwin A, Brudno M, Goldenberg A. Prediction of cardiac arrest from physiological signals in the pediatric ICU. Proceedings of the 3rd Machine Learning for Healthcare Conference; 3rd Machine Learning for Healthcare; August 16-18; Stanford, California. 2018. pp. 534–550. [Google Scholar]
- 54.Yoon JH, Mu L, Chen L, Dubrawski A, Hravnak M, Pinsky MR, Clermont G. Predicting tachycardia as a surrogate for instability in the intensive care unit. J Clin Monit Comput. 2019 Dec 14;33(6):973–985. doi: 10.1007/s10877-019-00277-0. http://europepmc.org/abstract/MED/30767136. [DOI] [PMC free article] [PubMed] [Google Scholar]
- 55.Ma F, Gao J, Suo Q, You Q, Zhou J, Zhang A. Risk prediction on electronic health records with prior medical knowledge. Proceedings of the 24th ACM SIGKDD International Conference on Knowledge Discovery & Data Mining; International Conference on Knowledge Discovery & Data Mining; August 19-20; London, United Kingdom. 2018. pp. 1910–1919. [DOI] [Google Scholar]
- 56.Xu Y, Biswal S, Deshpande SR, Maher KO, Sun J. RAIM: Recurrent attentive and intensive model of multimodal patient monitoring data. Proceedings of the 24th ACM SIGKDD International Conference on Knowledge Discovery & Data Mining; International Conference on Knowledge Discovery & Data Mining; August 19-20; London, United Kingdom. 2018. pp. 2565–2573. [DOI] [Google Scholar]
- 57.Nemati S, Holder A, Razmi F, Stanley MD, Clifford GD, Buchman TG. An interpretable machine learning model for accurate prediction of sepsis in the ICU. Crit Care Med. 2018 Apr;46(4):547–553. doi: 10.1097/CCM.0000000000002936. http://europepmc.org/abstract/MED/29286945. [DOI] [PMC free article] [PubMed] [Google Scholar]
- 58.Choi E, Bahadori Mohammad Taha, Schuetz Andy, Stewart Walter F, Sun Jimeng. Doctor AI: predicting clinical events via recurrent neural networks. JMLR Workshop Conf Proc. 2016 Aug;56:301–318. http://europepmc.org/abstract/MED/28286600. [PMC free article] [PubMed] [Google Scholar]
- 59.Choi E, Schuetz Andy, Stewart Walter F, Sun Jimeng. Using recurrent neural network models for early detection of heart failure onset. J Am Med Inform Assoc. 2017 Mar 01;24(2):361–370. doi: 10.1093/jamia/ocw112. http://europepmc.org/abstract/MED/27521897. [DOI] [PMC free article] [PubMed] [Google Scholar]
- 60.Jin B, Che C, Liu Z, Zhang S, Yin X, Wei X. Predicting the risk of heart failure with EHR sequential data modeling. IEEE Access. 2018;6:9256–9261. doi: 10.1109/access.2017.2789324. [DOI] [Google Scholar]
- 61.Hong S, Zhou Y, Shang J, Xiao C, Sun J. Opportunities and challenges of deep learning methods for electrocardiogram data: a systematic review. Comput Biol Med. 2020 Jul;122:103801. doi: 10.1016/j.compbiomed.2020.103801. [DOI] [PubMed] [Google Scholar]