Abstract
Ovarian cancer is one of the most common cancers worldwide, and is associated with a prior diagnosis of endometriosis in several cases. Our aim was to correlate genetic and methylation profile of ovarian endometrioid ovarian cancer and endometriosis patients. We evaluated the genetic profile of 50 ovarian endometriosis and 20 ovarian endometrioid carcinoma samples using next generation sequencing technology. In addition, the DNA methylation profile was evaluated for both cohorts of patients. We observed several mutated genes that were common for both types of patients, but we also identified mutated genes that were characteristic for each group: JAK3, KRAS and RB1 for endometriosis; and ATM, BRAF, CDH1, EGFR, NRAS, RET and SMO for ovarian endometrioid cancer. Also we idenfied genes that are highly methylated only in endometriosis samples (PYCARD, RARB, RB1, IL2, CFTR, CD44 and CDH13) and MLH3 gene was methylated only in endometrioid ovarian carcinoma samples. Also, BRCA1, CADM1, PAX6 and PAH genes are mainly methylated in endometrioid ovarian carcinoma patients. We identified a correlation for the cancer group between tumor stage, copy number aberrations and the presence of metastases; more specifically, the presence of BRCA1 pathogenic variants was correlated with tumor differentiation degree, TP53 variants and copy number aberrations. This study was able to demonstrate the presence of similar pathways being altered in both endometriosis and ovarian endometrioid carcinoma, which could mean that a diagnosis of endometriosis could be an early marker for cancer diagnosis. In addition, we showed that GATA2 hypomethylation, ATM hypermethylation, CREM hypomethylation, higher tumor differentiation degree or higher tumor stage is associated with a poor prognosis in patients with ovarian endometrioid carcinoma.
Keywords: Endometriosis, ovarian endometrioid carcinoma, next-generation sequencing, methylation profile, BRCA1/2
Introduction
Endometriosis is a benign disease accompanied by chronic inflammation and pain. Ten to fifteen percent of women at reproductive age are affected by endometriosis. To date, no cure has been found for this disease and, in some cases, endometriosis can be transformed in endometrial cancer [1,2]. In addition, a pre-existing diagnosis of ovarian cists or endometriosis has been shown to be associated with a higher risk of developing ovarian cancer [3]. Endometriosis is clinically defined as the presence of endometrial-like tissue, including glands and stroma, outside of the uterus in anatomically ectopic locations. It is an estrogen dependent disease and is mainly localized in the peritoneum, uterus and ovaries [4]. Association of endometriosis and ovarian cancer was demonstrated by several studies, and they have demonstrated that the two main subtypes of ovarian carcinoma that can be developed from endometriosis are endometrioid and clear cell [5-8].
Ovarian cancer is the seventh diagnosed type of cancer and the fifth cause of death by cancer in Europe [9]. Worldwide, ovarian cancer is the eighth most diagnosed type of cancer and the eighth cause of death by cancer [10]. Ovarian endometrioid carcinoma is diagnosed in 18-20% of women affected by ovarian cancer and it has been shown that this particular ovarian cancer subtype is correlated with a preexisting endometriosis [11,12]. Epithelial ovarian cancer is classified in several subtypes, with ovarian serous carcinoma being the most common (60%), followed by ovarian endometrioid carcinoma (10-20%), ovarian clear cell carcinoma (5%) and mucinous carcinoma (<5%) [13]. Even though most ovarian cancers are sporadic, 5-10% of all ovarian cancer patients are clinically diagnosed with an inherited disease. The inherited ovarian cancers are generally correlated with germline pathogenic variants, located in the BRCA1 and BRCA2 genes [14]. Ovarian cancer and each of its subtypes are associated with alterations in different genes, either variants or expression deregulations [15]. However, it is important to note that these alterations do not represent all the factors needed for cancer progression and metastasis. There are also different epigenetic events that contribute to the development and progression of ovarian cancer, making them desirable for the targeted treatment of this disease [16]. Another important aspect is the reversibility of the epigenetic alterations. One of the most studied epigenetic alterations, which showed promising results in both diagnosis and treatment of ovarian cancer, is DNA methylation [17].
In the present study, we tried to correlate the genetic profile of endometriosis patients with the ovarian endometrioid carcinoma ones, by investigating their BRCA1/2 status, DNA methylation and gene variant profiles identified in a specific subset of genes correlated with cancer.
Materials and methods
Patient cohorts
This study included 50 patients with ovarian endometriosis and 20 patients with ovarian endometrioid carcinoma. The patients were diagnosed and treated at the Oncology Institute “Prof. Dr. Ion Chiricuta” Cluj-Napoca between the years 2013 and 2015. The patients with endometriosis had a mean age of 35.8, with an age range of 22-51 years old. The clinical data of the patients with endometrioid ovarian carcinoma included in the study are presented in Table 1. All patients were provided with comprehensive details about the study and signed an informed consent. The study was approved by the Ethical Committee of the “Iuliu Hatieganu” University of Medicine and Pharmacy-Cluj-Napoca no. 74/16.02.2015, and by the Ethical Committee of The Oncology Institute “Prof. Dr. Ion Chiricuta” no. 64/10.03.2017, this being a retrospective study. All the pathological samples were reviewed by another pathologist and macro-dissection was done on each sample.
Table 1.
Clinical data of the ovarian endometrioid carcinoma patients included in the study
| No of patients-ovarian endometrioid carcinoma n=20 (%) | ||
|---|---|---|
| Age | Median | 59.4 |
| range | 44-78 | |
| Differentiation grade | G1 | 1 (5%) |
| G2 | 6 (30%) | |
| G3 | 6 (30%) | |
| Unavailable | 3 (15%) | |
| Tumor stage | T1 | 7 (35%) |
| T2 | 3 (15%) | |
| T3 | 7 (35%) | |
| NA | 3 (15%) | |
| Lymph nodes | N0 | 3 (15%) |
| N1 | 1 (5%) | |
| NX | 13 (65%) | |
| Unavailable | 3 (15%) | |
| Metastasis | 13 (65%) | |
| Deceased | 8 (40%) | |
| Treatment | Paclitaxel + carboplatin | 13 (65%) |
| Doxorubicina + cisplatin | 1 (5%) | |
| Carboplatin | 1 (5%) | |
| unavailable | 5 (25%) |
DNA extraction
DNA was extracted from formalin fixed paraffin embedded tissue (FFPE) and fresh frozen tissue using the Purelink Genomic DNA mini kit (Invitrogen), using the manufacturer’s protocol. The concentration and quality of DNA was evaluated using NanoDrop (ThermoFischer). The concentrations were between 28.5-801.1 ng/µl, with a 260/280 ratio between 1.62 and 1.82, and the 260/230 ratio between 1.26 and 2.27.
Next generation sequencing (NGS)
Next generation sequencing experiments were done using a quantity of 10 ng of DNA for each sample. We used two primer panels, namely the Ion Ampliseq cancer panel pool and Ampliseq Community BRCA 1_BRCA2 primer kit from Life Technologies. The Ion Ampliseq cancer panel contains primer pairs for 190 amplicons of 46 oncogenes and tumor suppressor genes and covers 739 COSMIC variants in 604 loci, providing 97% coverage. The Ion Ampliseq Community BRCA1_BRCA2 primer kit consists of primer pairs for 167 amplicons that cover the coding regions of both BRCA1 and BRCA2 genes. The sequencing libraries and the actual sequencing process were conducted according to the protocol described in our previous paper [18].
NGS data analysis
For signal processing, base calling and sequence alignment, we used the Torrent Suite V4.4 software (Life Technologies), and sequences were aligned to the Human Genome Build 19 (hg19). We used the variant Caller 4.4.0.6 plug-in for detecting variants, with Target Regions settings specific for the two AmpliSeq panels. For annotations, we transferred the VCF files generated for each sample to the Ion Reporter 4.6 software, and used the following filters: p value ≤ 0.05, coverage ≥ 500 and frequency ≥ 10.
Mutation validation
For the validation of variants, we used TaqMan SNP Genotyping assays from Life Technologies. For variants from ovarian endometrioid carcinoma cohort we used the following assay: AKT1 rs3730358, assay ID C____193157_10, KDR c.1416T>A, rs1870377, assay ID C__11895315_20, and for variants from the endometriosis cohort we used the following assays: AKT1 rs3730358, assay ID C____193157_10, KDR c.1416T>A, rs1870377, assay ID C__11895315_20 and KIT rs3822214, custom assay. The assays were used in a real-time PCR reaction together with the TaqMan Genotyping Master Mix (Life Technologies); we used the protocol provided by the manufacturer as described in our previous work [18].
Evaluation of the methylation profile and copy number alterations
In order to evaluate the methylation profile and the copy number alterations in our samples, we used Salsa MLPA ME002 Tumor suppressor mix 2 probemix (MRC Holland). Primarily, we used 100-150 ng of DNA from each sample. The mixture was denaturated at 95°C for 5 minutes, and then hybridized with a mixture of MLPA buffer (1.5 µl) and Probe mix (1.5 µl) at 60°C for 20 h. After hybridization, 3 µl of Ligase Buffer A and 10 µl of nuclease free water were added and mixed thoroughly. 10 µl of this mixture was digested using the HhaI restriction enzyme (Promega). For the ligation reaction without digestion, we used 10 µl of mixture, 8.25 µl of nuclease free water, 1.5 µl of ligation buffer B and 0.25 µl of Ligase 65. For ligation reaction with digestion, we used 7.75 µl of nuclease free water, 1.5 µl of ligation buffer B, 0.25 µl of Ligase 65, and 0.5 µl of HhaI enzyme. Both reactions were incubated 30 min at 48°C and 5 min at 85°C. After this step, we amplified both reactions using a mixture of nuclease free water (3.75 µl), Salsa PCR Primer mix (1 µl) and Salsa Polymerase (0.25 µl). The PCR program consisted of 35 cycles: 95°C-30 sec, 60°C-30 sec, 72°C-60 sec, 1 cycle-72°C-20 min and 1 cycle 15°-∞. The products obtained were run on an ABI 310 capillary sequencing machine (Applied Biosystems) using the manufacturer’s instructions. The data generated was analyzed using the Coffalyser software (MRC Holland) and Excel (Microsoft Office). The copy number alterations were obtained directly from the Coffalyser software. The methylation dosage ratio (Dm) was calculated using the formula: Dm=(Px/Pctr)dig/(Px/Pctr)undig, where Px-peak area of a given probe, Pctr-sum of the peak areas of the control probes, dig-represents the HhaI digested sample, undig-represents the undigested sample. Dm can be between 0-1, corresponding to the 1-100% of methylation DNA, and all samples that had a Dm ≤ 0.15 were excluded.
Methylation profile of ovarian cancer patients in TCGA databases
The curated TCGA data of ovarian cancer was downloaded from UCSC Xena database and the beta-values from genes of interest were selected, (https://xenabrowser.net/datapages/?dataset=TCGA.OV.sampleMap%2FHumanMethylation27&host=https%3A%2F%2Ftcga.xenahubs.net&removeHub=https%3A%2F%2Fxena.treehouse.gi.ucsc.edu%3A443). The dataset included 582 tumor tissue samples and 12 normal tissue samples. The samples were divided between normal and tumor samples, based on their barcode. The density plots were constructed in R, with the use of dplyr and ggplot2 packages. As grouping method, the type of sample was selected, with “dodge” position and alpha=0.4. For the statistical analysis, the p value based on the distribution of beta-values density calculated, with the help of Kolmogorov-Smirnov test. The resulted p-values were included on the plots. In order to better observe the methylation differentiation between normal and tumor samples, an arithmetic mean of beta-values from normal samples was calculated and the differentiation of percent methylation between this mean and each beta-value from tumor tissue was calculated based on a custom made function in R. All the values of percent data from tumor tissue, for all the selected genes were included in a horizontal violin plot using Graph Pad software.
Mutation profile of ovarian cancer patients in TCGA databases
The general processed mutation data of ovarian cancer was downloaded from UCSC Xena database (https://xenabrowser.net/datapages/?cohort=TCGA%20Ovarian%20Cancer%20(OV)&removeHub=notebook%3A). For base substitution, the reference base and alternative base of each SNP in the database were included in a separate column. Then the genes of interest were selected and included in a boxplot by using ggplot2 R package. In order to observe the frequency of mutations in ovarian cancer in the genes of interest, the Ovarian Serous Cystadenocarcinoma (TCGA, PanCancer Atlas) dataset was selected from cBioPortal database (https://www.cbioportal.org/study/summary?id=ov_tcga_pan_can_atlas_2018) dataset was used. This dataset includes 523 tumor samples of ovarian cancer. The full list of mutated genes was downloaded and only the genes of interest were selected. The percents of frequencies were converted in values from 0 to 1. The ggplot2 and ggpubr packages were used to draw the dot chart, with set ymax = maximum percent of mutation frequency per gene.
Statistical analysis
All statistical analysis was done in Graph Pad Prism v.6.0. Pearson test was used for determining statistical associations between: each variant; the variants and tumor grade; and lastly, tumor size and death. For survival analysis, Kaplan-Meier survival curves were implemented together with Cox analysis for evaluation of p value and log rank for hazard ratio. Gene ontology analysis was performed using the free online Panther DB program in which we uploaded the list of genes that contained the determined variants for each disease.
Results
Mutation identification-cancer panel
From the cancer panel, 85 different variants in 32 genes were identified for the ovarian endometrioid carcinoma patients, while 23 different variants in 17 genes were identified for the endometriosis patients. Two endometriosis samples showed no variants (Tables S1 and S2).
The most frequently mutated genes in ovarian endometrioid carcinoma patients were TP53, KDR, MET, PIK3CA, FGFR3 and PTEN, while in endometriosis the most frequently mutated genes were KDR, AKT1, MET and PIK3CA. Figure 1 along with the Tables S1 and S2 present the number of mutated samples per gene and the number of variants identified in each gene.
Figure 1.
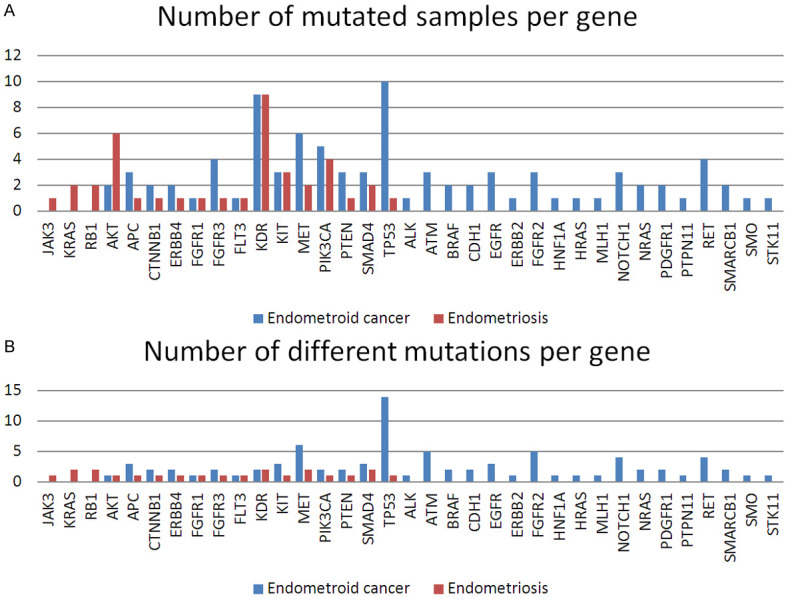
A. Bar graph comparing the two patient cohorts in terms of the number of mutated samples per each gene; B. Bar graph comparing the two patient cohorts in terms of the number of different variants identified for each gene.
Mutation validation
Two variants that were exhibited in more than one patient with ovarian endometrioid carcinoma were tested for validation; the exact gene coding variants tested using the TaqMan SNP genotyping assay (AKT1 rs3730358, assay ID C____193157_10, KDR c.1416T>A, rs1870377, assay ID C__11895315_20). It was determined that the variants AKT1 rs370358 and KDR c.1416A>T were properly validated. For endometriosis samples the following TaqMan SNP assay were chosen for validation: AKT1 rs3730358, assay ID C__193157_10, KDR c.1416T>A, rs1870377, assay ID C__11895315_20 and KIT rs1870377 custom assay. All assays were properly validated and the percentage of positive samples was similar with the percentage obtained in the test samples.
BRCA mutation identification
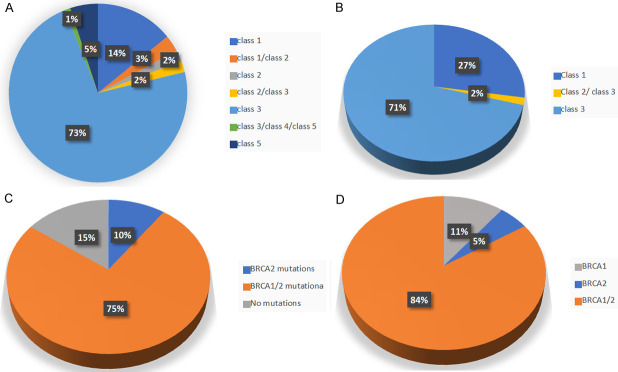
58 different variants were identified from the endometriosis patient, 41 of which were not yet identified in any other sample databases and classified as Class 3 by ClinVar clasifications. No class 5 variants were identified in this group of patients (as seen in Figure 2B and Table S3).
Figure 2.
Pie graphs depicting the percentage of each pathogenicity class defined by ClinVar for the identified mutations. (A) Samples from the endometrioid cancer patients; (B) Samples from the endometriosis patients. Pie graphs of the percentage of variants classified by the type of mutated gene for: (C) ovarian endometrioid cancer patients; (D) endometriosis patients.
The ovarian endometrioid carcinoma cohort exhibited 100 different variants, five of which were Class 5 variants, all in BRCA1. In addition, in this cohort of patients, the majority of variants (74) were Class 3, meaning variants that are either not identified yet or classified as such in ClinVar (Figure 2A and Table S4).
Despite most of the patients in both groups presenting both BRCA1 and BRCA2 variants, the ovarian endometrioid carcinoma group did contain 3 patients with no BRCA1/2 variants. Figure 2C and 2D presents the percentage of variants in either BRCA1 or BRCA2 exhibited in either patient cohort.
There were two Class 3 variants common for both groups of patients: one ovarian endometrioid carcinoma sample and one endometriosis sample had BRCA1 c.2501G>A identified; and BRCA1 c.441+50del14 was identified in one ovarian endometrioid carcinoma sample and in six endometriosis samples.
Identification of the methylation profile
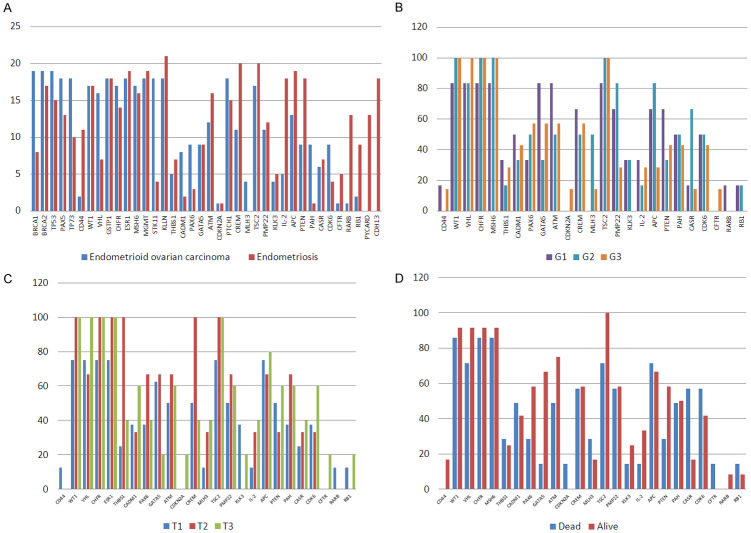
The methylation profile and copy number aberration experiments were done on 21 endometriosis samples and 20 ovarian endometrioid carcinoma samples. We evaluated 45 genes and observed different methylation profiles in 36 genes for endometrioid ovarian carcinoma and 38 for endometriosis However, we were only able to obtain methylation profiles for 19 of the ovarian endometrioid carcinoma samples; the remaining one ovarian endometrioid carcinoma sample presented DNA with quality and quantity not suited for this experiment. No viable results could be obtained. The aforementioned results obtained for the remaining samples are presented in Tables S5 and S6. In Figure 3A are presented the number of endometrioid ovarian carcinoma samples and endometriosis samples that presented methylation in the tested genes. As can be seen there are some genes that are highly methylated only in endometriosis samples (PYCARD, RARB, RB1, IL2, CFTR, CD44 and CDH13) and MLH3 gene was methylated only in endometrioid ovarian carcinoma samples. Also, BRCA1, CADM1, PAX6 and PAH genes are mainly methylated in endometrioid ovarian carcinoma patients. The highly methylated genes in endometrioid ovarian carcinoma are BRCA1, BRCA2, TP53, TP73, PAX5, GSTP1, MSH6, STK11, KLLN, PTCH1, TSC2 and VHL. Also the CFTR gene was hypomethylated in almoust all tested sample, except one (Figure 3A).
Figure 3.
Bar graph comparing the (A) No of methylated endometrioid ovarian cancer (19) and endometriosis samples (21). Bar graph comparing the percent frequency of methylation of the 20 selected genes with (B) tumor differentiation grade (C) tumor stage; (D) Bar graph comparing the percent frequency of methylation of the 20 selected genes pre- and post-mortem, exhibited in the ovarian endometrioid carcinoma patients (n=19).
The methylation status was correlated to the differentiation of the tumor grade (G1, G2, G3) of ovarian endometrioid carcinoma patients, which can be seen in Figure 3B. It was observed that: all patients with G2 tumor grade exhibited methylation in WT1, CHFR, MSH6, PTCH1 and TSC2 genes and did not present methylation in CD44, CDKN2, CFTR and RARB. Patients with G3 tumors showed no methylation for KLK2, RARB and RB1 genes, and patients with G1 tumors did not show methylation in CDKN2A, MLH3 and CFTR. It should be noted that no tumors extracted from the patients exhibited the tumor grade Gx or G4. Regardless of the differentiation degree of the tumor we observed that all samples were methylated in the following genes: BRCA1, BRCA2, TP53, PAX5, TP73, GSTP1, ESR1, MGMT, STK11, KLLN and PTCH1.
Subsequently, the methylation was correlated to the cancer stage of the main tumors extracted from patient groups (T1-T3), which can be seen in Figure 3B. Firstly, all patients with T2 tumors had WT1, CHFR, ESR1, THBS1, CREM and TSC2 methylated. In addition, the T2 tumors from patients did not present hypermethylation in CD44, CDKN2A, KLK3, CFTR, RARB and RB1. Secondly all T3 tumors had WT1, VHL, CHFR, ESR1 and TSC2 methylationand did not show methylation for CD44 and RARB genes. Thirdly, BRCA1, BRCA2, TP53, PAX5, TP73, GSTP1, MSH6, MGMT, STK11, KLLN and PTCH1 were methylated in all samples regardless of the cancer stage. No tumors extracted from the patients exhibited a cancer stage of T4.
Lastly, CDKN2A and CFTR hypermethylation was observed in the same deceased patient at the time of the experiments, whereas CD44 hypermethylation was observed in two alive patients (Figure 3D). Also, all alive patients showed TSC2 hypermethylation, whereas only 71% of deceased patients presented this hypermethylation. BRCA1, BRCA2, TP53, PAX5, TP73, GSTP1, ESR1, MGMT, STK11, KLLN and PTCH1 hypermethylation was observed in all patients regardless if they were alive or dead.
TCGA data for methylation and mutation validation in ovarian cancer
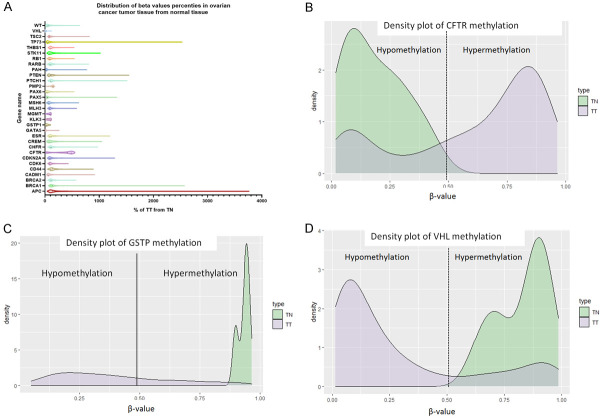
The TCGA data from UCSC Xena database was used for the validation of the methylation profile of ovarian cancer patients, this data set contains methilation profile on 168 genes, from which we selected only the genes that we evaluated in our cohort of patients. As it can be observed in Figure 4A APC, TP73, BRCA1, PTEN, PTCH1, PAX5, CDKN2A and ESR showed the higher methylation profile. As can be seen in Figure 4B, CFTR gene is hypermethylated in the TCGA data, whereas GSTP (Figure 4C) and VHL (Figure 4D) genes are hypomethylate as compared to normal samples. This result could be attributed to the fact that in TCGA data we have all ovarian cancer, not only endometrioid ovarian cancer.
Figure 4.
Methylation data for ovarian cancer patients from TCGA data. (A) distribution of beta values, (B) density plot for CFTR gene, (C) Density plot for GSTP gene, (D) density plot for VHL gene.
We analyzed the survival data for the studies samples in TCGA database and obtained statistical significant data for APC, CHFR and TP73 genes. As can be seen in Figure 5 patients with hypermethylation in APC and CHFR gene have a better survival rate that those with hypomethylation, while in the case of TP73 patients with hypomethylation have better survival rates that those with hypermethylation.
Figure 5.
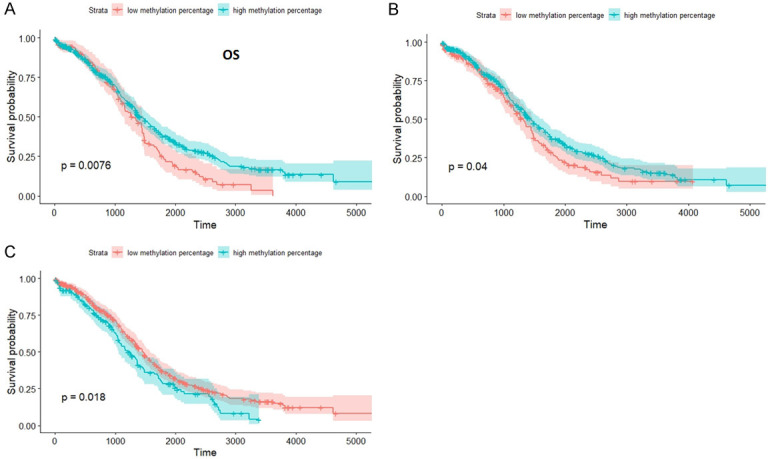
Statistical significant survival curves. (A) APC gene, (B) CHFR gene and (C) TP73 gene.
Regarding the mutation profile of ovarian cancer samples from TCGA data we observed that the most frequently mutated gene in this cohort is TP53, followed by RB1, KDR, RET, ATM, APC, ALK and PIK3CA. As can be observed in Figure 6 the TCGA ovarian cohort has comparable mutation percentages in some genes both with endometrioid ovarian cancer and endometriosis.
Figure 6.
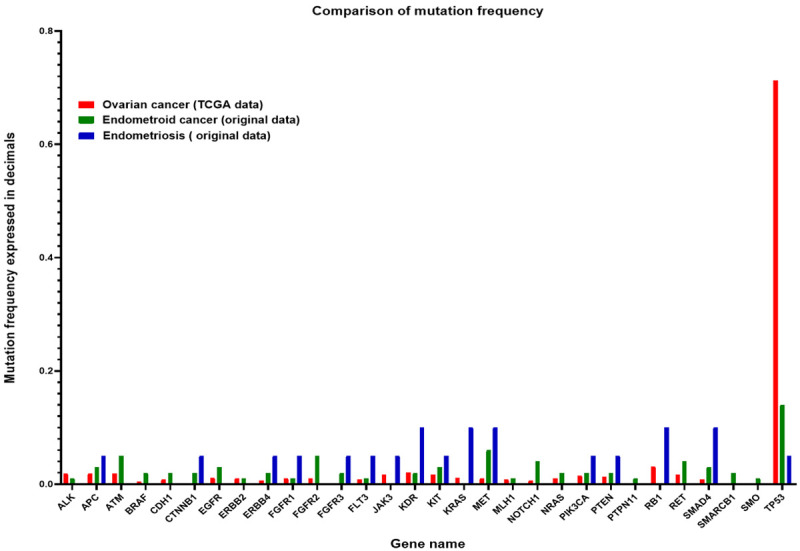
Boxplot of mutations frequencies for ovarian cancer (TCGA data), endometrioid ovarian cancer (original data) and endometriosis (original data).
Statistical analysis
Tables 2 and 3 show the statistical correlation between the validated gene variants (pathogenic BRCA1, TP53 variants or AKT rs3730358) and the clinical information pertaining to the ovarian endometrioid carcinoma patients (tumor differentiation grade, tumor stage, metastases or copy number aberrations). The values in bold represent correlations which are statistically significant.
Table 2.
Correlation coefficients (r) for ovarian endometrioid carcinoma patients between the following criteria: pathogenic variant of BRCA1, tumor differentiation grade, tumor cancer stage, TP53 variant and copy number aberrations
| BRCA1 pathogenic | Tumor Differentiation Grade | Tumor stage | Metastases | TP53 variants | Copy number aberrations | |
|---|---|---|---|---|---|---|
| BRCA1 pathogenic | -0.03 | -0.17 | -0.22 | 0.00 | -0.05 | |
| Tumor Differentiation Grade | -0.03 | 0.53 | 0.56 | -0.37 | 0.27 | |
| Tumor stage | -0.17 | 0.53 | 0.71 | -0.13 | 0.001 | |
| Metastases | -0.22 | 0.56 | 0.71 | -0.22 | -0.05 | |
| TP53 variants | 0.001 | -0.37 | -0.13 | -0.22 | 0.44 | |
| Copy number aberrations | -0.05 | 0.27 | 0.001 | -0.05 | 0.44 |
Table 3.
Correlation of criteria in terms of p-value for ovarian endometrioid carcinoma patients
| AKT rs3730358 | Tumor Differentiation Grade | Tumor stage | Metastases | Mortality | TP53 variants | Copy number aberrations | |
|---|---|---|---|---|---|---|---|
| AKT rs3730358 | 0.44 | 0.44 | 0.36 | 0.07 | 0.15 | 0.54 | |
| Differentiation Grade | 0.44 | 0.04 | 0.02 | 0.13 | 0.14 | 0.29 | |
| Tumor stage | 0.44 | 0.04 | 0.001 | 0.03 | 0.62 | 1.00 | |
| Metastases | 0.36 | 0.02 | 0.001 | 0.18 | 0.36 | 0.84 | |
| Deceased | 0.07 | 0.13 | 0.03 | 0.18 | 0.07 | 0.71 | |
| TP53 variants | 0.15 | 0.14 | 0.62 | 0.36 | 0.07 | 0.05 | |
| Copy number aberrations | 0.54 | 0.29 | 1.00 | 0.84 | 0.71 | 0.05 |
A statistically significant inverse correlation was observed between: the presence of BRCA1 pathogenic variants and the differentiation grade of the tumors; the presence of BRCA1 pathogenic variants and copy number aberrations; and lastly, copy number alterations and metastases. There was a statistically significant direct correlation between: the presence of BRCA1 pathogenic variants and TP53 variants; tumor stage and copy number aberrations.
In the case of p-value correlations, the tumor differentiation grade directly correlated with the tumor stage and the presence of metastases. Tumor stage was also correlated with the presence of metastases and mortality. Lastly, copy number aberrations were statistically correlated with the presence of TP53 variants.
We compared the survival curves for cancer patients that showed the validated variants (AKT, KDR or pathogenic BRCA1 variants) and the group of patients that did not show these variants, but no statistically significant correlation was found. In addition, when the survival curves for patients that presented copy number aberrations were analyzed no statistically significant results were obtained. The same was true in the case of the patients with AKT rs3730358 and KDR rs1870377 variants. Figure 7 presents the survival curve with a statistically significant value, which was in the case of the hypermethylation of GATA2, CREM and ATM gene, tumor stage and tumor differentiation grade.
Figure 7.
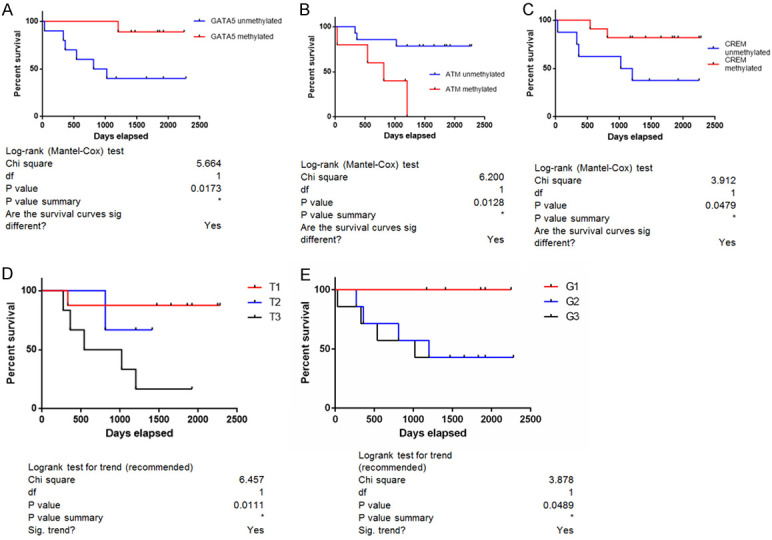
Kaplan-Meier Survival Curves for the ovarian endometrioid carcinoma patients in correlation to (A) GATA5 hypermethylation; (B) ATM hypermethylation; (C) CREM hypermethylation; (D) tumor stage; (E) tumor differentiation grade.
Gene ontology
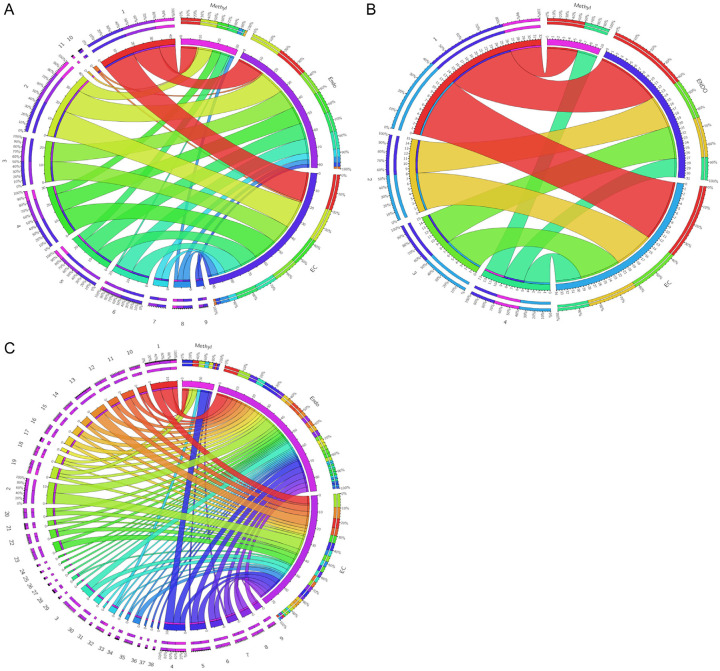
For Gene Ontology, we used the Panther DB online software in order to evaluate the processes involving the mutated and methylated genes. Figure 8 presents the gene ontology analysis for the endometriosis and endometrioid ovarian cancer patients, also in terms of the different methylation profiles exhibited.
Figure 8.
Circos Plots for the gene ontology correlations between the gene variants identified in our ovarian endometrioid cancer, endometriosis and methylation profile of endometrioid ovarian cancer. (A) Biological process; (B) Molecular function; (C) Cellular Pathways.
Discussion
Principal findings
Our study showed that there are significant differences between endometriosis and the ovarian endometrioid carcinoma samples regarding the mutation profile for BRCA1/2 and the 46 genes involved in cancer. As can be seen in Figure 1, there are specific gene variants expressed for the endometriosis patients (JAK3, KRAS, RB1), some variants can only be found in the ovarian endometrioid carcinoma patients (ALK, ATM, BRAF, CDH1, EGFR, ERBB2, FGFR2, HNF1A, HRAS, MLH1, NOTCH1, NRAS, PDGFR1, PTPN11, RET, SMARCB1, SMO, STK11), while others PIK3CA, AKT, KDR and PTEN are common for the two groups. Regarding the methylation profile, we observed that ATM hypermethylation was correlated with a poor survival, whereas patients with hypomethylated GATA5 and CREM genes show lower survival rates, and that there are specific hypermethylation profiles correlated with tumor size and the differentiation degree of the tumor.
One weakness of our study is related to the low number of patients tested, and to the fact that the quantity and quality of DNA from endometriosis patients was low.
We observed that endometriosis patients did not show any BRCA1/2 pathogenic variants, but showed some BRCA1/2 variants that are not yet known to have any clinical significance. In contrast, in the case of patients with ovarian endometrioid carcinoma, there were four samples (20%) that presented pathogenic BRCA1 variants, of which one sample had two variants (c.3544C>T, c.3607C>T, c.1115G>A, c.4612C>T and c.2563C>T).
In the case of the mutation profile of the 46 genes tested, the endometriosis samples presented fewer variants than the ovarian endometrioid carcinoma samples. More specifically, these samples had nine variants identified and classified as pathogenic by the FATHMM score in COSMIC database. Of these, only two variants were present in more than one sample, namely KIT c.1621A>C (3 samples) and PIK3CA c.2119G>A (4 samples). The remaining majority of the other variants were new. It should be noted that two endometriosis samples did not show any variants. On the other hand, the ovarian endometrioid carcinoma samples had variants identified in 31 genes, and 43 of the identified mutations were already known; most were classified as pathogenic by the FATHMM score in the COSMIC database.
The percentage of patients with BRCA1/2 variants found in our study is similar to the reported percentage in the literature [19]. All the pathogenic variants identified in our study were identified in the ClinVar database, where they were associated with familial breast and ovarian cancer predisposition syndrome. The c.4612C>T mutation is associated with ovarian cancer as described by Yang et al. [20].
Regarding the ovarian endometrioid carcinoma samples, pathogenic variants were observed in several genes, from which two genes presented the same pathogenic variants in more than one samples: CTNNB1 c.110C>G (2 samples) and PIK3CA c.2119G>A (3 samples).
Moreover, the specific mutations PIK3CA c.2119G>A and KIT c.1621A>C were observed in both of our patient cohorts. Both of these mutations are exhibited in triple negative breast cancer patients [18], which is an interesting correlation to further investigate: the predisposition of ovarian endometrioid carcinoma to present similar mutations as triple negative breast cancer.
In accordance with the literature [19], 50% of the ovarian endometrioid carcinoma samples exhibited TP53 variants. By analyzing TCGA data sets we observed a correlation between the percentage of TP53 mutations in our samples and the TCGA database. Additionally, it is well known from the literature that the ovarian endometrioid carcinoma is associated with variants in the PTEN gene and in the PI3K pathway [21]. Our data also supports this association. More specifically, three of our samples presented variants in PTEN gene and five samples in PIK3CA gene, which could make these patients susceptible to PARP-PI3K inhibitor as described by Bian et al. [22]. Also, when we used the inTogen database to evaluate which genes are considered as drivers in ovarian cancer, the main gene is TP53, followed by BRCA1, BRCA2 and RB1, which are genes commonly mutated in our cohort of patients, as well as in the TCGA database [23].
Aberrant methylation of CpG islands is correlated with silencing or different expression of tumor suppressor genes in cancer. In our cohort of cancer patients, we observed abnormal methylation in several genes including BRCA1/2, TP53, TP73, PAX5, ESR, MSH6, PTCH1, PTEN and others (refer to Table S5), which were also hypermethylated in the TCGA cohort. As described in the literature, BRCA1 gene is hypermethylated only in breast and ovarian cancer [24]. Ibanez de Caceres et al. observed that 82% of patients with ovarian cancer presented hypermethylation in one of the following genes: BRCA1, RASSF1A, p14ARF, APC, p16INK4A and DARK [25,26]. We observed hypermethylation in 19 of the 20 patients that were tested, which may be due to the fact that the promoter regions of 25 genes tested are frequently methylated in cancer. Melnikov et al. showed that ovarian cancer patients show increased methylation in genes like BRCA1, EP300, NR3C1, MLH1, DNAjC15, CDKN1C, TP73, PGR, THBS1, PAX5 and PYCARD [27]. Interestingly, we observed methylation deregulations in some of the genes presented in Melnokov’s paper, such as BRCA1, TP73, THBS1 and PAX5. It was observed that hypermethylation in ovarian cancer inactivates pathways like DNA repair, cell cycle regulation, cell adhesion and apoptosis, all of which are involved in ovarian cancer development [28-30].
The patients with G2 or G3 tumors showed lower survival rates compared to patients with G1 tumors as seen in Figure 7E, which is in accordance with the literature [31,32]. Also, it was observed that patient survival is similar in the concurrent ovarian endometrioid carcinoma and endometrial endometrioid carcinoma stage I [33].
When doing Gene ontology analysis for the different mutated genes in ovarian endometrioid carcinoma and endometriosis patients, it was observed that in both diseases the same biological processes and molecular functions were present. Concerning the pathways in which the mutated genes were involved, the main ones were angiogenesis, apoptosis, p53 pathway, PI3 kinase, EGF signaling, VEGF and TGF signaling. The same pathways were observed in both types of patients; exemplified in the Circos Diagrams of Figure 8. Analysis of the Gene ontology results for the genes with different methylation profiles determined that only two molecular functions were re-established: firstly, binding and catalytic activity; and secondly, the pathways were correlated to the p53 protein. Also, the presence of deregulated inflammatory and RAS protein pathways was observed in both groups studied, which correlates with the recent literature [34]. Regarding the other pathways, the presence of apoptosis and WNT signaling were also identified (refer to Figure 8 and Table 4). Taking all of this into consideration, we can say that based on common processes, molecular functions and pathways that overlap in both endometriosis and ovarian endometrioid carcinoma, a diagnosis of endometriosis could be utilized as an early sign of ovarian endometrioid carcinoma for the respective patients. This notion has been argued and supported in the literature, stating that ovarian endometrioid carcinoma particularly originates from ovarian or pelvic endometriosis [35]. Due to the fact that gene ontology analysis of methylation data showed such specific pathways, one can conclude that ovarian endometrioid carcinoma is strongly correlated with p53 and apoptosis deregulations. Furthermore, other studies extend this idea to any cellular processes related to regulation, development and interaction [36,37].
Table 4.
Table legend for Figure 8
| Code | Figure 8A | Code | Figure 8B |
|
| |||
| 1 | cellular process (GO:0009987) | 1 | binding (GO:0005488) |
| 2 | metabolic process (GO:0008152) | 2 | receptor activity (GO:0004872) |
| 3 | biological regulation (GO:0065007) | 3 | signal transducer activity (GO:0004871) |
| 4 | response to stimulus (GO:0050896) | 4 | catalytic activity (GO:0003824) |
| 5 | developmental process (GO:0032502) | ||
| 6 | multicellular organismal process (GO:0032501) | ||
| 7 | localization (GO:0051179) | ||
| 8 | cellular component organization or biogenesis (GO:0071840) | ||
| 9 | locomotion (GO:0040011) | ||
| 10 | biological adhesion (GO:0022610) | ||
| 11 | reproduction (GO:0000003) | ||
|
| |||
| code | Figure 8C | code | Figure 8C |
|
| |||
| 1 | p53 pathway feedback loops 2 (P04398) | 20 | T cell activation (P00053) |
| 2 | Angiogenesis (P00005) | 21 | Endothelin signaling pathway (P00019) |
| 3 | Inflammation mediated by chemokine and cytokine signaling pathway (P00031) | 22 | PDGF signaling pathway (P00047) |
| 4 | p53 pathway (P00059) | 23 | Cadherin signaling pathway (P00012) |
| 5 | Wnt signaling pathway (P00057) | 24 | DPP signaling pathway (P06213) |
| 6 | FGF signaling pathway (P00021) | 25 | DPP-SCW signaling pathway (P06212) |
| 7 | Apoptosis signaling pathway (P00006) | 26 | BMP/activin signaling pathway-drosophila (P06211) |
| 8 | Interleukin signaling pathway (P00036) | 27 | Activin beta signaling pathway (P06210) |
| 9 | Insulin/IGF pathway-protein kinase B signaling cascade (P00033) | 28 | Axon guidance mediated by netrin (P00009) |
| 10 | Hypoxia response via HIF activation (P00030) | 29 | JAK/STAT signaling pathway (P00038) |
| 11 | VEGF signaling pathway (P00056) | 30 | Integrin signalling pathway (P00034) |
| 12 | Ras Pathway (P04393) | 31 | ALP23B signaling pathway (P06209) |
| 13 | EGF receptor signaling pathway (P00018) | 32 | P53 pathway feedback loops 1 (P04392) |
| 14 | PI3 kinase pathway (P00048) | 33 | FAS signaling pathway (P00020) |
| 15 | CCKR signaling map (P06959) | 34 | TGF-beta signaling pathway (P00052) |
| 16 | Gonadotropin-releasing hormone receptor pathway (P06664) | 35 | B cell activation (P00010) |
| 17 | Alzheimer disease-presenilin pathway (P00004) | 36 | SCW signaling pathway (P06216) |
| 18 | Huntington disease (P00029) | 37 | MYO signaling pathway (P06215) |
| 19 | p53 pathway by glucose deprivation (P04397) | 38 | GBB signaling pathway (P06214) |
Conclusion
In conclusion, this study was able to demonstrate the presence of the common signaling pathways and molecular functions, supported by similar genetic network alterations, in both endometriosis and ovarian endometrioid carcinoma. This further drives the notion that the diagnosis of endometriosis could be an early marker for ovarian endometrioid cancer diagnosis. Lastly, it was demonstrated that GATA2 hypomethylation, ATM hypermethylation, CREM hypomethylation, higher tumor differentiation degree or higher tumor stage is associated with a poor prognosis in patients with ovarian endometrioid carcinoma.
Disclosure of conflict of interest
None.
Table S1
Table S2
Table S3
Table S4
Table S5
Table S6
References
- 1.Mehedintu C, Plotogea MN, Ionescu S, Antonovici M. Endometriosis still a challenge. J Med Life. 2014;7:349–357. [PMC free article] [PubMed] [Google Scholar]
- 2.Vercellini P, Vigano P, Somigliana E, Fedele L. Endometriosis: pathogenesis and treatment. Nat Rev Endocrinol. 2014;10:261–275. doi: 10.1038/nrendo.2013.255. [DOI] [PubMed] [Google Scholar]
- 3.Pearce CL, Templeman C, Rossing MA, Lee A, Near AM, Webb PM, Nagle CM, Doherty JA, Cushing-Haugen KL, Wicklund KG, Chang-Claude J, Hein R, Lurie G, Wilkens LR, Carney ME, Goodman MT, Moysich K, Kjaer SK, Hogdall E, Jensen A, Goode EL, Fridley BL, Larson MC, Schildkraut JM, Palmieri RT, Cramer DW, Terry KL, Vitonis AF, Titus LJ, Ziogas A, Brewster W, Anton-Culver H, Gentry-Maharaj A, Ramus SJ, Anderson AR, Brueggmann D, Fasching PA, Gayther SA, Huntsman DG, Menon U, Ness RB, Pike MC, Risch H, Wu AH, Berchuck A Ovarian Cancer Association Consortium. Association between endometriosis and risk of histological subtypes of ovarian cancer: a pooled analysis of case-control studies. Lancet Oncol. 2012;13:385–394. doi: 10.1016/S1470-2045(11)70404-1. [DOI] [PMC free article] [PubMed] [Google Scholar]
- 4.Stern RC, Dash R, Bentley RC, Snyder MJ, Haney AF, Robboy SJ. Malignancy in endometriosis: frequency and comparison of ovarian and extraovarian types. Int J Gynecol Pathol. 2001;20:133–139. doi: 10.1097/00004347-200104000-00004. [DOI] [PubMed] [Google Scholar]
- 5.Vercellini P, Scarfone G, Bolis G, Stellato G, Carinelli S, Crosignani PG. Site of origin of epithelial ovarian cancer: the endometriosis connection. Bjog. 2000;107:1155–1157. doi: 10.1111/j.1471-0528.2000.tb11116.x. [DOI] [PubMed] [Google Scholar]
- 6.Brinton LA, Sakoda LC, Sherman ME, Frederiksen K, Kjaer SK, Graubard BI, Olsen JH, Mellemkjaer L. Relationship of benign gynecologic diseases to subsequent risk of ovarian and uterine tumors. Cancer Epidemiol Biomarkers Prev. 2005;14:2929–2935. doi: 10.1158/1055-9965.EPI-05-0394. [DOI] [PubMed] [Google Scholar]
- 7.Aris A. Endometriosis-associated ovarian cancer: a ten-year cohort study of women living in the Estrie Region of Quebec, Canada. J Ovarian Res. 2010;3:2. doi: 10.1186/1757-2215-3-2. [DOI] [PMC free article] [PubMed] [Google Scholar]
- 8.Kobayashi H, Sumimoto K, Moniwa N, Imai M, Takakura K, Kuromaki T, Morioka E, Arisawa K, Terao T. Risk of developing ovarian cancer among women with ovarian endometrioma: a cohort study in Shizuoka, Japan. Int J Gynecol Cancer. 2007;17:37–43. doi: 10.1111/j.1525-1438.2006.00754.x. [DOI] [PubMed] [Google Scholar]
- 9. European Cancer Information System From https://ecis.jrc.ec.europa.eu, accessed on 11.07.2018.
- 10. Cancer Today - IARC, 150 Cours Albert Thomas, 69372 Lyon CEDEX 08, France https://gco.iarc.fr/accessed on 08.01.2019.
- 11.Heidemann LN, Hartwell D, Heidemann CH, Jochumsen KM. The relation between endometriosis and ovarian cancer - a review. Acta Obstet Gynecol Scand. 2014;93:20–31. doi: 10.1111/aogs.12255. [DOI] [PubMed] [Google Scholar]
- 12.Morgan RD, Burghel GJ, Flaum N, Bulman M, Clamp AR, Hasan J, Mitchell CL, Schlecht H, Woodward ER, Lallo FI, Crosbie EJ, Edmondson RJ, Wallace AJ, Jayson GC, Evans DGR. Prevalence of germline pathogenic BRCA1/2 variants in sequential epithelial ovarian cancer cases. J Med Genet. 2019;56:301–307. doi: 10.1136/jmedgenet-2018-105792. [DOI] [PubMed] [Google Scholar]
- 13.Gates MA, Rosner BA, Hecht JL, Tworoger SS. Risk factors for epithelial ovarian cancer by histologic subtype. Am J Epidemiol. 2010;171:45–53. doi: 10.1093/aje/kwp314. [DOI] [PMC free article] [PubMed] [Google Scholar]
- 14.Antoniou A, Pharoah PD, Narod S, Risch HA, Eyfjord JE, Hopper JL, Loman N, Olsson H, Johannsson O, Borg A, Pasini B, Radice P, Manoukian S, Eccles DM, Tang N, Olah E, Anton-Culver H, Warner E, Lubinski J, Gronwald J, Gorski B, Tulinius H, Thorlacius S, Eerola H, Nevanlinna H, Syrjäkoski K, Kallioniemi OP, Thompson D, Evans C, Peto J, Lalloo F, Evans DG, Easton DF. Average risks of breast and ovarian cancer associated with BRCA1 or BRCA2 mutations detected in case Series unselected for family history: a combined analysis of 22 studies. Am J Hum Genet. 2003;72:1117–1130. doi: 10.1086/375033. [DOI] [PMC free article] [PubMed] [Google Scholar]
- 15.Braicu OL, Budisan L, Buiga R, Jurj A, Achimas-Cadariu P, Pop LA, Braicu C, Irimie A, Berindan-Neagoe I. miRNA expression profiling in formalin-fixed paraffin-embedded endometriosis and ovarian cancer samples. Onco Targets Ther. 2017;10:4225–4238. doi: 10.2147/OTT.S137107. [DOI] [PMC free article] [PubMed] [Google Scholar]
- 16.Baylin SB, Ohm JE. Epigenetic gene silencing in cancer - a mechanism for early oncogenic pathway addiction? Nat Rev Cancer. 2006;6:107–116. doi: 10.1038/nrc1799. [DOI] [PubMed] [Google Scholar]
- 17.Ushijima T, Asada K. Aberrant DNA methylation in contrast with mutations. Cancer Sci. 2010;101:300–305. doi: 10.1111/j.1349-7006.2009.01434.x. [DOI] [PMC free article] [PubMed] [Google Scholar]
- 18.Pop LA, Cojocneanu-Petric RM, Pileczki V, Morar-Bolba G, Irimie A, Lazar V, Lombardo C, Paradiso A, Berindan-Neagoe I. Genetic alterations in sporadic triple negative breast cancer. Breast. 2018;38:30–38. doi: 10.1016/j.breast.2017.11.006. [DOI] [PubMed] [Google Scholar]
- 19.Wieser V, Gaugg I, Fleischer M, Shivalingaiah G, Wenzel S, Sprung S, Lax SF, Zeimet AG, Fiegl H, Marth C. BRCA1/2 and TP53 mutation status associates with PD-1 and PD-L1 expression in ovarian cancer. Oncotarget. 2018;9:17501–17511. doi: 10.18632/oncotarget.24770. [DOI] [PMC free article] [PubMed] [Google Scholar]
- 20.Yang D, Khan S, Sun Y, Hess K, Shmulevich I, Sood AK, Zhang W. Association of BRCA1 and BRCA2 mutations with survival, chemotherapy sensitivity, and gene mutator phenotype in patients with ovarian cancer. JAMA. 2011;306:1557–1565. doi: 10.1001/jama.2011.1456. [DOI] [PMC free article] [PubMed] [Google Scholar]
- 21.Ayhan A, Akilli H, Haberal N. The prognostic significance of stage I ovarian clear cell and endometrioid carcinomas arising from endometriotic cysts: is it a myth? Arch Gynecol Obstet. 2019;299:217–222. doi: 10.1007/s00404-018-4935-x. [DOI] [PubMed] [Google Scholar]
- 22.Bian X, Gao J, Luo F, Rui C, Zheng T, Wang D, Wang Y, Roberts TM, Liu P, Zhao JJ, Cheng H. PTEN deficiency sensitizes endometrioid endometrial cancer to compound PARP-PI3K inhibition but not PARP inhibition as monotherapy. Oncogene. 2018;37:341–351. doi: 10.1038/onc.2017.326. [DOI] [PMC free article] [PubMed] [Google Scholar]
- 23.Gonzalez-Perez A, Perez-Llamas C, Deu-Pons J, Tamborero D, Schroeder MP, Jene-Sanz A, Santos A, Lopez-Bigas N. IntOGen-mutations identifies cancer drivers across tumor types. Nat Methods. 2013;10:1081–1082. doi: 10.1038/nmeth.2642. [DOI] [PMC free article] [PubMed] [Google Scholar]
- 24.Vo LT, Thuan TB, Thu DM, Uyen NQ, Ha NT, To TV. Methylation profile of BRCA1, RASSF1A and ER in Vietnamese women with ovarian cancer. Asian Pac J Cancer Prev. 2013;14:7713–7718. doi: 10.7314/apjcp.2013.14.12.7713. [DOI] [PubMed] [Google Scholar]
- 25.Ibanez de Caceres I, Battagli C, Esteller M, Herman JG, Dulaimi E, Edelson MI, Bergman C, Ehya H, Eisenberg BL, Cairns P. Tumor cell-specific BRCA1 and RASSF1A hypermethylation in serum, plasma, and peritoneal fluid from ovarian cancer patients. Cancer Res. 2004;64:6476–6481. doi: 10.1158/0008-5472.CAN-04-1529. [DOI] [PubMed] [Google Scholar]
- 26.Zhu X, Zhao L, Lang J. The BRCA1 methylation and PD-L1 expression in sporadic ovarian cancer. Int J Gynecol Cancer. 2018;28:1514–1519. doi: 10.1097/IGC.0000000000001334. [DOI] [PMC free article] [PubMed] [Google Scholar]
- 27.Melnikov A, Scholtens D, Godwin A, Levenson V. Differential methylation profile of ovarian cancer in tissues and plasma. J Mol Diagn. 2009;11:60–65. doi: 10.2353/jmoldx.2009.080072. [DOI] [PMC free article] [PubMed] [Google Scholar]
- 28.Strathdee G, Appleton K, Illand M, Millan DW, Sargent J, Paul J, Brown R. Primary ovarian carcinomas display multiple methylator phenotypes involving known tumor suppressor genes. Am J Pathol. 2001;158:1121–1127. doi: 10.1016/S0002-9440(10)64059-X. [DOI] [PMC free article] [PubMed] [Google Scholar]
- 29.Rathi A, Virmani AK, Schorge JO, Elias KJ, Maruyama R, Minna JD, Mok SC, Girard L, Fishman DA, Gazdar AF. Methylation profiles of sporadic ovarian tumors and nonmalignant ovaries from high-risk women. Clin Cancer Res. 2002;8:3324–3331. [PubMed] [Google Scholar]
- 30.Swisher EM, Gonzalez RM, Taniguchi T, Garcia RL, Walsh T, Goff BA, Welcsh P. Methylation and protein expression of DNA repair genes: association with chemotherapy exposure and survival in sporadic ovarian and peritoneal carcinomas. Mol Cancer. 2009;8:48. doi: 10.1186/1476-4598-8-48. [DOI] [PMC free article] [PubMed] [Google Scholar]
- 31.Zhao Y, Wang S, Qu YM, Ji YT, Shen K, Lang JH. Prognostic analysis for Chinese patients with stage I ovarian endometrioid carcinoma. J Ovarian Res. 2017;10:63. doi: 10.1186/s13048-017-0361-0. [DOI] [PMC free article] [PubMed] [Google Scholar]
- 32.Oseledchyk A, Leitao MM Jr, Konner J, O’Cearbhaill RE, Zamarin D, Sonoda Y, Gardner GJ, Long Roche K, Aghajanian CA, Grisham RN, Brown CL, Snyder A, Chi DS, Soslow RA, Abu-Rustum NR, Zivanovic O. Adjuvant chemotherapy in patients with stage I endometrioid or clear cell ovarian cancer in the platinum era: a surveillance, epidemiology, and end results cohort study, 2000-2013. Ann Oncol. 2017;28:2985–2993. doi: 10.1093/annonc/mdx525. [DOI] [PMC free article] [PubMed] [Google Scholar]
- 33.Matsuo K, Machida H, Frimer M, Marcus JZ, Pejovic T, Roman LD, Wright JD. Prognosis of women with stage I endometrioid endometrial cancer and synchronous stage I endometrioid ovarian cancer. Gynecol Oncol. 2017;147:558–564. doi: 10.1016/j.ygyno.2017.09.027. [DOI] [PMC free article] [PubMed] [Google Scholar]
- 34.Zhang C, Wang X, Anaya Y, Parodi L, Cheng L, Anderson ML, Hawkins SM. Distinct molecular pathways in ovarian endometrioid adenocarcinoma with concurrent endometriosis. Int J Cancer. 2018;143:2505–2515. doi: 10.1002/ijc.31768. [DOI] [PubMed] [Google Scholar]
- 35.McCluggage WG. Morphological subtypes of ovarian carcinoma: a review with emphasis on new developments and pathogenesis. Pathology. 2011;43:420–432. doi: 10.1097/PAT.0b013e328348a6e7. [DOI] [PubMed] [Google Scholar]
- 36.Tothill RW, Tinker AV, George J, Brown R, Fox SB, Lade S, Johnson DS, Trivett MK, Etemadmoghadam D, Locandro B, Traficante N, Fereday S, Hung JA, Chiew YE, Haviv I, Gertig D, DeFazio A, Bowtell DD. Novel molecular subtypes of serous and endometrioid ovarian cancer linked to clinical outcome. Clin Cancer Res. 2008;14:5198–5208. doi: 10.1158/1078-0432.CCR-08-0196. [DOI] [PubMed] [Google Scholar]
- 37.Jonsson JM, Bartuma K, Dominguez-Valentin M, Harbst K, Ketabi Z, Malander S, Jonsson M, Carneiro A, Masback A, Jonsson G, Nilbert M. Distinct gene expression profiles in ovarian cancer linked to Lynch syndrome. Fam Cancer. 2014;13:537–545. doi: 10.1007/s10689-014-9728-1. [DOI] [PMC free article] [PubMed] [Google Scholar]
Associated Data
This section collects any data citations, data availability statements, or supplementary materials included in this article.


