Abstract
Autophagy played a significant role in the development of cancer. In this study, we explored the value of autophagy-associated genes in gastric cancer. RNA sequencing and clinical information containing 375 gastric cancer and 32 normal tissues were gathered from the TCGA portal. Then we stochastically allocated the autophagy-associated genes (AAGs) to training and testing groups. Next, we screened the discrepantly expressed AAGs and the prognostic AAGs by Cox regression analysis and Lasso regression analysis. Afterwards, we structured the model by using the prognostic AAGs and plotted Kaplan-Meier (KM) and receiver operating characteristic (ROC) curves to verify the performance of models in both groups. Besides, we utilized Gene Ontology (GO) functional annotation and Kyoto Encyclopedia of Genes and Genomes (KEGG) pathway enrichment analyses to explore the molecular mechanisms of AAGs in gastric cancer. Finally, we demonstrated discrepant expression of AAGs within gastric cancer and non-tumor tissues at protein level with immunohistochemistry. 28 discrepantly expressed AAGs were screened from the TCGA database which contained 375 gastric cancer and 32 non-tumor samples. Cox and Lasso regression analyses were performed in training group and then we got 5 prognostic AAGs to establish the prognostic model. The patients who had high risk possessed worse overall survival (OS) both in training group (5-year OS, 47.6% vs 23.1%; P < 0.0001) and test group (5-year OS, 49.2% vs 0%, P=0.019). The proportion under ROC curves (AUC) were significant both in training group and test group (5-year AUC, 0.736 vs 0.809). Through this study, we constructed a model for gastric cancer patients which may provide individual treatment and superior prognosis.
Keywords: Gastric cancer, autophagy-associated genes, survival, prognosis
Introduction
Autophagy was first proposed by de Duve in 1963 as a phenomenon of cell self-digestion [1]. It is a common biological phenomenon existing in all eukaryotic cells. Previous research reported that autophagy has been proved to play a significant role in pathophysiological responses including cancer [2,3]. Autophagy is an extremely conserved catabolic pathway that double-membrane cytoplasmic vesicles phagocytose some cytoplasm, long-lived proteins, damaged organelles, and other ingredients such as invading pathogenic microorganism to form autophagosomes. Afterwards, autophagolysosomes forms with the fusion of outer membranes and lysosomal membranes. After that, the hydrolytic enzymes in autophagolysosomes degrades those substances for meeting metabolic needs and renovating of organelles including mitochondria, endoplasmic reticulum and ribosomes [4,5]. As the research of autophaygy moves along, scientists have realized that autophagy participates the progress of cell death which is discrepant from apoptosis [6,7]. Another study shows that autophagy plays a significant role in regulating tumourigenesis, interstitial interactions and tumour therapy. It not only inhibits tumourigenesis at the early stage but also promotes the development of established-tumor. And it results in the tumour metastasis, recurrence and chemical resistance [8]. Some cancer-related pathological process perhaps is resulted from the abnormal expression of autophagy genes [9,10].
Gastric cancer (GC) is one of the most malignant tumors of digestive tract, and is also the third leading cause of cancer-associated death around the world [11,12]. The overall survival (OS) of GC patients is still dismal. The 5-year survival rate of advanced gastric cancer patients is just about 5%-20%, with 10 months of OS [13]. In spite of the medical technology has made great progress in the last few decades and the health consciousness has improved, but the prognosis of gastric cancer patients remains poor [13]. Therefore, it is necessary to explore into more accurate diagnostic methods and postoperative tumour staging.
In recent years, the role of autophagy in the development of gastric cancer has attracted the attention of many scholars. Various studies has confirmed that autophagy-associated genes (AAGs) may turn into potential prognostic biomarkers of gastric cancer with extraordinary clinical value. The research progress of targeted autophagy in gastric cancer therapy has also attracted increasing attention [14].
In consideration of the above, we try to explore into the latent value of autophagy in gastric cancer by matching all the AAGs and the pertinent clinical information about gene expression obtained from The Cancer Genome Atlas (TCGA) portal. In the first place, 28 AAGs with discrepant expression in tumor and normal tissues were filtrated and stochastically allocated into training group and testing group. Afterwards, Lasso and Cox regression analyses were performed among the training group to screen the AAGs which are markedly connected with OS in gastric cancer patients and we structured the prognostic model at the same time. After that, we applied the receiver operating characteristic (ROC) curve and the Kaplan-Meier (KM) estimator to verify the precision of the model. Furthermore, we also researched the results of Kyoto Encyclopedia of Genes and Genomes (KEGG) pathway analyses and Gene Ontology (GO) functional annotation to demonstrate how AAGs play a role in gastric cancer.
Methods
Information origin and preconditioning
We downloaded RNA sequencing and clinical data containing 375 gastric cancer and 32 non-tumor tissues from TCGA portal. And then, gathered the complete set of 204 AAGs from human autophagy portal (http://www.autophagy.lu/autophagy.html). This database can provide the entire set of human genes associated with autophagy. All of the gene IDs were switched to gene specimens by this online database GENCODE (https://www.gencodegenes.org/human/), which referenced human genome annotation. Ultimately,we obtained the expression information of AAGs.
Filtrate the AAGs with discrepant expression in gastric cancer
We used the meaning function to process the expression data of 204 AAGs containing 375 gastric cancer and 32 non-tumor specimens, and the meaning expression value were standardized by log2 transformation. Afterwards, we gathered 28 AAGs which discrepantly expressed in gastric cancer and normal tissues were filtrated by using Wilcoxon signed-rank test in R (version 4.0.2, https://mirrors.tuna.tsinghua.edu.cn/CRAN/) with the false discovery rate (FDR) < 0.05 and the threshold of |log (fold change)| > 1.
Furthermore, we matched the expression data of 28 AAGs with relevant clinical information and randomly divided them into testing and training group for the subsequent analysis. Next, we used univariate Cox regression analysis within training group to analyse expression data of AAGs which were dramatically correlated to survival (P < 0.05). The minimum absolute shrinkage and selection operator (Lasso) regression was used to import the variables into the model for obtaining the enhanced function parameters and controlling the complicacy of this model to avoid overfitting [15]. So we removed highly related survival-related AAGs by the lasso regression analysis.
Establish the prognostic model
We structured the the prognostic model based on performing the multivariate Cox regression analysis with both forward and backward selection to screen the 5 prognostic AAGs and their coefficients. Thus, each gastric cancer patients in both testing and training group can get an unparalleled risk score. The formula according to AAGs model was calculated as follows (Equation):
(the n denotes the quantity of independent indicators, the vi denotes the expression quantity of gene i and the ci denotes the regression coefficient of gene i in multivariate Cox regression analysis).
Verifying the performance of prognostic model within testing and training group
All the patients were allocated into two group (high/low score) by median risk score on the basis of unparalleled risk score. We plotted K-M survival curve which were tested by log-rank to portion statistical significance for evaluating the discrepancy of OS between the two groups. Besides, we plotted ROC curves for verifying the precision of this model.
Enrichment analysis of AAGs
For exploring the tumor molecular mechanisms of AAGs, we performed KEGG pathway enrichment analyses and GO functional annotation in R by employing the packages DOSE, GO plot, Cluster Profiler, ggplot2 and so on, which p-value and q-value were set at 0.05 in the meantime.
Immunohistochemical demonstrate the expression of AAGs at protein level
We acquired the immunohistochemical information of the 5 prognostic AAGs from the Human Protein Atlas, (https://www.proteinatlas.org/humanproteome/pathology), which involves RNA and protein expression information of protein-coding genes exceed 90% to demonstrate their discrepant expression in cancer and non-tumor tissues [16].
Statistical analysis
All of the graphs and statistical analysis were performed by R 4.0.2 (https://mirrors.tuna.tsinghua.edu.cn/CRAN/) and Perl language packages. We used Cox regression analyses to filtrate the survival-associated AAGs and the Lasso regression analysis was utilized for removing the significantly correlated AAGs for preventing overfitting of this model. The KM survival curve which were tested by log-rank to insure statistical significance was plotted to show the discrepancy of OS between the two groups. We utilized ROC curve and the area under the curve (AUC) to appraise the accuracy of this model. Statistical significance was stipulated as P < 0.05.
Results
Discrepant expression of AAGs in gastric cancer (GC)
We used Wilcoxon signed-rank test in R and the criteria of |log2FC| > 1 and FDR < 0.05 to analyse the expression of 204 AAGs in 375 GC and 32 non-tumor tissues. Eventually, we gathered 28 discrepantly expressed AAGs including 18 upregulated genes (Figure 1). We utilized ggpubr package in R to show the expression patterns of the 28 AAGs in gastric cancer and non-tumor specimens. Red box plots and green box plot upon the gene names denote tumor specimens and non-tumor specimens respectively (Figure 2).
Figure 1.
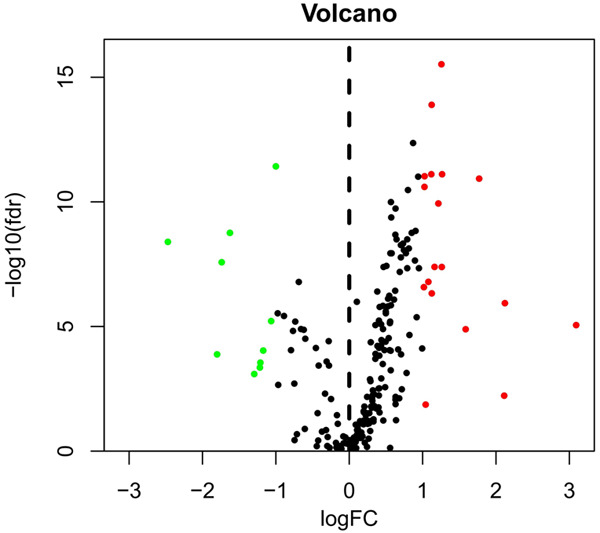
Discrepantly expressed autophagy-associated genes (AAGs) in gastric cancer (GC) and non-tumour samples. The volcano map of 232 AAGs. The red dots indicate genes with high expression and the green dots denote genes with low expression.
Figure 2.
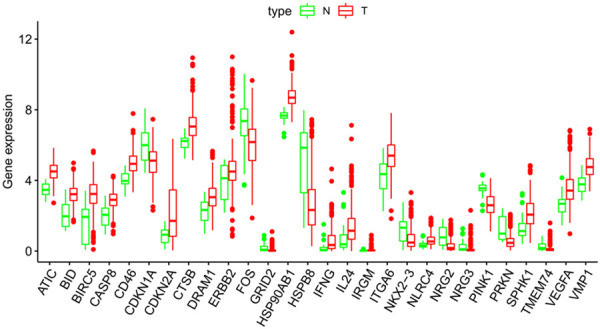
Boxplots of the expression levels of 28 autophagy-associated genes (AAGs) in tumour and normal tissues. The red box plots above the corresponding gene name denote the expression in tumour samples, whereas the green box plots denote the expression in normal samples; the red dots on the X-axis indicate genes with high levels of expression and the blue dots indicate genes with low levels of expression. (Difference analysis by Wilcoxon signed-rank test and all false discovery rate (FDR) < 0.05).
Filtration of survival-associated AAGs and prognostic model
We performed univariate Cox regression analysis and filtrated 5 AAGs (FOS, GRID2, CXCR4, GABARAPL2, and ERBB2). All of them were regarded as risk factors (HRs, 1.0009-6.0947; all P < 0.05) and the overexpression of them may decrease survival. Then we used Lasso regression analysis to eliminate genes which might be prominently connected with other genes (Figure 3). Next, we applied this 5 AAGs to a multivariate Cox proportional hazards model to verify whether they were important prognostic predictors or not (Table 1). We structured formula of risk score for each GC patients based on 5 AAGs: risk score = (expression quantity of FOS * 0.0029) + (expression quantity of GRID2 * 1.7030) + (expression quantity of CXCR4 * 0.0068) + (expression quantity of GABARAPL2 * 0.0640) + (expression quantity of ERBB2 * 0.0010).
Figure 3.
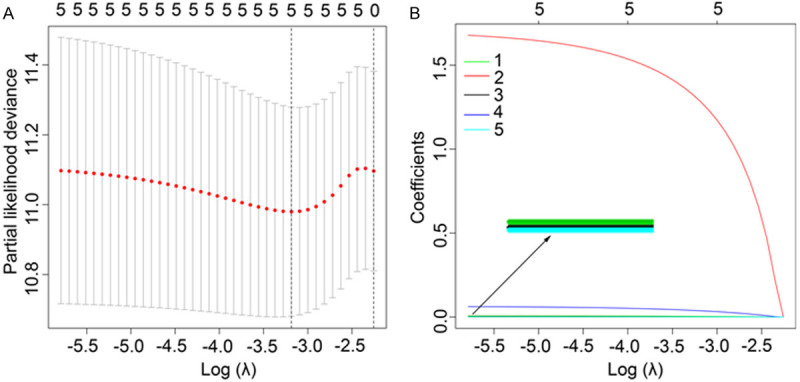
Screening of the optimal AAGs used for the final construction of the predictive model using a Lasso regression. A. Screening of optimal parameter (lambda) at which the vertical lines were drawn. B. Lasso coefficient profiles of the six AAGs with non-zero coefficients determined by the optimal lambda.
Table 1.
Univariate and multivariate cox regression analyses of OS in gastric cancer patients
| Genes | Univariate analysis | Multivariate analysis | |||
|---|---|---|---|---|---|
|
|
|
||||
| HR (95% CI) | P | HR (95% CI) | P | Coef | |
| FOS | 1.0032 (1.0011-1.0053) | 0.0029 | 1.0029 (1.0006-1.0051) | 0.0140 | 0.0029 |
| GRID2 | 6.0947 (1.8700-19.8635) | 0.0027 | 5.4906 (1.6939-17.7968) | 0.0045 | 1.7030 |
| CXCR4 | 1.0072 (1.0021-1.0123) | 0.0057 | 1.0068 (1.0015-1.0120) | 0.0110 | 0.0068 |
| GABARAPL2 | 1.059 (1.0156-1.1041) | 0.0072 | 1.0661 (1.0182-1.1163) | 0.0063 | 0.0640 |
| ERBB2 | 1.0009 (1.0002-1.0015) | 0.0094 | 1.0010 (1.0004-1.0017) | 0.0019 | 0.0010 |
HR hazard ratio, OS overall survival, Coef regression coefficient of genes in the multivariate Cox regression analysis.
Verify the precision of this prognostic model
KM survival curve was plotted to appraise the discrepancy in GC survival between training group and test group. No matter which group, low-risk patients possessed dramatically longer median overall survival than that of high-risk patients. The patients who had high risk possessed worse OS both in training group (5-year OS, 47.6% vs 23.1%; P < 0.0001) and test group (5-year OS, 49.2% vs 0%, P=0.019). The proportion under ROC curves (AUC) were significant both in training group and test group (5-year AUC, 0.736 vs 0.809) (Figure 4).
Figure 4.
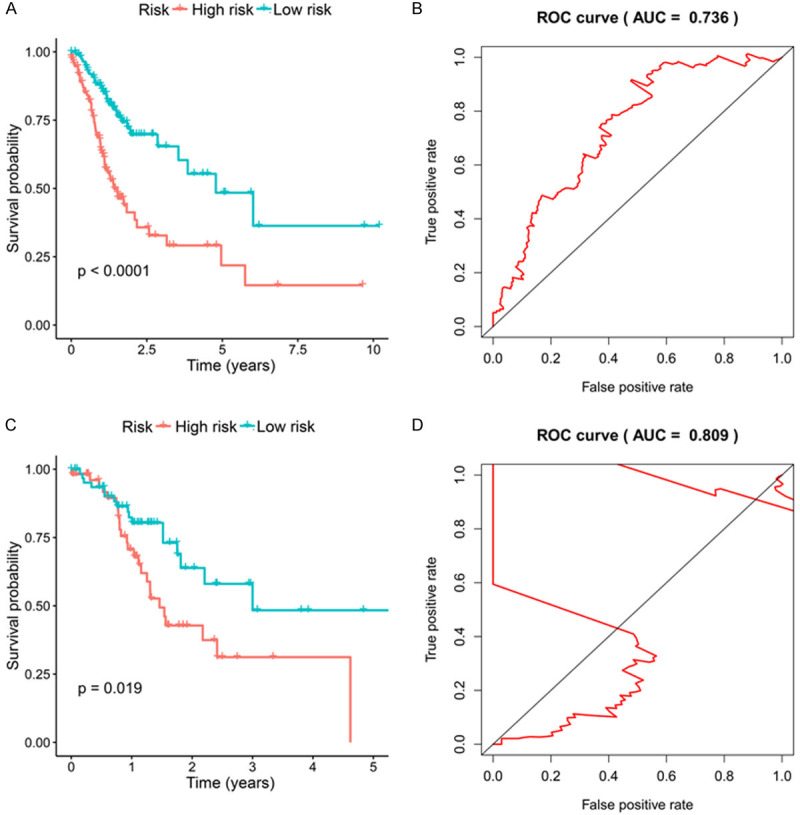
A. K-M curve of the high-risk (red) and low-risk (green) GC patients in the training group. B. The 5-year ROC curves in the training group of GC patients. C. K-M curve of the high-risk (red) and low-risk (green) GC patients in the testing group. D. The 5-year ROC curves in the testing group of GC patients.
In addition, we sequenced all GC patients based on their risk score to analyze their survival distribution. The scatter plot shows the survival status of GC patients that had their own risk score, and the mortality rate of them increases with the increase of risk score. Besides, heat maps illustrated that expression of AAGs was associated with increased risk scores among patients (Figure 5).
Figure 5.
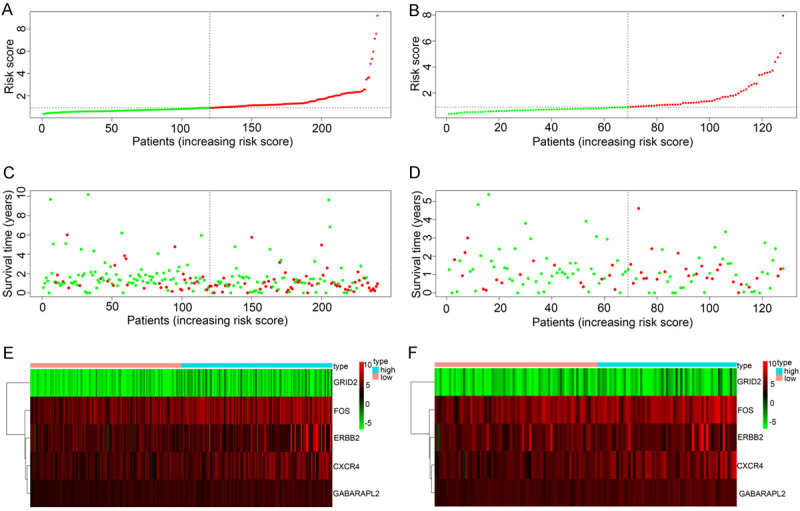
A. Risk score distribution of GC patients with different risks (low, green; high, red) in the training group. B. Risk score distribution of GC patients with different risks (low, green; high, red) in the testing group. C. Scatterplots of GC patients with different survival status in training group. D. Scatterplots of GC patients with different survival status in testing group. E. Expression of risk genes in GC patients with different risks (low, pink; high, blue) in the training group. F. Expression of risk genes in GC patients with different risks (low, pink; high, blue) in the testing group.
KEGG and GO analyses of AAGs
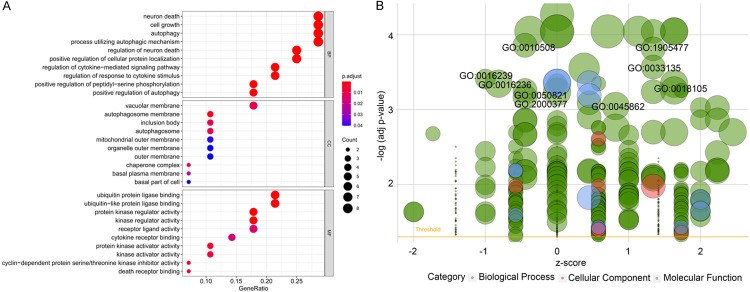
We proceeded KEGG and GO to explore molecular mechanisms of AAGs in GC (Table 2). In KEGG enrichment analysis, we found that AAGs were connected with the following pathways: platinum drug resistance, bladder cancer, apoptosis, p53 signaling pathway, pancreatic cancer, hepatitis B, ErbB signaling pathway, apoptosis-multiple species, IL-17 signaling pathway and the endocrine resistance (Figure 7). Otherwise, the GO analysis which is composed of 3 categories including biological processes (BP), cellular components (CC) and molecular function (MF) was performed. So we discovered that the most important terms that GO enriched in autophagy were the neuron death and cell growth (BP); vacuolar membrane (CC); and ubiquitin protein ligase binding and ubiquitin-like protein ligase binding (MF) (Figure 8A, 8B).
Table 2.
GO and KEGG pathway enrichment analysis of AAGs in gastric cancer
| Terms | Pathway ID | Pathway description | Gene ID | Count | FDR |
|---|---|---|---|---|---|
| BP | GO:0001959 | regulation of cytokine-mediated signaling pathway | PRKN/IRGM/HSP90AB1/CASP8/SPHK1/IFNG | 6 | 0.00011 |
| GO:0060759 | regulation of response to cytokine stimulus | PRKN/IRGM/HSP90AB1/CASP8/SPHK1/IFNG | 6 | 0.00011 | |
| GO:1903829 | positive regulation of cellular protein localization | PRKN/PINK1/ERBB2/HSP90AB1/CASP8/BID/IFNG | 7 | 0.00013 | |
| GO:0016049 | cell growth | PRKN/ERBB2/HSP90AB1/NRG3/SPHK1/VEGFA/CDKN2A/CDKN1A | 8 | 0.00013 | |
| GO:0033138 | positive regulation of peptidyl-serine phosphorylation | PINK1/IRGM/HSP90AB1/VEGFA/IFNG | 5 | 0.00013 | |
| GO:0070997 | neuron death | PRKN/FOS/PINK1/GRID2/HSP90AB1/CASP8/BID | 7 | 0.00013 | |
| GO:1905477 | positive regulation of protein localization to membrane | PRKN/ERBB2/CASP8/BID/IFNG | 5 | 0.00020 | |
| GO:1901214 | regulation of neuron death | PRKN/FOS/PINK1/GRID2/HSP90AB1/CASP8 | 6 | 0.00047 | |
| GO:0006914 | autophagy | DRAM1/PRKN/TMEM74/PINK1/IRGM/VMP1/IFNG | 7 | 0.00047 | |
| GO:0061919 | process utilizing autophagic mechanism | DRAM1/PRKN/TMEM74/PINK1/IRGM/VMP1/IFNG | 7 | 0.00047 | |
| GO:0018209 | peptidyl-serine modification | PINK1/IRGM/IL24/HSP90AB1/VEGFA/IFNG | 6 | 0.00047 | |
| GO:1905475 | regulation of protein localization to membrane | PRKN/ERBB2/CASP8/BID/IFNG | 5 | 0.00054 | |
| GO:2000377 | regulation of reactive oxygen species metabolic process | PRKN/PINK1/HSP90AB1/CDKN1A/IFNG | 5 | 0.00057 | |
| GO:0010508 | positive regulation of autophagy | PRKN/PINK1/IRGM/IFNG | 4 | 0.00122 | |
| GO:0051402 | neuron apoptotic process | PRKN/PINK1/GRID2/HSP90AB1/BID | 5 | 0.00066 | |
| CC | GO:0000421 | autophagosome membrane | TMEM74/IRGM/VMP1 | 3 | 0.00176 |
| GO:0016234 | inclusion body | PRKN/PINK1/HSP90AB1 | 3 | 0.00954 | |
| GO:0005774 | vacuolar membrane | DRAM1/TMEM74/IRGM/HSP90AB1/VMP1 | 5 | 0.00954 | |
| GO:0009925 | basal plasma membrane | ERBB2/ITGA6 | 2 | 0.03008 | |
| MF | GO:0031625 | ubiquitin protein ligase binding | PRKN/PINK1/HSP90AB1/CASP8/BID/CDKN1A | 6 | 0.00044 |
| GO:0019207 | kinase regulator activity | IRGM/HSP90AB1/NRG3/CDKN2A/CDKN1A | 5 | 0.00067 | |
| GO:0004861 | cyclin-dependent protein serine/threonine kinase inhibitor activity | CDKN2A/CDKN1A | 2 | 0.00499 | |
| GO:0030295 | protein kinase activator activity | IRGM/NRG3/CDKN1A | 3 | 0.00682 | |
| GO:0045296 | cadherin binding | HSP90AB1/ITGA6/ATIC/CD46 | 4 | 0.02092 | |
| KEGG Pathways | hsa01524 | Platinum drug resistance | CDKN1A/BIRC5/CDKN2A/CASP8/BID/ERBB2 | 6 | 0.00000 |
| hsa05219 | Bladder cancer | CDKN1A/CDKN2A/VEGFA/ERBB2 | 4 | 0.00024 | |
| hsa04210 | Apoptosis | FOS/BIRC5/CTSB/CASP8/BID | 5 | 0.00188 | |
| hsa04066 | HIF-1 signaling pathway | CDKN1A/VEGFA/IFNG/ERBB2 | 4 | 0.00319 | |
| hsa04115 | p53 signaling pathway | CDKN1A/CDKN2A/CASP8/BID | 4 | 0.00188 | |
| hsa05212 | Pancreatic cancer | CDKN1A/CDKN2A/VEGFA/ERBB2 | 4 | 0.00188 | |
| hsa05161 | Hepatitis B | FOS/CDKN1A/BIRC5/CASP8/BID | 5 | 0.00189 | |
| hsa04012 | ErbB signaling pathway | CDKN1A/NRG3/NRG2/ERBB2 | 4 | 0.00189 | |
| hsa05160 | Hepatitis C | CDKN1A/CASP8/IFNG/BID | 4 | 0.00806 | |
| hsa04215 | Apoptosis - multiple species | BIRC5/CASP8/BID | 3 | 0.00189 | |
| hsa04657 | IL-17 signaling pathway | FOS/HSP90AB1/CASP8/IFNG | 4 | 0.00236 | |
| hsa01522 | Endocrine resistance | FOS/CDKN1A/CDKN2A/ERBB2 | 4 | 0.00236 | |
| hsa05210 | Colorectal cancer | FOS/CDKN1A/BIRC5 | 3 | 0.01174 | |
| hsa04151 | PI3K-Akt signaling pathway | CDKN1A/HSP90AB1/VEGFA/ITGA6/ERBB2 | 5 | 0.01639 |
GO gene ontology, KEGG Kyoto encyclopedia of genes and genomes, AAG autophagy-associated genes, FDR false discovery rate.
Figure 7.
Results of Gene Ontology (GO) functional annotation analysis. A. Bubble chart of significant terms. The change in colour from blue to red denotes the increase in the adjusted P-value, and the size of the bubble indicates the number of gene enrichment terms. B. Bubble plot of enriched GO terms. The Z-score is plotted on the x-axis and the -log(adjusted p-value) is plotted on the y-axis; green denotes a biological process, red denotes cellular components and blue denotes molecular function. The size of the circles is proportional to the number of genes enriched in the term.
Figure 8.
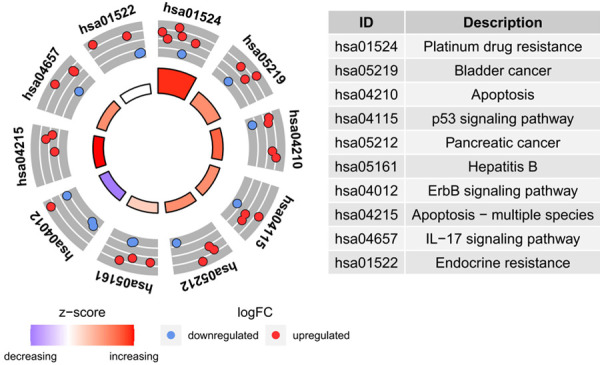
Results of Kyoto Encyclopedia of Genes and Genomes (KEGG) pathways enrichment analyses of autophagy-associated genes.
Discrepant expression of survival-associated AAGs in protein level
Immunohistochemical methods were used to compare the expression of AAGs (FOS, GRID2, CXCR4, GABARAPL2, and ERBB2) in GC and its expression in normal gastric tissues (Figure 6). Inevitably, protein expression levels of these 3 high-stake genes (FOS, GRID2, and ERBB2) were dramatically increased in tumor specimen which had more prominent antibody staining and higher percentage of stained tissues. The results were consistent with the AAGs which we found in GC. There was no data for the other 2 genes (CXCR4 and GABARAPL2), in human Protein Atlas database.
Figure 6.
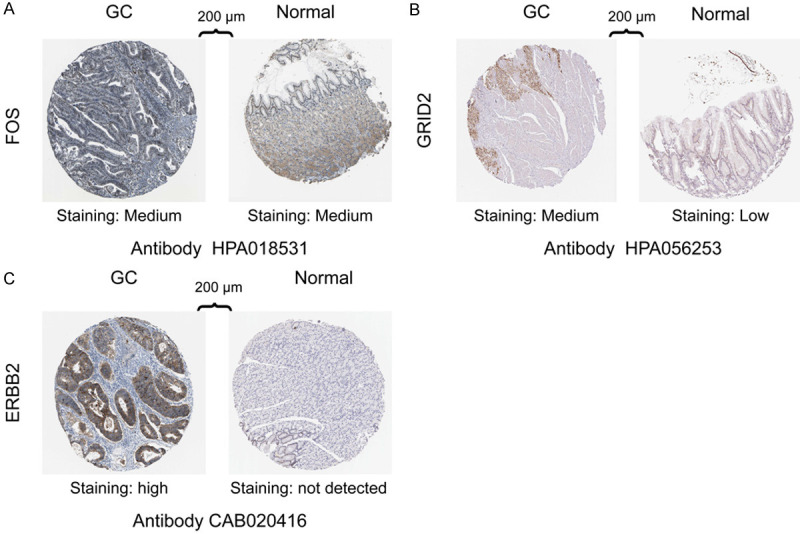
Immunohistochemistry (IHC) results showing protein levels of autophagy-associated genes in GC and normal tissues, A. IHC results of FOS in GC (staining: medium; intensity: moderate; quantity: 75%-25%; location: nuclear) and in normal tissue (staining: medium; intensity: moderate; quantity: 75%-25%; location: cytoplasmic/membranous). B. IHC results of GRID2 in GC (staining: medium; intensity: moderate; quantity: > 75%; location: cytoplasmic/membranous/nuclear) and in normal tissue (staining: low; intensity: moderate; quantity: < 25%; location: cytoplasmic/membranous). C. IHC results of ERBB2 in GC (staining: high; intensity: strong; quantity: > 75; location: cytoplasmic/membranous) and in normal tissue (staining: not detected; intensity: weak; quantity: < 25%; location: cytoplasmic/membranous).
Discussion
Gastric cancer is a heterogeneous disease, which is the end point of a long and multi-step process. It is caused by the gradual accumulation of a large number of gene mutations, resulting in the imbalance of carcinogenic and anticancer pathways [17]. Along with the advance of economy and medical technology, the incidence and mortality of gastric cancer are gradually decreasing, but the prognosis of gastric cancer patients are still not optimistic [18]. The reason why five-year survival rate of advanced GC patients is still extremely low is that we lack insight into the pathogenesis and a highly specific and sensitive method for early diagnosis [19]. Consequently, it is necessary to explore into new means to enhance the accuracy of diagnosis and improve the prognosis of GC patients.
Because the application of microarrays and genome sequencing facilitated the excavate of prognostic biomarkers over last decade, the accuracy of diagnosis and the individual treatment had been improved greatly [20-23]. For example, CA199, CEA, and CA724 are used in early detection of GC and some microRNAs (mi-21 and miR-378) are also reported as a diagnostic and therapeutic biomarkers but their sensitivity needs to be improved [24-26]. However, many studies have demonstrated that genomic data, especially polygenic characteristics, performed better in prognostic analysis than current staging systems [20-23].
In this study, we combined the complete set of AAGs with GC to explore the latent value of AAGs in GC. In the first place, we screened 28 discrepantly expressed AAGs in 375 tumor and 32 non-tumor samples from the complete set of AAGs and then stochastically allocated them into training and testing group. Next, we utilized this 5 prognostic AAGs (FOS, GRID2, CXCR4, GABARAPL2, and ERBB2) to establish a risk model which were selected by the Cox regression analysis and Lasso regression analysis. Utilizing the ROC curve to verify these two models both performed well. Thus, each GC patient got a individual risk score which calculated by using this model. We found that there was a significant discrepancy in survival between training and testing group for GC patients with high or low risk score. Besides, we demonstrated the significant discrepancy at protein level of AAGs in GC by immunohistochemistry. Finally, we performed KEGG and GO enrichment analysis to explore the latent molecular mechanisms of AAGs.
In KEGG analysis, AAGs were enriched in apoptosis and p53 signaling pathway. Autophagy is an adaptive response to stress which can promote survival; however, it also seems to promote cell death and morbidity [27-29]. Apoptosis is a programmed cell death process in multicellular organisms characterized by bubbling, cell contraction, nuclear fragmentation, chromatin concentration, chromosome DNA fragmentation, and overall mRNA degradation [30]. In one study, autophagy played a protective role in against matrine-induced apoptosis and they found that the inhibition of autophagy could enhance matrine’s antineoplastic potential in gastric cancer [29]. In addition, it was reported that cinobufagin can effectively prevent cancer by activating ROS/JNK/P38 axis to induce apoptosis and autophagic cell death [31]. As we all know, the tumor suppressor gene p53 is a extremely significant factor in the cancer pathology. With the up-regulation of p53 expression, the cell proliferation could be inhibited and the apoptosis could be induced [32]. Previous research reported that p53 signaling pathway was activated by curcumin to induce the apoptosis and autophagy of GC cells [33]. The GO functional annotation shown that AAGs were mainly enriched in neuron death and cell growth. The neuron cell death was caused by the cytoplasmic and nuclear protein aggregates which is consistent with the result, that autophagy is a physiological process including phagocytosis of long-lived proteins and protein aggregates. At the same time, autophagy played a analogous role in cell growth [34].
At present, most studies have found that autophagy promotes tumor metastasis by affecting several aspects such as angiogenesis and epithelial mesenchymal transformation (EMT) [35]. Silent mating type information regulation 1 (SIRT1) is a class III histone deacetylase. The researchers found that the expression of SIRT1 in gastric cancer tissues was significantly higher than that in normal gastric mucosa tissues by immunohistochemistry and was related to lymph node metastasis, TNM staging and survival rate [36]. The invasion ability and regulatory effect of EMT in gastric cancer cells of SIRT1 have been confirmed by vitro study. After silencing SIRT1 gene, the migration and invasion ability of gastric cancer cells decreased and the expression level of E-cadherin increased while the expression level of Vimentin decreased [37]. Significantly, SIRT1 is an autophagy mediator which activates autophagy through the deacetylation of AAGs [38]. On the other hand, angiogenic mimicry plays a significant role in tumor growth and metastasis. This novel mode of tumor angiogenesis can provide oxygen and energy supplementation to promote tumor growth [39]. A study reported that the survival and invasion ability of gastric cancer SGC-7901 cells was greatly enhanced due to autophagy promoting angiogenic mimicry. Conversely, inhibition of autophagy can reduce the survival and invasion ability of cancer cells under stress state. When autophagy associated gene was inhibited, angiogenic mimicry was not formed, and the expression of pluripotent genes was decreased. Therefore, autophagy may support the high energy requirements of tumor angiogenesis through digestion and recycling of intracellular material. When autophagy is activated, it can promote tumor angiogenesis, maintain the stability of gene expression, and enhance the survival and invasion ability of tumor cells under stress state [40].
In brief, autophagy plays a significant role in the development of cancer. This study confirmed the value of AAGs as a prognostic biomarker in GC. However, as a retrospective study, it has some limitations ineluctably. Moreover, the specific mechanisms and biological function of those prognostic AAGs remain to be researched.
Conclusion
In brief, we discussed the role of AAGs in GC and also structured a model to offer a reference for individual treatment which may improve the prognosis of the GC patients.
Acknowledgements
This study was supported in part by Grants from the Programs of National Natural Science Foundation of China (no. 81572372, no. 81172080, no. 81201773, no. 81572372), National Key Research and Development Program (MOST-2016YFC1303200), and National Precision Medicine Research Program (2017YFC0908300).
Disclosure of conflict of interest
None.
References
- 1.Galluzzi L, Baehrecke EH, Ballabio A, Boya P, Bravo-San Pedro JM, Cecconi F, Choi AM, Chu CT, Codogno P, Colombo MI, Cuervo AM, Debnath J, Deretic V, Dikic I, Eskelinen EL, Fimia GM, Fulda S, Gewirtz DA, Green DR, Hansen M, Harper JW, Jaattela M, Johansen T, Juhasz G, Kimmelman AC, Kraft C, Ktistakis NT, Kumar S, Levine B, Lopez-Otin C, Madeo F, Martens S, Martinez J, Melendez A, Mizushima N, Munz C, Murphy LO, Penninger JM, Piacentini M, Reggiori F, Rubinsztein DC, Ryan KM, Santambrogio L, Scorrano L, Simon AK, Simon HU, Simonsen A, Tavernarakis N, Tooze SA, Yoshimori T, Yuan J, Yue Z, Zhong Q, Kroemer G. Molecular definitions of autophagy and related processes. EMBO J. 2017;36:1811–1836. doi: 10.15252/embj.201796697. [DOI] [PMC free article] [PubMed] [Google Scholar]
- 2.Martinez-Vicente M, Cuervo AM. Autophagy and neurodegeneration: when the cleaning crew goes on strike. Lancet Neurol. 2007;6:352–361. doi: 10.1016/S1474-4422(07)70076-5. [DOI] [PubMed] [Google Scholar]
- 3.Chertow GM, Parfrey PS. Cinacalcet for cardiovascular disease in patients undergoing dialysis. N Engl J Med. 2013;368:1844–1845. doi: 10.1056/NEJMc1301247. [DOI] [PubMed] [Google Scholar]
- 4.Ricci V. Relationship between VacA toxin and host cell autophagy in helicobacter pylori infection of the human stomach: a few answers, many questions. Toxins (Basel) 2016;8:203. doi: 10.3390/toxins8070203. [DOI] [PMC free article] [PubMed] [Google Scholar]
- 5.Budini M, Buratti E, Morselli E, Criollo A. Autophagy and its impact on neurodegenerative diseases: new roles for TDP-43 and C9orf72. Front Mol Neurosci. 2017;10:170. doi: 10.3389/fnmol.2017.00170. [DOI] [PMC free article] [PubMed] [Google Scholar]
- 6.Teng YH, Li JP, Liu SL, Zou X, Fang LH, Zhou JY, Wu J, Xi SY, Chen Y, Zhang YY, Xu S, Wang RP. Autophagy protects from raddeanin a-induced apoptosis in SGC-7901 human gastric cancer cells. Evid Based Complement Alternat Med. 2016;2016:9406758. doi: 10.1155/2016/9406758. [DOI] [PMC free article] [PubMed] [Google Scholar]
- 7.Kelekar A. Introduction to the review series autophagy in higher eukaryotes- a matter of survival or death. Autophagy. 2008;4:555–556. [PubMed] [Google Scholar]
- 8.Maes H, Rubio N, Garg AD, Agostinis P. Autophagy: shaping the tumor microenvironment and therapeutic response. Trends Mol Med. 2013;19:428–446. doi: 10.1016/j.molmed.2013.04.005. [DOI] [PubMed] [Google Scholar]
- 9.Maiuri MC, Tasdemir E, Criollo A, Morselli E, Vicencio JM, Carnuccio R, Kroemer G. Control of autophagy by oncogenes and tumor suppressor genes. Cell Death Differ. 2009;16:87–93. doi: 10.1038/cdd.2008.131. [DOI] [PubMed] [Google Scholar]
- 10.Tsuchihara K, Fujii S, Esumi H. Autophagy and cancer: dynamism of the metabolism of tumor cells and tissues. Cancer Lett. 2009;278:130–138. doi: 10.1016/j.canlet.2008.09.040. [DOI] [PubMed] [Google Scholar]
- 11.Ang TL, Fock KM. Clinical epidemiology of gastric cancer. Singapore Med J. 2014;55:621–628. doi: 10.11622/smedj.2014174. [DOI] [PMC free article] [PubMed] [Google Scholar]
- 12.Venerito M, Link A, Rokkas T, Malfertheiner P. Review: gastric cancer-clinical aspects. Helicobacter. 2019;24(Suppl 1):e12643. doi: 10.1111/hel.12643. [DOI] [PubMed] [Google Scholar]
- 13.Torre LA, Bray F, Siegel RL, Ferlay J, Lortet-Tieulent J, Jemal A. Global cancer statistics, 2012. CA Cancer J Clin. 2015;65:87–108. doi: 10.3322/caac.21262. [DOI] [PubMed] [Google Scholar]
- 14.Wang X, Wu WKK, Gao J, Li Z, Dong B, Lin X, Li Y, Li Y, Gong J, Qi C, Peng Z, Yu J, Shen L. Autophagy inhibition enhances PD-L1 expression in gastric cancer. J Exp Clin Cancer Res. 2019;38:140. doi: 10.1186/s13046-019-1148-5. [DOI] [PMC free article] [PubMed] [Google Scholar]
- 15.Sauerbrei W, Royston P, Binder H. Selection of important variables and determination of functional form for continuous predictors in multivariable model building. Stat Med. 2007;26:5512–5528. doi: 10.1002/sim.3148. [DOI] [PubMed] [Google Scholar]
- 16.Uhlen M, Fagerberg L, Hallstrom BM, Lindskog C, Oksvold P, Mardinoglu A, Sivertsson A, Kampf C, Sjostedt E, Asplund A, Olsson I, Edlund K, Lundberg E, Navani S, Szigyarto CA, Odeberg J, Djureinovic D, Takanen JO, Hober S, Alm T, Edqvist PH, Berling H, Tegel H, Mulder J, Rockberg J, Nilsson P, Schwenk JM, Hamsten M, von Feilitzen K, Forsberg M, Persson L, Johansson F, Zwahlen M, von Heijne G, Nielsen J, Ponten F. Proteomics. Tissue-based map of the human proteome. Science. 2015;347:1260419. doi: 10.1126/science.1260419. [DOI] [PubMed] [Google Scholar]
- 17.Molina-Castro S, Pereira-Marques J, Figueiredo C, Machado JC, Varon C. Gastric cancer: basic aspects. Helicobacter. 2017;22(Suppl 1) doi: 10.1111/hel.12412. [DOI] [PubMed] [Google Scholar]
- 18.Parkin DM. The global health burden of infection-associated cancers in the year 2002. Int J Cancer. 2006;118:3030–3044. doi: 10.1002/ijc.21731. [DOI] [PubMed] [Google Scholar]
- 19.Dang Y, Ouyang X, Zhang F, Wang K, Lin Y, Sun B, Wang Y, Wang L, Huang Q. Circular RNAs expression profiles in human gastric cancer. Sci Rep. 2017;7:9060. doi: 10.1038/s41598-017-09076-6. [DOI] [PMC free article] [PubMed] [Google Scholar]
- 20.Lau SK, Boutros PC, Pintilie M, Blackhall FH, Zhu CQ, Strumpf D, Johnston MR, Darling G, Keshavjee S, Waddell TK, Liu N, Lau D, Penn LZ, Shepherd FA, Jurisica I, Der SD, Tsao MS. Three-gene prognostic classifier for early-stage non small-cell lung cancer. J. Clin. Oncol. 2007;25:5562–5569. doi: 10.1200/JCO.2007.12.0352. [DOI] [PubMed] [Google Scholar]
- 21.Xie Y, Xiao G, Coombes KR, Behrens C, Solis LM, Raso G, Girard L, Erickson HS, Roth J, Heymach JV, Moran C, Danenberg K, Minna JD, Wistuba II. Robust gene expression signature from formalin-fixed paraffin-embedded samples predicts prognosis of non-small-cell lung cancer patients. Clin Cancer Res. 2011;17:5705–5714. doi: 10.1158/1078-0432.CCR-11-0196. [DOI] [PMC free article] [PubMed] [Google Scholar]
- 22.Wu M, Li X, Zhang T, Liu Z, Zhao Y. Identification of a nine-gene signature and establishment of a prognostic nomogram predicting overall survival of pancreatic cancer. Front Oncol. 2019;9:996. doi: 10.3389/fonc.2019.00996. [DOI] [PMC free article] [PubMed] [Google Scholar]
- 23.Zhang G, Fan E, Yue G, Zhong Q, Shuai Y, Wu M, Feng G, Chen Q, Gou X. Five genes as a novel signature for predicting the prognosis of patients with laryngeal cancer. J Cell Biochem. 2019 doi: 10.1002/jcb.29535. [Epub ahead of print] [DOI] [PubMed] [Google Scholar]
- 24.Liu X, Cai H, Wang Y. Prognostic significance of tumour markers in Chinese patients with gastric cancer. ANZ J Surg. 2014;84:448–453. doi: 10.1111/j.1445-2197.2012.06287.x. [DOI] [PubMed] [Google Scholar]
- 25.Jamali L, Tofigh R, Tutunchi S, Panahi G, Borhani F, Akhavan S, Nourmohammadi P, Ghaderian SMH, Rasouli M, Mirzaei H. Circulating microRNAs as diagnostic and therapeutic biomarkers in gastric and esophageal cancers. J Cell Physiol. 2018;233:8538–8550. doi: 10.1002/jcp.26850. [DOI] [PubMed] [Google Scholar]
- 26.Xiong X, Lu B, Tian Q, Zhang H, Wu M, Guo H, Zhang Q, Li X, Zhou T, Wang Y. Inhibition of autophagy enhances cinobufagininduced apoptosis in gastric cancer. Oncol Rep. 2019;41:492–500. doi: 10.3892/or.2018.6837. [DOI] [PubMed] [Google Scholar]
- 27.Mizushima N, Levine B, Cuervo AM, Klionsky DJ. Autophagy fights disease through cellular self-digestion. Nature. 2008;451:1069–1075. doi: 10.1038/nature06639. [DOI] [PMC free article] [PubMed] [Google Scholar]
- 28.Reed M, Morris SH, Jang S, Mukherjee S, Yue Z, Lukacs NW. Autophagy-inducing protein beclin-1 in dendritic cells regulates CD4 T cell responses and disease severity during respiratory syncytial virus infection. J Immunol. 2013;191:2526–2537. doi: 10.4049/jimmunol.1300477. [DOI] [PMC free article] [PubMed] [Google Scholar]
- 29.Chen YY, Sun LQ, Wang BA, Zou XM, Mu YM, Lu JM. Palmitate induces autophagy in pancreatic beta-cells via endoplasmic reticulum stress and its downstream JNK pathway. Int J Mol Med. 2013;32:1401–1406. doi: 10.3892/ijmm.2013.1530. [DOI] [PubMed] [Google Scholar]
- 30.Xie SQ, Zhang YH, Li Q, Xu FH, Miao JW, Zhao J, Wang CJ. 3-Nitro-naphthalimide and nitrogen mustard conjugate NNM-25 induces hepatocellular carcinoma apoptosis via PARP-1/p53 pathway. Apoptosis. 2012;17:725–734. doi: 10.1007/s10495-012-0712-7. [DOI] [PubMed] [Google Scholar]
- 31.Ma K, Zhang C, Huang MY, Li WY, Hu GQ. Cinobufagin induces autophagy-mediated cell death in human osteosarcoma U2OS cells through the ROS/JNK/p38 signaling pathway. Oncol Rep. 2016;36:90–98. doi: 10.3892/or.2016.4782. [DOI] [PMC free article] [PubMed] [Google Scholar]
- 32.Gong H, Cao Y, Han G, Zhang Y, You Q, Wang Y, Pan Y. p53/microRNA-374b/AKT1 regulates colorectal cancer cell apoptosis in response to DNA damage. Int J Oncol. 2017;50:1785–1791. doi: 10.3892/ijo.2017.3922. [DOI] [PubMed] [Google Scholar]
- 33.Fu H, Wang C, Yang D, Wei Z, Xu J, Hu Z, Zhang Y, Wang W, Yan R, Cai Q. Curcumin regulates proliferation, autophagy, and apoptosis in gastric cancer cells by affecting PI3K and P53 signaling. J Cell Physiol. 2018;233:4634–4642. doi: 10.1002/jcp.26190. [DOI] [PubMed] [Google Scholar]
- 34.Lumkwana D, du Toit A, Kinnear C, Loos B. Autophagic flux control in neurodegeneration: progress and precision targeting-where do we stand? Prog Neurobiol. 2017;153:64–85. doi: 10.1016/j.pneurobio.2017.03.006. [DOI] [PubMed] [Google Scholar]
- 35.Su Z, Yang Z, Xu Y, Chen Y, Yu Q. Apoptosis, autophagy, necroptosis, and cancer metastasis. Mol Cancer. 2015;14:48. doi: 10.1186/s12943-015-0321-5. [DOI] [PMC free article] [PubMed] [Google Scholar]
- 36.Feng AN, Zhang LH, Fan XS, Huang Q, Ye Q, Wu HY, Yang J. Expression of SIRT1 in gastric cardiac cancer and its clinicopathologic significance. Int J Surg Pathol. 2011;19:743–750. doi: 10.1177/1066896911412181. [DOI] [PubMed] [Google Scholar]
- 37.Zhang L, Wang X, Chen P. MiR-204 down regulates SIRT1 and reverts SIRT1-induced epithelial-mesenchymal transition, anoikis resistance and invasion in gastric cancer cells. BMC Cancer. 2013;13:290. doi: 10.1186/1471-2407-13-290. [DOI] [PMC free article] [PubMed] [Google Scholar]
- 38.Huang R, Xu Y, Wan W, Shou X, Qian J, You Z, Liu B, Chang C, Zhou T, Lippincott-Schwartz J, Liu W. Deacetylation of nuclear LC3 drives autophagy initiation under starvation. Mol Cell. 2015;57:456–466. doi: 10.1016/j.molcel.2014.12.013. [DOI] [PubMed] [Google Scholar]
- 39.Qiao L, Liang N, Zhang J, Xie J, Liu F, Xu D, Yu X, Tian Y. Advanced research on vasculogenic mimicry in cancer. J Cell Mol Med. 2015;19:315–326. doi: 10.1111/jcmm.12496. [DOI] [PMC free article] [PubMed] [Google Scholar]
- 40.Ding YP, Yang XD, Wu Y, Xing CG. Autophagy promotes the survival and development of tumors by participating in the formation of vasculogenic mimicry. Oncol Rep. 2014;31:2321–2327. doi: 10.3892/or.2014.3087. [DOI] [PubMed] [Google Scholar]


