Abstract
Biomechanical characterization of abdominal aortic aneurysms (AAAs) has become commonplace in rupture risk assessment studies. However, its translation to the clinic has been greatly limited due to the complexity associated with its tools and their implementation. The unattainability of patient-specific tissue properties leads to the use of generalized population-averaged material models in finite element analyses, which adds a degree of uncertainty to the wall mechanics quantification. In addition, computational fluid dynamics modeling of AAA typically lacks the patient-specific inflow and outflow boundary conditions that should be obtained by nonstandard of care clinical imaging. An alternative approach for analyzing AAA flow and sac volume changes is to conduct in vitro experiments in a controlled laboratory environment. In this study, we designed, built, and characterized quantitatively a benchtop flow loop using a deformable AAA silicone phantom representative of a patient-specific geometry. The impedance modules, which are essential components of the flow loop, were fine-tuned to ensure typical intraluminal pressure conditions within the AAA sac. The phantom was imaged with a magnetic resonance imaging (MRI) scanner to acquire time-resolved images of the moving wall and the velocity field inside the sac. Temporal AAA sac volume changes lead to a corresponding variation in compliance throughout the cardiac cycle. The primary outcome of this work was the design optimization of the impedance elements, the quantitative characterization of the resistive and capacitive attributes of a compliant AAA phantom, and the exemplary use of MRI for flow visualization and quantification of the deformed AAA geometry.
Keywords: aneurysm, biomechanics, Windkessel, optimization, magnetic resonance
1 Introduction
Abdominal aortic aneurysms (AAAs) are a vascular pathology of the abdominal aorta, which, upon rupture, have a mortality rate of up to 90% [1]. It is the 13th leading cause of death in the United States, resulting in approximately 11,000 deaths per year [2]. The pathogenesis of AAA is multifactorial and often combinatorial, ranging from mechanical weakening of the aortic wall to loss of smooth muscle cells and elastin [3]. Treatment options for AAA are limited to either a minimally invasive endovascular repair or an open surgical repair unless the patient is recommended to a surveillance program and followed every 6–12 months [4,5]. To improve the clinical management of AAA and make an informed decision on their rupture risk, extensive work has been done in the past two decades to identify a more scientifically sound rupture risk marker.
From a biomechanical perspective, peak wall stress (PWS) was found to be a better indicator of rupture risk compared to maximum diameter [6–8]. However, for the evaluation of PWS, simplifications are made to model the mechanical characteristics of the AAA wall [9], as these are never known on a patient-specific basis. To improve the accuracy of material models, structural parameters were used to characterize the underlying mechanobiology of AAA [10–14]. However, it was observed that PWS evaluated using finite element analysis (FEA) is sensitive to differences in the material model formulation [15,16]. Hence, there is need for an alternate method that can quantify patient-specific constitutive material models noninvasively or, conversely, minimize the use of constitutive material models as part of the AAA biomechanical evaluation. One way to implement this is by directly measuring volumetric changes of the AAA sac over a cardiac cycle since these implicitly bear information on the mechanical characteristics of the wall.
The temporal variation of intraluminal pressure over a cardiac cycle is associated with corresponding changes in AAA geometry. Thus, knowledge of both pressure and geometry at specific time points can provide a pathway to evaluate the material properties of the AAA wall. van Disseldorpet et al. [17] calibrated a patient-specific finite element AAA model using an iterative matching of the model output to the displacement data measured by 4D ultrasound. Wall motion evaluated using 4D image acquisition methods has also gained attention due to its importance in estimating vessel wall strain [18]. To validate these algorithms, it is important to develop robust in vitro circulation models, which can be imaged using the same 4D sequences used for patients in the clinic.
The objective of the current study was to design, build, and characterize a fully functional magnetic resonance imaging (MRI)-compatible benchtop flow loop using a deformable AAA phantom. Such a flow loop can be used to measure temporal changes of intraluminal pressure and AAA sac volume as a means to acquire the experimental data needed to validate a constitutive material model. While postulating a new AAA wall constitutive material model is not within the scope of this work, we describe the development of the flow loop, which mimics pathological pressure and flow conditions. Impedance modules were designed as a pair of Windkessel models, which play a central role in achieving the desired pressure waveform at a specific location within the AAA phantom. Different variations of Windkessel models have been used previously to characterize and represent the load endured by the heart and the systemic circulatory system [19–22]. The components of the Windkessel model are lumped parameter representations of arterial compliance, peripheral resistance, and the inertia of blood [23]. Manual adjustment of these components is time-consuming and might not always provide the most accurate and unique solution. An optimization algorithm that automates the design of impedance module components could improve the construction and implementation of in vitro flow loops. Such an algorithm was used to determine the values of the components in each Windkessel model. In addition, we used contrast-enhanced time-resolved MRI during a cardiac cycle to generate a series of images used to build the deformed configuration of the AAA phantom at each cardiac phase.
2 Materials and Methods
2.1 Benchtop Abdominal Aortic Aneurysm Flow Loop
2.1.1 Schematic and Components of the Flow Loop.
The flow loop was used to recreate a realistic pathological pressure waveform at the center of the AAA phantom. The silicone phantom was manufactured based on a patient-specific AAA (Vascular Simulations, LLC, Stony Brook, NY) using a proprietary injection molding technique. The length of the phantom, measured along the longitudinal (z) axis, was 14.5 cm from the neck to the bifurcation and 21 cm from the proximal to the distal end. The maximum AAA diameter was 6 cm measured along the plane perpendicular to the z-axis. The nonuniform wall thickness of the phantom ranged from 2.4 mm to 7.1 mm (mean of 4.7±0.4 mm). The reference pressure waveform, shown in Fig. S1, available in the Supplemental Materials on the ASME Digital Collection, was derived from Ref. [24] where a fluid-filled pig-tail catheter was used to measure pressure invasively within a human infrarenal AAA.
The schematic of the flow loop is presented in Fig. 1. We used the MRI-compatible CardioFlow 5000 MR programmable pump (Shelley Medical Systems, London, ON), which operates with a contrast-enhanced blood mimicking fluid (BMF—40% glycerin, 60% de-ionized water). The viscosity of the BMF was measured using a Brookfield LVD-I PRIME viscometer (Brookfield Engineering Laboratories, Inc., Mid-dleboro, MA) at 25.4 °C, resulting in a mean dynamic viscosity of 4.24 cP. The density of the BMF was measured at 1.2 g/cm3 and, hence, the kinematic viscosity was calculated as 3.53 cSt. The flowrate was specified by a flow waveform measured at the entrance of the abdominal aorta under resting conditions [25].
Fig. 1.
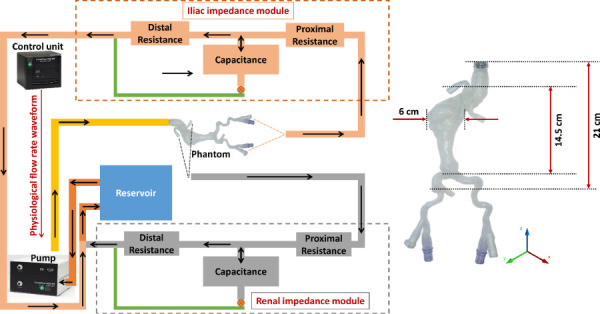
Schematic representing the benchtop flow loop built using the deformable silicone AAA phantom. The programmable pump supplies a physiological flow waveform to the AAA phantom, while the renal and iliac impedance modules recreate physiological impedance provided by the peripheral arterial system. This is experimental setup 4 described in Sec.2.2.3.2. The inset illustrates basic dimensions of the phantom.
The phantom has one inlet representing this entrance and two outlets representing the combined flow of the renal arteries and common iliac arteries, respectively. The ends of the phantom were secured within a custom-built housing (Regal Plastics, San Antonio, TX) and submerged entirely in contrast-enhanced BMF. The rationale for this is to provide the necessary contrast required to identify the lumen and outer wall boundaries of the phantom in the acquired MR images. While the physiological input flowrate is maintained by the pump, the target pressure waveform is achieved by placing an impedance module at each of the outlets. Each impedance module is represented by a 4-element Windkessel model consisting of inductance, capacitance, and resistance [22,23]. The output from the iliac and renal impedance modules drains into a custom-built reservoir (Regal Plastics, San Antonio, TX), which feeds back into the pump inlet.
2.1.2 The Windkessel Model.
The electrical components of the Windkessel model translate to specific functions representing the structural characteristics of the vasculature. The impedance module serves as the physical equivalent of the impedance offered by the systemic arterial system and blood motion to the heart. While inductance and resistance represent the geometric properties of the vessels, the capacitance represents the elasticity of the conduit arteries. In the frequency domain, represents the pressure, represents the volumetric flowrate, represents the impedance of the 4-element Windkessel circuit [26], and their functional relationship is given by Eqs. (1) and (2),
| (1) |
| (2) |
where is the proximal resistance, is the distal resistance, is the inductance, and is the capacitance. Using in vivo pressure and flow waveforms at the common iliac and renal arteries, an optimization script was written in MATLAB (The MathWorks, Inc., Natick, MA) based on the combination of a genetic algorithm and the Levenberg–Marquardt algorithm. Such was used to derive the corresponding impedance module parameters. The sum of and , calculated as the ratio between mean pressure and mean flowrate, was held constant and used as a constraint. The two parameters optimized were the capacitance and the ratio . The pressure pulse amplitude is controlled by both and , whereas changes in and yield a phase shift in the pressure waveform. To achieve a combination of the independent flow waveform and the target pressure waveform shown in Fig. 2, the impedance module parameters were derived using the optimization algorithms. To verify the accuracy of these parameters, they were substituted back into Eq. (2) to derive the predicted pressure waveform corresponding to the same input flow waveform. The L2 norm of the relative error between the target and predicted pressure waveforms was 1.97%. The optimization procedure, shown graphically in Fig. S2 (available in the Supplemental Materials on the ASME Digital Collection), was repeated for different combinations of flow and pressure waveforms, e.g., the flow waveform at the iliac arteries and the pressure waveform within the AAA, and flow waveform at the renal arteries and the pressure waveform within the AAA. This resulted in the optimized impedance module parameters for the iliac and renal impedance modules, respectively. Table 1 shows the values of the optimized parameters used in the construction of the module components.
Fig. 2.
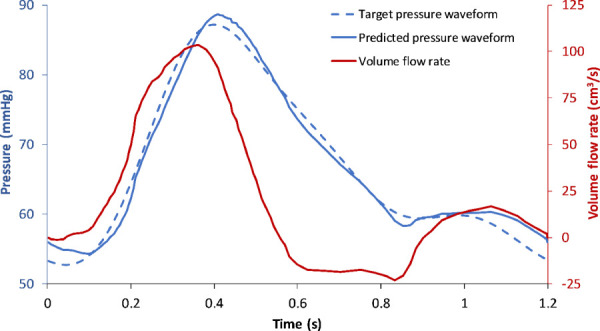
The in-house optimization algorithm outputs unique values of resistances and capacitance for the flowrate and target pressure waveforms. The predicted pressure waveform represents the resultant pressure calculated using these optimized values. The relative error between the target and predicted pressure waveforms was 1.97%.
Table 1.
Optimized values of impedance module components obtained from the optimization protocol
| Impedance component | Iliac module | Renal module |
|---|---|---|
| () | 0.032 | 0.032 |
| () | 0.463 | 0.484 |
| () | 0.144 | 0.048 |
| () | 5.786 | 12.097 |
For a fully developed, laminar flow of a Newtonian fluid through a horizontal tube of constant circular cross section under steady flow conditions, the resistance is calculated from the Hagen–Poiseuille formula. Therefore, the design of the resistance module is dependent on the dynamic viscosity of the working fluid (), the length of the tube (), and the inner radius of the tube (), in addition to maintaining a Reynolds number adequate to achieve laminar flow. A practical method to increase the resistance while maintaining laminar flow is to replace a single thin tube by a larger one that houses a set of capillary tubes. The mathematical validation of this method is presented in the work of Kung and Taylor [23].
2.1.3 Construction of the Module Components.
The basic design for the construction of the components of the impedance modules was adapted from Ref. [23]. The calculation of the design parameters for an exemplary resistance component is described as follows: From Table 1, the value of the optimized proximal resistance offered by the iliac impedance module is 0.463 mmHg⋅s/cm3. The functional portion of the resistance module consists of a set of capillary tubes tightly held inside a nylon tube. The module is enclosed by a three-dimensional (3D) printed encasing (MakerBot Replicator, MakerBot Industries LLC, Brooklyn, NY), with the conduits at the inlet and outlet designed to ensure laminar flow during the transition across the resistance module and the flow-loop tubing. The total resistance offered by “” capillary tubes of inner radius “” is given by . Given the proximal iliac resistance from Table 1 and for a standard capillary tube length of 0.1 m, Eq. (3) yields the optimum number of capillary tubes needed for this impedance module
| (3) |
For different values of that are characteristic of capillary tubes B200-156-10 (Sutter Instrument, Novato, CA), is calculated and rounded to the nearest integer. The outer radius of the capillary tubes was used in a circle packing algorithm to estimate the inner diameter of the nylon tube (Product No. 8628K59, McMaster-Carr, Elmhurst, IL). The conduit diameter, which corresponds to the outer diameter of the nylon tube, was used to verify that laminar flow conditions were satisfied at the connections between the resistance module and the flow-loop tubing. This protocol was repeated to fabricate the other three resistance modules used in the flow loop. An exemplary resistance module is shown in Fig. 3(a).
Fig. 3.
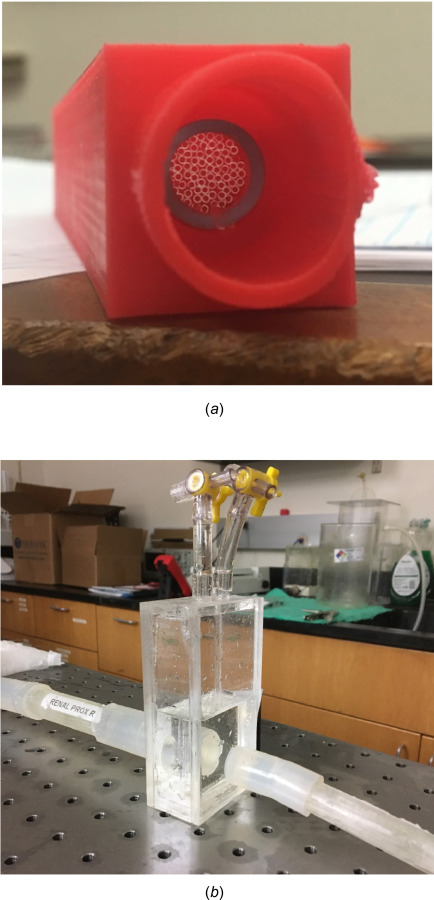
(a) A representative resistance module built as part of the Windkessel model. A set of capillary tubes inside a nylon tube housed in a custom 3D printed casing provides a constant resistance. (b) A capacitance module used in the flow loop; the volume of air trapped in the module determines its capacitance. The two ports on the top are used for pressure and volume control.
The capacitance component of the impedance module was built using Plexiglas sheets (Plastic Supply of San Antonio, San Antonio, TX), as shown in Fig. 3(b). The module consisted of a cuboid chamber with an inlet and an outlet on each side, along with two ports for adjusting the volume of air in the chamber and measuring pressure. The required capacitance was provided by trapping a calculated volume of air inside the capacitance module. The capacitance of a pocket of air is calculated using Eq. (4)
| (4) |
where is the reference volume, is the change in volume due to incoming fluid, and is the reference pressure. The inductance () is a property of the fluid and is calculated using Eq. (5) with the geometry of the fluid system (ℓ being the representative length of the fluid system and being the representative cross-sectional area of the fluid system) and the BMF density ()
| (5) |
2.2 Experimental Design.
The performance of the module components was tested individually and in combination with other components to validate the analytical calculations and design predictions.
2.2.1 Experimental Setup 1: Testing the Resistance Modules.
Four resistance modules were built: two proximal and two distal, one pair for each outlet. The resistance modules were isolated and tested individually in a loop at different flow rates. Steady flow rates were prescribed at the inlet of the resistance module, while the outlet of the resistance module was connected to the reservoir. The schematic of this setup is shown in Fig. 4(a). The pressure drop across the resistance module was calculated from the pressures measured at two locations immediately proximal and distal to the resistance module. The pressure was measured using a Mikro-tip SPR524 3.5F pressure catheter (Millar Inc., Houston, TX).
Fig. 4.
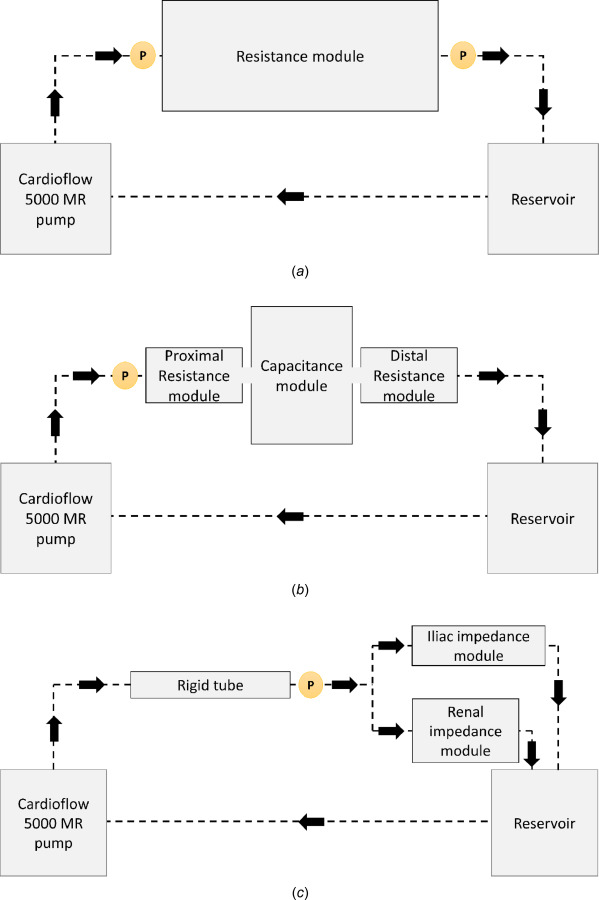
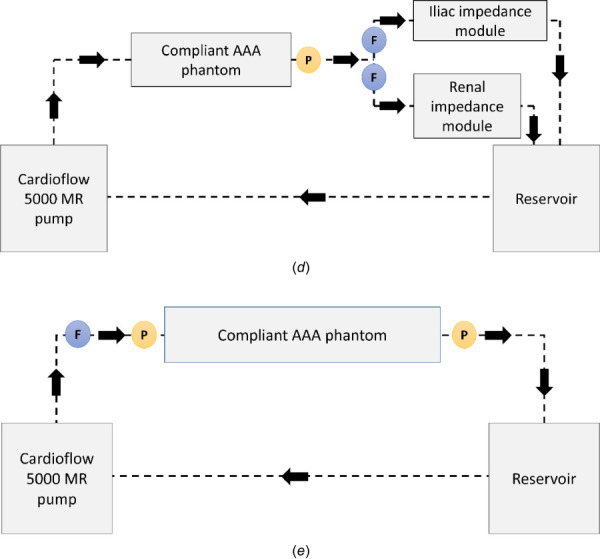
Schematic representing (a) experimental setup 1, which was used for characterizing the resistance modules; these provide constant resistance nearly identical to the value for which they were designed. (b) Experimental setup 2, which was used to characterize the impedance modules; these provide a proximal pressure waveform similar to the analytical solution for both iliac and renal modules. (c) Experimental setup 3, which shows a rigid tube instead of a (d) compliant phantom in the flow loop, as in Experimental setup 4. (e) Experimental setup 5, which was used to evaluate the impedance offered by the compliant AAA phantom. The circles with P and F indicate the location of the pressure probe and the flowrate sensor in the benchtop model.
2.2.2 Experimental Setup 2: Testing the Windkessel Model.
The iliac and renal impedance modules were tested individually in this setup. The proximal resistance, capacitance, and distal resistance modules were combined into a single impedance unit with short rigid connections between them. The flow waveform at the entrance of the iliac/renal impedance module was prescribed at the inlet. The volume of air trapped in the capacitance module at atmospheric pressure was adjusted to achieve the desired capacitance. The output from the distal resistance module was directed to the reservoir, which was then recirculated back through the pump. The schematic of this setup is presented in Fig. 4(b).
2.2.3 Experimental Setups 3–5: Testing the Effect of the Phantom.
The Windkessel model shows the effect of the downstream module components on the upstream pressure waveform for a specific flow waveform. Since the impedance module does not include components that take into account the properties of the phantom, the pressure waveform at the center of the AAA sac may vary according to the mechanical characteristics of the AAA wall.
2.2.3.1 Experimental setup 3.
A rigid phantom [23] should provide a baseline for characterizing the values of the impedance module components using the optimization algorithms. Hence, initially, a rigid wall tube whose diameter matched the equivalent diameter of the compliant AAA phantom at zero intraluminal pressure was used in the setup as illustrated in Fig. 4(c). Pressure was measured proximal to the impedance modules (i.e., distal to the rigid tube).
2.2.3.2 Experimental Setup 4.
The effect of a deformable phantom was studied by replacing the rigid tube with the compliant silicone AAA phantom as shown in the schematic of Fig. 4(d). The pressure waveform at the entrance to the impedance modules was compared to that obtained in experimental setup 3. Experimental setup 4 was later used with the MRI scanner to detect AAA wall motion and measured fluid velocity.
2.2.3.3 Experimental Setup 5.
To detect the true impedance properties of the phantom, the pump was connected directly to the phantom. The outlets of the phantom were drained into the reservoir bypassing all impedance modules along the flow-loop path, as shown in Fig. 4(e). Pressure measurements were taken at the entrance and exit of the phantom at varying steady flow rates. The resistance of the phantom was calculated for each flowrate. The measurement of compliance of the phantom in one cardiac cycle cannot be computed in a similar straightforward manner; this was addressed in Sec. 2.3.2.
2.3 Magnetic Resonance Imaging and Reconstruction
2.3.1 Imaging the Phantom in the Flow Loop.
The entire flow loop using experimental setup 4 was placed inside the bore of a 70 cm wide-bore 3.0 Tesla whole body MRI scanner (Phillips Ingenia 3.0T, Philips, Amsterdam, the Netherlands). Magnevist (Bayer Healthcare LLC, Whippany NJ; chemical name: gadopentetate dimeglumine; 469.01 mg/mL), a gadolinium-based contrast agent, was mixed with 12 L of BMF to reduce the relaxation time of the liquid and increase the signal to noise ratio. A human torso coil was placed on the housing containing the AAA phantom. Padding was used to eliminate any potential movement together with straps secured on either side of the scanner table. After acquiring a set of orthogonal scout images, static imaging was performed at zero pressure (with no fluid flow through the phantom) along the axial direction using the following pulse sequence: T1 3D (Echo time (TE): 4.05 ms, Repetition time (TR): 8.72 ms, Flip Angle: 8 deg, Number of signals averaged (NSA): 1, Echo Train Length 200, slice thickness: 1 mm, field of view: 180 mm). A 4D phase contrast MRI (PC-MRI) sequence was then utilized to acquire three-dimensional image sets with high contrast between the fluid and the wall at different time points (20 phases) in one cardiac cycle. Only the magnitude images of the 4D PC-MRI sequence were used; phase difference images were discarded. In addition, contrast-enhanced ECG gated time-resolved imaging was performed in the axial orientation using the following pulse sequence: TE: 2.61 ms, TR: 4.65 ms, Flip Angle: 15 deg, NSA: 2, Echo Train Length 1, slice thickness: 3 mm, field of view: 275 mm.
2.3.2 Image processing and Reconstruction.
Static images were used to obtain the zero-pressure configuration of the phantom. This is particularly useful since it is impossible to obtain the true zero-pressure geometry of human AAA. The contrast-enhanced images were segmented using AAAVASC (v.1.0.3, University of Texas at San Antonio, San Antonio, TX), which is an in-house segmentation and geometry quantification code written in MATLAB, to identify the lumen and outer wall surfaces of the phantom. The spatial distribution of wall thickness was evaluated from these images using AAAVASC. The image stacks obtained at each cardiac phase (viz., 20 phases) were reconstructed into 3D image volumes. These were subsequently segmented using a 3D marching cubes approach and reconstructed to fit a smooth, closed, manifold surface to the endoluminal surface. The volume contained in each of these luminal geometries and their corresponding pressures were evaluated from the AAA pressure waveform at time points matching each cardiac phase. Changes in pressure () and volume () were calculated between each pair of consecutive phases. Using these values, the corresponding variation of phase-to-phase compliance () was estimated using Eq. (6)
| (6) |
3 Results
3.1 Module Testing
3.1.1 Iliac and Renal Resistances.
The resistances (mean±SD) calculated from experimental setup 1 for all resistance modules are presented in Table 2 alongside the theoretical resistances based on which they were built. The resistances measured across different flow rates varying from 50 cm3/s to 150 cm3/s for the renal proximal resistance module are presented in Fig. S3, available in the Supplemental Materials on the ASME Digital Collection. As expected, the resistance does not vary as a function of the flowrate since laminar flow conditions were met for the operational flow rates. The maximum percentage variation between minimum and maximum resistances across these flow rates was 7.2%. The experiment was repeated for all resistance modules with similar results (not shown).
Table 2.
Comparison of experimental and theoretical values of resistance offered by the resistance modules
| Module | Theoretical () | Experimental () | Mean relative difference (%) |
|---|---|---|---|
| Iliac proximal resistance | 0.463 | 0.512 ± 0.019 | 10.5 |
| Iliac distal resistance | 5.786 | 5.835 ± 0.134 | 0.8 |
| Renal proximal resistance | 0.484 | 0.497 ± 0.007 | 2.6 |
| Renal distal resistance | 12.097 | 11.530 ± 0.381 | 4.7 |
3.1.2 Iliac and Renal Impedance Modules.
In experimental setup 2, the pressure measured at the entrance of the iliac impedance module under iliac flow conditions was compared to the theoretical prediction of pressure evaluated using Eqs. (1) and (2), and is presented in Fig. S4(a), available in the Supplemental Materials on the ASME Digital Collection. A similar validation was performed for the renal impedance module using the renal flow waveform input at the entrance to the renal module. The comparison of theoretically and experimentally measured renal pressure waveforms is shown in Fig. S4(b), available in the Supplemental Materials on the ASME Digital Collection.
3.1.3 The Rigid Tube and the Abdominal Aortic Aneurysm Phantom.
We studied the effect of the phantom mechanics on altering the pressure waveform proximal to the impedance modules. Using experimental setup 3, the pressure was measured at the entrance of the modules under normal abdominal aortic flow conditions. This waveform was then compared to the theoretical pressure waveform derived using Eq. (1) and shown in Fig. 5(a). The theoretical pressure waveform was calculated using the impedance module parameters, which were identified with the optimization algorithms. The key input to the algorithms was the “target” waveform adapted from Ref. [24]. Thus, the theoretical pressure waveform follows the target waveform closely. Using experimental setup 4, the pressure waveform at the entrance of the impedance module was compared to that obtained with experimental setup 3, as shown in Fig. 5(b). The difference between these pressure waveforms represents the combined effects of the differences in geometry and compliance of the phantom, relative to the rigid tube, on the AAA sac pressure. The impedance pertaining to the difference in pressure represents the total impedance offered by the compliant phantom. This can be obtained by deconvolution in the time domain using Eq. (1).
Fig. 5.
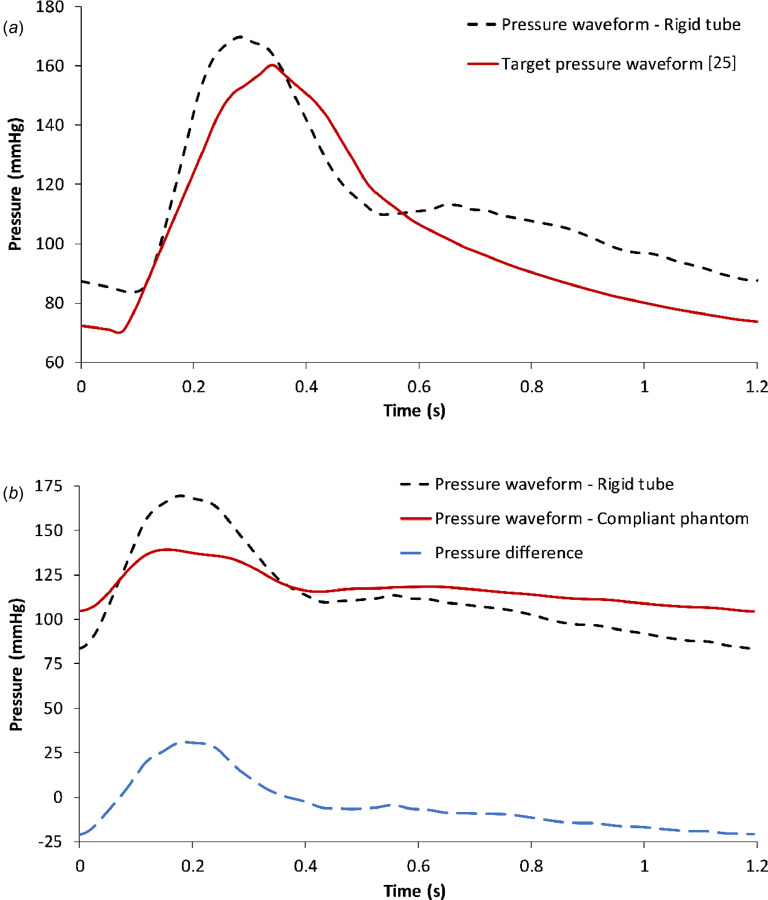
(a) Comparison between the target pressure waveform and the pressure waveform measured at the entrance of the impedance module in a rigid tube flow loop following experimental setup 3. (b) Pressure waveforms at the entrance of the impedance modules in flow loops with the rigid tube or the compliant phantom, following experimental setups 3 and 4, respectively. The difference in pressure waveforms represents the net impedance offered by the phantom.
3.2 Impedance properties of the Phantom.
We calculated the resistance across the phantom at each flowrate ranging from 20 cm3/s to 150 cm3/s, as illustrated in Fig. 6(a). It can be seen that this resistance is not constant but rather has a linear relationship with volume flowrate. The volume of the phantom and its corresponding intraluminal pressure as a function of time in one cardiac cycle are shown in Fig. 6(b). The combination of the resistive and capacitive attributes of the phantom has a greater effect on the pressure measured within the AAA sac compared to the individual contributions of phantom resistance and capacitance.
Fig. 6.
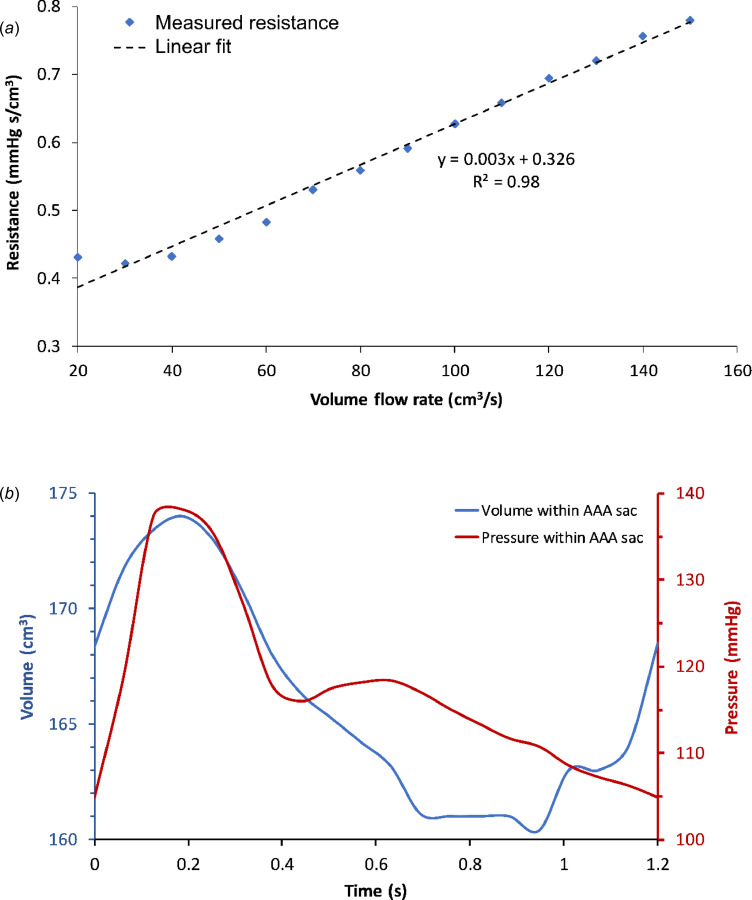
(a) Variation of resistance measured across the phantom for a range of constant flow rates. (b) Pressure and volume of the phantom over one cardiac cycle in the flow loop.
In experimental setup 5, a catheter placed at the entrance of the phantom measured the pressure waveform. This pressure and the flow waveforms were input to the optimization algorithm to calculate optimized resistance and capacitance values (Req = 0.49 mmHg⋅s/cm3; Ceq = 5.67 cm3/mmHg). Since this calculation assumes a constant resistance across the phantom over a cardiac cycle, they should be considered as the equivalent resistance and capacitance of the phantom, and thus cannot be used for impedance measurements.
3.3 Abdominal Aortic Aneurysm Hemodynamics.
The temporal evolution of the velocity field for a cardiac cycle was calculated using the PC-MR images, as illustrated in Fig. 7 for distinct phases of one period. The pulsating behavior of the flow can be observed by the change in magnitude of the velocity vectors from one phase to the next. Phases P0 through P18 form one period (1.2 s). Systolic acceleration spans P0–P4, systolic deceleration is represented by P6 and P8, and diastole spans P10–P18. During systole, the flow is approximately unidirectional with minimal recirculation. However, in late systole, vortex formation can be observed within the AAA sac. During diastole, secondary flow patterns become more prominent and the primary vortex breaks down into smaller vortices, causing a disturbed low-velocity flow pattern. In addition, during the transition from systole to diastole (phase P8), retrograde flow can be seen throughout the phantom.
Fig. 7.
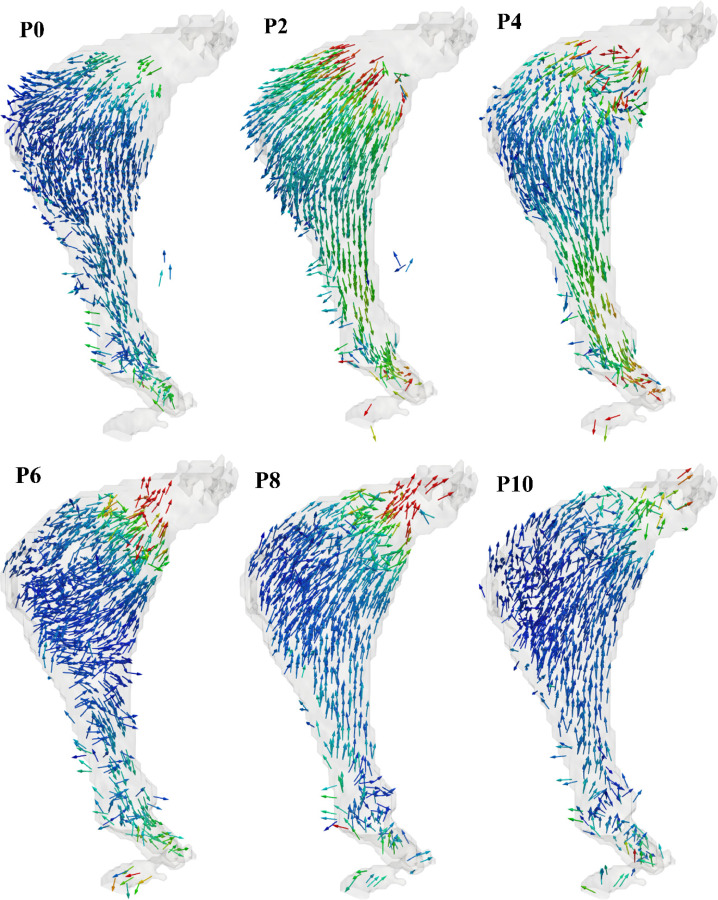
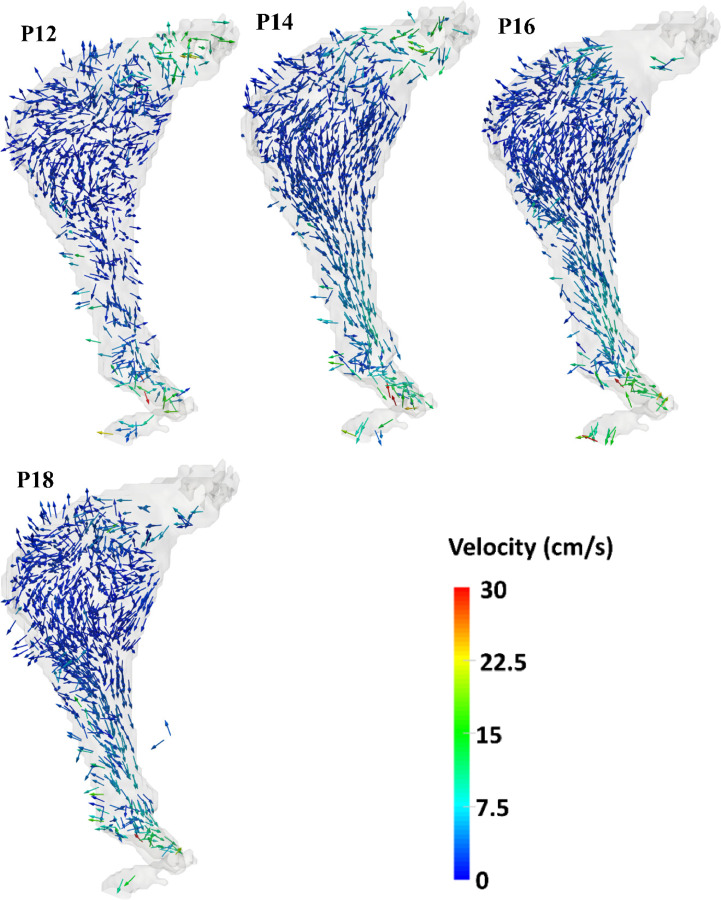
Temporal variation of the velocity field within the AAA phantom measured by phase-contrast MRI. Phases P0 through P18 correspond to ten of the twenty phases of the pulsatile cycle acquired during MR imaging.
4 Discussion
4.1 Benchtop Flow-Loop Design and Characterization.
The main contribution of this work is the development of a fully functional MRI-compatible benchtop flow loop using a patient-specific deformable AAA phantom under physiologically realistic pulsatile flow conditions. The potential applications for this flow loop span across different areas of cardiovascular research, ranging from noninvasive material property identification to measurement of realistic in vitro boundary conditions required for computational fluid dynamics [26,27] and fluid-structure interaction models. The addition of flow-dependent changes of the phantom's impedance properties in the Windkessel module, when studied in combination with pulse wave reflections, can potentially help understand in vivo mechanisms representing the overall causal and responsive mechanical behavior of AAA.
Using the design models proposed by Kung and Taylor [23] as the basis for constructing the module components, we substituted the exhaustive process of experimental trials with an optimization script written in MATLAB. The script replaces the process of trial and error in determining the values of impedance module components. The algorithms can be easily modified for any future variation of the Windkessel circuit, underscoring its potential for a variety of flow-loop experiments. Key data derived from the two sets of MR images correspond to the visualization of aortic wall motion and AAA hemodynamics, respectively. The use of the compliant phantom in the flow loop furthers our understanding of the effect of AAA wall mechanical characteristics on the aneurysmal hemodynamics by subsequent intraluminal pressure changes.
The differences between the theoretical and experimental pressure waveforms observed during testing of the impedance modules (Fig. S4 is available in the Supplemental Materials on the ASME Digital Collection) are likely due to an accumulation of minor variations in the experimental values of resistances and capacitances. For example, wave reflections at the connections between module components can dampen the waveforms and cause deviation from the analytical calculations. It should also be noted that the differences between the theoretical and experimental pressure waveforms are higher for low flow rates where the measurements are not as sensitive as for the high flow rates due to low signal to noise ratio. Impedance module testing was performed using different flow waveforms to investigate their consistency under different flow conditions. As seen from Fig. S4, available in the Supplemental Materials on the ASME Digital Collection, the close agreement between the analytical and experimental pressure waveforms for different flow conditions shows the stability of the modules.
4.2 Abdominal Aortic Aneurysm Structural and Flow Characteristics.
The study of the structural and functional mechanisms underlying AAA mechanics has been addressed using in vitro flow loops [28–33]. The temporal variation of AAA wall strain was investigated in a few of these setups with compliant AAA phantoms [32,33]. In these studies, strain was evaluated with area/radius based compliance changes, diametral strain, and pressure–diameter curves using idealized symmetric AAA phantoms. Wang et al. [33] performed cine-MRI of a symmetric AAA phantom and compared the circumferential strains derived from this imaging method to those evaluated using stereovision techniques. To the best of our knowledge, the present work represents the first attempt to address the temporal variation of AAA compliance while using a patient-specific deformable phantom.
In addition to the assessment of wall motion, we also quantified the fluid flow velocity within the AAA phantom. Earlier studies used laser Doppler velocimetry (LDV) to quantify the velocity of the flow field in rigid AAA phantoms [29,31]. With the use of compliant AAA phantoms with AP (anterior–posterior) asymmetry and imbalanced flow rates in the iliac branches, 3D flow visualization was accomplished using two-dimensional particle image velocimetry (PIV) measurements. An evaluation of vortex formation, vortex trajectory, vortex ring dynamics, and transition to turbulent flow was possible using this technique [30]. Basciano et al. [34] used a numerical model to demonstrate the combined effect of patient-specific geometry and particle hemodynamics (by means of particle residence times) on the onset of ILT. Activation of platelets in the vortex ring is followed by their subsequent deposition in the low wall shear stress regions inside the AAA sac. Therefore, assessing the patient-specific vortex ring propagation is important in AAA hemodynamics. Deplano et al. [35] evaluated the difference in flow fields while using rigid and compliant AAA models. The viscoelastic dissipation seen in compliant AAAs contribute to the cycle of converting kinetic energy to potential energy and vice versa. Kinetic energy is stored as potential energy by the expanding AAA during flow acceleration, whereas when the flow decelerates, the potential energy stored in the AAA walls contract the AAAs back again during reconversion into kinetic energy. This process leads to progression of vortices toward the distal end during the flow deceleration phase. Similarly, Yu et al. [36] explain the contribution of pulsatile flow toward nonlocalization of the vortex ring in AAAs. Unlike in steady flow conditions where the vortex ring is typically localized at the distal end of the AAA sac, under pulsatile flow conditions, it appears at the proximal site during early systolic phase, and then progresses toward the distal end through the cardiac cycle. Similar to the above observations in compliant AAAs subjected to pulsatile flow conditions, we observed that vortex formation at the proximal site in the AAA phantom during systole is followed by its progression toward the distal end during diastole. Collision of these vortices with the AAA wall at the distal end leads to high pressures and increased wall stresses. This has been attributed to higher compliance values of the AAAs in literature [35].
In this study, the spatio-temporal variation of 3D velocity vectors within the sac of a compliant patient-specific AAA phantom was quantified for the first time using 4D flow MRI. The quantitative characterization of the AAA phantom hemodynamics revealed that flow at the inlet and outlet typically exhibit higher velocities compared to the AAA sac (Fig. 7). High curvature and expansion of the aorta leading to the aneurysm sac yield flow separation, which in turn generates decreased convective transport compared to the proximal and distal ends of the phantom.
4.3 Limitations.
There are several important limitations to the research work described herein. The variable impedance offered by the deformable phantom was not included in the optimization algorithms. This may explain, in part, the differences between the experimental and theoretical intraluminal pressure waveforms measured within the AAA sac. Connections between different components of the flow loop can lead to minor pressure losses, which also affect the measured pressure waveform. Differences in the material properties of neighboring components may also contribute to these losses. Reflection of pulsatile waves from the connections and transitions were not taken into consideration to model the impedance module components. These reflections may dampen or amplify the wave by interference depending on the frequency of the wave and the distance from the reflection zones. The use of an elastomer to build the AAA phantom is an inherent limitation on the ability of this flow-loop design to represent actual AAA wall material properties. In addition, the phantom was devoid of a synthetic material representing the presence of intraluminal thrombus (ILT). It is expected that ILT may have further dampened the amplitude of the intraluminal pressure waveform measured within the AAA sac and added additional capacitance to the overall impedance of the phantom.
Supplementary Material
Acknowledgment
The authors have no conflicts of interest to disclose. Research funding was provided in part by American Heart Association Award No. 15PRE25700288 and National Institutes of Health Award No. R01HL121293. The content is solely the responsibility of the authors and does not necessarily represent the official views of the American Heart Association or the National Institutes of Health.
References
- [1]. Solomon, C. G. , and Kent, K. C. , 2014, “ Abdominal Aortic Aneurysms,” New Engl. J. Med., 371(22), pp. 2101–2108. 10.1056/NEJMcp1401430 [DOI] [PubMed] [Google Scholar]
- [2]. Jordan, W. D. , Alcocer, F. , Wirthlin, D. J. , Westfall, A. O. , and Whitley, D. , 2003, “ Abdominal Aortic Aneurysms in “High-Risk” Surgical Patients: Comparison of Open and Endovascular Repair,” Ann. Surg., 237(5), pp. 623–630. 10.1097/01.SLA.0000064397.28563.80 [DOI] [PMC free article] [PubMed] [Google Scholar]
- [3]. Kuivaniemi, H. , Ryer, E. J. , Elmore, J. R. , and Tromp, G. , 2015, “ Understanding the Pathogenesis of Abdominal Aortic Aneurysms,” Expert Rev. Cardiovasc. Ther., 13(9), pp. 975–987. 10.1586/14779072.2015.1074861 [DOI] [PMC free article] [PubMed] [Google Scholar]
- [4]. Valentine, R. J. , DeCaprio, J. D. , Castillo, J. M. , Modrall, J. G. , Jackson, M. R. , and Clagett, G. P. , 2000, “ Watchful Waiting in Cases of Small Abdominal Aortic Aneurysms–Appropriate for All Patients?,” J. Vasc. Surg., 32(3), pp. 441–450. 10.1067/mva.2000.108635 [DOI] [PubMed] [Google Scholar]
- [5]. Wilt, T. J. , Lederle, F. A. , MacDonald, R. , Jonk, Y. C. , Rector, T. S. , and Kane, R. L. , 2006, “ Comparison of Endovascular and Open Surgical Repairs for Abdominal Aortic Aneurysm,” Evidence Rep./Technol. Assess., 1(144), pp. 1–113.https://pubmed.ncbi.nlm.nih.gov/17764213/ [PMC free article] [PubMed] [Google Scholar]
- [6]. Fillinger, M. F. , Raghavan, M. L. , Marra, S. P. , Cronenwett, J. L. , and Kennedy, F. E. , 2002, “ In Vivo Analysis of Mechanical Wall Stress and Abdominal Aortic Aneurysm Rupture Risk,” J. Vasc. Surg., 36(3), pp. 589–597. 10.1067/mva.2002.125478 [DOI] [PubMed] [Google Scholar]
- [7]. Venkatasubramaniam, A. , Fagan, M. , Mehta, T. , Mylankal, K. , Ray, B. , Kuhan, G. , Chetter, I. , and McCollum, P. , 2004, “ A Comparative Study of Aortic Wall Stress Using Finite Element Analysis for Ruptured and Non-Ruptured Abdominal Aortic Aneurysms,” Eur. J. Vasc. Endovascular Surg., 28(2), pp. 168–176. 10.1016/j.ejvs.2004.03.029 [DOI] [PubMed] [Google Scholar]
- [8]. Vorp, D. A. , and Geest, J. P. V. , 2005, “ Biomechanical Determinants of Abdominal Aortic Aneurysm Rupture,” Aeterioscler., Thromb., Vasc. Biol., 25(8), pp. 1558–1566. 10.1161/01.ATV.0000174129.77391.55 [DOI] [PubMed] [Google Scholar]
- [9]. Raghavan, M. L. , and Vorp, D. A. , 2000, “ Toward a Biomechanical Tool to Evaluate Rupture Potential of Abdominal Aortic Aneurysm: Identification of a Finite Strain Constitutive Model and Evaluation of Its Applicability,” J. Biomech., 33(4), pp. 475–482. 10.1016/S0021-9290(99)00201-8 [DOI] [PubMed] [Google Scholar]
- [10]. Badel, P. , Avril, S. , Lessner, S. , and Sutton, M. , 2012, “ Mechanical Identification of Layer-Specific Properties of Mouse Carotid Arteries Using 3D-DIC and a Hyperelastic Anisotropic Constitutive Model,” Comput. Methods Biomech. Biomed. Eng., 15(1), pp. 37–48. 10.1080/10255842.2011.586945 [DOI] [PubMed] [Google Scholar]
- [11]. Fatemifar, F. , and Han, H.-C. , 2016, “ Effect of Axial Stretch on Lumen Collapse of Arteries,” ASME J. Biomech. Eng., 138(12), p. 124503. 10.1115/1.4034785 [DOI] [PMC free article] [PubMed] [Google Scholar]
- [12]. Holzapfel, G. A. , Gasser, T. C. , and Ogden, R. W. , 2000, “ A New Constitutive Framework for Arterial Wall Mechanics and a Comparative Study of Material Models,” J. Elasticity Phys. Sci. Solids, 61(1/3), pp. 1–48. 10.1023/A:1010835316564 [DOI] [Google Scholar]
- [13]. Mottahedi, M. , and Han, H.-C. , 2016, “ Artery Buckling Analysis Using a Two-Layered Wall Model With Collagen Dispersion,” J. Mech. Behav. Biomed. Mater., 60, pp. 515–524. 10.1016/j.jmbbm.2016.03.007 [DOI] [PMC free article] [PubMed] [Google Scholar]
- [14]. Holzapfel, G. A. , Gasser, T. C. , and Ogden, R. W. , 2004, “ Comparison of a Multi-Layer Structural Model for Arterial Walls With a Fung-Type Model, and Issues of Material Stability,” ASME J. Biomech. Eng., 126(2), pp. 264–275. 10.1115/1.1695572 [DOI] [PubMed] [Google Scholar]
- [15]. Maier, A. , Gee, M. , Reeps, C. , Pongratz, J. , Eckstein, H.-H. , and Wall, W. , 2010, “ A Comparison of Diameter, Wall Stress, and Rupture Potential Index for Abdominal Aortic Aneurysm Rupture Risk Prediction,” Ann. Biomed. Eng., 38(10), pp. 3124–3134. 10.1007/s10439-010-0067-6 [DOI] [PubMed] [Google Scholar]
- [16]. Rodríguez, J. F. , Martufi, G. , Doblaré, M. , and Finol, E. A. , 2009, “ The Effect of Material Model Formulation in the Stress Analysis of Abdominal Aortic Aneurysms,” Ann. Biomed. Eng., 37(11), pp. 2218–2221. 10.1007/s10439-009-9767-1 [DOI] [PMC free article] [PubMed] [Google Scholar]
- [17]. van Disseldorp, E. M. J. , Petterson, N. J. , Rutten, M. C. M. , van de Vosse, F. N. , van Sambeek, M. R. H. M. , and Lopata, R. G. P. , 2016, “ Patient Specific Wall Stress Analysis and Mechanical Characterization of Abdominal Aortic Aneurysms Using 4D Ultrasound,” Eur. J. Vasc. Endovascular Surg., 52(5), pp. 635–642. 10.1016/j.ejvs.2016.07.088 [DOI] [PubMed] [Google Scholar]
- [18]. Golemati, S. , Patelaki, E. , and Konstantina, S. N. , 2019, “ Image-Based Motion and Strain Estimation of the Vessel Wall,” Cardiovascular Computing—Methodologies and Clinical Applications (Series in BioEngineering), Golemati S. and Nikita K., eds., Springer, Singapore. [Google Scholar]
- [19]. Beggs, K. W. , 2015, “ Design of a Physical Windkessel Model for Use in LVAD In-Vitro Benchtop Modeling,” University of Central Florida, Orlando, FL, Report No. HIM 1990–2015.https://stars.library.ucf.edu/cgi/viewcontent.cgi?referer=&httpsredir=1&article=2853&context=honorstheses1990-2015
- [20]. Cappello, A. , Gnudi, G. , and Lamberti, C. , 1995, “ Identification of the Three-Element Windkessel Model Incorporating a Pressure-Dependent Compliance,” Ann. Biomed. Eng., 23(2), pp. 164–177. 10.1007/BF02368323 [DOI] [PubMed] [Google Scholar]
- [21]. Stergiopulos, N. , Westerhof, B. E. , and Westerhof, N. , 1999, “ Total Arterial Inertance as the Fourth Element of the Windkessel Model,” Am. J. Physiol.-Heart Circ. Physiol., 276(1), pp. H81–H88. 10.1152/ajpheart.1999.276.1.H81 [DOI] [PubMed] [Google Scholar]
- [22]. Westerhof, N. , Elzinga, G. , and Sipkema, P. , 1971, “ An Artificial Arterial System for Pumping Hearts,” J. Appl. Physiol., 31(5), pp. 776–781. 10.1152/jappl.1971.31.5.776 [DOI] [PubMed] [Google Scholar]
- [23]. Kung, E. O. , and Taylor, C. A. , 2011, “ Development of a Physical Windkessel Module to Recreate In Vivo Vascular Flow Impedance for In Vitro Experiments,” Cardiovasc. Eng. Technol., 2(1), pp. 2–14. 10.1007/s13239-010-0030-6 [DOI] [PMC free article] [PubMed] [Google Scholar]
- [24]. van‘T Veer, M. , Buth, J. , Merkx, M. , Tonino, P. , van den Bosch, H. , Pijls, N. , and van de Vosse, F. , 2008, “ Biomechanical Properties of Abdominal Aortic Aneurysms Assessed by Simultaneously Measured Pressure and Volume Changes in Humans,” J. Vasc. Surg., 48(6), pp. 1401–1407. 10.1016/j.jvs.2008.06.060 [DOI] [PubMed] [Google Scholar]
- [25]. Maier, S. , Meier, D. , Boesiger, P. , Moser, U. , and Vieli, A. , 1989, “ Human Abdominal Aorta: Comparative Measurements of Blood Flow With MR Imaging and Multigated Doppler US,” Radiology, 171(2), pp. 487–492. 10.1148/radiology.171.2.2649924 [DOI] [PubMed] [Google Scholar]
- [26]. Kung, E. O. , Les, A. S. , Medina, F. , Wicker, R. B. , McConnell, M. V. , and Taylor, C. A. , 2011, “ In Vitro Validation of Finite-Element Model of AAA Hemodynamics Incorporating Realistic Outlet Boundary Conditions,” ASME J. Biomech. Eng., 133(4), p. 041003. 10.1115/1.4003526 [DOI] [PMC free article] [PubMed] [Google Scholar]
- [27]. Kung, E. O. , Les, A. S. , Figueroa, C. A. , Medina, F. , Arcaute, K. , Wicker, R. B. , McConnell, M. V. , and Taylor, C. A. , 2011, “ In Vitro Validation of Finite Element Analysis of Blood Flow in Deformable Models,” Ann. Biomed. Eng., 39(7), pp. 1947–1960. 10.1007/s10439-011-0284-7 [DOI] [PMC free article] [PubMed] [Google Scholar]
- [28]. Ahamed, T. , Peattie, R. A. , Dorfmann, L. , and Cherry Kemmerling, E. M. , 2018, “ Pulsatile Flow Measurements and Wall Stress Distribution in a Patient Specific Abdominal Aortic Aneurysm Phantom,” ZAMM‐J. Appl. Math. Mech., 98(12), pp. 2258–2274. 10.1002/zamm.201700281 [DOI] [Google Scholar]
- [29]. Asbury, C. L. , Ruberti, J. W. , Bluth, E. I. , and Peattie, R. A. , 1995, “ Experimental Investigation of Steady Flow in Rigid Models of Abdominal Aortic Aneurysms,” Ann. Biomed. Eng., 23(1), pp. 29–39. 10.1007/BF02368298 [DOI] [PubMed] [Google Scholar]
- [30]. Deplano, V. , Meyer, C. , Guivier-Curien, C. , and Bertrand, E. , 2013, “ New Insights Into the Understanding of Flow Dynamics in an In Vitro Model for Abdominal Aortic Aneurysms,” Med. Eng. Phys., 35(6), pp. 800–809. 10.1016/j.medengphy.2012.08.010 [DOI] [PubMed] [Google Scholar]
- [31]. Egelhoff, C. J. , Budwig, R. S. , Elger, D. F. , Khraishi, T. A. , and Johansen, K. H. , 1999, “ Model Studies of the Flow in Abdominal Aortic Aneurysms During Resting and Exercise Conditions,” J. Biomech., 32(12), pp. 1319–1329. 10.1016/S0021-9290(99)00134-7 [DOI] [PubMed] [Google Scholar]
- [32]. Ene, F. , Gachon, C. , Delassus, P. , Carroll, R. , Stefanov, F. , O'Flynn, P. , and Morris, L. , 2011, “ In Vitro Evaluation of the Effects of Intraluminal Thrombus on Abdominal Aortic Aneurysm Wall Dynamics,” Med. Eng. Phys., 33(8), pp. 957–966. 10.1016/j.medengphy.2011.03.005 [DOI] [PubMed] [Google Scholar]
- [33]. Wang, Y. , Joannic, D. , Juillion, P. , Monnet, A. , Delassus, P. , Lalande, A. , and Fontaine, J.-F. , 2018, “ Validation of the Strain Assessment of a Phantom of Abdominal Aortic Aneurysm: Comparison of Results Obtained From Magnetic Resonance Imaging and Stereovision Measurements,” ASME J. Biomech. Eng., 140(3), p. 031001. 10.1115/1.4038743 [DOI] [PubMed] [Google Scholar]
- [34]. Basciano, C. , Kleinstreuer, C. , Hyun, S. , and Finol, E. A. , 2011, “ A Relation Between Near-Wall Particle-Hemodynamics and Onset of Thrombus Formation in Abdominal Aortic Aneurysms,” Ann. Biomed. Eng., 39(7), pp. 2010–2026. 10.1007/s10439-011-0285-6 [DOI] [PMC free article] [PubMed] [Google Scholar]
- [35]. Deplano, V. , Guivier-Curien, C. , and Bertrand, E. , 2016, “ 3D Analysis of Vortical Structures in an Abdominal Aortic Aneurysm by Stereoscopic PIV,” Exp. Fluids, 57(11), p. 167. 10.1007/s00348-016-2263-0 [DOI] [Google Scholar]
- [36]. Yu, S. C. M. , 2000, “ Steady and Pulsatile Flow Characteristics in Abdominal Aortic Aneurysm Models Using Particle Image Velocimetry,” Int. J. Heat Fluid Flow, 21(1), pp. 74–83. 10.1016/S0142-727X(99)00058-2 [DOI] [Google Scholar]
Associated Data
This section collects any data citations, data availability statements, or supplementary materials included in this article.


