

Abstract
Many epidemiologic studies use metabolomics for discovery-based research. The degree to which sample handling may influence findings, however, is poorly understood. In 2016, serum samples from 13 volunteers from the US Department of Agriculture’s Beltsville Human Nutrition Research Center were subjected to different clotting (30 minutes/120 minutes) and refrigeration (0 minutes/24 hours) conditions, as well as different numbers (0/1/4) and temperatures (ice/refrigerator/room temperature) of thaws. The median absolute percent difference (APD) between metabolite levels and correlations between levels across conditions were estimated for 628 metabolites. The potential for handling artifacts to induce false-positive associations was estimated using variable hypothetical scenarios in which 1%–100% of case samples had different handling than control samples. All handling conditions influenced metabolite levels. Across metabolites, the median APD when extending clotting time was 9.08%. When increasing the number of thaws from 0 to 4, the median APD was 10.05% for ice and 5.54% for room temperature. Metabolite levels were correlated highly across conditions (all r’s ≥ 0.84), indicating that relative ranks were preserved. However, if handling varied even modestly by case status, our hypotheticals showed that results can be biased and can result in false-positive findings. Sample handling affects levels of metabolites, and special care should be taken to minimize effects. Shorter room-temperature thaws should be preferred over longer ice thaws, and handling should be meticulously matched by case status.
Keywords: bias (epidemiology), metabolomics, preclinical handling, sample handling
Abbreviations
- APD
absolute percent difference
- IQR
interquartile range
- ND
normalized difference
- PF
probability of false-positive associations
Metabolomics, the simultaneous quantification of concentrations of hundreds or thousands of metabolites in a biological matrix (1), has become a versatile analytical technique capable of characterizing endogenous metabolism and exogeneous exposures (2, 3). Increasingly, epidemiologic studies have used metabolomics to investigate metabolism’s relationship to disease (4–8), and the number of studies has grown, as exemplified by the Consortium of Metabolomics Studies, a consortium of at least 47 cohort studies and more than 100,000 participants with metabolomics data (9). With the growing relevance of metabolomics to research has also come a pressing need to understand how preanalytical factors affect findings.
Preanalytical factors consist of those processes relating to collection, shipment, storage, and aliquoting of biological samples prior to analysis. Research studies aim to minimize their potential effects by standardizing handling, but in practice, such variability is never completely eliminated. Serum samples, for example, must stand for at least 30 minutes to clot, but actual time may vary depending on the duties of the attending nurse/technician. Additionally, samples are often stored in refrigerators for short durations prior to freezing, but length of storage depends on workflow. Finally, samples must be thawed prior to analysis and may experience variable temperatures and durations of thawing, particularly in large studies with many samples.
In the clinical context, preanalytical factors are known to substantially affect assay results: An estimated 60%–70% of diagnostic errors are attributed to mishandling (10). In comparison, effects of preanalytical factors on metabolomics analyses are less well understood. Several experimental studies showed that changes in preanalytical factors can cause increases/decreases of specific metabolites by less than 1%–60% (11–16). Other studies have found that metabolite levels (11, 17) or profiles (14, 18) are highly reproducible across handling conditions, suggesting little influence of handling method. These seemingly disparate conclusions complicate efforts to define the likely effects of sample handling on research results. Different conclusions may stem, in part, from the different metrics that investigators report, each of which only partly describes handling effects.
A further limitation of existing studies relates to how the researchers tested effects of thawing conditions. These studies showed that, for any duration, a warm thaw (e.g., at room temperature) affects metabolite levels more than a cold thaw (e.g., refrigerator thawing) (12, 13, 16, 18). However, warm thaws take less time, so this comparison is artificial and probably biased. A fairer comparison would be to thaw samples only for the exact minimum time needed for a given temperature. To our knowledge, no studies have compared warm thaws with cold thaws in this way. Most extant studies also examined fewer than 300 metabolites (12–16, 18, 19) and did not examine standing/clotting time (11, 14, 15, 17, 19).
To better characterize sample handling effects in a metabolomics analysis, we collected serum samples from 13 study participants, subjected the samples to various handling conditions (clotting and refrigeration time, number/temperature of thaws), and examined how each condition affected observed circulating levels of 600 or more metabolites given normal laboratory run procedures. To provide a full accounting of handling effects, we describe these in terms of 4 key metrics and elaborate upon their implications. We also tested minimum thawing times to provide a fairer comparison of warm thaws versus cold thaws than is currently available. Based in part on prior findings, we hypothesized that sample handling would affect serum metabolite levels and metabolite levels would still be highly correlated across handling conditions, but handling effects could nonetheless still induce false-positive findings under certain conditions.
METHODS
Pilot experiment
A key aim of our study was to compare effects of warm thaws with those of cold thaws when using minimum thawing time. However, we found no literature on how to estimate expected thawing times at different temperatures and undertook a pilot study. In this pilot study, we analyzed thawing time as a function of 4 sample volumes and 4 thawing temperatures (16 conditions). Samples were analyzed in duplicate for each condition (32 total). Vials were placed in racks in every other slot. Samples of each volume/temperature combination were allowed to stand upright, and start time was recorded. Samples were checked every 1 (24°C/30°C) or 2 (3.5°C/7°C) minutes for completeness of thawing until thaw was achieved, and the finish time was recorded.
Minimum thawing times for the 16 conditions are shown in Figure 1. The thaw at 7°C, intended to represent overnight thaws, showed that minimum thaw was achieved in less than 80 minutes for all volumes. The room temperature thaw (24°C) showed that, for all volumes, time to minimum thaw was less than 25 minutes. For 0.15-mL aliquots and minimum thaws, ice thaws (3.5°C) were approximately 50 minutes in length and room temperature thaws were about 10 minutes. We used these data to guide selection of thawing times for subsequent experiments.
Figure 1.

Time to minimum thaw according to serum sample volume and thaw temperature in a study of sample handling conditions and the serum metabolome (pilot study), Beltsville Human Nutrition Research Center (US Department of Agriculture), 2015. Each line represents a distinct thaw temperature, and triangles represent the thawing times of individual samples (16 total conditions analyzed in duplicate).
Study population
The study participants consisted of 13 volunteers aged 20–65 years who had a body mass index (weight (kg)/height (m)2) between 18.5 and 35.0 and were not ill at the time of blood collection. Participants completed a short questionnaire and donated blood at the Beltsville Human Nutrition Research Center, US Department of Agriculture (Beltsville, Maryland), in 2016. Participants were not required to fast, and the blood draw occurred at roughly the same time on the same day for all participants.
The study protocol was reviewed and approved by the Medstar Health Research Institute’s institutional review board (Clinicaltrials.gov identification number NCT02697500).
Sample collection and processing
As Figure 2 outlines, 28 combinations of experimental conditions were analyzed for each participant. Including quality control samples, 416 samples were analyzed ((13 participants × 28 combinations of conditions) + (13 participants × 4 repeated quality control samples)). We collected approximately 17 mL of blood from each participant in a serum separator tube and split that into two 8.5-mL serum separator tubes. Tubes were inverted 5 times immediately after drawing and allowed to stand upright to clot. Samples were subsequently processed and split into 0.15-mL aliquots.
Figure 2.

Experimental conditions for the serum samples of each participant in a study of sample handling conditions and the serum metabolome, Beltsville Human Nutrition Research Center (US Department of Agriculture), 2016. A) 30 minutes of clotting time; B) 120 minutes of clotting time. Each square represents a single sample, and the duplicate samples comprised the quality controls. Initial sample tube volumes were 8.5 mL, and then samples were processed in 0.15-mL aliquots. The experimental conditions for both clotting times with 0 hours in the refrigerator and 0 thaws had an additional 2 quality control samples. Ice thaws were implemented at 3.5°C for 50 minutes. Refrigerator thaws were implemented at 4°C–7°C for 16 hours and were explicitly designed not to be minimum thaws. Room temperature thaws were implemented at 24°C for 10 minutes.
Overall, we examined 4 experimental conditions: 1) clotting time (30 minutes or 120 minutes), 2) postprocessing refrigeration time (0 minutes or 24 hours), 3) number of thaws (0, 1, or 4 thaws), and 4) thawing temperature (thawing on ice, in a refrigerator, or at room temperature).
The first condition, clotting time, entailed allowing the 8.5-mL serum separator tubes to stand for different periods of time before processing. One tube was allowed to clot for 30 minutes, and the other for 120 minutes. After processing, the sample set from each clotting group was further split into 2 groups to examine refrigeration time (condition 2). The 0-minute refrigeration group was immediately frozen in liquid nitrogen and stored at −80°C. The remaining samples were stored in the refrigerator for 24 hours, then frozen in liquid nitrogen and stored at −80°C.
One week after processing and freezing of samples, we conducted freeze-thaw experiments to examine the effects of number of thaws (condition 3) and temperature (condition 4). For samples that were part of the 1- or 4-thaw condition, each freeze-thaw cycle consisted of a thaw, thorough mixing by vortex, and a return to −80°C. The time between individual freeze-thaw cycles was 1 week. The samples were thawed on ice (3.5°C) for 50 minutes (minimum thaw), thawed in the refrigerator (4°C–7°C) for 16 hours (not minimum thaw—intended to reflect the normal practice of overnight thawing), or thawed at room temperature (24°C) for 10 minutes (minimum thaw). For thawing, samples were placed in racks at the specified temperature with every other space unoccupied to prevent unequal thawing at the center. Samples that were part of the 0-thaw condition remained in storage. During the entire freeze-thaw process, samples were contained in sealed cryovials.
We defined the gold-standard set of handling conditions as 30 minutes of clotting, 0 minutes of refrigeration, and 0 thaws.
Laboratory assays
After performing all experimental manipulations, we shipped frozen samples to Metabolon Inc. (Durham, North Carolina) for extraction and metabolic profiling. Metabolon used Q-Exactive (Thermo Fisher Scientific, Inc., Waltham, Massachusetts) ultrahigh-performance liquid chromatography–mass spectrometry and gas chromatography–mass spectrometry, also referred to as the high-resolution accurate mass platform. Raw data were extracted, peaks were identified, and quality control was processed on the platform as previously described (20, 21). Samples were arranged in batches of 32. All samples for each participant were analyzed in a single batch, and each batch included 3–5 blinded duplicate quality control samples from the participant.
Metabolon quantified levels of 722 metabolites, of which 628 metabolites (metabolite metadata are shown in Web Table 1, available at https://academic.oup.com/aje) were present in more than 80% of samples (531 metabolites were present in more than 95% of samples), the criterion we set for inclusion. Values deemed to be below the limit of accurate detection were assigned the minimum value above that limit (22–24). The median correlation between duplicate gold-standard condition samples was 0.89, similar to prior studies (25, 26). Levels were log-transformed for analysis. Metabolite levels, on the original scale and transformed, are given in Web Table 2 (parts A and B).
Statistical analysis
We performed principal components analysis and plotted samples by their first 2 principal component scores (Web Figure 1). We identified 2 samples as outliers and removed them from further analyses.
We used 4 metrics to assess sample handling effects on circulating metabolite levels: absolute percent difference (APD), normalized difference (ND), correlation (r), and expected number of false-positive associations. We characterized the distributions of the first 3 metrics by their median value and interquartile range (IQR).
The first metric was the APD, which measured the relative difference in metabolite levels when changing 1 condition while holding the others constant. Specifically, we defined APD for increasing clotting time from c = 30 minutes to c = 120 minutes:
 ,where Yij(c,f,t) is the observed level (Y) of metabolite j in participant i for a specified clotting time (c), refrigeration time (f), and thaw conditions (t). We divided by 182 (13 × 14 = 182) to average the APD over all conditions and subjects. We formally tested whether the effects of handling conditions were statistically significant. For each subject, we calculated the average difference across all conditions (i.e., APDij) and then obtained a P value from a 1-sample t test evaluating whether those 13 values had a mean of 0.
We also assessed APD categorized by metabolite superpathway, defined using the Kyoto Encyclopedia of Genes and Genomes (KEGG) pathway database (27). We examined distributions of APD over metabolites within superpathways. The superpathways used were xenobiotics (e.g., caffeine), amino acids (e.g., creatinine), lipids (e.g., cholesterol), and “other.” For the “other” superpathway, we combined pathways with fewer than 30 metabolites, which included carbohydrates (e.g., glucose), cofactors and vitamins (e.g., bilirubin), energy (e.g., phosphate), nucleotides (e.g., urate), and peptides (e.g., glycylvaline).
Our second metric was the ND, which is the relative effect of changing a condition compared with the between-individual variability. By benchmarking sample handling effects relative to between-individual variability, the ND is more closely related to the ability to detect associations. We determined the ND using linear mixed models (i.e., log(metabolite) levels as a function of the experimental conditions), with study participant as the random effect and the experimental conditions (clotting, refrigeration, thawing conditions) as fixed effects. For example, we defined the ND for comparing the 2 clotting times to be
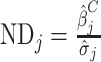 ,where βj measured the mean difference in log-levels between the 2 clotting conditions (e.g., 30 minutes vs. 120 minutes) and σj2 measured the between-individual variability.
The third metric was the correlation, r, and it determined whether, even in the presence of an absolute change, the ordering of the samples was similar for 2 conditions. For each metabolite, we estimated the correlation between the 2 conditions when the other conditions were set to ideal states (i.e., 30 minutes of clotting, 0 minutes of refrigeration, and 0 thaws). As a benchmark, we compared observed correlations with the correlation between duplicates under gold-standard conditions. It is important to note this gold-standard correlation represents, in theory, an upper bound for other correlations—that is, the limit of what can be observed given baseline laboratory error.
Our fourth metric, the expected number of associations, measured the potential effects on research results when samples are not completely handled consistently. To evaluate this, we constructed a hypothetical case-control study with 1,000 cases, 1,000 controls, and examination of 1,000 metabolites. We varied the proportion of handling conditions between cases and controls. Two of the scenarios were designed to be “realistic” and involved assigning 1% and 5% of cases to an alternate handling condition while controls were all assigned the set of gold-standard conditions. Such discrepancies could occur in a prospective study due to modest bias in handling or, alternately, if case:control matching criteria allowed prior thaws for cases so investigators could exploit previously measured biomarkers (e.g., genomewide association study data). Two scenarios were less realistic, where 25% and 100% of cases were assigned alternate handling conditions. An example could be a case-control study in which case samples collected in a clinical setting are left standing too long because the attending nurse/technician has other priorities, while control samples collected at home are promptly put on ice after clotting, since the attending nurse/technician has few competing obligations during the visit. Using estimates from above, along with standard deviations, we estimated the number of false-positive associations observed.
For each metabolite, we estimated the probability of false-positive associations (PF) as the probability that a hypothetical case-control study, which treated a fraction, π, of the cases and controls differently, would falsely declare that a metabolite was significantly associated with the outcome. We then approximated the PF for clotting time by
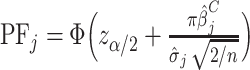 ,where zα/2 is the α/2 quantile for the standard normal distribution, Φ is the cumulative distribution for the standard normal distribution,
  and
and  are estimates from the linear mixed model, and n (n = 1,000) represents the number of individuals in each arm. We then estimated the expected number of false-positive associations by
  , where
  is the average of PFj over all 628 measured metabolites from our study and 1,000 is the number of metabolites in our hypothetical case-control study.
Because of our small study size, we employed bootstrapping methods (28, 29) to obtain bias-adjusted estimates and correct the distribution of effects (Web Tables 3 and 4). However, such bias adjustments did not substantially affect the results.
Analyses were performed in R, version 3.5.1 (R Foundation for Statistical Computing, Vienna, Austria), and SAS, version 9.4 (SAS Institute Inc., Cary, North Carolina).
RESULTS
Thirteen volunteers (7 females and 6 males) were recruited (Table 1, Web Table 2). More than three-quarters of the participants were ≥30 years of age, and the majority were overweight/obese. One participant identified as a smoker, while more than half reported medication use. A majority of participants reported having consumed coffee and nutritional supplements during the 48 hours prior to questionnaire completion, whereas fewer than one-third reported alcohol consumption.
Table 1.
Characteristics of Volunteers in a Study of Sample Handling Conditions and the Serum Metabolome, Beltsville Human Nutrition Research Center (US Department of Agriculture), 2016
| Characteristic |
No. of Persons |
% a |
|---|---|---|
| Age, years | ||
| <30 | 3 | 23.1 |
| 30–55 | 5 | 38.5 |
| >55 | 5 | 38.5 |
| Sex | ||
| Male | 6 | 46.2 |
| Female | 7 | 53.9 |
| Body mass indexb | ||
| 18.5–24.9 | 6 | 46.2 |
| 25.0–29.9 | 4 | 30.8 |
| ≥30.0 | 3 | 23.1 |
| Current smoking | 1 | 7.7 |
| Alcohol consumptionc | 4 | 30.8 |
| Coffee consumptionc | 9 | 69.2 |
| Current medication use | 7 | 53.9 |
| Nutritional supplement usec | 7 | 53.9 |
a Percentages may not sum to 100 because of rounding.
b Weight (kg)/height(m)2.
c Within the last 48 hours.
For our first metric, we evaluated APD, the absolute percentage difference in metabolite levels when a single condition varied (Table 2; complete results are given in Web Table 5 (parts A–I)). When extending clotting time from 30 minutes to 120 minutes, we estimated the “median effect” across metabolites as 9.08% (IQR, 3.44–19.83). When increasing refrigeration time from 0 minutes to 24 hours, the median effect was 4.75% (IQR, 1.99–10.36). Finally, when increasing the number of thaws from 0 to 4, the median effects for ice, refrigerator, and room temperature thaws were 10.05% (IQR, 4.40–18.69), 7.25% (IQR, 3.05–16.28), and 5.54% (IQR, 2.94–9.85). Notably, room temperature thaws performed much better than expected. Metabolites of clinical significance showed some vulnerability to handling conditions as well—for example, cholesterol (2.49%–26.79%), glucose (0.28%–24.35%), lactate (1.12%–108.90%), and thyroxine (4.45%–30.69%). Although we did not aim to identify statistically significant effects for individual metabolites, many individual findings were nonetheless significant (Web Table 6). We found that 5.06% of P values (n = 31 metabolites) were below the Bonferroni-corrected level of significance (α = 7.96e-5) when testing effects of clotting time, 3.16% (n = 19) were below that level for refrigeration time, and 4.78% (n = 30) were below it for 4 refrigerator thaws. If one were using more liberal significance thresholds, the percentage of t tests identified as significant would substantially increase.
Table 2.
Median (and Interquartile Range) Absolute Percent Difference and Normalized Difference in Serum Metabolite Levels From Altering a Single Sample Handling Condition, as Well as Estimated Correlations Between Metabolite Levels Under 2 Conditions, Beltsville Human Nutrition Research Center (US Department of Agriculture), 2016
| Comparison | Difference in Serum Metabolite Levels |
Correlation (r)a |
|
|---|---|---|---|
| APD | ND | ||
| Clottingb | 9.08 (3.44–19.83) | 0.101 (0.032–0.257) | 0.87 (0.68–0.96) |
| Refrigerationc | 4.75 (1.99–10.36) | 0.056 (0.019–0.143) | 0.85 (0.67–0.96) |
| Thawingd | |||
| 1 thaw | |||
| On ice | 4.74 (1.85–9.89) | 0.048 (0.016–0.118) | 0.89 (0.74–0.96) |
| In refrigerator | 6.04 (2.32–13.56) | 0.062 (0.019–0.160) | 0.88 (0.75–0.96) |
| At room temperature | 4.65 (1.79–10.12) | 0.062 (0.024–0.142) | 0.86 (0.67–0.96) |
| 4 thaws | |||
| On ice | 10.05 (4.40–18.69) | 0.101 (0.038–0.237) | 0.85 (0.67–0.95) |
| In refrigerator | 7.25 (3.05–16.28) | 0.099 (0.038–0.247) | 0.84 (0.63–0.94) |
| At room temperature | 5.54 (2.94–9.85) | 0.088 (0.042–0.166) | 0.91 (0.78–0.97) |
Abbreviations: APD, absolute percent difference; IQR, interquartile range; ND, normalized difference.
a Duplicate gold standard (30 minutes of clotting, 0 minutes of refrigeration, and 0 thaws): r = 0.89 (IQR, 0.72–0.96).
b 30 minutes of clotting vs. 120 minutes of clotting.
c 0 minutes of refrigeration vs. 24 hours of refrigeration.
d Compared with 0 thaws.
We also assessed APD according to metabolite superpathway (Figure 3). For nearly all conditions, effects were smallest for xenobiotics, intermediate for amino acids and lipids, and highest for “other” metabolites. Similarly, the range of effects (5th–95th percentiles) was smallest for xenobiotics, intermediate for amino acids and lipids, and large for “other” metabolites. For example, when considering 4 refrigerator thaws, the APD ranged from 0.4% to 14% for xenobiotics, from 0.6% to 34% for lipids, from 0.6% to 74% for amino acids, and from 1.1% to 100% for “other” metabolites.
Figure 3.

Box plots showing the median (and interquartile range) absolute percent difference in metabolite levels for each of 8 different experimental conditions in a study of sample handling conditions and the serum metabolome, by metabolite superpathway, Beltsville Human Nutrition Research Center (US Department of Agriculture), 2016. Median values (horizontal lines) represent the change in the median metabolite level as sorted by absolute percent difference; for example, for amino acids, the metabolite at the median of the refrigeration distribution is hydantoin-5-propionic acid, with a 4.04% absolute difference. “Other” superpathways include carbohydrate (n = 21), cofactors and vitamins (n = 20), energy (n = 11), nucleotide (n = 28), and peptide (n = 24).
For the second metric, we evaluated the ND obtained by altering 1 condition (Table 2; complete results are given in Web Table 7 (parts A–I)). When extending clotting time from 30 minutes to 120 minutes, we estimated the median effect as 0.101 standard deviations (IQR, 0.032–0.257). When increasing refrigeration time from 0 minutes to 24 hours, the median effect was 0.056 standard deviations (IQR, 0.019–0.143). When switching from 0 thaws to 4 ice thaws, the median effect was 0.101 standard deviations (IQR, 0.038–0.237). Other thawing temperatures and fewer than 4 thaws had less pronounced effects. Although it was not an aim of our study, we identified several metabolites that could potentially be indicators of sample handling: adenosine, azelaic acid, bilirubin (E,E)*, glycylvaline, and suberic acid (Web Table 7).
For our third metric, we evaluated f for comparisons of metabolite levels under gold-standard conditions versus when a single condition varied (Table 2; complete results are given in Web Table 8). Duplicate gold-standard samples had a median correlation of 0.89 (IQR, 0.72–0.96), which was the expected ceiling for observed correlations in this analysis given normal measurement error. When comparing clotting times of 30 minutes and 120 minutes, we found the median f value to be 0.87 (IQR, 0.68–0.96). When comparing refrigeration times of 0 minutes and 24 hours, we observed the median f to be 0.85 (IQR, 0.67–0.96), and for 0 and 4 refrigerator thaws, the median f was 0.84 (IQR, 0.63–0.94). Since correlations did not substantially decrease across conditions, there appears to be little loss in signal provided that handling is 100% consistent for all samples.
Finally, we estimated our fourth metric, the number of false-positive associations that result when applying counterfactual changes in sample handling to our hypothetical case-control study (Table 3). We found that even modest changes in sample handling can markedly increase the number of research findings that are false-positive results. For example, in a scenario where 5% of cases and 0% of controls have undergone 1 ice thaw, we estimated that 12 false-positive associations would be observed. For any scenario, if the number of true-positive associations was less than 20, the rate of true-positive results could ultimately be low (e.g., <50%).
Table 3.
Estimated Number of False-Positive Associationsa for Each of 8 Experimental Conditions in a Hypothetical Study of Sample Handling Conditions and the Serum Metabolome, Beltsville Human Nutrition Research Center (US Department of Agriculture), 2016
| Condition | Proportion of Case and Control Samples Handled Differently | |||
|---|---|---|---|---|
| 0.01 | 0.05 | 0.25 | 1.00 | |
| Clottingb | —c | 21 | 111 | 216 |
| Refrigerationd | 1 | 17 | 86 | 217 |
| Thawinge | ||||
| 1 thaw | ||||
| On ice | — | 12 | 181 | 447 |
| In refrigerator | — | 22 | 205 | 459 |
| At room temperature | — | 12 | 170 | 375 |
| 4 thaws | ||||
| On ice | — | 54 | 381 | 688 |
| In refrigerator | 3 | 41 | 196 | 386 |
| At room temperature | — | 8 | 92 | 244 |
a Calculated using sample handling variability, 1,000 cases/1,000 controls, 1,000 metabolites, and a Bonferroni-adjusted α value.
b 30 minutes of clotting vs. 120 minutes of clotting.
c A dash indicates that less than 1 metabolite would be classified as false-positive.
d 0 minutes of refrigeration vs. 24 hours of refrigeration.
e Compared with 0 thaws.
DISCUSSION
In this sample handling study, each condition that we tested affected serum metabolite levels. We quantified these effects for 628 metabolites and ranked each metabolite by its potential to yield biased associations in epidemiologic research. We further corroborated prior reports showing, somewhat surprisingly, that samples with suboptimal handling can yield metabolite-disease associations like those of ideally handled samples, if handling is 100% consistent. However, we also deconstructed this simplistic model of 100% handling consistency—an ideal rarely achieved in epidemiologic research—and showed that even minor departures from 100% consistency can cause substantially biased results. A complete index of handling effects is available in Web Tables 5, 7, and 8 and features results for metabolites of clinical interest (e.g., cholesterol) as well as metabolites of specialist interest (e.g., dietary biomarkers for nutritional epidemiologists).
Our finding that all sample handling conditions affected circulating metabolite levels was broadly similar to what prior investigators have reported (12–14, 16, 18), though we tested more conditions and more metabolites than most of those studies. In general, handling effects were most pronounced for clotting time and 4 thaws on ice and in the refrigerator. The effects were modest for a majority of metabolites (<10% change for 66% of comparisons) but substantial for some (>40% change for 4% of comparisons). For metabolites measured in clinical chemistry, such as glucose or cholesterol, even modest handling effects could result in misdiagnoses.
Because the impact of sample handling on epidemiologic associations depends not just on sample handling effects but also on the degree of variability between individuals (akin to the intraclass correlation coefficient and its link with effect size (30)), we further calculated a measure of handling effects that benchmarks sample handling effects to between-individual variability and ranked metabolites according to this measure. Through this, we identified a subset of metabolites that may be particularly indicative of past sample handling—namely adenosine, azelaic acid, bilirubin (E,E)*, glycylvaline, and suberic acid. Such metabolites could help researchers identify the handling history of biospecimens and/or flag biased results. Few studies have attempted to identify sample handling indicators, and none have been validated for population research (11, 13–17, 31). Future studies should test the performance of the sample handling indicators we identified under conditions typical of epidemiologic studies.
Like 2 prior studies, we found that metabolite values correlated highly across different handling conditions (11, 17), with most correlations being greater than 0.85. This finding indicates that, even if sample handling affects metabolite levels, relative ranks are preserved across conditions (Web Figure 2). Given that most epidemiologic analyses of metabolomics data are done on relative concentrations, this finding further implies that observed associations may be similar across handling conditions, even if handling is suboptimal. This assumes 100% consistent handling, however—which is rarely, if ever, achieved in large study populations.
To our knowledge, our study was the first to evaluate the potential biases that could result from inconsistent handling, and our results were sobering: Even trivial inconsistencies in handling by case status could yield many false-positive associations, making it difficult to discern signal from noise among significant results. For example, when 5% of cases are handled differently than controls, the number of false-positive associations detected can be as high as 54. This number may seem high given modest average effects of sample handling, but false-positive associations are driven by the subset of metabolites with large handling effects. These results may be especially problematic and accumulate rapidly in case-control settings, especially in studies where handling may be differential by case status (e.g., where case and control samples are collected by different technicians or at different locations) or where specimens are collected after some participants have been identified as cases.
We extended prior studies by delving deeper into the 2 components of thawing conditions, time and temperature. Our study evaluated effects of thawing temperatures using a “minimum thaw,” which provides a more equitable comparison of thawing temperature than was used in existing studies. We found, surprisingly, that room temperature thaws outperformed ice and refrigerator thaws in terms of minimizing effects on metabolite levels. Overall, the main factor affecting metabolite levels appeared to be the duration of the thaw. This suggests that the overnight thaws used by many laboratories may be excessively long and detrimental to research. Short room temperature thaws of less than 20 minutes (depending on volume) may give superior performance in comparison with these long cold thaws. Short room temperature thaws also would allow for more flexible scheduling of laboratory work, since samples would not need to be thawed for hours prior to aliquoting or analysis.
In aggregate, prior studies on sample handling effects have reached inconsistent conclusions, variously reporting no effects (11, 15, 17, 19), modest effects (12, 14, 18), or large systemic effects like those in our study (13, 16). By exploring the full set of relevant handling metrics, our study shows that these seemingly disparate conclusions are reconcilable. Sample handling affects levels of many metabolites, though effects for many metabolites may be modest. Samples with suboptimal handling may yield epidemiologic associations like those of perfectly handled samples, but only if handling is 100% consistent. Exploration of the full set of sample handling metrics is needed to resolve these seeming contradictions, and we strongly encourage investigators in future studies of sample handling to take a similar approach.
Limitations of our study include the use of relative metabolite concentrations and an incomplete assessment of the human metabolome (600 metabolites instead of more than 100,000 (32)). Because we lacked absolute concentrations, the metabolites we identified as proxies for sample handling may have been limited in their ability to predict handling in other populations. Sample handling effects could be altered or amplified by interactions between handling conditions. Although our study design would allow us to examine these interactions, the tests for effectively evaluating this would require a much larger sample than that used in our study. Finally, we did not evaluate how differences in sample handling that are nondifferential with respect to case status may affect epidemiologic associations. This is a complex topic for which further theoretical work is still needed.
In sum, our study provides a guide to understanding effects of sample handling in a metabolomics context. We encourage further research on this important topic, particularly research evaluating how nondifferential sample handling may affect epidemiologic associations.
Supplementary Material
ACKNOWLEDGMENTS
Author affiliations: Division of Cancer Epidemiology and Genetics, National Cancer Institute, Rockville, Maryland, United States (Kathleen M. McClain, Steven C. Moore, Joshua N. Sampson); Beltsville Human Nutrition Research Center, Agricultural Research Service, US Department of Agriculture, Beltsville, Maryland, United States (Theresa R. Henderson, Sarah K. Gebauer, David J. Baer); Western Human Nutrition Research Center, Agricultural Research Service, US Department of Agriculture, Davis, California, United States (John W. Newman, Theresa L. Pedersen); Division of Cancer Prevention, National Cancer Institute, Rockville, Maryland, United States (Sharon Ross); and Division of Cancer Control and Population Sciences, National Cancer Institute, Rockville, Maryland, United States (Krista A. Zanetti).
K.M.M. and S.C.M. are co–first authors. D.J.B. and K.A.Z. are co–senior authors.
This work was supported by the Intramural Research Program of the National Institutes of Health, National Cancer Institute; the Division of Cancer Control and Population Sciences of the National Cancer Institute; and the Division of Cancer Prevention of the National Cancer Institute. Additional support was provided by the US Department of Agriculture (projects 8040-51530-010D, 2032-51530-022-00D, and 2032-51530-025-00D).
We thank Dr. Kevin Dodd for his insightful comments on an early draft of this analysis.
The US Department of Agriculture is an equal opportunity provider and employer. The views expressed in this paper do not necessarily represent those of the Food and Drug Administration or the US government.
Conflict of interest: none declared.
REFERENCES
- 1. Wishart DS, Jewison T, Guo AC, et al. HMDB 3.0—the Human Metabolome Database in 2013. Nucleic Acids Res. 2013;41(D1):D801–D807. [DOI] [PMC free article] [PubMed] [Google Scholar]
- 2. Guertin KA, Moore SC, Sampson JN, et al. Metabolomics in nutritional epidemiology: identifying metabolites associated with diet and quantifying their potential to uncover diet-disease relations in populations. Am J Clin Nutr. 2014;100(1):208–217. [DOI] [PMC free article] [PubMed] [Google Scholar]
- 3. Playdon MC, Sampson JN, Cross AJ, et al. Comparing metabolite profiles of habitual diet in serum and urine. Am J Clin Nutr. 2016;104(3):776–789. [DOI] [PMC free article] [PubMed] [Google Scholar]
- 4. Wang TJ, Larson MG, Vasan RS, et al. Metabolite profiles and the risk of developing diabetes. Nat Med. 2011;17(4):448–453. [DOI] [PMC free article] [PubMed] [Google Scholar]
- 5. Mondul AM, Moore SC, Weinstein SJ, et al. Metabolomic analysis of prostate cancer risk in a prospective cohort: the Alpha-Tocopherol, Beta-Carotene Cancer Prevention (ATBC) Study. Int J Cancer. 2015;137(9):2124–2132. [DOI] [PMC free article] [PubMed] [Google Scholar]
- 6. Zheng Y, Yu B, Alexander D, et al. Associations between metabolomic compounds and incident heart failure among African Americans: the ARIC Study. Am J Epidemiol. 2013;178(4):534–542. [DOI] [PMC free article] [PubMed] [Google Scholar]
- 7. Wikoff WR, Hanash S, DeFelice B, et al. Diacetylspermine is a novel prediagnostic serum biomarker for non–small-cell lung cancer and has additive performance with pro-surfactant protein B. J Clin Oncol. 2015;33(33):3880–3886. [DOI] [PMC free article] [PubMed] [Google Scholar]
- 8. Mayers JR, Wu C, Clish CB, et al. Elevation of circulating branched-chain amino acids is an early event in human pancreatic adenocarcinoma development. Nat Med. 2014;20(10):1193–1198. [DOI] [PMC free article] [PubMed] [Google Scholar]
- 9. Yu B, Zanetti KA, Temprosa M, et al. The Consortium of Metabolomics Studies (COMETS): metabolomics in 47 prospective cohort studies. Am J Epidemiol. 2019;188(6):991–1012. [DOI] [PMC free article] [PubMed] [Google Scholar]
- 10. Lippi G, Von Meyer A, Cadamuro J, et al. Blood sample quality. Diagnosis (Berl). 2019;6(1):25–31. [DOI] [PubMed] [Google Scholar]
- 11. La Frano MR, Carmichael SL, Ma C, et al. Impact of post-collection freezing delay on the reliability of serum metabolomics in samples reflecting the California mid-term pregnancy biobank. Metabolomics. 2018;14(11):Article 151. [DOI] [PubMed] [Google Scholar]
- 12. Zivkovic AM, Wiest MM, Nguyen UT, et al. Effects of sample handling and storage on quantitative lipid analysis in human serum. Metabolomics. 2009;5(4):507–516. [DOI] [PMC free article] [PubMed] [Google Scholar]
- 13. Anton G, Wilson R, Yu Z-H, et al. Pre-analytical sample quality: metabolite ratios as an intrinsic marker for prolonged room temperature exposure of serum samples. PLoS One. 2015;10(3):e0121495. [DOI] [PMC free article] [PubMed] [Google Scholar]
- 14. Saito K, Maekawa K, Pappan KL, et al. Differences in metabolite profiles between blood matrices, ages, and sexes among Caucasian individuals and their inter-individual variations. Metabolomics. 2014;10(3):402–413. [Google Scholar]
- 15. Breier M, Wahl S, Prehn C, et al. Targeted metabolomics identifies reliable and stable metabolites in human serum and plasma samples. PLoS One. 2014;9(2):e89728. [DOI] [PMC free article] [PubMed] [Google Scholar]
- 16. Kamlage B, Maldonado SG, Bethan B, et al. Quality markers addressing preanalytical variations of blood and plasma processing identified by broad and targeted metabolite profiling. Clin Chem. 2014;60(2):399–412. [DOI] [PubMed] [Google Scholar]
- 17. Wang Y, Carter BD, Gapstur SM, et al. Reproducibility of non-fasting plasma metabolomics measurements across processing delays. Metabolomics. 2018;14(10):Article 129. [DOI] [PubMed] [Google Scholar]
- 18. Hirayama A, Sugimoto M, Suzuki A, et al. Effects of processing and storage conditions on charged metabolomic profiles in blood. Electrophoresis. 2015;36(18):2148–2155. [DOI] [PubMed] [Google Scholar]
- 19. Ferreira DLS, Maple H, Goodwin M, et al. The effect of pre-analytical conditions on blood metabolomics in epidemiological studies. Metabolites. 2019;9(4):Article 64. [DOI] [PMC free article] [PubMed] [Google Scholar]
- 20. DeHaven CD, Evans AM, Dai H, et al. Organization of GC/MS and LC/MS metabolomics data into chemical libraries. J Cheminform. 2010;2(1):Article 9. [DOI] [PMC free article] [PubMed] [Google Scholar]
- 21. Evans AM, DeHaven CD, Barrett T, et al. Integrated, nontargeted ultrahigh performance liquid chromatography/electrospray ionization tandem mass spectrometry platform for the identification and relative quantification of the small-molecule complement of biological systems. Anal Chem. 2009;81(16):6656–6667. [DOI] [PubMed] [Google Scholar]
- 22. Duval V, Karlsson MO. Impact of omission or replacement of data below the limit of quantification on parameter estimates in a two-compartment model. Pharm Res. 2002;19(12):1835–1840. [DOI] [PubMed] [Google Scholar]
- 23. Bergstrand M, Karlsson MO. Handling data below the limit of quantification in mixed effect models. AAPS J. 2009;11(2):371–380. [DOI] [PMC free article] [PubMed] [Google Scholar]
- 24. Vexler A, Liu A, Schisterman EF. Efficient design and analysis of biospecimens with measurements subject to detection limit. Biom J. 2006;48(5):780–791. [DOI] [PubMed] [Google Scholar]
- 25. Moore SC, Playdon MC, Sampson JN, et al. A metabolomics analysis of body mass index and postmenopausal breast cancer risk. J Natl Cancer Inst. 2018;110(6):588–597. [DOI] [PMC free article] [PubMed] [Google Scholar]
- 26. Sampson JN, Boca SM, Shu XO, et al. Metabolomics in epidemiology: sources of variability in metabolite measurements and implications. Cancer Epidemiol Biomarkers Prev. 2013;22(4):631–640. [DOI] [PMC free article] [PubMed] [Google Scholar]
- 27. Kanehisa M, Goto S. KEGG: Kyoto Encyclopedia of Genes and Genomes. Nucleic Acids Res. 2000;28(1):27–30. [DOI] [PMC free article] [PubMed] [Google Scholar]
- 28. Efron B, Tibshirani RJ. An Introduction to the Bootstrap. New York, NY: Chapman & Hall, Inc.; 1993. [Google Scholar]
- 29. Holland D, Wang Y, Thompson WK, et al. Estimating effect sizes and expected replication probabilities from GWAS summary statistics. Front Genet. 2016;7:Article 15. [DOI] [PMC free article] [PubMed] [Google Scholar]
- 30. Platz EA, Sutcliffe S, De Marzo AM, et al. Intra-individual variation in serum C-reactive protein over 4 years: an implication for epidemiologic studies. Cancer Causes Control. 2010;21(6):847–851. [DOI] [PMC free article] [PubMed] [Google Scholar]
- 31. Liu X, Hoene M, Yin P, et al. Quality control of serum and plasma by quantification of (4E,14Z)-sphingadienine-C18-1-phosphate uncovers common preanalytical errors during handling of whole blood. Clin Chem. 2018;64(5):810–819. [DOI] [PubMed] [Google Scholar]
- 32. Wishart DS, Feunang YD, Marcu A, et al. HMDB 4.0: the Human Metabolome Database for 2018. Nucleic Acids Res. 2018;46(D1):D608–D617. [DOI] [PMC free article] [PubMed] [Google Scholar]
Associated Data
This section collects any data citations, data availability statements, or supplementary materials included in this article.