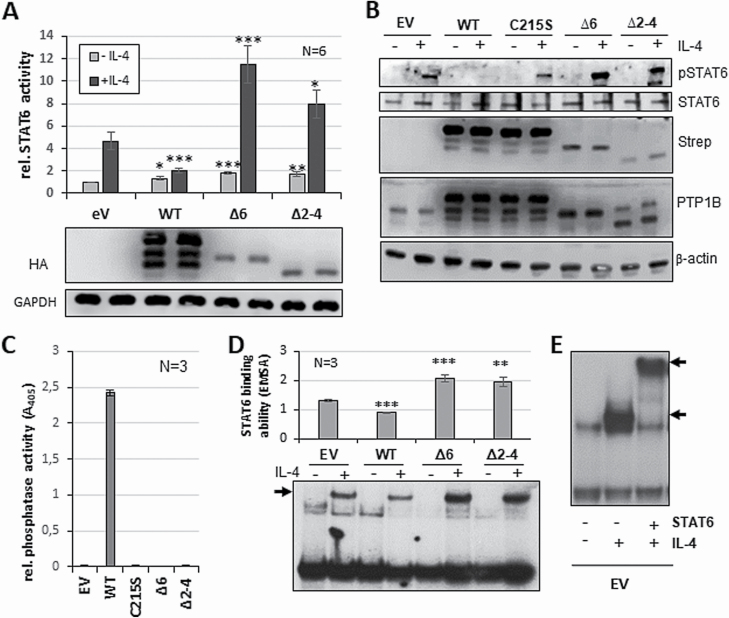
Figure 2.
PTP1B∆2–4 has a positive impact on STAT6 activity. (A) Luciferase assay for STAT6 activity with and without (control) stimulation with 5 ng/ml IL-4 for 18 h (upper part). HEK293-STAT6 cells were transiently transfected with either pcDNA3.1 (EV), or with HA-PTP1BWT, HA-PTP1B∆6, HA-PTP1B∆2–4 or HA-PTP1B∆2–8 vectors. Immunoblot analysis of WCE of one exemplary luciferase measurements (lower part) using the indicated antibodies. (B) Immunoblot analysis of WCE of HEK293-STAT6 cells either transfected with pcDNA3.1 (EV), or with HA-PTP1BWT, HA-PTP1BC215S, HA-PTP1B∆6 or HA-PTP1B∆2–4, each either with or without (control) stimulation with 5 ng/ml IL-4 for 30 min. Antibodies against pSTAT6, STAT6, Strep-tag, PTP1B and β-actin are used. C) Phosphatase assay with Strep-tagged PTP1BWT, PTP1BC215S, PTP1B∆6 or PTP1B∆2–4 ectopically expressed in HEK293 cells. pEXPR-IBA105 (EV) serves as control. Mean of three independent experiments is depicted. (D) Electrophoretic mobility shift assay to determine STAT6 DNA binding activity with whole cell extracts from HEK293-STAT6 cells either transfected with pcDNA3.1 (EV), or with HA-PTP1BWT, HA-PTP1B∆6 or HA-PTP1B∆2–4, each either with or without (control) stimulation with 5 ng/ml IL-4 for 30 min (bottom part). Quantification of STAT6 DNA binding levels of three independent experiments (upper part). (E) Electrophoretic mobility supershift using EV transfected HEK-STAT6 cells with (shift, lower arrow) and without IL-4 stimulation and additional STAT6 antibody (STAT6 (S20)-X, Santa Cruz) depicting the STAT6 supershift (upper arrow). Mean values and standard error of mean (SEM) are depicted. Comparisons were performed between empty vector measurement and individual treatments/transfections. Significances are calculated using student’s t-test (P < 0.05 was regarded as significant).

