

Abstract
The pandemic of coronavirus disease 2019 (COVID-19), caused by severe acute respiratory syndrome coronavirus 2 (SARS-CoV-2), is a major challenge to health systems worldwide. Recently, numbers of epidemiological studies have illustrated that climate conditions and air pollutants are associated with the COVID-19 confirmed cases worldwide. Researches also suggested that the SARS-CoV-2 could be detected in fecal and wastewater samples. These findings provided the possibility of preventing and controlling the COVID-19 pandemic from an environmental perspective. With this review, the main purpose is to summarize the relationship between the atmospheric and wastewater environment and COVID-19. In terms of the atmospheric environment, the evidence of the relationship between atmospheric environment (climate factors and air pollution) and COVID-19 is growing, but currently available data and results are various. It is necessary to comprehensively analyze their associations to provide constructive suggestions in responding to the pandemic. Recently, large numbers of studies have shown the widespread presence of this virus in wastewater and the feasibility of wastewater surveillance when the pandemic is ongoing. Therefore, there is an urgent need to clarify the occurrence and implication of viruses in wastewater and to understand the potential of wastewater-based epidemiology of pandemic. Overall, environmental perspective-based COVID-19 studies can provide new insight into pandemic prevention and control, and minimizes the economic cost for COVID-19 in areas with a large outbreak or a low economic level.
Keywords: COVID-19, SARS-CoV-2, Air pollution, Epidemiology
Graphical Abstract
1. Introduction
Coronavirus disease 2019 (COVID-19) is caused by severe acute respiratory syndrome coronavirus 2 (SARS-CoV-2), which is composed of protein and RNA. The proteins include structural proteins (a spike protein, an envelope (E) protein, and a membrane protein) and a nucleocapsid (NC) protein that encapsulates and thus protects the RNA, which codes for all structural, non-structural, and auxiliary viral proteins (Zhu et al., 2020a). SARS-CoV-2 is the seventh known coronavirus that can infect humans, with the other six being HCoV-229E (Humanes Coronavirus 229E), HCoV-OC43 (Humanes Coronavirus OC43), HCoV-NL63 (Humanes Coronavirus NL63), HCoV-HKU1 (Humanes Coronavirus HKU1), severe acute respiratory syndrome virus (SARS-CoV), and Middle East respiratory syndrome coronavirus (MERS-CoV) (Schwartz and Graham, 2020). Transmission of SARS-CoV-2 is believed to occur via droplets exhaled during close contact, and may also occur via aerosols, if these are present in high concentrations in a relatively closed environment (Peng et al., 2020).
Many factors could affect the COVID-19 pandemic. In the environment, the atmospheric environment has been proven to affect its spread. In particular, the climate (e.g., temperature, humidity, wind speed, rainfall) and the concentrations of atmospheric pollutants (nitrogen dioxide (NO2), 2.5-µm and 10-µm particulate matter (PM2.5 and PM10)) are correlated with the transmission of SARS-CoV-2 (Gupta et al., 2020a, Gupta et al., 2020b, Rosario et al., 2020, Tosepu et al., 2020, Zhu et al., 2020b). As reported, SARS-CoV-2 and SARS-CoV-1, which have similar stability under experimental conditions, can survive and be infectious for hours in aerosols and several days on the inanimate surface (van Doremalen et al., 2020). However, the survival of coronavirus is greatly affected by temperature and humidity. For example, MERS-CoV could survive for 48 h at 40% humidity and 20 °C, but for only 8 h at 80% humidity and 30 °C on the surface of steel (Otter et al., 2016); the survivals of TGEV (Transmissible Gastroenteritis Virus) and MHV (Mouse Hepatitis Virus), which could serve as conservative surrogates for pathogenic enveloped viruses on health care surfaces, were up to 28 d at 4 °C, and decreased to 4–96 h at 40 °C on different surface of various materials. Casanova et al. (2010) also found the inactivation was more rapid at higher temperature at all humidity levels, and the lowest inactivation occurred at low relative humidity, but this relationship between humidity and inactivation was not monotonic. Riddell et al. demonstrated that SARS-CoV-2 could be viable from surfaces for at least 28 d at 50% relative humidity and 20 °C (Riddell et al., 2020). These data indicate that humidity and temperature may play an important role in the survival and transmission of coronavirus.
Long-term or short-term exposure to air pollution may make people more susceptible to SARS-CoV-2 infection (Cole et al., 2020, Liang et al., 2020, Panasevich et al., 2009, Wu et al., 2020b), and inhalation of particulate matter (PM) may cause local or systemic inflammatory reactions in the lungs (Borro et al., 2020). PM may also contain SARS-CoV-2 particles, inhalation of which may lead to SARS-CoV-2 infection, and possibly to the development of COVID-19, especially as the PM may affect the immune system, thereby increasing the infectivity and virulence of the inhaled particles (Copat et al., 2020). In addition, SARS-CoV-2 RNA can be active on PM in outdoor air, indicating that SARS-CoV-2 particles may be present in high atmospheric concentrations of PM (Setti et al., 2020). Increased concentrations of NO2 may also be a factor in deaths associated with COVID-19 (Ogen, 2020), as in areas where NO2 air pollution is high, people are more likely to be infected with SARS-CoV-2.
In a study, stool samples of patients with COVID-19 remained positive for SARS-CoV-2 for 33 consecutive days after respiratory tract samples were negative for SARS-CoV-2 (Wu et al., 2020). In another study, 59% of 842 fecal samples from 96 patients with COVID-19 were positive for SARS-CoV-2, and, as in the previous study, SARS-CoV-2 persisted longer in feces than it did in the respiratory tract (Zheng et al., 2020), which indicated that SARS-CoV-2 was likely to enter the sewage system. SARS-CoV-2 RNA has been detected in the influent water of sewage treatment plants in all regions of the world, and its concentration increases with the number of infected people in an area (Ahmed et al., 2020, Hata et al., 2020, La Rosa et al., 2020b). Sewage epidemiology-based study of COVID-19 biomarkers can also enable the prediction of SARS-CoV-2 infection rates at a community level (Gonzalez et al., 2020, Hart and Halden, 2020, Randazzo et al., 2020). Notably, SARS-CoV-2 may be detected in wastewater before the first official case of SARS-CoV-2 is reported, which shows that wastewater-based epidemiology (WBE) is sensitive for the detection of SARS-CoV-2 (Medema et al., 2020). COVID-19 assessments based on WBE technology can thus provide guidance for officials to make judgments on pandemic prevention and control by predicting community infection (Gonzalez et al., 2020, Hart and Halden, 2020).
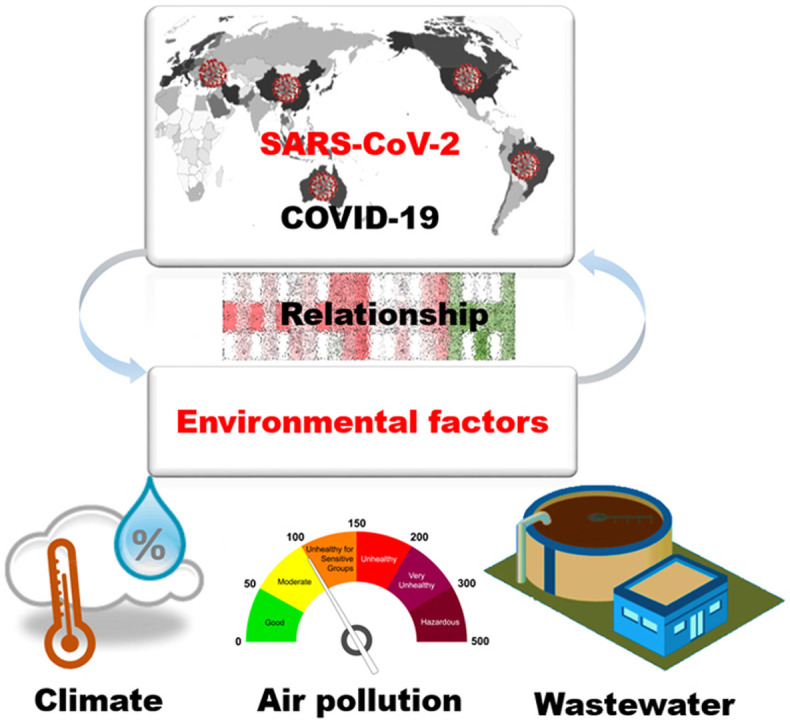
This review summarizes the relationship between COVID-19 and environmental factors, specifically climate factors and air pollution. The aim is to describe the effect of environmental factors on the pandemic, and to provide scientific guidance for current and future COVID-19 pandemic prevention and control.
2. Methods
The review, concerning the relationship between environmental factors and COVID-19, was conducted between January to October 2020 using the electronic databases, such as Web of Science, PubMed and Google Scholar. The search strategy included keywords related to SARS-CoV-2, COVID-19 and the interested environmental factors (e.g. “environment” or “atmosphere” or “climate” or “weather” or “humidity” or “air pollution” or “particular matter” or “NO2” or “wastewater” or “virus loads”). A total of 256 articles were obtained and managed using the EndNote software (Clarivate Analytics). Non-relevant articles and reviews not including data relevant were removed.
All epidemiological researches were selected as inclusion criteria to study the relationship between COVID-19 and environmental factors (climate, air pollution and wastewater). Finally, 42 published research articles were included in this study, and some findings of these researches were chosen to fit the aim of this review.
3. Atmospheric environment and COVID-19
3.1. Climate and COVID-19
Climate is a key factor that affects the spread of viruses, such as SARS and influenza (Petersen et al., 2020). In particular, the survival and transmission of many viruses are closely related to climatic conditions, such as temperature, humidity, and wind speed (Watson et al., 2006). Therefore, these conditions are often considered as important predictors of respiratory diseases. Recently, many studies found a correlation between the number of COVID-19 cases and climatic conditions (such as maximum or minimum temperature, diurnal temperature range, relative or absolute humidity, rainfall, and wind speed) ( Table 1). However, different researches yielded dissimilar results in previous studies. Therefore, it is important to examine the relationship between climate factors (such as temperature, humidity, etc.) and the incidence of COVID-19.
Table 1.
Summaries of articles in research clusters of weather condition and COVID-19.
| Weather condition | Climate conditions | Study area | Research period and numbers of cases | Study design and statistical method | Effect size of climate variables: mean (sd) | Reference |
|---|---|---|---|---|---|---|
| Positive association for diurnal temperature range (DTR) (r = 0.44), negative association for relative humidity (RH) (r = −0.32) | Average temperature and DTR were 7.44 ℃ and 9.15 ℃. The average relative and absolute humidity were 82.24% and 6.69 g/m3. | Wuhan, China | 20/1/2020–29/2/2020; 28836 cases | Descriptive analysis and generalized additive model | DTR (℃): 9.15 (4.74); RH (%): 82.24 (8.51) | (Ma et al., 2020) |
| Positive linear relationship between mean temperature and COVID-19 cases in the range of < 3 ℃. | Each 1 ℃ increase was associated with 3.432% increase in the confirmed cases when the temperature was below 3 ℃. | 122 cities of China | 23/1/2020–29/2/2020; > 59000 cases | Descriptive statistics and generalized additive model | Temperature (℃): 3.118 (10.286) | (Xie and Zhu, 2020) |
| Significant correlation for average temperature (r = 0.392) | The highest maximum, minimum and average temperature were 31.4, 27.5 and 28.6 ℃; the highest humidity of 93%, and the highest rainfall of 88 mm. | Jakarta, Indonesia | 1/1/2020–29/3/2020; 1285 cases | Spearman correlation | – | (Tosepu et al., 2020) |
| Negative association for solar radiation (r = −0.609), positive association for temperature (max and average, r = 0.332 and 0.406) and wind speed (r = 0.440). | The highest maximum, minimum and average temperature were 34.2, 23.9 and 27.0 ℃; the highest humidity of 90.8%, the highest solar radiation of 1017.6 kJ/m2, and the highest wind speed of 2.6 m/s. | Rio de Janeiro, Brazil | 12/3/2020–28/4/2020; 6789 cases | Spearman rank correlation | – | (Rosario et al., 2020) |
| Positive correlation for absolute humidity (AH) and temperature. | AH in the range of 4–6 g/m3, and temperature in the range of 4–11 ℃. | US states | 1/1/2020–9/4/2020; 161395 cases | Descriptive analysis | – | (Gupta et al., 2020a, Gupta et al., 2020b) |
| Negative correlation for the temperature on the day (r = −0.483), 14 days ago (−0.317), dew point (r = −0.400) and humidity (r = −0.317) on the day, while the positive association for wind speed of the last 14 days (r = 0.55), and the negative for wind speed at the day (r = −0.217). | The lowest and highest average temperature, dew point, humidity, and wind speed are 3.8 ℃ and 17.7 ℃, − 3 ℃ and 12.8 ℃, 53% and 93.6%, 4.6 mph and 30.7 mph, respectively. The positive for population (r = 0.683) | Turkey | 21/3/2020–3/4/2020; 16787 cases | Spearman's correlation | – | (Şahin, 2020) |
| Temperature and humidity may result in slower spread of COVID-19. | Approximately 85% of the COVID-19 occurred in the regions with temperature (3–17 ℃) and AH (1–9 g/m3) | All the regions affected by COVID-19 globally | 20/1/2020–1/5/2020; 3.5 million cases | Descriptive analysis | USA: (mean temperature:1.8–11.5; mean DTR: −6.2 to −2.6) | (Bukhari et al., 2020) |
| Italy: (mean temperature:3–10.7; mean DTR: −1 to 5) | ||||||
| UK: (mean temperature:4.5–8.7; mean DTR: 1–3) | ||||||
| Negative correlation for maximum temperature (r = −0.56) | The maximum temperature, average wind speed, and relative humidity were 40 ℃, 10.5 km/hr, 70%. | Six India mega cities | 23/03/2020–22/05/2020; 3 million confirmed cases / 29 million tests | Descriptive analysis and correlation analysis | Maximum temperature: 32.5–40 ℃; Wind speed: 2.6–11.9 km/hr-1; RH: 35–70% | (Beig et al., 2020) |
| Significant correlation for maximum temperature (r = 0.347), normal temperature (r = 0.293), and precipitation level (r = −0.285). | The maximum and average temperature were 9.26 ℃ and 4.76 ℃, and the precipitation was 1.19 mm. | The capital of Norway | 27/2/2020–2/5/2020; 2775 cases | Pearson's correlation and Spearman correlation | – | (Menebo, 2020) |
| Significant correlation for average temperature (r = 0.379), minimum temperature (r = 0.335). | The maximum, minimum, and average temperature were 6.7 ℃, 1.8 ℃ and − 3.3 ℃, the lowest wind speed, humidity, and rainfall were 6.1 mph, 25.8% and 0 mm. | New York City | 1/3/2020–12/4/2020; 104410 cases | Kendall and Spearman rank correlation | – | (Bashir et al., 2020) |
| Significant positive association for relative humidity (p = 0.002) and temperature (p = 0.003). | The average relative humidity were 23.33–82.67%, and the temperature were from − 13–19 ℃. | 31 cities of China | 01/2020–03/2020; 4715 cases | Spearman's rank correlation | RH (%): 59.87 (5.94); Temperature (℃): 4.74 (5.97) | (Yao et al., 2020a) |
| Negative linear relationship between temperature and confirmed cases | The relationship was linear in the range of less than 25.8 ℃. | 27 cities of Brazil | 27/2/2020–1/4/2020; 586 cases | Descriptive analysis and generalized additive model | Temperature (℃): 23.8 (2.85) | (Prata et al., 2020) |
| Positive relationship for minimum temperature and average temperature, negative correlation for Air Quality Index (AQI) | mean temperature: 29 ℃; rainfall: 2–20 mm; RH: 47–98%; wind speed: 1–17 km/h; AQI: 54–150 | Dhaka, Bangladesh | 1/5/2020–31–5–2020; 22576 cases | The time series modelling, Spearman, or Pearson correlation | – | (Mofijur et al., 2020) |
In previous studies, results suggested that many respiratory disease epidemics have seasonal characteristics (Leecaster et al., 2011, Rafiefard et al., 2008). Cold environments provide optimal conditions for viral reproduction and survival, and also reduce human immunity, providing opportunities for viral invasion (Eccles and Wilkinson, 2015). In contrast, a comment article stated that the existing relationships between climate factors (temperature, humidity, and solar radiation) and COVID-19 transmission, and the environmental evidence also showed that SARS-CoV-2 is environmental sensitive (Carlson et al., 2020). In other research, viruses with a higher lipid content had higher survival rates in low-humidity environments, whereas viruses with a lower lipid content had higher survival rates in high-humidity environments (Vasickova et al., 2010). SARS-CoV-2 is an enveloped virus, which has a lipid bilayer envelope, and may remain infectious for 28 d at a lower humidity (20%) and 4–5 d at 50% RH (Riddell et al., 2020). Studies also indicated that other enveloped viruses (such as SARS-CoV and MERS) could survive at lower RH for longer than non-enveloped viruses (Xu et al., 2020). In summary, more and more evidence indicates that climate factors may have a certain correlation with the COVID-19.
A study on the correlation between COVID-19 cases and ambient temperature (mean, minimum, and maximum temperatures) throughout the world from January 1 to April 2 2020 (24,139 confirmed cases) used a restricted cubic spline function and generalized linear mixed-model analysis to analyze the effects of lower temperatures. Results suggested that the cumulative number of cases increased by 0.83, 0.82, and 0.83 for each 1 °C increase in average, minimum, and maximum temperature, respectively (Wang et al., 2020). Thus, a certain temperature is optimal for the transmission of SARS-CoV-2. Bukhari et al. studied the global relationship between SARS-CoV-2 infections and climate factors, and found that temperature and humidity promoted the spread of COVID-19, and they also found that approximately 85% of COVID-19 cases (3 million confirmed cases out of 29 million tests) occurred in countries and regions with a temperature of 3–17 °C and an absolute humidity of 1–9 g/m3 (Bukhari et al., 2020). A study conducted in New York, U.S.A., from March 1 to April 12, 2020, found significant positive correlations between the number of cases of COVID-19 (until April 12 2020, 104,410 confirmed cases) and the average temperature (r = 0.379), which was − 3.3 °C, and the minimum temperature (r = 0.335), during which time the average RH was 25.8% (Bashir et al., 2020b). Researchers in China also found a linear positive correlation between the number of COVID-19 cases (> 58000 cases during the observation period) and temperature, with the number of confirmed cases increasing by 4.861% for every 1 °C increase in temperature, when the average temperature was less than 3 °C, in 122 cities of China from January 23 to February 29, 2020 (Xie and Zhu, 2020). In addition, Ma et al. found that COVID-19 mortality was positively correlated with diurnal temperature range (DRT) (r = 0.44) and negatively correlated with RH (r = −0.32) when the average temperature was 7.44 °C and the average RH was 82.24% in Wuhan (2299 COVID-19 deaths, and 28,836 confirmed cases) from January 20 to February 29, 2020 (Ma et al., 2020). Study in the capital city of Norway also found significant positive correlation between COVID-19 pandemic (7809 total confirmed cases) and the maximum temperature (mean = 9.26 °C, r = 0.347, p = 0.005) and normal temperature (mean = 1.89 °C, r = 0.293, p = 0.019) (Gupta et al., 2020a, Gupta et al., 2020b, Menebo, 2020). In consistent with world observations, Gupta et al. also found the relationship of COVID-19 and weather parameters in the US (over 10,000 new cases in a 10-d interval), but these trends did not correlate with India as the numbers of new cases per interval (10-day) was below 10,000 (i.e., 6725 cases) (Gupta et al., 2020a, Gupta et al., 2020b). Finally, in a machine learning study, Malki et al. collected the weather data from the historical weather database and determined that temperature, number of sunlight hours, humidity, wind speed and population were positively correlated with the number of confirmed COVID-19 cases and deaths (Malki et al., 2020). A positive correlation between temperature and the number of COVID-19 cases was also found in some areas with higher average temperatures. Tosepu et al. found a positive relationship (r = 0.392, p < 0.01) between temperature and the number of COVID-19 cases (1285 cases in 30 provinces until March 29, 2020) in Jakarta, Indonesia, when the average temperature, the maximum humidity, and maximum rainfall were 28.6 °C, 93%, and 88 mm, respectively (Tosepu et al., 2020).
However, some studies have found opposite trends. Rosario et al. suggested a negative correlation (r = −0.406, p < 0.01) between mean temperature and the number of COVID-19 cases (6789 cases) in the State of Rio de Janeiro, Brazil, which has an average temperature of 27 °C and average RH of 90% (Rosario et al., 2020). Şahin found a negative correlation between temperature (r = −0.483), dew point temperature (r = - 0.4), and humidity (r = −0.317) and the number of cases of COVID-19 (16,787 confirmed cases until April 6, 2020), but a positive correlation between wind speed 14 days age (r = 0.55) and the number of cases (Şahin, 2020). In this study, the author stated that 63.5% of cases were in Istanbul, which is the most crowded city in Turkey and welcomed about 56% of foreigners (approximate 962,151 foreigners in February 2020) in Turkey. Another study conducted in a tropical area of India showed a significant correlation (r = −0.56, p < 0.01) between the maximum temperature (32.5–40 °C) and the number of SARS-CoV-2 infections (Beig et al., 2020). Notably, the population density in the study cities ranged from 4217 to 26,903 people per km2, there was a maximum of 27,251 cases of SARS-CoV-2 infection, and the maximum temperature and RH were 32.5–40 °C, and 35–70%, respectively. Similarly, in the tropical temperatures of Brazil, there was a negative linear relationship between the daily cumulative number of COVID-19 cases (586 cases during the observation) and temperature, where the annual average temperature range was 16.8–27.4 °C (Prata et al., 2020). Parta et al. (2020) also found a − 4.89% (p = 0.0226) decrease in the number of confirmed COVID-19 cases for every 1 °C increase in temperature. However, unlike other studies, Şahin also analyzed the climatic factors on days 1, 3, 7, and 14 of the study period in nine cities of Turkey. During the study period, the highest average temperature and RHs in these cities were 17.7 °C and 93.6%, respectively. However, the strongest positive correlation (r = 0.683) was observed between population and the number of COVID-19 cases (Şahin, 2020).
In summary, the results from various studies differ. As shown in Fig. 1, among the 24 studies that analyzed the correlation between climate parameters and COVID-19, 15 studies found a positive correlation between temperature and the number of cases of COVID-19, with correlation coefficients ranging from 0.22 to 0.84; six studies found a negative correlation, with correlation coefficients ranging from − 0.2 to − 0.48; and three studies found correlation coefficients ranging from 0.03 to 0.09. In studies of the relationship between RH and COVID-19, six studies found a negative correlation between RH and the number of COVID-19 cases, and six found a positive correlation. In conclusion, in the studied areas with higher confirmed COVID-19 cases, the number of cases was positively correlated with climate factors (temperature and humidity). However, this relationship was mainly based on the numbers of cases (above 1000 cases), the relative range of temperature (approximate < 25 °C) and humidity. In addition, tourists from pandemic cities and biological factors of different regions could also affect the confirmed cases and their relationship (Chakrabarti et al., 2020, Lipsitch et al., 2020).
Fig. 1.

Overview of studies on correlation between climatic factors and COVID-19. (AH: absolute humidity; RH: relative humidity; DTR: diurnal temperature range; Max-T: maximum temperature; Min-T: minimum temperature; SR: solar radiation; DP: dew point; WS: wind speed; RF: rainfall).
3.2. Air pollution and COVID-19
Several studies found a correlation between air pollution, namely the concentrations of certain pollutants (PM2.5, PM10, NO2, ozone (O3), sulfur dioxide (SO2)), and the number of COVID-19 cases ( Table 2). In a study of 120 cities in China, data on the concentration of six pollutants (PM2.5, PM10, SO2, carbon monoxide (CO), NO2, and O3) and the number of COVID-19 cases were collected from January 23 to February 29, 2020, and there was a significant positive correlation between the concentrations of PM10, NO2, and O3 and the number of COVID-19 cases (Zhu et al., 2020b). Similarly, Bashir et al. analyzed the relationship of the concentrations of PM2.5, PM10, SO2, NO2, lead, volatile organic compounds, and CO with the number of COVID-19 cases in California, and found that the concentrations of PM2.5, PM10, SO2, and NO2 were significantly correlated with the number of COVID-19 cases and COVID-19-associated mortality (Bashir et al., 2020a). In other work, Magezzino et al. (2020) found a significant correlation between the concentrations of PM2.5 and PM10 and the number of COVID-19 deaths in a study in three French regions. They also warned that all cities with a population density similar to these three French cities should restrict concentrations of PM2.5 and PM10 to a threshold value (Magazzino et al., 2020). Finally, Zhu et al. found that for every 10 µg/cm3 increase in the concentration of PM2.5, PM10, NO2, and O3, the daily number of confirmed cases of COVID-19 increased by 2.24%, 1.76%, 6.94%, and 4.76% respectively, whereas, for every 10 µg/cm3 increase in the concentration of SO2, the daily number of confirmed cases decreased by 7.79%.
Table 2.
Summaries of articles in research clusters of air pollution and COVID-19.
| Air pollution | Air pollution index and related effect size [mead (sd)] | Statistical Method | Study area | Research period and numbers of cases | Reference |
|---|---|---|---|---|---|
| Positive association for PM2.5, PM10, NO2, and O3; Negative association for SO2 | A 10 µg/m3 increase in PM2.5, PM10, NO2, and O3, was related to 2.24%, 1.76%, 6.94% and 4.76% increase in confirmed cases; a 10 µg/m3 decrease in SO2 was related to 7.79% decrease in confirmed cases. | Generalized additive model | 120 cities of China | 23/1/2020–29/2/2020; Over 5800 cases | (Zhu et al., 2020a, Zhu et al., 2020b) |
| PM2.5: 46.43 (228.96); PM10: 62.97 (49.76); SO2: 12.23 (9.90); NO2: 19.28 (11.87); mean temperature: 2.82 (10.11); RH: 67.25 (17.42) | |||||
| Long-term PM2.5 exposure was associated with COVID-19 deaths | 1 µg/m3 increase in long-term exposure to PM2.5 is associated with 8% increase in the COVID-19 death rate. | Negative binoial mixed models | 3087 counties in the United States | up to 22/4/2020; 45817 cases | (Wu et al., 2020b) |
| Long-term air quality data significant correlated (p < 0.05) with COVID-19. | Data of PM2.5, PM10, NO2 were in the range of 2016–2019, and O3 was in the range of 2017–2019. | Correlation annaysis | 71 Italian provinces | 24/2/2020–27/4/2020; Above 10 cases/day | (Fattorini and Regoli, 2020) |
| Three air pollution indicators are positively correlated to new cases. | AQI-1,3 and 5 indicated the last day, the last 3 days and the last 5 days of daily city-level AQI. | Regression model analysis and Kendall and Spearman rank correlation | 219 Chinese cities (exclude Cities in Hubei province (including Wuhan)) | 24/1/2020–29/2/2020; 12917 cases | (Zhang et al., 2020) |
| Every 10 unites increase in the AQI, 5%− 7% increase in the daily confirmed cases. | |||||
| Significantly correlation between the concentrations amount of PM and adverse effect of COVID-19 | The threshold values of PM2.5 and PM10 were different among cities in French. | Artificial Neural Networks | Three major French cities | 18/3/2020–27/4/2020; 123270 cases | (Magazzino et al., 2020) |
| A 10-μg/m3 increase in PM2.5, PM10, NO2, and O3 is associated with a 2.24%, 1.76%, 6.94%, and 4.76%, increase in daily COVID-19 cases, respectively. | |||||
| Positive correlation between PM2.5 (p < 0.05) and COVID-19 deaths. | The annual mean PM2.5 in India, Pakistan, Indonesia and China were in the range of 84–174 μg/m3, 66–68 μg/m3, 45 μg/m3, and 47–73 μg/m3, respectively. | ANOVA and regression model | Nine cities of India, Pakistan, Indonesia and China | Data as on 2/7/2020; 157766 cases | (Gupta et al., 2020b, Gupta et al., 2020a) |
| PM2.5 (ug/m3): 85.3 (43.6); | |||||
| PM10 (ug/m3): 162.9 (97.8) | |||||
| Significant association for diesel particulate matter. | The TSDFs and RMPs were associated to greater fatality rates and prevalence rates, respectively. | Mixed model linear multiple regression analyses | 3143 US counties | up to | (Hendryx and Luo, 2020) |
| 31/5/2020; 313.39 per 100,000 population (range 0–12,640.76) | |||||
| PM2.5 (μg/m3): 9.19 (1.77) | |||||
| High correlation between NO2 and COVID-19 | The industrial zones with the higher NO2 (26 g/m3) can increase COVID-19 infections. | Reduced-Space Gaussian Process Regression | Lima | 13/3/2020–9/4/2020; 3704 cases | (Arias Velásquez and Mejía Lara, 2020) |
| Short-term exposure to suspended particles could affect infections. | The COVID-19 was not associated with precipitation, wind speed, humidity, NO, NO2, Ox, and PM2.5. Mean T: 8.1–12 ℃; wind speed: 2.8–3.4 m/s; RH: 54–79.2%; AH: 4.1–6.4 g/kg; NO: 1.3–2.8 ppb; NO2: 9.7–14.4 ppb; Ox: 30.7–40.7 ppb; PM2.5: 6.9–11.7 g/m3 | Weighted random-effects regression analysis; longitudinal cohort study | Japan | 13/3/2020–6/4/2020; 6529 cases | (Azuma et al., 2020) |
| Long-term exposure to NO2 were correlated with COVID-19 deaths. | 83% of fatalities occurred in regions with 100 μmol/cm2 NO2. 15.5% occurred in regions with 50–100 μmol/cm2 NO2. | Visual analysis | 66 administrative regions in Italy, Spain, France and Germany | As of 19/3/2020;0 4443 fatalities | (Ogen, 2020) |
| Positive association for particulate matter pollution | For every 10 μg/m3 increase in PM2.5 and PM10, the COVID-19 fatality rate increased by 0.24% and 0.26%; PM2.5 (μg/m3): 51.2 (20.9); PM10 (μg/m3): 62.1 (22.6) | Spatial auto-correlation statistics | 49 cities in China | As of 22/3/2020; 3206 deaths | (Yao et al., 2020b) |
| Positive association of PM2.5 concentration on mortality | One unit (ug/m3) increase in PM2.5 concentrations was associated with a 9% increase in COVID-19 mortality. PM2.5 (μg/m3): 19.67 (20.85); Temperature (℃): 3.75 (5.34) | Geographical information and negative binomial regression | Northern Italy | 1/1/2020–30/4/2020 | (Coker et al., 2020) |
Some studies showed that NO2 exposure was the factor most related to the number of cases of COVID-19. NO2 is an ambient pollutant, the major anthropogenic sources of which are vehicle exhaust gases and fuel combustion (Copat et al., 2020), and exposure to NO2 is associated with hypertension, diabetes, and heart and cardiovascular diseases (Ogen, 2020). Copat et al. reviewed the recent studies and found that an increase in the concentration of NO2 was significantly correlated with the numbers of respiratory tract infections and COVID-19 cases (Copat et al., 2020). As reported in the animal models, NO2 exposure might induce 100-fold increase in angiotensin-converting enzyme (ACE2) activity (Alifano et al., 2020). While the human cell receptor of COVID-19 is ACE2 and the expression of ACE2 is high on lung alveolar epithelial cells (Copat et al., 2020).
In a cross-sectional nationwide study in the U.S.A., Liang et al. analyzed the relationship between long-term (2010–2016) exposure to air pollution (NO2, PM2.5, and O3) and COVID-19 fatality and mortality rates, and found a statistically significant positive correlation between the COVID-19 fatality rate and concentrations of NO2 (Liang et al., 2020). Travaglio et al. investigated the relationship between air pollution and COVID-19 mortality in the U.K., and found that the concentrations of air pollution indicators, such as NOx and SO2, were correlated with the COVID-19 mortality rate throughout the U.K. (Travaglio et al., 2020). In addition, in a study in the Lima region of Peru from March 12 to April 9, 2020, a strong correlation was observed between the concentrations of NO2 and the number of COVID-19 cases: industrial zones with higher NO2 concentrations (26 g/m3) had more COVID-19 cases (Arias Velásquez and Mejía Lara, 2020). Similarly, in a study on the relationship between long-term NO2 exposure and COVID-19 mortality, 83% of COVID-19 lethality was correlated with long-term exposure to 100 µmol/cm3 concentrations of NO2 (Ogen, 2020).
PM2.5 and PM10 concentrations were also associated with the number of cases of COVID-19. Increased exposure to PMs led to increased COVID-19-associated respiratory morbidity and mortality (Copat et al., 2020). Toxicological studies also suggested that PMs may cause pulmonary inflammation, increase inflammation and oxide stress, and thus diminish the defenses against infection, leading to aggravation of COVID-19-associated respiratory symptoms (Yao et al., 2020). Gupta et al. investigated nine cities in Asia, and found positive correlations between the PM concentrations and numbers of COVID-19 cases in regions with PM pollution, or past exposure to high concentrations of PM2.5 over a long period (Gupta et al., 2020a). Yao et al. found that PM concentrations were significantly positively correlated with COVID-19 mortality, which increased by 0.24% and 0.26% for every 10 µg/m3 increase in the concentrations of PM2.5 and PM10, respectively (Yao et al., 2020). Similarly, a study in northern Italy from April 1–30, 2020 found a positive correlation between PM2.5 concentrations and COVID-19 mortality, which increased by 9% for every 1 µg/m3 increase in PM2.5 concentration (Coker et al., 2020).
In addition to these correlations during the pandemic period, correlations were found between long-term exposure to air pollution and the number of cases of COVID-19. In a study of 71 Italian cities (February 24 - April 27, 2020) significant correlations were found between the concentrations of PM2.5, PM10, and NO2 during 2016–2019 and the concentrations of O3 during 2017–2019 and the number of cases of COVID-19 (Fattorini and Regoli, 2020). Wu et al. studied the relationship between long-term exposure to PM2.5 and the lethality rate of COVID-19 in 3087 countries in the United States, and found that 1 ug/cm3 in PM2.5 is related to an 8% increase in the COVID-19 lethality rate, indicating that those COVID-19 patients who had previously been exposed to high concentrations of PM2.5 for long periods suffered from higher COVID-19 mortality (Wu et al., 2020b). Cole et al. found compelling evidence of a positive relationship between the concentration of PM2.5 and the number of COVID-19 cases and deaths in the Netherlands, showing that every 1 µg/m3 increase in PM2.5 concentrations will have 9.4 COVID-19 cases (Cole et al., 2020).
In summary, the number of COVID-19 cases in an area was correlated with its concentrations of air pollution. Specifically, the number of COVID-19 cases was higher in areas with high concentrations of certain pollutants. This may be explained by the following aspects. (1) Air pollution is a primary cause of exaggerated inflammation status, which may ultimately lead to the dysregulated and weak immune system (Conticini et al., 2020, Zhao et al., 2019). Notably, PM2.5 and PM10 may induce an increase in the concentrations of interleukin (IL-6) and IL-8 in human bronchial cells (Longhin et al., 2018), and there is a significant correlation between atmospheric concentrations of NO2 and the concentration of IL-6 in human bronchial cells (Panasevich et al., 2009). O3 and SO2 also play a significant role in the induction of respiratory inflammation (i.e., in increasing concentrations of IL-8, IL-7, and tumor necrosis factor-alpha) (Panasevich et al., 2009, Zhao et al., 2019). In addition, atmospheric pollutants, such as PM, NO2, CO, SO2, and O3, could affect the hydrolytic enzymes, which react with mucins to reduce the ability to blind and clear pathogens, and then aggravate cardiovascular or pulmonary diseases, and indirectly affect the rate of SARS-CoV-2 infection (Domingo et al., 2020). Long-term exposure to PM2.5 and NO2 may also lead to overexpression of ACE2, thus increasing the SARS-CoV-2 load of patients exposed to air pollutants (Alifano et al., 2020, Borro et al., 2020). (2) High air-pollution areas exhibit downward airflow, which leads to the accumulation of pollutants near the ground. This phenomenon, in combination with other atmospheric conditions and local terrain structure, prevents the diffusion of air pollutants beyond a certain area, resulting in people in such areas developing respiratory system inflammation. Long-term exposure to such atmospheric conditions was found to be correlated with the high incidence and high mortality of COVID-19 in these areas (Ogen, 2020). Overall, most studies have found more COVID-19 cases and higher mortality rates in areas with higher concentrations of air pollution. Therefore, to prevent and control COVID-19, countries and regions must take corresponding measures to control air pollution. Similar pandemics are inevitable in the future, and such control of air pollution will be crucial to reduce the incidence of respiratory disease, and thus reduce pandemic spread.
Although most studies found a direct correlation between concentrations of air pollution and the number of cases of COVID-19 in an area, the direction of the trends differed. This suggests that other factors besides climatic conditions and air pollution may also play an important role in the transmission of SARS-CoV-2. At the national levels, the types of public-health intervention measures, the abilities to detect SARS-CoV-2, population densities, and numbers of susceptible groups could affect the confirmed cases. At the detection level, the criteria of sampling, pretreatment and analysis, issued by the regulatory bodies and available resources were different. Therefore, there were inconsistencies in correlation analysis between positive infection data sets in different periods and regions. In the data sources, the access to conventional parameters, geographical factors, environmental factors and the selection of statistical models could also affect their correlations. Therefore, the following aspects must be considered. (1) Small regions or countries should be selected as study areas, to guide local government responses to the pandemic situation (e.g., their isolation measures and ability to detect SARS-CoV-2, and their policies on mask-wearing, physical distancing, etc.) (2) A single, reliable method must be used to obtain climate factor data (and the monitoring technology and method must be unified). (3) Various types and numbers of climatic conditions must be used as factors in a predictive model.
4. Wastewater and COVID-19
4.1. The occurrence of SARS-CoV-2 in wastewater
The occurrences of several major viral disease outbreaks in recent years, namely the SARS epidemic, the MERS epidemic, the Ebola virus epidemic, and the avian influenza pandemic, have highlighted the risk of persistent and deadly viral pandemics (Suwantarat and Apisarnthanarak, 2015). Generally, enveloped viruses in municipal sewage pose little infective threat, as they are only present in low concentrations, usually cannot be transmitted via human feces, and are highly susceptible to inactivation in aqueous environments (Wigginton et al., 2015b). However, some enveloped viruses released from infected human feces can survive for days to months in aqueous environments (Wigginton et al., 2015a). For example, SARS-CoV could survive for more than 17 days at 4 °C and for three and 17 days in feces and urine at 20 °C, respectively (Wang et al., 2005a), and for three days at 20 °C in hospital sewage, municipal sewage, and chlorine-free tap water (Wang et al., 2005b). Thus, the occurrence and persistence of SARS-CoV-2 in wastewater also warrant attention. The occurrence of SARS-CoV-2 in wastewater samples was summarized in Table 3.
Table 3.
Summaries of SARS-CoV-2 loads in wastewater samples.
| Viral load (copies/mL) | Area | Sampling sites | methods | Positive rate | Confirmed cases | Reference |
|---|---|---|---|---|---|---|
|
Southeast Queensland, Australia | Two WWTPs | Monte Carlo simulation | 2/9 | 404 | (Ahmed et al., 2020) |
|
Southeastern Virginia, USA | Nine WWTPs | Kruskall-Wallis analysis and Dunn's tests | 125/198 | 14,904 | (Gonzalez et al., 2020) |
|
The Region of Murcia, Spain | Six WWTPs | – | 35/42 | 976 | (Randazzo et al., 2020) |
|
Massachusetts, USA | – | Spearman rank correlation; Poisson model simulation | 10/14 | – | (Wu et al., 2020a) |
|
Bozeman, Montana (USA) | Municipal wastewater treatment plant | Correlation analysis | 8/10 | – | (Nemudryi et al., 2020) |
|
Ahmedabad, India | The Old Pirana Wastewater Treatment Plant, equipped with an UASB | – | 27/27 | > 15000 | (Kumar et al., 2020) |
|
Paris, France | Three WWTPs of the Parisian area | – | 23/23 | > 16000 | (Wurtzer et al., 2020) |
|
The Netherlands | Six WWTPs | Linear regression analysis | 35/42 | 6412 | (Medema et al., 2020) |
|
Japan | Conventional activated sludge process | – | 5/5 | < 60 | (Haramoto et al., 2020) |
|
Milan and Rome, Italy | WWTPs | – | 6/12 | 29 | (La Rosa et al., 2020) |
|
Valencia, Spain | Six WWTPs | – | 24/32 | 976 | (Randazzo et al., 2020) |
In a study in the city of Niterói, Rio de Janeiro, Brazil, samples of untreated sewage from 12 municipal sewage treatment plants, hospital wastewater, and sewer networks were tested. Samples from three sewer networks and two sewage treatment plants tested positive for SARS-CoV-2. These positive samples were mainly from the Icaraí area, where the number of COVID-19 cases had reached 70 (Prado et al., 2020). In another study, 35 of the 42 influent samples collected from six sewage treatment plants in Murcia, Spain, were positive for SARS-CoV-2, as were 18 post-secondary treatment samples, whereas all 12 tertiary effluent samples were negative. Notably, it was found that the occurrence of COVID-19 cases could be predicted by an epidemiological survey data of wastewater, before a local government reported the first official case of COVID-19 (Randazzo et al., 2020). Eleven sewage treatment plants in the United Arab Emirates surveyed in May and June 2020 had SARS-CoV-2 concentrations in their influent water ranging from 0.75 to 34 copies/mL. In addition, when the government took preventive measures, the confirmed cases of COVID-19 decreased significantly, and the SARS-CoV-2 concentration in wastewater samples exhibited a corresponding decrease (Hasan et al., 2021). An April 2020 study in Germany found that all of the influent samples from nine sewage treatment plants were positive for SARS-CoV-2, with concentrations ranging from 2.6 to 37 copies/mL (Westhaus et al., 2021). In an investigation in France, the authors collected samples of influent water from sewage treatment plants before and after the lockdown. Increased concentrations of SARS-CoV-2 were found in wastewater in mid-June 2020, which correlated with an increase in confirmed cases of COVID-19 one week later (Trottier et al., 2020). Finally, in an analysis of 27 wastewater samples collected from four wastewater treatment plants (WWTPs) in the Ishikawa and Fukuyama prefectures of Japan, SARS-CoV-2 was detectable in sewage samples when there were more than 10 confirmed cases of COVID-19 per 100,000 people (Hata et al., 2020).
Recently, SARS-CoV-2 was detected in WWTP samples from regions of Australia, Spain, the U.S.A., India, France, Japan, and the Netherlands. The survival time and concentration of SARS-CoV-2 in sewage are important factors in the study of its persistence in the sewage environment. The concentrations of SARS-CoV-2 in various studies of wastewater are summarized in Table 2. In a study at the Massachusetts Municipal Sewage Treatment Plant, the average SARS-CoV-2 concentration in six sewage treatment plant samples was up to 220 copies/mL (Wu et al., 2020a). In 23 sewage treatment plants in France, the average SARS-CoV-2 concentration was 50–3000 copies/mL (Wurtzer et al., 2020), while in 42 sewage treatment plants in Spain, the average concentration was 300 copies/mL in influents (Randazzo et al., 2020). The SARS-CoV-2 concentrations in sewage samples are often 4–5 orders of magnitude lower than those in fecal samples, which is due to the dilution effect of sewage and the variation of concentrations in fecal samples (Foladori et al., 2020). This variation inhibits the accurate prediction of SARS-CoV-2 concentrations in sewage.
In summary, even if there is no evidence that the presence of SARS-CoV-2 in sewage is related to SARS-CoV-2 transmission, the detection of SARS-CoV-2 in wastewater can serve as a warning tool and epidemiological indicator to track the prevalence of infected cases. Although there is no conclusive evidence that aerosolized wastewater may contribute to the spread of SARS-CoV-2, the outbreak of SARS-CoV in Amoy Gardens of Hong Kong (2013) confirmed the presence of the virus in wastewater could increase the transmission (Usman et al., 2020).
4.2. Environmental implication of wastewater and COVID-19
Wastewater-based epidemiology is an important tool for tracking the spread of the virus in communities (Foladori et al., 2020, Kitajima et al., 2020). Specifically, by determining the concentration of SARS-CoV-2 RNA load in the inlet samples of a sewage treatment plant, and combining these data with those on the shedding of SARS-CoV-2 from feces, the SARS-CoV-2 infective status of a population can be inferred, and thus the number of infected people can be predicted (Gonzalez et al., 2020, Hart and Halden, 2020). Ahmed et al. detected SARS-CoV-2 in untreated sewage samples, and calculated that the median number of infected cases was 171–1090, based on the SARS-CoV-2 concentration and Monte Carlo simulations (Ahmed et al., 2020). Gonzalez et al. studied nine samples from a southeastern Virginian (U.S.A.) sewage treatment plant weekly for 21 successive weeks from mid-March to late July 2020, and found that the frequency of detection of SARS-CoV-2 increased. Specifically, the concentration of SARS-CoV-2 RNA increased from 10 to 10,000 copies/mL, and when it was 100 copies/mL, in mid-March wastewater samples, there were 34 cases of COVID-19 in one county (Gonzalez et al., 2020). Thus, WBE data combined with clinical test data can afford a more comprehensive understanding of SARS-CoV-2 transmission and COVID-19 spread in a population. Randazzo et al. surveyed for SARS-CoV-2 in six sewage treatment plants in the Murcia region of Spain from March to April 2020, and found that detection of SARS-CoV-2 RNA in wastewater in low-endemic areas preceded the first case of COVID-19 reported by the government (Randazzo et al., 2020). Nemudryi et al. performed a 74-day wastewater-monitoring study, and found that detection of SARS-CoV-2 in wastewater occurred 2–4 days before clinical cases of COVID-19 were announced, and that there was a significant correlation between the concentration of SARS-CoV-2 in wastewater and confirmed cases of COVID-19. In addition, genomic studies of SARS-CoV-2 in wastewater enabled the source of the virus to be traced (Nemudryi et al., 2020). Kumar et al. conducted the first epidemiological study of COVID-19 in India using WBE technology, and found that the increase of the SARS-CoV-2 concentration in wastewater was positively correlated with the number of COVID-19 cases (Kumar et al., 2020). In a study in Italy, 6 of 12 sewage-treatment plant water samples were positive for SARS-CoV-2, with one positive sample found a few days before the first COVID-19 case was reported (La Rosa et al., 2020a). This research shows that WBE is invaluable for COVID-19 research, and is a powerful tool for investigating the spatiotemporal trends of SARS-CoV-2 transmission.
A comparison was made between the cost of a predictive WBE model and COVID-19 clinical diagnosis, and it was found that WBE is rapid, inexpensive, and effective (Hart and Halden, 2020). In particular, the authors mentioned that Germany, as the country with the highest SARS-CoV-2 detection capacity in Europe, would take three months to complete nationwide screening at a rate of 100,000 clinical tests per day, at cost of US$1.25bn. However, samples from more than 9000 sewage treatment plants in Germany could be tested in two days at a cost of only US$145,000. Therefore, WBE would be cheaper and faster than clinical screening for determining the worldwide SARS-CoV-2 infection situation (Hart and Halden, 2020). By monitoring and quantifying SARS-CoV-2 in sewage, epidemiological approaches can be used to assess variations in the number of early infections in the community, and during outbreaks (Daughton, 2020). In addition, the effectiveness of epidemic prevention and control could be greatly improved by epidemiological surveys of sewage samples, as these would yield information on asymptomatic infections, incubation periods, and mild infections. Researchers can determine the abundance of SARS-CoV-2 RNA, and thereby infer the number of people who may be infected (Lodder and Husman, 2020). At present, many countries and regions around the world (e.g., Wuhan (China), New York, and Seattle (U.S.A.)) are carrying out WBE studies to screen for SARS-CoV-2 infection. Longitudinal monitoring of SARS-CoV-2 in community wastewater can enable infection levels to be determined over time, and thus improve the efficiency and decrease the costs of ongoing medical screening. In addition, WBE SARS-CoV-2 surveillance may help to evaluate the severity of a pandemic outbreak at an early stage, as has been found in the prevention and control of pandemic influenza in developing countries (Ahmed et al., 2020, Foladori et al., 2020, La Rosa et al., 2020b).
Therefore, we can infer the community that may be infected by virus through longitudinal monitoring of the existence of virus in the wastewater, to carry out COVID-19 screening in a certain community. On the one hand, it improves the screening efficiency, on the other hand, it also saves the cost. Therefore, the establishment of SARS-CoV-2 based on wastewater epidemiological monitoring technology can help to assess the early outbreak stage of the severe pandemic virus, especially in developing countries for the prevention and control of pandemic influenza (Ahmed et al., 2020, Foladori et al., 2020, la Rosa et al., 202b).
Overall, WBE monitoring of COVID-19 spread is a fairly impartial method that reflects the transmission of SARS-CoV-2 in the population in real time, in terms of the concentration of SARS-CoV-2 in wastewater. This is a useful approach in areas where resources are scarce and clinical-testing capacity is inadequate. To build a reliable WBE COVID-19 model, accurate quantitation of SARS-CoV-2 must be achieved. Therefore, the following aspects should be considered.
-
(1)
Sample collection: Studies typically involve the collection and analysis of water samples from sewage treatment plants. Thus, sampling factors must be considered, such as the type of sampling (periodic or continuous), the time of sampling, the off-time, the preservation and transportation of samples, and how rapidly SARS-CoV-2 is transmitted in wastewater. In addition, the effects of the sewage flow rate and temperature on the wastewater content must be considered in the modeling.
-
(2)
SARS-CoV-2 detection methods: The main detection methods involve wastewater sample pretreatment and quantitation of SARS-CoV-2 RNA. Lu et al. reviewed published COVID-19 research, and found that most studies (17/18) used primary concentration methods to concentrate SARS-CoV-2 particles or genome fragments in wastewater samples (Lu et al., 2020). They note that to accurately and reliably quantitate RNA in small volumes (50 mL), electronegativity membrane filtration with added magnesium chloride may be used to prepare samples. When dealing with large volumes (50–1000 mL), polyethylene glycol-based separation methods may be used, followed by standing overnight in a separating funnel, as an alternative to primary enrichment methods. The standard SARS-CoV-2 detection methods are reverse transcription-polymerase chain reaction (RT-PCR) and RT-quantitative PCR, typically with primers for the N, E, and RdRp genes being used. The application of sequencing technology has also made the results from such analyses more reliable.
-
(3)
Population factors: The occurrence and persistence of SARS-CoV-2 in fecal samples and wastewater. The SARS-CoV-2 concentration in fecal samples varies due to differences between individuals, infection periods, and other factors. In particular, the population density and the number of infected persons in an area directly affect the detection and concentration of SARS-CoV-2 in wastewater. In addition, the particles and pollutants in sewage, as well as its temperature, may affect SARS-CoV-2 concentrations.
In conclusion, many WBE studies of COVID-19 spread have proven that this approach is feasible. However, to build an accurate evaluation model for the prevention and control of COVID-19, SARS-CoV-2 RNA detection methods must be standardized, and all of the factors that may affect the survival of SARS-CoV-2 RNA in wastewater must be considered.
5. Conclusion
The COVID-19 pandemic, and governments’ responses to it, have had a substantial effect on people’s lives and livelihoods worldwide. This paper reviewed the relationships between atmospheric environment, wastewater and COVID-19. In terms of the atmospheric environment, climate conditions and air pollution appear to correlate with the COVID-19 cases, with lower temperatures and humidity favoring the persistence and transmission of SARS-CoV-2, and a positive correlation existing between higher concentrations of air pollution and numbers of cases of COVID-19 in a given area. In terms of the wastewater, SARS-CoV-2 detection in sewage treatment plants can be used for epidemiological studies of COVID-19. Such WBE studies enable early detection of the numbers of SARS-CoV-2 infected people in a community. In addition, they are a cost-effective means of monitoring in an outbreak area. Thus, an understanding of the environmental factors can provide further data on SARS-CoV-2 infection, and may therefore be helpful in COVID-19 pandemic prevention and control, especially in developing countries.
This review is limited by the fact that it is primarily based on papers about COVID-19 that were published before October 2020, some of which have not been peer-reviewed. Moreover, its focus on the effects of the atmospheric environment and wastewater environment on the spread of COVID-19 shows that the relationship between these two factors and COVID-19 is inconsistent. There is thus a need for further systematic research on the relationship between environmental factors and COVID-19, to enable governments to develop effective pandemic prevention measures that are suitable to specific populations. This should involve the construction of a model of SARS-CoV-2 transmission mediated by environmental factors.
Declaration of Competing Interest
The authors declare that they have no known competing financial interests or personal relationships that could have appeared to influence the work reported in this paper.
Acknowledgment
This research was financially supported by General Research Fund of Hong Kong (No. 18300919), FLASS Dean's Research Fund (FLASS/DRF 04424, 04389, 04547 & 04535) and Internal Teaching Development Grant (T0221) of The Education University of Hong Kong.
Edited by: Richard Handy
References
- Ahmed W., Angel N., Edson J., Bibby K., Bivins A., O’Brien J.W., Choi P.M., Kitajima M., Simpson S.L., Li J., Tscharke B., Verhagen R., Smith W.J.M., Zaugg J., Dierens L., Hugenholtz P., Thomas K.V., Mueller J.F. First confirmed detection of SARS-CoV-2 in untreated wastewater in Australia: a proof of concept for the wastewater surveillance of COVID-19 in the community. Sci. Total Environ. 2020;728 doi: 10.1016/j.scitotenv.2020.138764. [DOI] [PMC free article] [PubMed] [Google Scholar]
- Alifano M., Alifano P., Forgez P., Iannelli A. Renin-angiotensin system at the heart of COVID-19 pandemic. Biochimie. 2020;174:30–33. doi: 10.1016/j.biochi.2020.04.008. [DOI] [PMC free article] [PubMed] [Google Scholar]
- Arias Velásquez R.M., Mejía Lara J.V. Gaussian approach for probability and correlation between the number of COVID-19 cases and the air pollution in Lima. Urban Clim. 2020;33 doi: 10.1016/j.uclim.2020.100664. [DOI] [PMC free article] [PubMed] [Google Scholar]
- Bashir M.F., Ma B.J., Bilal, Komal B., Bashir M.A., Farooq T.H., Iqbal N., Bashir M. Correlation between environmental pollution indicators and COVID-19 pandemic: a brief study in Californian context. Environ. Res. 2020;187 doi: 10.1016/j.envres.2020.109652. [DOI] [PMC free article] [PubMed] [Google Scholar]
- Bashir M.F., Ma B.J., Bilal, Komal B., Bashir M.A., Tan D.J., Bashir M. Correlation between climate indicators and COVID-19 pandemic in New York, USA. Sci. Total Environ. 2020;728 doi: 10.1016/j.scitotenv.2020.138835. [DOI] [PMC free article] [PubMed] [Google Scholar]
- Beig G., Bano S., Sahu S.K., Anand V., Korhale N., Rathod A., Yadav R., Mangaraj P., Murthy B.S., Singh S., Latha R., Shinde R. COVID-19 and environmental -weather markers: unfolding baseline levels and veracity of linkages in tropical India. Environ. Res. 2020;191 doi: 10.1016/j.envres.2020.110121. [DOI] [PMC free article] [PubMed] [Google Scholar]
- Borro M., Di Girolamo P., Gentile G., De Luca O., Preissner R., Marcolongo A., Ferracuti S., Simmaco M. Evidence-based considerations exploring relations between SARS-CoV-2 pandemic and air pollution: involvement of PM2.5-mediated up-regulation of the viral receptor ACE-2. Int. J. Environ. Res. Public Health. 2020;17(15):5573. doi: 10.3390/ijerph17155573. [DOI] [PMC free article] [PubMed] [Google Scholar]
- Bukhari Q., Massaro J.M., D’Agostino R.B., Khan S. Effects of weather on coronavirus pandemic. Int. J. Environ. Res. Public Health. 2020;17(15):5399. doi: 10.3390/ijerph17155399. [DOI] [PMC free article] [PubMed] [Google Scholar]
- Carlson C.J., Gomez A.C.R., Bansal S., Ryan S.J. Misconceptions about weather and seasonality must not misguide COVID-19 response. Nat. Commun. 2020;11(1):4312. doi: 10.1038/s41467-020-18150-z. [DOI] [PMC free article] [PubMed] [Google Scholar]
- Casanova L.M., Jeon S., Rutala W.A., Weber D.J., Sobsey M.D. Effects of air temperature and relative humidity on coronavirus survival on surfaces. Appl. Environ. Microbiol. 2010;76(9):2712–2717. doi: 10.1128/AEM.02291-09. [DOI] [PMC free article] [PubMed] [Google Scholar]
- Chakrabarti S.S., Kaur U., Banerjee A., Ganguly U., Banerjee T., Saha S., Parashar G., Prasad S., Chakrabarti S., Mittal A., Agrawal B.K., Rawal R.K., Zhao R.C., Gambhir I.S., Khanna R., Shetty A.K., Jin K., Chakrabarti S. COVID-19 in India: are biological and environmental factors helping to stem the incidence and severity? Aging Dis. 2020;11(3):480–488. doi: 10.14336/AD.2020.0402. [DOI] [PMC free article] [PubMed] [Google Scholar]
- Coker E.S., Cavalli L., Fabrizi E., Guastella G., Lippo E., Parisi M.L., Pontarollo N., Rizzati M., Varacca A., Vergalli S. The effects of air pollution on COVID-19 related mortality in Northern Italy. Environ. Resour. Econ. 2020;76:611–634. doi: 10.1007/s10640-020-00486-1. [DOI] [PMC free article] [PubMed] [Google Scholar]
- Cole M.A., Ozgen C., Strobl E. Air pollution exposure and covid-19 in dutch municipalities. Environ. Resour. Econ. 2020;76:581–610. doi: 10.1007/s10640-020-00491-4. [DOI] [PMC free article] [PubMed] [Google Scholar]
- Conticini E., Frediani B., Caro D. Can atmospheric pollution be considered a co-factor in extremely high level of SARS-CoV-2 lethality in Northern Italy? Environ. Pollut. 2020;261 doi: 10.1016/j.envpol.2020.114465. [DOI] [PMC free article] [PubMed] [Google Scholar]
- Copat C., Cristaldi A., Fiore M., Grasso A., Zuccarello P., Signorelli S.S., Conti G.O., Ferrante M. The role of air pollution (PM and NO2) in COVID-19 spread and lethality: a systematic review. Environ. Res. 2020;191 doi: 10.1016/j.envres.2020.110129. [DOI] [PMC free article] [PubMed] [Google Scholar]
- Domingo J.L., Marques M., Rovira J. Influence of airborne transmission of SARS-CoV-2 on COVID-19 pandemic. A review. Environ. Res. 2020;188 doi: 10.1016/j.envres.2020.109861. [DOI] [PMC free article] [PubMed] [Google Scholar]
- Eccles R., Wilkinson J.E. Exposure to cold and acute upper respiratory tract infection. Rhinology. 2015;53(2):99–106. doi: 10.4193/Rhino14.239. [DOI] [PubMed] [Google Scholar]
- Fattorini D., Regoli F. Role of the chronic air pollution levels in the Covid-19 outbreak risk in Italy. Environ. Pollut. 2020;264 doi: 10.1016/j.envpol.2020.114732. [DOI] [PMC free article] [PubMed] [Google Scholar]
- Foladori P., Cutrupi F., Segata N., Manara S., Pinto F., Malpei F., Bruni L., La Rosa G. SARS-CoV-2 from faeces to wastewater treatment: what do we know? A review. Sci. Total Environ. 2020;743 doi: 10.1016/j.scitotenv.2020.140444. [DOI] [PMC free article] [PubMed] [Google Scholar]
- Gonzalez R., Curtis K., Bivins A., Bibby K., Weir M.H., Yetka K., Thompson H., Keeling D., Mitchell J., Gonzalez D. COVID-19 surveillance in Southeastern Virginia using wastewater-based epidemiology. Water Res. 2020;186 doi: 10.1016/j.watres.2020.116296. [DOI] [PMC free article] [PubMed] [Google Scholar]
- Gupta A., Bherwani H., Gautam S., Anjum S., Musugu K., Kumar N., Anshul A., Kumar R. Air pollution aggravating COVID-19 lethality? Exploration in Asian cities using statistical models. Environ., Dev. Sustain. 2020 doi: 10.1007/s10668-020-00878-9. [DOI] [PMC free article] [PubMed] [Google Scholar]
- Gupta S., Raghuwanshi G.S., Chanda A. Effect of weather on COVID-19 spread in the US: a prediction model for India in 2020. Sci. Total Environ. 2020;728 doi: 10.1016/j.scitotenv.2020.138860. [DOI] [PMC free article] [PubMed] [Google Scholar]
- Hart O.E., Halden R.U. Computational analysis of SARS-CoV-2/COVID-19 surveillance by wastewater-based epidemiology locally and globally: feasibility, economy, opportunities and challenges. Sci. Total Environ. 2020;730 doi: 10.1016/j.scitotenv.2020.138875. [DOI] [PMC free article] [PubMed] [Google Scholar]
- Hasan S.W., Ibrahim Y., Daou M., Kannout H., Jan N., Lopes A., Alsafar H., Yousef A.F. Detection and quantification of SARS-CoV-2 RNA in wastewater and treated effluents: surveillance of COVID-19 epidemic in the United Arab Emirates. Sci. Total Environ. 2021;764 doi: 10.1016/j.scitotenv.2020.142929. [DOI] [PMC free article] [PubMed] [Google Scholar]
- Hata, A., Honda, R., Hara-Yamamura, H., Meuchi, Y., 2020. Detection of SARS-CoV-2 in wastewater in Japan by multiple molecular assays-implication for wastewater-based epidemiology (WBE). medRxiv. doi: 10.1101/2020.06.09.20126417.
- Kitajima M., Ahmed W., Bibby K., Carducci A., Gerba C.P., Hamilton K.A., Haramoto E., Rose J.B. SARS-CoV-2 in wastewater: state of the knowledge and research needs. Sci. Total Environ. 2020;739 doi: 10.1016/j.scitotenv.2020.139076. [DOI] [PMC free article] [PubMed] [Google Scholar]
- Kumar M., Patel A.K., V.Shah A., Raval J., Rajpara N., Joshi M., Joshi C.G. First proof of the capability of wastewater surveillance for COVID-19 in India through detection of genetic material of SARS-CoV-2. Sci. Total Environ. 2020;746 doi: 10.1016/j.scitotenv.2020.141326. [DOI] [PMC free article] [PubMed] [Google Scholar]
- La Rosa G., Iaconelli M., Mancini P., Bonanno Ferraro G., Veneri C., Bonadonna L., Lucentini L., Suffredini E. First detection of SARS-CoV-2 in untreated wastewaters in Italy. Sci. Total Environ. 2020;736 doi: 10.1016/j.scitotenv.2020.139652. [DOI] [PMC free article] [PubMed] [Google Scholar]
- Leecaster M., Gesteland P., Greene T., Walton N., Gundlapalli A., Rolfs R., Byington C., Samore M. Modeling the variations in pediatric respiratory syncytial virus seasonal epidemics. BMC Infect. Dis. 2011;11:105. doi: 10.1186/1471-2334-11-105. [DOI] [PMC free article] [PubMed] [Google Scholar]
- Liang D., Shi L., Zhao J., Liu P., Sarnat J.A., Gao S., Schwartz J., Liu Y., Ebelt S.T., Scovronick N. Urban air pollution may enhance COVID-19 case-fatality and mortality rates in the United States. Innovation. 2020;1(3) doi: 10.1016/j.xinn.2020.100047. [DOI] [PMC free article] [PubMed] [Google Scholar]
- Lipsitch M., Grad Y.H., Sette A., Crotty S. Cross-reactive memory T cells and herd immunity to SARS-CoV-2. Nat. Rev. Immunol. 2020;20(11):709–713. doi: 10.1038/s41577-020-00460-4. [DOI] [PMC free article] [PubMed] [Google Scholar]
- Lodder W., Husman A.M.D. SARS-CoV-2 in wastewater: potential health risk, but also data source. Lancet Gastroenterol. Hepatol. 2020;5(6):533–534. doi: 10.1016/S2468-1253(20)30087-X. [DOI] [PMC free article] [PubMed] [Google Scholar]
- Longhin E., Holme J.A., Gualtieri M., Camatini M., Øvrevik J. Milan winter fine particulate matter (wPM2.5) induces IL-6 and IL-8 synthesis in human bronchial BEAS-2B cells, but specifically impairs IL-8 release. Toxicol. Vitr. 2018;52:365–373. doi: 10.1016/j.tiv.2018.07.016. [DOI] [PubMed] [Google Scholar]
- Ma Y., Zhao Y., Liu J., He X., Wang B., Fu S., Yan J., Niu J., Zhou J., Luo B. Effects of temperature variation and humidity on the death of COVID-19 in Wuhan, China. Sci. Total Environ. 2020;724 doi: 10.1016/j.scitotenv.2020.138226. [DOI] [PMC free article] [PubMed] [Google Scholar]
- Magazzino C., Mele M., Schneider N. The relationship between air pollution and COVID-19-related deaths: an application to three French cities. Appl. Energy. 2020;279 doi: 10.1016/j.apenergy.2020.115835. [DOI] [PMC free article] [PubMed] [Google Scholar]
- Malki Z., Atlam E.-S., Hassanien A.E., Dagnew G., Elhosseini M.A., Gad I. Association between weather data and COVID-19 pandemic predicting mortality rate: machine learning approaches. Chaos, solitons, Fractals. 2020;138 doi: 10.1016/j.chaos.2020.110137. [DOI] [PMC free article] [PubMed] [Google Scholar]
- Medema G., Heijnen L., Elsinga G., Italiaander R., Brouwer A. Presence of SARS-coronavirus-2 RNA in sewage and correlation with reported COVID-19 prevalence in the early stage of the epidemic in The Netherlands. Environ. Sci. Technol. Lett. 2020;7(7):511–516. doi: 10.1021/acs.estlett.0c00357. [DOI] [PubMed] [Google Scholar]
- Menebo M.M. Temperature and precipitation associate with covid-19 new daily cases: a correlation study between weather and covid-19 pandemic in Oslo, Norway. Sci. Total Environ. 2020;737 doi: 10.1016/j.scitotenv.2020.139659. [DOI] [PMC free article] [PubMed] [Google Scholar]
- Nemudryi A., Nemudraia A., Wiegand T., Surya K., Buyukyoruk M., Cicha C., Vanderwood K.K., Wilkinson R., Wiedenheft B. Temporal detection and phylogenetic assessment of SARS-CoV-2 in municipal wastewater. Cell Rep. Med. 2020;1(6) doi: 10.1016/j.xcrm.2020.100098. [DOI] [PMC free article] [PubMed] [Google Scholar]
- Ogen Y. Assessing nitrogen dioxide (NO2) levels as a contributing factor to coronavirus (COVID-19) fatality. Sci. Total Environ. 2020;726 doi: 10.1016/j.scitotenv.2020.138605. [DOI] [PMC free article] [PubMed] [Google Scholar]
- Otter J.A., Donskey C., Yezli S., Douthwaite S., Goldenberg S.D., Weber D.J. Transmission of SARS and MERS coronaviruses and influenza virus in healthcare settings: the possible role of dry surface contamination. J. Hosp. Infect. 2016;92(3):235–250. doi: 10.1016/j.jhin.2015.08.027. [DOI] [PMC free article] [PubMed] [Google Scholar]
- Panasevich S., Leander K., Rosenlund M., Ljungman P., Bellander T., de Faire U., Pershagen G., Nyberg F. Associations of long- and short-term air pollution exposure with markers of inflammation and coagulation in a population sample. Occup. Environ. Med. 2009;66(11):747–753. doi: 10.1136/oem.2008.043471. [DOI] [PubMed] [Google Scholar]
- Peng X., Xu X., Li Y., Cheng L., Zhou X., Ren B. Transmission routes of 2019-nCoV and controls in dental practice. Int. J. Oral. Sci. 2020;12(1):1–6. doi: 10.1038/s41368-020-0075-9. [DOI] [PMC free article] [PubMed] [Google Scholar]
- Petersen E., Koopmans M., Go U., Hamer D.H., Petrosillo N., Castelli F., Storgaard M., Al Khalili S., Simonsen L. Comparing SARS-CoV-2 with SARS-CoV and influenza pandemics. Lancet Infect. Dis. 2020;20(9):E238–E244. doi: 10.1016/S1473-3099(20)30484-9. [DOI] [PMC free article] [PubMed] [Google Scholar]
- Prata D.N., Rodrigues W., Bermejo P.H. Temperature significantly changes COVID-19 transmission in (sub)tropical cities of Brazil. Sci. Total Environ. 2020;729 doi: 10.1016/j.scitotenv.2020.138862. [DOI] [PMC free article] [PubMed] [Google Scholar]
- Rafiefard F., Yun Z., Örvell C. Epidemiologic characteristics and seasonal distribution of human metapneumovirus infections in five epidemic seasons in Stockholm, Sweden, 2002–2006. J. Med. Virol. 2008;80(9):1631–1638. doi: 10.1002/jmv.21242. [DOI] [PubMed] [Google Scholar]
- Randazzo W., Truchado P., Cuevas-Ferrando E., Simon P., Allende A., Sanchez G. SARS-CoV-2 RNA in wastewater anticipated COVID-19 occurrence in a low prevalence area. Water Res. 2020;181 doi: 10.1016/j.watres.2020.115942. [DOI] [PMC free article] [PubMed] [Google Scholar]
- Riddell S., Goldie S., Hill A., Eagles D., Drew T.W. The effect of temperature on persistence of SARS-CoV-2 on common surfaces. Virol. J. 2020;17(1):145. doi: 10.1186/s12985-020-01418-7. [DOI] [PMC free article] [PubMed] [Google Scholar]
- Rosario D.K.A., Mutz Y.S., Bernardes P.C., Conte-Junior C.A. Relationship between COVID-19 and weather: case study in a tropical country. Int. J. Hyg. Environ. Health. 2020;229 doi: 10.1016/j.ijheh.2020.113587. [DOI] [PMC free article] [PubMed] [Google Scholar]
- Şahin M. Impact of weather on COVID-19 pandemic in Turkey. Sci. Total Environ. 2020;728 doi: 10.1016/j.scitotenv.2020.138810. [DOI] [PMC free article] [PubMed] [Google Scholar]
- Schwartz D.A., Graham A.L. Potential Maternal and Infant Outcomes from Coronavirus 2019-nCoV (SARS-CoV-2) Infecting Pregnant Women: lessons from SARS, MERS, and other human coronavirus infections. Viruses. 2020;12(2):194. doi: 10.3390/v12020194. [DOI] [PMC free article] [PubMed] [Google Scholar]
- Setti L., Passarini F., De Gennaro G., Barbieri P., Perrone M.G., Borelli M., Palmisani J., Di Gilio A., Torboli V., Fontana F. SARS-Cov-2RNA found on particulate matter of Bergamo in Northern Italy: first evidence. Environ. Res. 2020;188 doi: 10.1016/j.envres.2020.109754. [DOI] [PMC free article] [PubMed] [Google Scholar]
- Suwantarat N., Apisarnthanarak A. Risks to healthcare workers with emerging diseases: lessons from MERS-CoV, Ebola, SARS, and avian flu. Curr. Opin. Infect. Dis. 2015;28(4):349–361. doi: 10.1097/QCO.0000000000000183. [DOI] [PubMed] [Google Scholar]
- Tosepu R., Gunawan J., Effendy D.S., Ahmad L.O.A.I., Lestari H., Bahar H., Asfian P. Correlation between weather and Covid-19 pandemic in Jakarta, Indonesia. Sci. Total Environ. 2020;725 doi: 10.1016/j.scitotenv.2020.138436. [DOI] [PMC free article] [PubMed] [Google Scholar]
- Trottier J., Darques R., Ait Mouheb N., Partiot E., Bakhache W., Deffieu M.S., Gaudin R. Post-lockdown detection of SARS-CoV-2 RNA in the wastewater of Montpellier, France. One Health. 2020;10 doi: 10.1016/j.onehlt.2020.100157. [DOI] [PMC free article] [PubMed] [Google Scholar]
- Usman M., Farooq M., Hanna K. Existence of SARS-CoV-2 in wastewater: implications for its environmental transmission in developing communities. Environ. Sci. Technol. 2020;54(13):7758–7759. doi: 10.1021/acs.est.0c02777. [DOI] [PubMed] [Google Scholar]
- van Doremalen N., Bushmaker T., Morris D.-H., Holbrook M.G., Gamble A., Williamson B.-N., Tamin A., Harcourt J.-L.l., Thornburg N.-J., Gerber S.-I., Lloyd-Smith J.-O., de Wit E., Munster V.-J. Aerosol and surface stability of HCoV-19 (SARS-CoV-2) compared to SARS-CoV-1. N. Engl. J. Med. 2020 doi: 10.1101/2020.03.09.20033217. [DOI] [PMC free article] [PubMed] [Google Scholar]
- Vasickova P., Pavlik I., Verani M., Carducci A. Issues concerning survival of viruses on surfaces. Food Environ. Virol. 2010;2(1):24–34. [Google Scholar]
- Wang, M., Jiang, A., Gong, L., Luo, L., Guo, W., Li, C., Zheng, J., Li, C., Yang, B. and Zeng, J.,2020. Temperature significant change COVID-19 Transmission in 429 cities. medRxiv, 10.1101/2020.02.22.20025791. [DOI]
- Wang X., Li J., Guo T., Zhen B., Kong Q., Yi B., Li Z., Song N., Jin M., Xiao W. Concentration and detection of SARS coronavirus in sewage from Xiao Tang Shan Hospital and the 309th Hospital of the Chinese People’s Liberation Army. Water Sci. Technol. 2005;52(8):213–221. [PubMed] [Google Scholar]
- Wang X.W., Li J.S., Jin M., Zhen B., Kong Q.X., Song N., Xiao W.J., Yin J., Wei W., Wang G.J., Si B.Y., Guob B.Z., Liu C., Ou G.R., Wang M.N., Fang T.Y., Chao F.H., Li J.W. Study on the resistance of severe acute respiratory syndrome-associated coronavirus. J. Virol. Methods. 2005;126(1–2):171–177. doi: 10.1016/j.jviromet.2005.02.005. [DOI] [PMC free article] [PubMed] [Google Scholar]
- Watson M., Gilmour R., Menzies R., Ferson M., McIntyre P., Pneumococcal N.S.W. The association of respiratory viruses, temperature, and other climatic parameters with the incidence of invasive pneumococcal disease in Sydney, Australia. Clin. Infect. Dis. 2006;42(2):211–215. doi: 10.1086/498897. [DOI] [PubMed] [Google Scholar]
- Westhaus S., Weber F.-A., Schiwy S., Linnemann V., Brinkmann M., Widera M., Greve C., Janke A., Hollert H., Wintgens T., Ciesek S. Detection of SARS-CoV-2 in raw and treated wastewater in Germany – suitability for COVID-19 surveillance and potential transmission risks. Sci. Total Environ. 2021;751 doi: 10.1016/j.scitotenv.2020.141750. [DOI] [PMC free article] [PubMed] [Google Scholar]
- Wigginton K., Ye Y., Ellenberg R. Emerging investigators series: the source and fate of pandemic viruses in the urban water cycle. Environ. Sci. Water Res. Technol. 2015;1(6):735–746. [Google Scholar]
- Wigginton K.R., Ye Y., Ellenberg R.M. Emerging investigators series: the source and fate of pandemic viruses in the urban water cycle. Environ. Sci. Water Res. Technol. 2015;1(6):735–746. [Google Scholar]
- Wu F., Zhang J., Xiao A., Gu X., Lee W.L., Armas F., Kauffman K., Hanage W., Matus M., Ghaeli N. SARS-CoV-2 titers in wastewater are higher than expected from clinically confirmed cases. Msystems. 2020;5(4) doi: 10.1128/mSystems.00614-20. [DOI] [PMC free article] [PubMed] [Google Scholar]
- Wu, X., Nethery, R.C., Sabath, B.M., Braun, D., Dominici, F., 2020b. Exposure to air pollution and COVID-19 mortality in the United States. medRxiv. doi: 10.1101/2020.04.05.20054502. [DOI] [PMC free article] [PubMed]
- Wurtzer, S., Marechal, V., Mouchel, J.-M., Maday, Y., Teyssou, R., Richard, E., Almayrac, J.L., Moulin, L., 2020. Evaluation of lockdown impact on SARS-CoV-2 dynamics through viral genome quantification in Paris wastewaters. medRxiv. doi: 10.1101/2020.04.12.20062679. [DOI] [PMC free article] [PubMed]
- Xie J., Zhu Y. Association between ambient temperature and COVID-19 infection in 122 cities from China. Sci. Total Environ. 2020;724 doi: 10.1016/j.scitotenv.2020.138201. [DOI] [PMC free article] [PubMed] [Google Scholar]
- Xu H., Yan C.H., Fu Q.Y., Xiao K., Yu Y.M., Han D.M., Wang W.H., Cheng J.P. Possible environmental effects on the spread of COVID-19 in China. Sci. Total Environ. 2020;731 doi: 10.1016/j.scitotenv.2020.139211. [DOI] [PMC free article] [PubMed] [Google Scholar]
- Yao Y., Pan J., Wang W., Liu Z., Kan H., Qiu Y., Meng X., Wang W. Association of particulate matter pollution and case fatality rate of COVID-19 in 49 Chinese cities. Sci. Total Environ. 2020;741 doi: 10.1016/j.scitotenv.2020.140396. [DOI] [PMC free article] [PubMed] [Google Scholar]
- Zhao C.-N., Xu Z., Wu G.-C., Mao Y.-M., Liu L.-N., Qian W., Dan Y.-L., Tao S.-S., Zhang Q., Sam N.B., Fan Y.-G., Zou Y.-F., Ye D.-Q., Pan H.-F. Emerging role of air pollution in autoimmune diseases. Autoimmun. Rev. 2019;18(6):607–614. doi: 10.1016/j.autrev.2018.12.010. [DOI] [PubMed] [Google Scholar]
- Zhu N., Zhang D., Wang W., Li X., Yang B., Song J., Zhao X., Huang B., Shi W., Lu R. A novel coronavirus from patients with pneumonia in China, 2019. N. Engl. J. Med. 2020;382:727–733. doi: 10.1056/NEJMoa2001017. [DOI] [PMC free article] [PubMed] [Google Scholar]
- Zhu Y., Xie J., Huang F., Cao L. Association between short-term exposure to air pollution and COVID-19 infection: evidence from China. Sci. Total Environ. 2020;727 doi: 10.1016/j.scitotenv.2020.138704. [DOI] [PMC free article] [PubMed] [Google Scholar]