Abstract
Cholangiopathies caused by biliary epithelial cell (BEC) injury represent a leading cause of liver failure. No effective pharmacologic therapies exist, and the underlying mechanisms remain obscure. We aimed to explore the mechanisms of bile duct repair after targeted BEC injury. Injection of intermedilysin into BEC-specific human CD59 (hCD59) transgenic mice induced acute and specific BEC death, representing a model to study the early signals that drive bile duct repair. Acute BEC injury induced cholestasis followed by CCR2+ monocyte recruitment and BEC proliferation. Using microdissection and next-generation RNA-Seq, we identified 5 genes, including Mapk8ip2, Cdkn1a, Itgb6, Rgs4, and Ccl2, that were most upregulated in proliferating BECs after acute injury. Immunohistochemical analyses confirmed robust upregulation of integrin αvβ6 (ITGβ6) expression in this BEC injury model, after bile duct ligation, and in patients with chronic cholangiopathies. Deletion of the Itgb6 gene attenuated BEC proliferation after acute bile duct injury. Macrophage depletion or Ccr2 deficiency impaired ITGβ6 expression and BEC proliferation. In vitro experiments revealed that bile acid–activated monocytes promoted BEC proliferation through ITGβ6. Our data suggest that BEC injury induces cholestasis, monocyte recruitment, and induction of ITGβ6, which work together to promote BEC proliferation and therefore represent potential therapeutic targets for cholangiopathies.
Keywords: Hepatology
Keywords: Apoptosis survival pathways, Growth factors, Macrophages
Introduction
The biliary tree occupies a substantial space in the liver and has crucial functions such as the transport and maturation of bile (1). Cholangiopathies led to approximately 16% of liver transplantations in the USA between 1988 and 2014 (2) and include primary sclerosing cholangitis (PSC), primary biliary cholangitis (PBC), biliary atresia, cholangiocarcinoma, sclerosing cholangitis of critically ill patients (SC-CIPs), and coronavirus disease 2019 (COVID-19) cholangiopathy (1, 3). Classical clinical presentations for these disorders include cholestasis and portal inflammation, fibrosis, as well as portal hypertension and disturbances of the liver microcirculation (4). Ductular reaction, which involves biliary epithelial or liver progenitor cell proliferation as well as portal inflammation and portal fibrosis, is observed in numerous hepatopathies and is notably associated with a poor outcome in chronic liver diseases of various etiologies (5, 6). Although several studies reported a potent role for immune cells in promoting the ductular reaction (5, 7–9), the precise mechanisms underlying bile duct injury and regeneration have not been identified because of the lack of a specific biliary epithelial cell (BEC) injury model.
Several models have been used to study BEC injury, but they are associated with chronic injury and inflammation and are not specific for BEC injury (10). For example, multidrug resistance gene 2–deficient (Mdr2-deficient) mice spontaneously develop severe biliary fibrosis and have been extensively used to mimic PSC progression, but the chronicity of this model impedes the study of mechanisms that promote BEC repair (11). Extrahepatic bile duct obstruction has also been induced by injection of biliatresone (12). More recently, a novel model of sclerosing cholangitis has been described, consisting of intrabiliary injection of BV6, an antagonist of the inhibitors of apoptosis (IAP), and leading to TRAIL toxicity and BEC damage (13). Using this model, Guicciardi et al. showed that BEC damage is followed by CCL2-dependent proinflammatory monocyte recruitment, which was prevented by genetic deletion of the Ccr2 gene or using the CCR2/CCR5 antagonist cenicriviroc (13). Impairment of CCL2-dependent monocyte recruitment reduced liver injury and fibrosis in the BV6 model, however, bile duct regeneration has not been characterized in this model. Moreover, it has been shown that conditional deletion of the murine double minute 2 (Mdm2) gene in bile ducts caused BEC senescence, a classic feature in PBC and PSC, and subsequently increased macrophage activation and fibrogenesis (14). These findings further argue in favor of a role for injured cholangiocytes to recruit immune and fibrogenic cells. Bile duct ligation (BDL) surgery is another model widely used to explore cholangiopathies. In this model, cholestasis is induced by ligation and sectioning of the common bile duct. This procedure is associated with intense hepatocyte death and large necrotic areas in the liver, potent inflammation, and perilobular fibrosis (10, 11, 15). All these models suffer from the lack of specific BEC damage or lead to irreversible liver injury that may prevent or obscure BEC-specific tissue responses during bile duct regeneration.
To better understand the consequences attributable to a sole BEC injury and to unravel the mechanisms underlying bile duct repair through BEC proliferation after acute injury, we developed a mouse model of inducible BEC death by overexpressing human CD59 (hCD59) on BECs (biliary-specific hCD59-transgenic mice, referred to hereafter as ihCD59BEC-TG mice). ihCD59BEC-TG mice were generated by breeding floxed hCD59-knockin mice (ihCD59) with Sox9CreERT+ mice that express Cre recombinase under the regulation of the Sox9 promoter following tamoxifen injection. Injection of these mice with intermedilysin (ILY), a pore-forming toxin that lyses hCD59-expressing cells exclusively by binding to hCD59 but not mouse CD59, resulted in the acute, selective death of BECs (16). ILY has a large pharmacological window with no known off-target effects. Thus, ihCD59BEC-TG mice represent an innovative, biliary cell–specific model for studying BEC injury and regeneration after specific cell–targeted acute death. Using this model, we demonstrate here that acute and targeted BEC death was sufficient to induce rapid monocyte recruitment, cholestasis, and liver blood microcirculation impairment. Additionally, bile acid accumulation in the portal area directly drove these recruited monocytes to a regenerative phenotype, enabling these cells to support BEC proliferation through integrin αvβ6.
Results
ihCD59BEC-TG mice: a model of rapid and specific BEC injury and of bile duct repair.
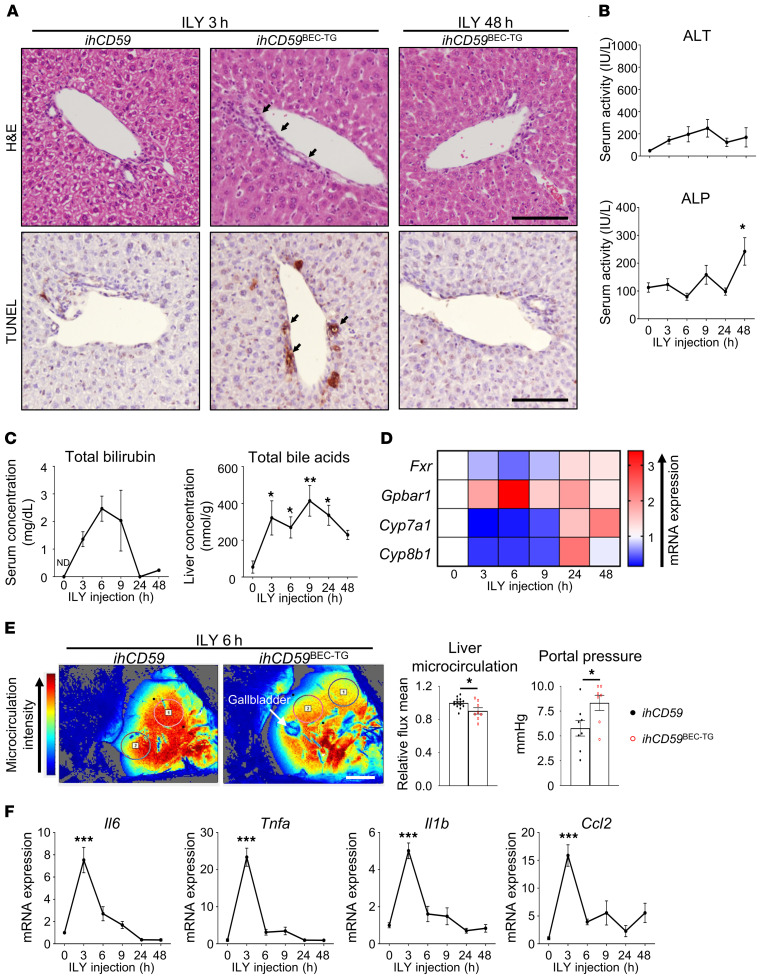
In order to decipher the immunological mechanisms implicated in bile duct injury and repair, and because most mouse liver injury models are associated with strong injury to both hepatocytes and BECs, we took advantage of our recently developed model of targeted acute BEC injury in ILY-treated, BEC-specific (ihCD59BEC-TG) mice (16) and characterized bile duct repair after acute injury. As illustrated by H&E staining in Figure 1A, ILY injection into ihCD59BEC-TG mice rapidly induced mononuclear cell accumulation in the portal areas. In addition, TUNEL staining revealed very localized and specific BEC damage, as early as 3 hours after ILY injection. Neither necrotic areas nor TUNEL+ hepatocytes were observed in the parenchyma (Figure 1A), whereas alanine aminotransferase (ALT) and alkaline phosphatase (ALP) serum levels only showed a limited increase that was possibly attributable to a surrounding hepatocyte stress response (Figure 1B). Acute BEC death led to a potent elevation of the total bilirubin (TBIL) serum concentration, which peaked between 6 and 9 hours after ILY injection (Figure 1C). Interestingly, TUNEL staining and TBIL returned to normal levels 24 hours after the initial injury, thus demonstrating that this procedure yields a model of acute intrahepatic BEC injury (Figures 1, A–C). Cholestasis was also evidenced by an increase in bile acid concentrations in liver homogenates (Figure 1C), and a dysregulation of bile acid metabolism–related gene (Fxr, Gpbar1, Cyp7a1, Cyp8b1) expression (Figure 1D and Supplemental Figure 1A; supplemental material available online with this article; https://doi.org/10.1172/JCI132305DS1). Moreover, portal hypertension and liver ischemia are hallmarks of chronic liver diseases, cholestatic disorders, and arterial thrombosis leading to liver failure (4). Here, we show that acute BEC injury, per se, induced hypoxia-associated Hif1a and Angpt2 mRNA expression (Supplemental Figure 1B), decreased liver microcirculation, and increased portal vein pressure (Figure 1E and Supplemental Figure 1C). Of note, we did not observe persistent liver microcirculation impairment at later time points (data not shown), which is in line with Hif1a and Angpt2 mRNA expression and the rapid liver microcirculation recovery that occurred after acute BEC injury. Moreover, there was a potent and rapid elevation of the inflammation-related cytokines Il6, Tnfa, Il1b, and Ccl2, which peaked 3 hours after ILY injection, indicating an early and intense inflammatory response to acute BEC injury (Figure 1F). All these parameters remained unchanged in control ihCD59 mice injected with ILY (data not shown).
Figure 1. ILY injection triggers a specific and rapid hCD59+ BEC injury leading to liver blood microcirculation impairment and inflammation in ihCD59BEC-TG mice.
ihCD59 (control group) and ihCD59BEC-TG (injured) mice were injected intravenously with ILY (140 μg/kg). Mice were euthanized, and samples were collected at the indicated time points after injection. (A) H&E and TUNEL staining was performed. Black arrows indicate injured bile ducts. Scale bars: 50 μm. (B) ALT and ALP serum levels were measured (n = 3–4 per group). (C) TBIL serum levels and liver bile acid concentrations were measured (n = 3–6 per group). (D) Relative expression of cholestasis-associated genes from snap-frozen liver homogenates (statistical analyses are shown in Supplemental Figure 1A). (E) Liver blood microcirculation from circled areas labeled 1 and 2 and portal vein pressure were measured 6 hours after ILY injection (n = 7–14 per group). Scale bar: 5 mm. (F) Relative expression of inflammation-associated genes from liver homogenates (n = 3–7 per group). Data represent the mean ± SEM. *P < 0.05, **P < 0.01, and ***P < 0.005, compared with control ihCD59 mice, by 1-way ANOVA (B, C, and F) and unpaired Student’s t test (E). ND, nondetectable.
Acute BEC injury alone triggers bile duct repair, i.e., portal fibrogenesis and BEC proliferation.
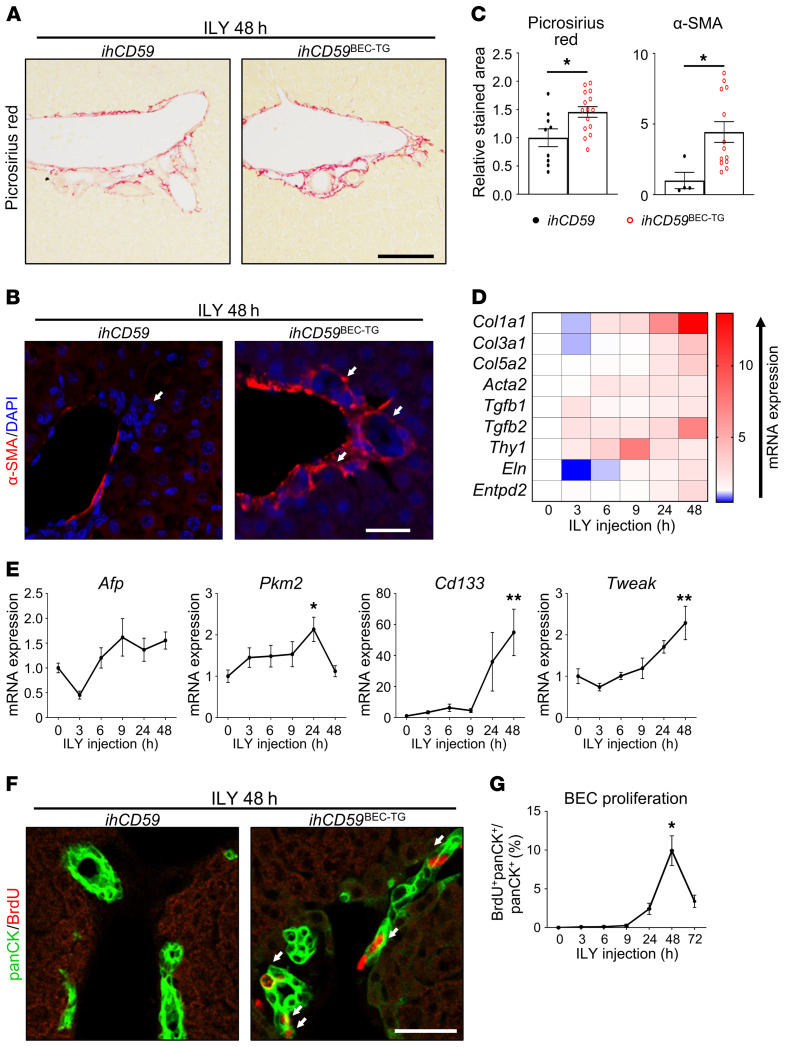
In our model of BEC injury, we demonstrated that acute and targeted BEC injury is sufficient to induce portal fibrogenesis after 48 hours. This was notably shown by the increased Picrosirius red and α-smooth muscle actin (α-SMA) staining (Figure 2, A–C) and the increased expression of fibrogenesis-related genes (Figure 2D and Supplemental Figure 2). Furthermore, we found that hepatic expression of liver regeneration–associated genes including Afp, Pkm2, Cd133, and Tweak (5) was upregulated 48 hours after BEC injury (Figure 2E). Moreover, we examined BEC proliferation by measuring BrdU incorporation into BECs. As illustrated in Figure 2, F and G, BrdU incorporation into pan-cytokeratin+ (panCK+) cells peaked 48 hours after ILY injection. BrdU incorporation into other cells, such as hepatocytes, was very rare (data not shown). To summarize these data, our model of acute BEC death displays the classical histopathology observed in patients with cholangiopathies, including portal inflammation, fibrosis, and BEC proliferation, as well as cholestasis and portal hypertension, and represents what we believe to be a good model to study the early signals that drive bile duct repair.
Figure 2. Acute BEC-specific injury alone triggers portal fibrogenesis and BEC proliferation.
ihCD59 and ihCD59BEC-TG mice were injected intravenously with ILY and euthanized at the indicated time points. Forty-eight hours after ILY injection, (A) Picrosirius red (scale bar: 100 μm) and (B) α-SMA (red) staining was performed. White arrows in the left panel indicate bile ducts, white arrows in the right panel indicate bile ducts surrounded by α-SMA. Scale bar: 20 μm. (C) Picrosirius red– and α-SMA–stained areas were quantified (n = 4–15 per group). (D) Expression of fibrogenesis-related genes was assessed in liver homogenates at the indicated time points after ILY administration (n = 3–7 per group). Statistical analysis is shown in Supplemental Figure 2. (E) Hepatic expression of liver regeneration–associated genes was assessed by qRT-PCR (n = 3–7 per group). (F) Mice were injected with BrdU 2 hours prior to euthanization, and panCK (green) and BrdU (red) staining was performed. White arrows indicate proliferating BECs that incorporated BrdU. (G) BrdU+panCK+ cells were quantified (n = 9–18 per group). Scale bar: 20 μm. Data represent the mean ± SEM. *P < 0.05 and **P < 0.01, compared with control ihCD59 mice, by 1-way ANOVA (E and G) and an unpaired Student’s t test (C).
Microdissection and RNA-Seq identify integrin αvβ6 as one of the most upregulated genes in proliferating BECs after acute BEC injury, which is also observed in patients with cholangiopathies.
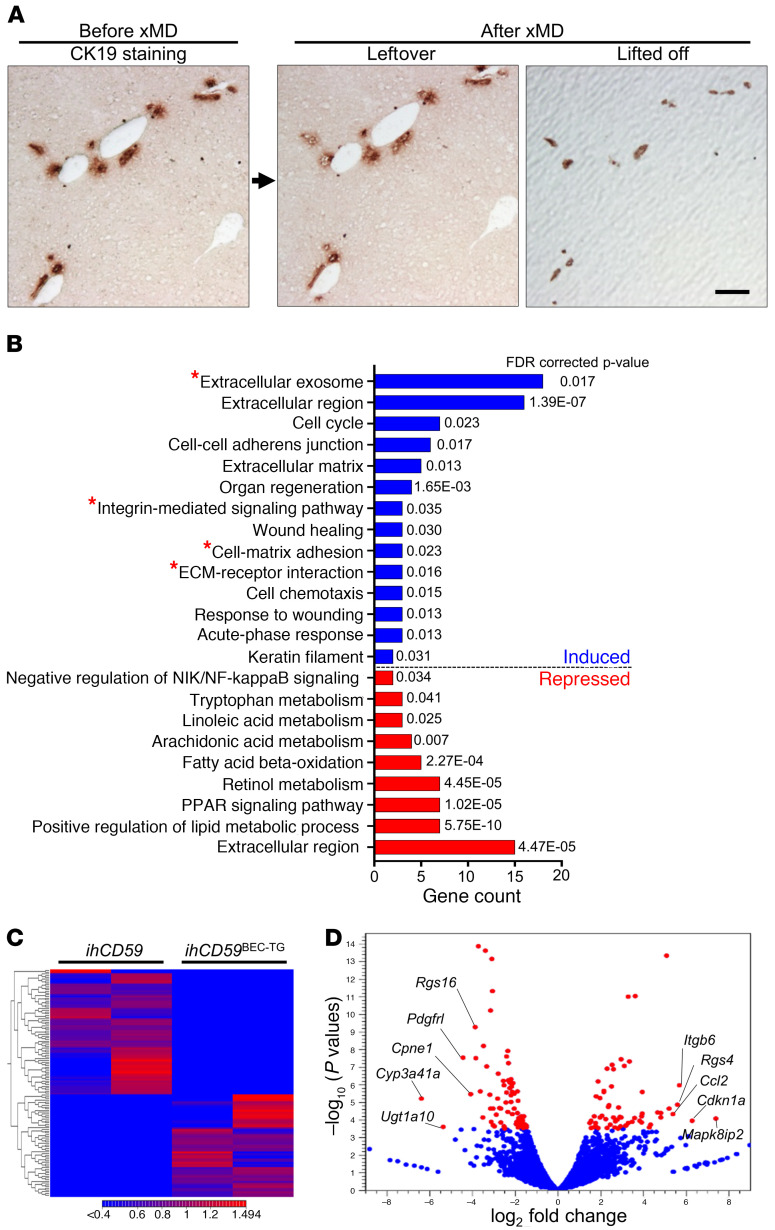
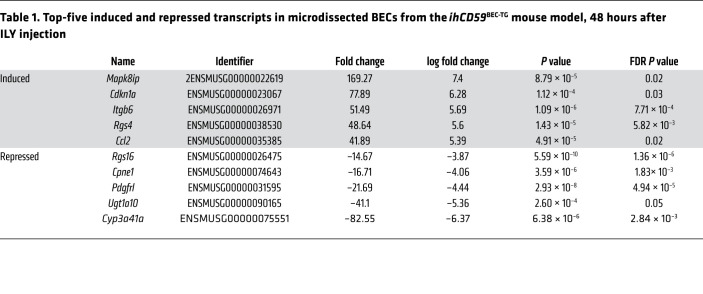
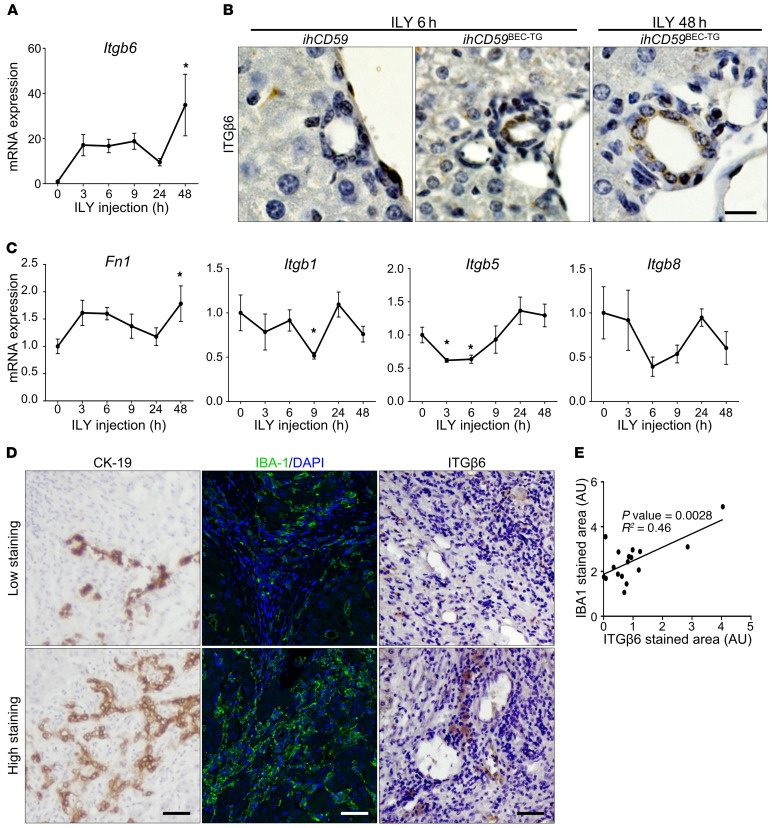
To identify potential mechanisms implicated in bile duct repair after acute cholangiocyte damage, we performed next-generation sequencing and untargeted transcriptome RNA-Seq of purified regenerating BECs 48 hours after ILY-induced injury. We adapted an innovative staining protocol that allowed for next-generation sequencing of the purified BEC’s transcriptome captured by expression microdissection (xMD) (Figure 3A and Supplemental Figure 3). Although the differential gene expression and pathway enrichment analysis revealed significant differences and notably potent induction in organ regeneration and cell-cycle genes, we also observed a clear increase in the expression of extracellular matrix component and adhesion molecule genes (Figure 3, B and C, and Supplemental Table 2). The 5 genes that were most upregulated in proliferating BECs after acute injury included Mapk8ip2, Cdkn1a, Itgb6, Rgs4, and Ccl2 (Figure 3D and Table 1). Ccl2 upregulation, which is in line with data obtained using the BV6 model (13), could have contributed to monocyte recruitment in our model. Cdkn1a, which encodes p21, inhibits cell proliferation and is implicated in cellular senescence, a known phenomenon implicated in the pathogenesis of hepatobiliary diseases (17). The effects of Mapk8ip2 and Rgs4 on cell proliferation have not been reported. In contrast, Itgb6 encodes ITGβ6 protein, which has been suggested to be a prognostic marker in cholangiocarcinoma and to promote BEC and liver progenitor cell proliferation in cholestasis and liver regeneration models (8, 18–21). Using quantitative reverse transcription PCR (qRT-PCR), we confirmed that mRNA expression of Itgb6 was highly elevated in liver homogenates of ILY-injured animals (Figure 4A). Furthermore, ITGβ6 immunostaining revealed very localized ITGβ6 protein expression in BECs 48 hours after ILY injection (Figure 4B). mRNA expression of the adhesion molecule fibronectin 1 (Fn1) (18), an ITGβ6 cognate binding partner, was also increased, whereas other integrins did not show a significant change at 48 hours (Figure 4C). Furthermore, immunohistochemical analyses revealed that ITGβ6 protein was strongly induced in ductular cells in patients with a variety of chronic liver diseases (Figure 4D and Supplemental Figure 4). Finally, we investigated whether macrophage and ductular cell accumulation, hallmarks of chronic liver disease, correlated with ITGβ6 expression in liver sections from patients with cholangiopathies (PBC and PSC). These studies revealed colocalization of macrophages and ITGβ6 staining in CK19+ cells in livers from these patients (Figure 4, D and E).
Figure 3. xMD and RNA-Seq identify ITGβ6 as one of the most upregulated genes in BECs after acute, targeted BEC death.
ihCD59 and ihCD59BEC-TG mice were injected intravenously with ILY. (A) Fresh-frozen liver tissue sections collected 48 hours after ILY injection were stained with a CK19 antibody using an RNA-friendly staining protocol, followed by purification of CK19+ biliary cells by xMD and transcriptome RNA-Seq analysis (n = 2 in each group, as detailed in Supplemental Figure 3). Representative CK19 immunostaining on frozen liver sections and leftover versus lifted-off samples are shown. Only purified BECs (lifted off) were used for RNA-Seq and analysis. Scale bar: 100 μm. (B) GO term enrichment analysis of differentially expressed genes between the control and injured groups. GO terms comprising integrin αvβ6 (Itgb6) are shown with a red star. (C) Heatmap of differentially expressed genes between the injured and control groups. (D) Volcano plot of expressed genes (RPKM ≥0.05). Differentially expressed genes (FDR ≤0.05) between the injured and control groups are shown in red.
Table 1. Top-five induced and repressed transcripts in microdissected BECs from the ihCD59BEC-TG mouse model, 48 hours after ILY injection.
Figure 4. Increased ITGβ6 levels correlate with the ductular reaction in the ILY-ihCD59BEC-TG model and in human chronic liver diseases.
(A–C) ihCD59 and ihCD59BEC-TG mice were injected intravenously with ILY. (A) qRT-PCR analysis of relative expression of the Itgb6 gene in liver homogenates (n = 3–7 per group). (B) ITGβ6 immunostaining of BECs from ILY-treated ihCD59BEC-TG mice. Scale bar: 12.5 μm. (C) qRT-PCR analysis of relative gene expression of Fn1, Itgb1, Itgb5, and Itgb8 in liver homogenates (n = 3–7 per group). Data represent the mean ± SEM. *P < 0.05 compared with control ihCD59 mice, by 1-way ANOVA. (D) Representative immunostaining images from 17 livers of patients with cholangiopathies (PBC and PSC), showing a correlation between CK19, IBA1, and ITGβ6 staining. Scale bars: 50 μm. (E)ITGβ6 and IBA1 staining was quantified, and a correlation was established using Pearson’s r.
Integrin αvβ6 is critical for BEC proliferation in 2 mouse models of bile duct injury induced by ILY-targeted hCD59 or BDL.
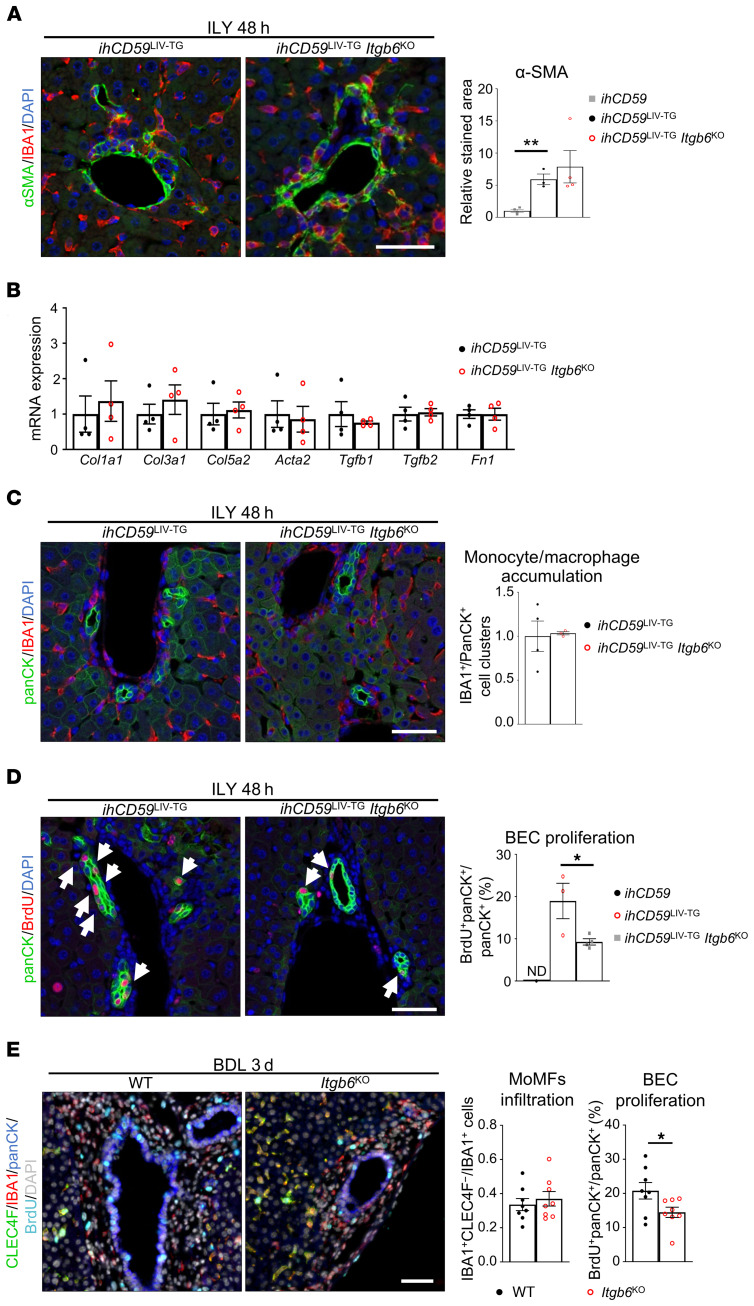
Because Itgb6 induction was so strong in our model of acute BEC injury, we aimed to evaluate its functional role in BEC proliferation by deleting the Itgb6 gene in ihCD59BEC-TG mice. Surprisingly, we failed to generate ihCD59BEC-TG Itgb6–KO mice (ihCD59BEC-TG Itgb6KO) for unknown reasons, so, instead, we generated ihCD59LIV-TG Itgb6KO mice, in which ILY injection induced both BEC and hepatocyte death, as revealed by necrotic areas and mononuclear cell infiltrates in the liver parenchyma (Supplemental Figure 5 and ref. 16). Despite a previous study describing the potential of ITGβ6 as a target to prevent chronic liver fibrosis (19), our data showed that α-SMA staining and fibrogenesis-related gene expression remained unchanged in ihCD59LIV-TG Itgb6KO mice compared with ihCD59LIV-TG mice (Figure 5, A and B). Similarly, there was no influence of Itgb6 deficiency on macrophage recruitment in the portal areas (Figure 5C). In contrast, BEC proliferation was markedly suppressed, as evidenced by a striking reduction of BrdU+panCK+ cells in ihCD59LIV-TG Itgb6KO mice compared with ihCD59LIV-TG mice (Figure 5D).
Figure 5. ITGβ6 deficiency impairs BEC proliferation but not early portal fibrosis or inflammation in 2 models of bile duct injury.
(A–D) ihCD59LIV-TG and ihCD59LIV-TG Itgb6KO mice were injected intravenously with ILY, and samples were collected at the indicated time points after ILY injection. (A) IBA1 (red) and α-SMA (green) staining and quantitation were performed (n = 3–4 per group). (B) Liver mRNA expression of fibrogenesis-related genes was assessed by qRT-PCR (n = 4 per group). (C) panCK (green) and IBA1 (red) staining was performed, and cell clusters were quantified (n = 3–4 per group). (D) panCK (green) and BrdU (red) staining and quantitation were performed (n = 3–4 per group). White arrows indicate BrdU+ BECs. (E) WT and Itgb6KO mice were euthanized 3 days after BDL. Immunostaining was performed on FFPE liver sections (single-channel images are shown in Supplemental Figure 7), and then monocyte-derived IBA1+CLEC4F– macrophages and proliferating BrdU+panCK+ BECs were quantified (n = 8 per group). Data represent the mean ± SEM. *P < 0.05 and **P < 0.01, by unpaired Student’s t test (A, C, and E) and 1-way ANOVA (B and D). Scale bars: 50 μm.
We further assessed the role of ITGβ6 in another well-established model of cholestatic disorders by performing BDL in WT and Itgb6KO mice with multiplex fluorescence immunostaining. We observed no differences in tissue injury, monocyte recruitment, liver blood microcirculation and portal pressure, or early fibrosis (Figure 5E and Supplemental Figures 6 and 7). However, Itgb6 deficiency led to reduced BEC proliferation in the BDL model (Figure 5E and Supplemental Figure 7).
Myofibroblast activation is strongly associated with bile duct repair and favors ITGβ6 expression in BECs.
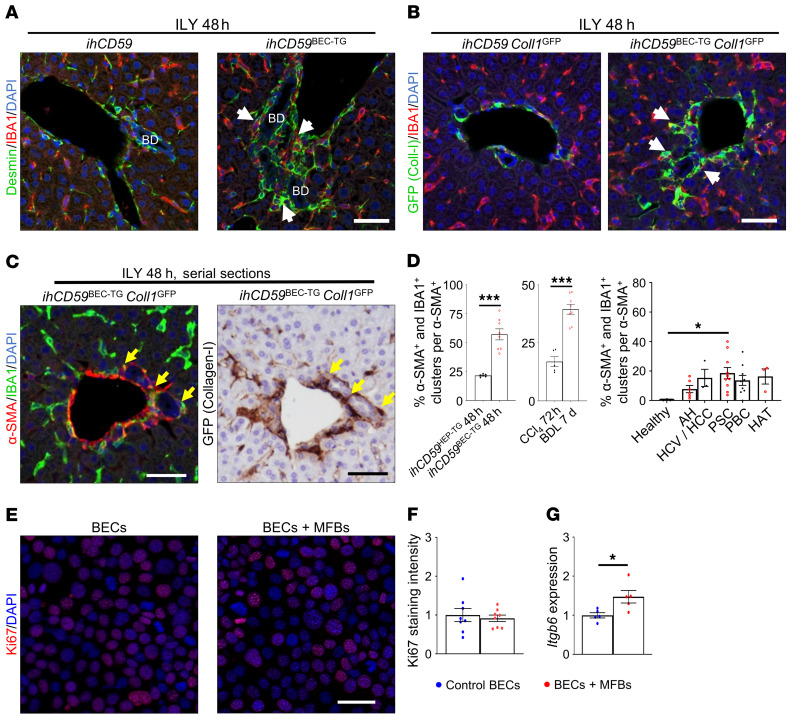
The above data revealed that acute BEC injury leads to myofibroblast activation. Interestingly, we also observed colocalization of fibrogenic cells and macrophages in the liver upon BEC injury and proliferation, as demonstrated by immunostaining with desmin (hepatic stellate cell marker) and IBA1 (Figure 6A and Supplemental Figure 8A). To further examine the colocalization of fibrogenic cells and macrophages, we crossed Coll1GFP mice, in which collagen-producing cells are labeled with GFP protein (17), with ihCD59BEC-TG mice to generate ihCD59BEC-TG Coll1GFP double-mutant mice. As illustrated in Figure 6, B and C, and Supplemental Figure 8, B and C, we observed colocalization of IBA1+ macrophages and collagen or α-SMA–expressing fibrogenic cells in our acute BEC injury model. Additionally, α-SMA+ and IBA1+ cell clusters were identified and quantified in several models of liver injury and in patients with various liver diseases (Figure 6D and Supplemental Figures 9 and 10), which suggests that these inflammatory and fibrogenic cell clusters were more prominent in models or diseases that specifically target BECs rather than hepatocytes.
Figure 6. Myofibroblast activation is closely related to macrophage accumulation and BEC proliferation and increases Itgb6 expression after acute BEC injury.
(A) ihCD59 and ihCD59BEC-TG mice were injected with ILY, and desmin (green) and IBA1 (red) staining was performed on liver sections. White arrows show close localization of IBA1+ and desmin+ cells. Scale bar: 50 μm. BD, bile duct. (B) ihCD59Coll1GFP and ihCD59BEC-TG Coll1GFP mice were injected with ILY, and GFP (green) and IBA1 (red) staining was performed. White arrows indicate stained cell clusters. Scale bar: 50 μm. (C) α-SMA (red) and IBA1 (green) or collagen GFP (brown) immunostaining on serial liver sections. Arrows indicate cell clusters. Scale bars: 50 μm. (D) α-SMA and IBA1 staining was performed, and stained cell clusters were quantitated in the indicated models of liver injury or in liver sections from patients with chronic liver disease (n = 3–10 per group). ILY-treated ihCD59Hep-TG and ILY-treated ihCD59BEC-TG mice represent hepatocyte and BEC injury models, respectively. Data represent the mean ± SEM. AH, alcoholic hepatitis; HCV/HCC, HCV infection and hepatocellular carcinoma; HAT, hepatic artery thrombosis. (E) Collagen I–producing (GFP+) CD45– MFBs were sorted from CCl4-injected Coll1GFP mouse livers, placed in Transwells, and cocultured with SV40-transformed murine BECs. Ki67 staining was performed in BECs after 24 hours (representative images are shown). Scale bar: 40 μm. (F) Ki67 staining was quantified (n = 4–8 per group). (G) Itgb6 mRNA expression analysis was performed on BECs cultured with primary myofibroblasts (n = 4–8 per group). Data represent the mean ± SEM. *P < 0.05 and ***P < 0.005, by unpaired Student’s t test (F and G) and 1-way ANOVA (D).
To decipher the potential role of myofibroblasts in inducing BEC proliferation, we obtained collagen-producing myofibroblasts (MFBs) (CD45–GFP+ cells) from carbon tetrachloride–injected (CCl4-injected) Coll1GFP mice and performed cell sorting (Supplemental Figure 11A). We then cocultured BECs with these primary MFBs for 24 hours and found that coculturing with MFBs did not affect BEC proliferation (Ki67 staining) but increased Itgb6 expression in BECs (Figure 6, E–G). Intriguingly, 48 hours after injection of ILY into ihCD59BEC-TG Coll1GFP mice, we also found the presence of GFP+ (collagen+) cells expressing monocyte-derived macrophage (MoMF) markers such as CD45, CD11b, F4/80, and CCR2 (Supplemental Figure 11, B–D). This GFP+ (collagen+) macrophage population needs to be further characterized.
Macrophage depletion abrogates bile duct repair and ITGβ6 expression in BECs.
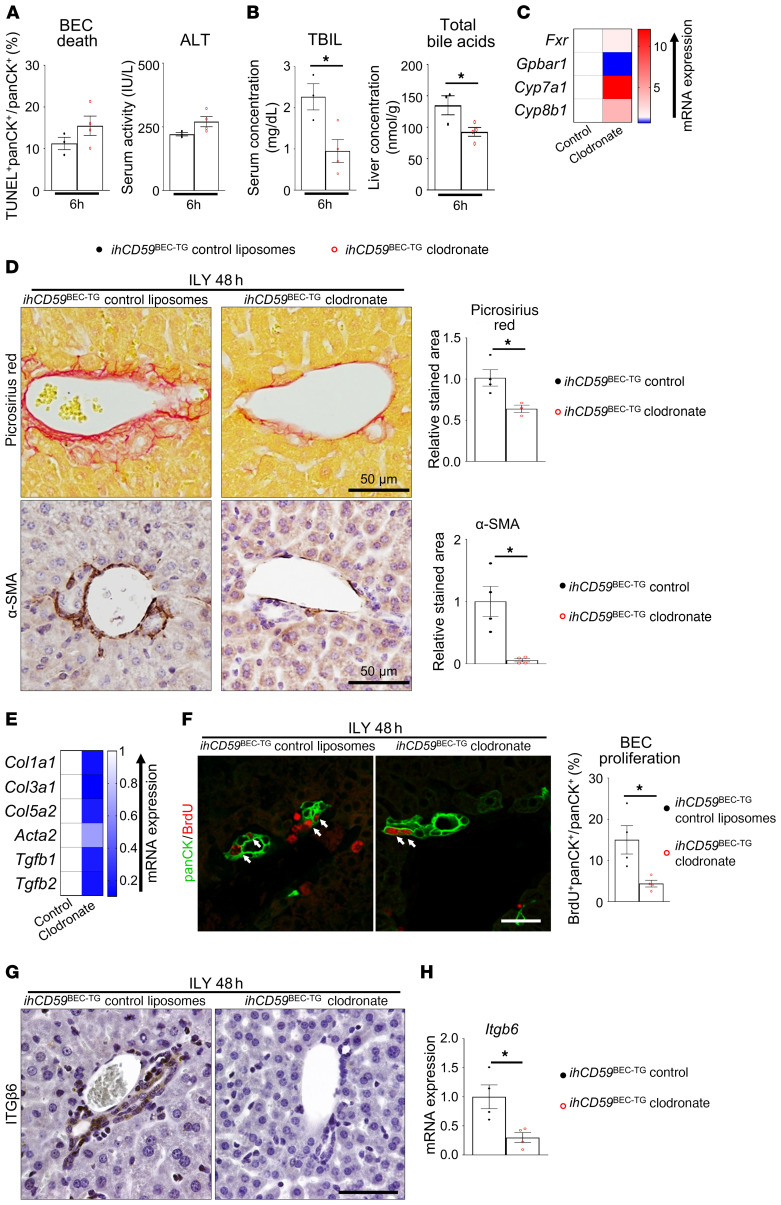
Monocyte/macrophage recruitment is a direct consequence of tissue injury and is known to play crucial roles in cell debris clearance as well as in the initiation of tissue regeneration and fibrosis in a classical immune response (22). To explore the role of macrophages in BEC injury and bile duct repair, we injected ihCD59BEC-TG and control mice with clodronate-loaded liposomes to deplete monocytes and macrophages and evaluated the tissue response to acute BEC death. We studied the effects of macrophage depletion on BEC injury and repair 6 and 48 hours after ILY injection, as we identified these time points to be the peaks of bile duct injury and BEC proliferation, respectively. Macrophage depletion was verified by the absence of F4/80 and IBA1 staining and reduced mRNA expression of the inflammation-related genes Il6, Tnfa, and Il1b (Supplemental Figure 12). Macrophage depletion did not influence liver or BEC injury, as shown by similar TUNEL staining in panCK+ BECs and similar ALT activity in the serum (Figure 7A and Supplemental Figure 13, A and B). However, and interestingly, serum TBIL levels were lowered after macrophage depletion, as was total bile acid accumulation in the liver of ihCD59BEC-TG mice (Figure 7B). Further, macrophage depletion reversed the downregulation of Fxr, Cyp7a1, and Cyp8b1 and the upregulation of Gpbar1 (Figure 7C and Supplemental Figure 13C). These data indicate that macrophages did not participate in the initial injury caused by the ILY toxin, but on the other hand may have exacerbated cholestasis. Clodronate-mediated macrophage depletion led to significantly reduced Picrosirius red and α-SMA staining 48 hours after ILY injection (Figure 7D). Accordingly, fibrogenesis-related gene expression was dramatically reduced in the clodronate-treated mice (Figure 7E and Supplemental Figure 13D). Most important, our results revealed that macrophage depletion dramatically decreased proliferation of the remaining BECs in our specific BEC injury model (Figure 7F). As illustrated in Figure 7, G and H, clodronate-loaded liposome injection drastically reduced ITGβ6 staining and mRNA expression. Interestingly, when macrophage depletion was performed 8 hours after injury, BEC proliferation and fibrogenesis were reduced to a similar extent at 48 hours, showing that the initial inflammation response was not solely responsible for inducing portal regeneration, but that the extended presence of macrophages was required for proper bile duct repair (Supplemental Figure 14). Altogether, these data revealed a role for macrophages in mediating ITGβ6 upregulation in BECs.
Figure 7. Macrophage depletion reduces cholestasis, fibrogenesis, BEC proliferation and ITGβ6 expression after acute BEC injury.
Macrophages were depleted in ihCD59BEC-TG mice by clodronate-loaded liposome injection (liposomes were injected as controls) 24 hours prior to ILY injection. (A) Six hours after ILY treatment, TUNEL and panCK staining was performed on paraffin-embedded liver sections, panCK+TUNEL+ cells were quantified (n = 3–4 in each group), and serum ALT activity was measured. Representative images are shown in Supplemental Figure 14B. (B) TBIL and total intrahepatic bile acid concentrations were assessed. (C) Hepatic bile acid metabolism–related gene expression was assessed by qRT-PCR 6 hours after ILY injection (n = 3–4 per group). Statistical analysis is shown in Supplemental Figure 14C. (D) Picrosirius red and α-SMA staining was performed, and stained areas were quantified (n = 3–4 per group). Scale bars: 50 μm. (E) Fibrogenesis-related gene expression was assessed by qRT-PCR. Statistical analysis is shown in Supplemental Figure 14D. (F) panCK and BrdU immunostaining was performed and quantified in livers from clodronate-loaded liposome–injected ihCD59BEC-TG mice and in ihCD59BEC-TG Ccr2KO mice, 48 hours after ILY injection (n = 4 per group). White arrows indicate BrdU+ BECs. Scale bar: 30 μm. (G) Macrophages were depleted in hCD59BEC-TG mice by clodronate-loaded liposomes, followed by ILY injection. ITGβ6 immunostaining (brown) was then performed on mouse liver sections. Scale bar: 50 μm. (H) Liver Itgb6 mRNA expression from clodronate-injected hCD59BEC-TG mice (n = 4 in each group). Data represent the mean ± SEM. *P < 0.05, by unpaired Student’s t test.
Circulating CCR2+ monocytes and not Kupffer cells are rapidly recruited around damaged bile ducts, promoting BEC proliferation and hepatic Itgb6 expression.
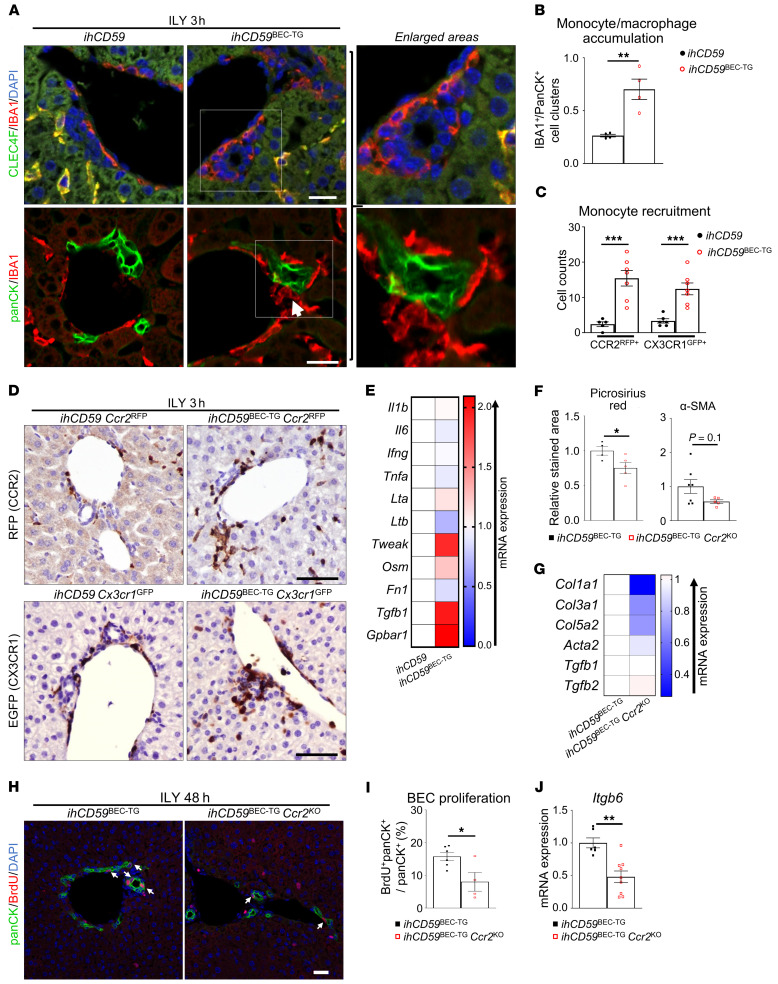
Liver macrophages are composed of resident Kupffer cells and MoMFs (23). To further characterize the monocyte/macrophage population recruited around injured bile ducts, we performed immunostaining for CLEC4F, which is used to identify Kupffer cells, and IBA1, a pan-macrophage marker of both Kupffer cells and infiltrating monocytes/macrophages (24–28). Here, we showed that as early as 3 hours after acute injury, IBA1+CLEC4F– circulating monocytes were recruited around damaged bile ducts, whereas IBA1+CLEC4F+ Kupffer cells did not migrate toward the injured area (Figure 8A and Supplemental Figure 15). IBA1, panCK, and TUNEL costaining further showed that there was a significant increase in direct contact between monocytes and BECs following acute injury (Figure 8B and Supplemental Figure 16). Moreover, MoMF numbers were increased in the liver, as assessed by flow cytometry, whereas T cell and neutrophil numbers remained constant, and these cells did not accumulate in portal areas, demonstrating a potent role of monocytic cells in the early immune response (Supplemental Figures 17 and 18). These recruited cells accumulating around injured bile ducts also expressed the CX3CR1 and CCR2 chemokine receptors, as demonstrated in ihCD59BEC-TG Cx3cr1GFP and ihCD59BEC-TG Ccr2RFP reporter mice, respectively (Figure 8, C and D), and were F4/80lo (data not shown), further arguing for monocyte recruitment rather than Kupffer cell migration.
Figure 8. Monocyte-derived CCR2+ macrophages accumulate around injured bile ducts after acute BEC injury, promoting BEC proliferation and Itgb6 expression.
(A and B) ihCD59 and ihCD59BEC-TG mice were injected intravenously with ILY for 3 hours. Liver tissues were collected for immunofluorescence staining with IBA1 (red) and CLEC4F (green) or with anti-panCK (green) and anti-IBA1 (red) antibodies. Double-stained IBA1+CLEC4F+ Kupffer cells appear in yellow, whereas IBA1+CLEC4F– MoMFs appear in red in the upper panel of A. Double staining of anti-panCK (green) and anti-IBA1 (red) antibodies on liver sections as shown in lower panel A. The white arrow indicates an IBA1+ monocyte in contact with a panCK+ BEC. Single-channel images are provided in Supplemental Figure 15. Scale bars: 20 μm. panCK+ and IBA1+ cell clusters from A were counted (n = 4 per group) as shown in B. (C) CCR2+ and CX3CR1+ recruited monocytes from ILY-treated ihCD59BEC-TG Ccr2RFP or ihCD59BEC-TG Cx3cr1GFP reporter mice were counted as indicated (n = 5–7 per group). (D) Representative images of RFP and GFP staining in liver tissues from ihCD59BEC-TG Ccr2RFP and ihCD59BEC-TG Cx3cr1GFP reporter mice, respectively. Scale bars: 30 μm. (E) Liver MoMFs (CD45+CD11b+CCR2hiGR-1int) were isolated from ihCD59 and ihCD59BEC-TG mice 48 hours after ILY injection, and gene expression was analyzed by qRT-PCR. Statistical analysis is shown in Supplemental Figure 20. (F) Picrosirius red and α-SMA staining was performed on liver tissues from ILY-treated ihCD59BEC-TG and ihCD59BEC-TG Ccr2KO mice, and stained areas were quantified (n = 4–7 per group). Representative images are shown in Supplemental Figure 21A. (G) Fibrogenesis-related gene expression was examined by qRT-PCR. Statistical analysis is shown in Supplemental Figure 21B. (H) panCK and BrdU immunostaining was performed on ihCD59BEC-TG and ihCD59BEC-TG Ccr2KO mouse livers 48 hours after ILY injection (n = 4–6 per group). Scale bar: 30 μm. (I) panCK+BrdU+ BECs were counted. (J) Itgb6 mRNA expression in livers from ILY-treated ihCD59BEC-TG and ihCD59BEC-TG Ccr2KO mice (n = 6–9 in each group). Data represent the mean ± SEM. *P < 0.05, **P < 0.01, and ***P < 0.005, by unpaired Student’s t test.
We also noticed that CX3CR1GFP+ and CCR2RFP+ cells were still present around regenerating bile ducts 48 hours after ILY injection (Supplemental Figure 19). To elucidate the function of these monocytic cells, we first performed qRT-PCR analyses of primary MoMFs isolated from ihCD59BEC-TG mice 48 hours after ILY injection and found that, compared with macrophages isolated from control livers, the activated MoMFs had a proregenerative phenotype, as characterized by increased expression of the Tweak gene, a known mitogen for BECs (29), and a tendency toward increased expression of Tgfb1, a potent profibrogenic cytokine (Figure 8E and Supplemental Figure 20). Interestingly, those macrophages also overexpressed G protein-coupled bile acid receptor 1 (Gpbar1), showing an increased sensitivity to bile acid–mediated signals (Figure 8E and Supplemental Figure 20). We next aimed to better elucidate the role of MoMFs in bile duct repair after targeted and acute BEC damage. We performed an additional deletion of the Cx3cr1 or Ccr2 gene in ihCD59BEC-TG mice by generating ihCD59BEC-TG Cx3cr1KO or ihCD59BEC-TG Ccr2KO double-mutant mice. Interestingly, the Ccr2-deficient mice had reduced Picrosirius red staining and a tendency toward reduced α-SMA staining (Figure 8F and Supplemental Figure 21A). Moreover, fibrogenesis-related gene expression was reduced in ihCD59BEC-TG Ccr2KO mice (Figure 8G and Supplemental Figure 21B). Strikingly and as shown in Figure 8, H–J, ihCD59BEC-TG Ccr2KO mice displayed reduced BEC proliferation and reduced hepatic Itgb6 expression 48 hours after ILY injection. However, we observed no difference in BEC proliferation between ihCD59BEC-TG and ihCD59BEC-TG Cx3cr1KO mice (data not shown).
In response to bile acids, infiltrating CCR2+ macrophages promote BEC proliferation via the upregulation of ITGβ6 expression.
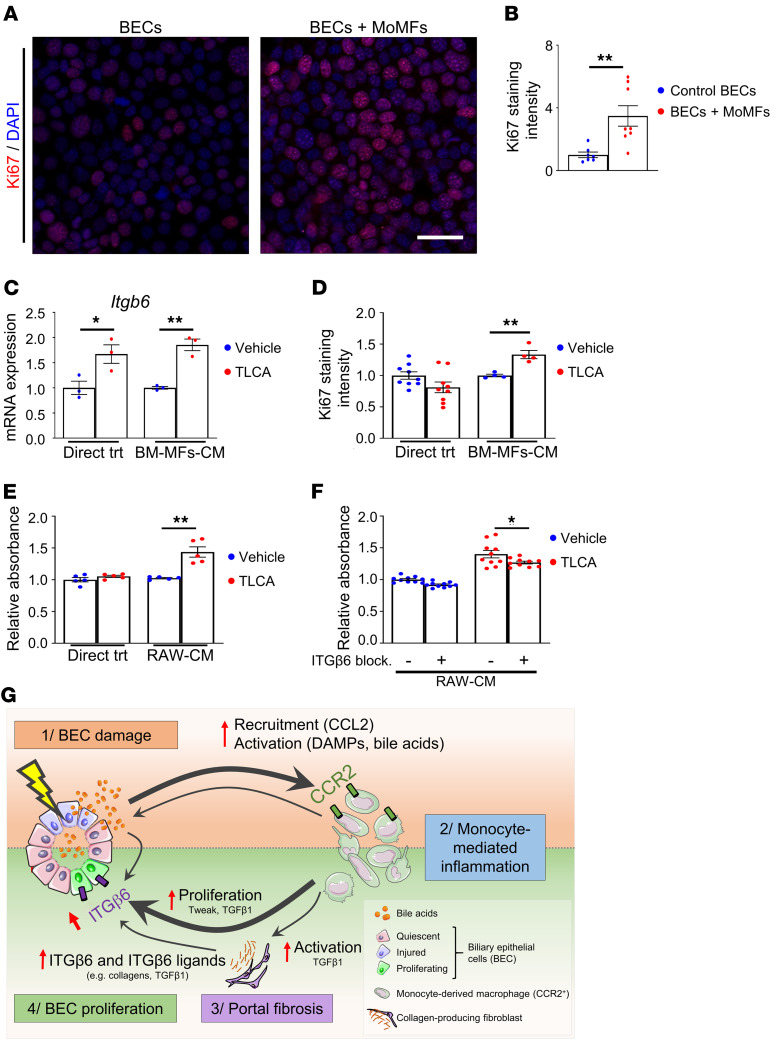
Our data showed that CCR2+ monocytes played an important role in promoting BEC proliferation in vivo and that macrophage depletion abrogated BEC ITGβ6 expression in response to acute BEC injury. To understand the mechanisms involved and whether macrophages directly stimulate BEC proliferation, we isolated primary CCR2+ MoMFs from ILY-treated ihCD59BEC-TG mouse livers and cocultured them with BECs, followed by the measurement of BEC proliferation. The data in Figure 9, A and B, revealed that coculturing with CCR2+ MoMFs markedly enhanced BEC proliferation, as demonstrated by increased Ki67 staining, and thus showed that CCR2+ macrophages from bile duct–injured livers can directly stimulate BEC proliferation. One of the characteristics of bile duct injury is cholestasis, defined as the accumulation of bile acids in the liver due to impaired bile export, which was also demonstrated in our model (shown in Figure 1C). Notably, bile acids have been shown to direct macrophages toward a proregenerative phenotype by targeting the farnesoid X receptor (FXR) and the G protein–coupled bile acid receptor 1 (GPBAR1, also known as TGR5) (30, 31). Thus, we asked whether macrophages respond to bile acids to favor increased expression of Itgb6 in BECs. To answer this question, we treated murine bone marrow monocytes with taurolithocholic acid (TLCA), a potent GPBAR1 agonist. The conditioned culture medium of these cells was then transferred to BEC cultures, followed by evaluation of BEC Itgb6 expression and proliferation. As illustrated in Figure 9, C and D, and Supplemental Figure 22, TLCA alone increased Itgb6 expression but did not induce BEC proliferation, whereas conditioned media from TLCA-treated monocytes increased both BEC Itgb6 expression and proliferation. Similarly, conditioned media from TLCA-treated RAW264.7 macrophages increased BEC proliferation, as measured by an MTS absorbance assay (Figure 9E). Furthermore, incubation with an ITGβ6-blocking antibody prevented the induction of BEC proliferation by conditioned media from TLCA-treated RAW264.7 macrophages (Figure 9F). These data demonstrate that after bile acid stimulation, MoMFs promote BEC proliferation via the induction of ITGβ6 (Figure 9G).
Figure 9. Monocyte-derived CCR2+ macrophages promote BEC proliferation through ITGβ6 in vitro.
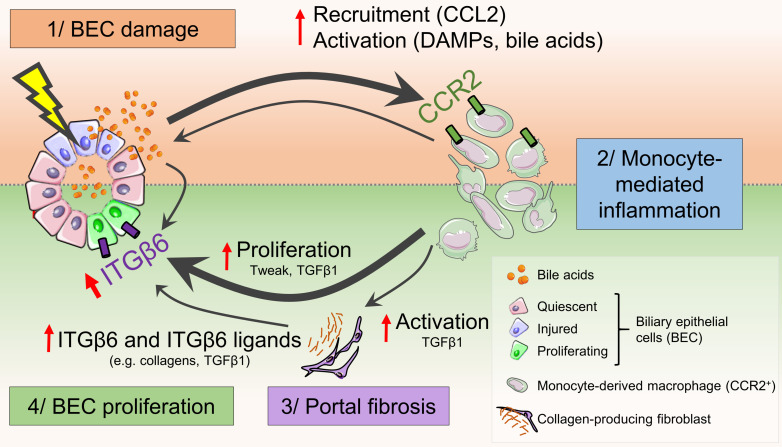
(A) Sorted primary MoMFs (CD45+CD11b+CCR2hiGR-1int) isolated from 48-hour ILY-treated ihCD59BEC-TG mouse livers were cocultured with BECs for 24 hours. BECs were then fixed in 4% paraformaldehyde, and Ki67 staining was performed (representative images are shown). Scale bar: 40 µm. (B) Ki67+ BECs cultured with primary MoMFs were counted (n = 4–8 per group). (C and D) Bone marrow–derived macrophages (BM-MFs) were isolated and stimulated with TLCA (20 μM). Conditioned media (CM) were then transferred to BECs. BECs were also directly treated with TLCA (20 μM). Itgb6 mRNA expression in BECs was assessed in C; Ki67 staining of BECs was analyzed in D. (E) RAW264.7 murine macrophages (RAW) were similarly treated with TLCA, and conditioned media were transferred to BECs, or BECs were directly treated (Direct trt) with TLCA (20 μM). BEC numbers were assessed by an MTS [3-(4,5-dimethylthiazol-2-yl)-5-(3-carboxymethoxyphenyl)-2-(4-sulfophenyl)-2H-tetrazolium)] absorbance assay (n = 5 per group). (F) RAW264.7 conditioned media were added to BEC culture with or without an ITGβ6-blocking antibody, followed by measurement of BEC proliferation (n = 10 per group). Data represent the mean ± SEM. *P < 0.05 and **P < 0.01, by unpaired Student’s t test for B–E, compared with the TLCA vehicle condition, and for F, compared with the ITGβ6-blocking antibody control condition. (G) Proposed mechanisms by which BEC injury alone triggers the early signals that induce BEC proliferation via the interaction of bile acids, macrophages, and ITGβ6. BEC injury leads to the release of chemoattractants (e.g., CCL2) and DAMPs, which rapidly recruit and activate circulating CCR2+ monocytes to the injured area. Macrophages induce portal fibrogenesis and further increase bile acid release. Macrophages, myofibroblasts, and bile acids upregulate ITGβ6 expression in BECs, which contributes to BEC proliferation. The illustration in G was created using Servier Medical Art templates, which are licensed under a Creative Commons Attribution 3.0 Unported License; https://smart.servier.com.
Discussion
In the current study, we demonstrated that the ILY/ihCD59BEC-TG BEC-specific death-inducing method (16) represents a model of acute BEC injury, followed by bile duct repair. Unlike chronic injury models, this method allowed us to characterize 2 stages of tissue response to specific and targeted acute bile duct injury, consisting of (a) an injury response stage including BEC death, liver microcirculation impairment, and monocyte recruitment and (b) a regenerative stage in which the remaining BECs proliferate concurrently with portal fibrogenesis. This BEC proliferation in the regenerative stage is dependent on the recruitment of circulating MoMFs and a potent elevation in ITGβ6 expression. In addition, we demonstrated that bile acids play a role in promoting macrophage polarization toward a regenerative phenotype and in inducing cholangiocyte ITGβ6 expression. We have integrated all of these findings into a model representing how acute BEC injury triggers the early tissue response that induces BEC proliferation via the interaction of bile acids, macrophages, and ITGβ6 (Figure 9G).
Upon chronic or severe injury, liver progenitor cells or activated cholangiocytes proliferate and accumulate in the liver. This phenomenon, known as the ductular reaction, coincides with intense and localized inflammation and fibrogenesis as part of the tissue response to chronic or severe injury, in an attempt to repair or regenerate the bile ducts and liver architecture. Repair mechanism dysregulation and exacerbation may lead to chronic inflammation, fibrosis, and cirrhosis and may ultimately serve as a soil for liver cancer and organ failure. Although the ductular reaction is widespread in virtually any chronic liver disease, and BECs represent a crucial cell type implicated in liver function and architecture, there is a paucity of data on their regeneration and interaction with other cell populations in liver disease, given the lack of targeted BEC injury models.
Acute BEC injury rapidly leads to recruitment of monocytes to the injured area, which interact with myofibroblasts.
Inflammatory monocytes are among the first responders after injury, clearing pathogens and cell debris and initiating tissue regeneration. A recent study reported that macrophages play a crucial role in inducing the ductular reaction, portal area fibrosis, and monocyte-driven inflammation in a chronic (Mdr2–/– mice) mouse model of sclerosing cholangitis (13). An interesting finding in the current study was that monocytes were rapidly recruited in response to sudden BEC death, as early as 3 hours after injury, and this recruitment may have been induced by a number of factors, including the release of damage-associated molecular patterns (DAMPs) and/or the production of chemokines (e.g., CCL2) by surrounding cells including BECs and Kupffer cells (32). Indeed, as shown in the current study, Ccl2, which encodes the key CCL2 chemokine, was 1 of the top 5 genes that were most strongly upregulated in regenerating BECs. Notably, we observed that recruited monocytes expressed CCR2 (the CCL2 receptor) and the chemokine receptor CX3CR1. However, an additional deletion of either Ccr2 or Cx3cr1 did not dramatically affect monocyte recruitment in ILY-treated ihCD59BEC-TG mice (data not shown), suggesting that monocyte recruitment after acute BEC injury may be dependent on additional factors. Another possibility that we have not excluded is that because of the redundancy of both receptors, deletion of 1 of them was insufficient to affect monocyte recruitment. Despite this, Ccr2-deficient mice displayed reduced BEC proliferation, suggesting that CCL2 signaling polarized recruited monocytes toward a regenerative phenotype. As evidenced by our data, acute BEC injury did not lead to the accumulation of neutrophils around damaged bile ducts. This was quite different from chronic liver injury–induced classical wound responses that are associated with significant neutrophil infiltration (9). Indeed, it was proposed very recently that during alcoholic hepatitis, recruited neutrophils aggravate cholangiocyte injury through the binding of BEC integrin β1 (ITGβ1) with neutrophil membrane proteins, leading to a loss of the type 3 inositol 1,4,5-trisphosphate receptor (ITPR3) and increased cholestasis (33). On the other hand, our data suggest that the moderate and localized BEC injury in ILY-treated ihCD59BEC-TG mice preferably leads to a monocyte-driven response, highlighting the required and beneficial roles of monocyte recruitment without the induction of potentially detrimental neutrophilic activation during bile duct repair.
Another important finding from the current study was that the recruited monocytes after BEC injury were intimately interacting with collagen-producing cells in ILY-treated ihCD59BEC-TG mice in vivo. First, liver macrophages isolated from ihCD59BEC-TG mice during BEC regeneration tended to have increased Tgfb1 gene expression. Second, by performing immunohistochemical analyses in 2 strains of ihCD59BEC-TGCx3cr1GFP and ihCD59BEC-TGColl1GFP double-mutant mice, we demonstrated that IBA+ macrophages near damaged bile ducts were in close contact with α-SMA+ and collagen-expressing fibroblasts. Macrophages and fibrogenic cells were so intimately colocalized that confocal microscopy led to a partial staining overlap, raising doubts about the possibility that some cells may coexpress IBA1 and α-SMA or GFP (collagen I). Intriguingly, flow cytometric analyses revealed that numerous collagen-producing cells expressed macrophage markers such as CD45, CD11b, and F4/80 in ILY-treated ihCD59BEC-TG Coll1GFP double-mutant mice. Using the BDL model and Mdr2–/– mice, Kisseleva’s group implicated portal fibroblasts as well as circulating fibrocytes in the development of portal fibrosis (34, 35). Fibrocytes are defined as bone marrow–derived CD45+ circulating cells that can infiltrate tissues and produce collagen and have notably been observed in wound healing and fibrosis in multiple organs including the liver (34–36). The origin of fibrocytes is still subject to debate. Monocyte-derived, collagen-producing cells have been implicated in the wound-healing response or fibrosis in several organs, including skin, lung, kidney, and liver, and although their characterization varies among studies, they are commonly identified as CD45+CD11b+collagen I+ (37). In the liver, this phenotype may not only contribute to fibrogenesis but may also support BEC regeneration by providing mitogens and by participating in extracellular matrix (ECM) deposition, a known requirement for cholangiocyte regeneration (12, 38–40). However, more studies are needed to confirm and characterize these potential monocyte-derived, collagen-producing cells in our models.
Monocyte-derived CCR2+ macrophages enhance BEC repair through ITGβ6: a potential role of bile acid.
In the current study, we demonstrated that macrophage depletion or Ccr2 deficiency reduced BEC proliferation in ihCD59BEC-TG mice, indicating that the recruited monocyte-derived CCR2+ macrophages promote bile duct repair. Macrophages are known partners of tissue regeneration through their extensive production of mitogens. Indeed, our data showed that liver macrophages isolated at the peak of BEC proliferation overexpressed Tweak, a known mitogen for BECs and liver progenitor cells (29, 41, 42). Although fibrogenesis may lead to fibrosis, it provides crucial signals for bile ducts to regenerate and should thus be regarded as a part of normal bile duct regeneration, if it does not become excessive. This could partly explain why our data indicated that macrophage depletion, which reduced both inflammation and fibrogenesis, also impaired BEC proliferation, although the initial cell injury was identical. Furthermore, using the approach of RNA-friendly xMD, we were able to perform next-generation transcriptome sequencing specifically on regenerating BECs and identified 5 genes, namely Mapk8ip2, Cdkn1a, Itgb6, Rgs4, and Ccl2, that were most upregulated in proliferating BECs after acute injury. Given the small proportion of BECs in the liver, these important gene expression changes would not have been detectable using whole-tissue transcriptomics. Among these, ITGβ6 has been implicated in promoting BEC- and liver progenitor–mediated liver regeneration (8, 18, 19, 21). Furthermore, it was previously proposed in a chronic mouse model of congenital hepatic fibrosis that macrophages are implicated in ITGβ6 induction in chronically injured BECs (43). For these reasons, we further focused on the role of ITGβ6 in BEC proliferation in our ILY/ihCD59BEC-TG acute BEC-specific death model. Immunohistochemical analyses confirmed a robust upregulation of ITGβ6 expression in this BEC injury model as well as in patients with chronic cholangiopathies, correlating with intense monocyte-derived macrophage recruitment in the portal area. Deletion of the Itgb6 gene attenuated BEC regeneration after acute BEC injury and BDL. Macrophage depletion or CCR2 deficiency impaired ITGβ6 expression and BEC regeneration. In addition, incubation with an ITGβ6-blocking antibody reduced the BEC proliferation in vitro that was induced by conditioned media from TLCA-treated macrophages. Together, these in vivo and in vitro findings highlight an important role of macrophages in promoting BEC regeneration through ITGβ6. In addition, in our model, hepatic expression of fibronectin 1, a potent ITGβ6 agonist (18) that is mainly produced by hepatocytes and activated macrophages, was upregulated after acute BEC injury. Thus, it is likely that activated macrophages promote BEC regeneration by expressing fibronectin, which interacts with ITGβ6 on BECs.
A hallmark of bile duct injury is cholestasis, which leads to accumulation of bile acids. In the current study, we demonstrated that TLCA treatment directly upregulated ITGβ6 expression on BECs without affecting BEC proliferation, whereas conditioned media from TLCA-treated macrophages enhanced BEC proliferation in an ITGβ6-dependent manner. These data suggest that bile acids can direct monocytes toward a regenerative phenotype, which stimulates BEC proliferation via ITGβ6. However, how bile acid–activated macrophages promote BEC proliferation via ITGβ6 remains unknown. It has been shown that activated macrophages produce fibronectin 1 (18), but we did not detect Fn1 upregulation in TLCA-treated macrophages (data not shown), although we observed Fn1 upregulation in the liver after acute BEC injury. Therefore, it is possible that other unknown ITGβ6 ligands are involved in BEC proliferation induced by TLCA-treated macrophages. Programmed death ligand 1 (PD-L1) is a potential candidate, since it has been shown to promote bladder cancer cell proliferation through ITGβ6 (44). PD-L1 expression has been detected on macrophages (45). We observed the presence of PD-L1–expressing cells in both normal and regenerating conditions and demonstrated the presence of PD-L1+IBA1+ macrophages in close contact with BECs, 48 hours after acute BEC injury and 3 days after BDL surgery (Supplemental Figure 23). The Hippo pathway, notably implicating YAP and TAZ, and c-Met have been reported to be critical in controlling the ductular reaction (46–49). However, we did not observe a reduction in those 3 pathways in Itgb6KO mice compared with WT mice after acute BEC injury (Supplemental Figure 24). Collectively, but tentatively, our data suggest that PD-L1, but not YAP/TAZ or c-Met, may contribute to macrophage-mediated promotion of BEC proliferation through the upregulation of ITGβ6.
Conclusions and potential therapeutic implications.
By taking advantage of a BEC-targeted and specific, acute injury model, we identified the early signals from recruited monocyte-derived CCR2+ macrophages to promote bile duct reparative processes through the induction of ITGβ6-mediated BEC proliferation. These findings complement previous studies demonstrating the relevance of ITGβ6 in chronic biliary injury models and highlight the role of ITGβ6 in early and acute bile duct injury. Our results underline the potent role of BEC injury in generating immune responses that dysregulate liver microcirculation. Portal hypertension remains a challenging and major complication of liver cirrhosis and has been associated with potent bile duct injury, e.g., after liver transplantation (4). Our findings suggest that BEC injury, per se, can lead to liver microcirculation dysregulation and increased portal vein pressure. We observed the impairment of liver microcirculation at early time points but not in the later reparative phase, suggesting that the proinflammatory immune reaction without fibrosis may be sufficient for portal hypertension. Additional studies will be required to unravel potential new therapeutic targets to modulate the immune response, potentially ameliorating cholestatic liver damage and enhancing graft survival. Finally, bile duct damage may accompany virtually any liver injury. As shown by our data, further attention should be drawn to bile duct–related injury and repair mechanisms not only in cholestatic disorders, but also in other liver diseases.
Methods
Mice.
Two- to 4-month-old male and female mice were used in this study. We generated BEC-specific hCD59-transgenic (ihCD59BEC-TG) mice as previously described (16). Tamoxifen was prepared in corn oil and injected intraperitoneally (50 mg/kg) into ihCD59BEC-TG mice every 2 days for a total of 3 injections to induce BEC hCD59 expression. ILY was administered once by tail vein injection (140 μg/kg) after a 1-week tamoxifen washout period. Liver-specific hCD59-transgenic (ihCD59LIV-TG) mice, in which hCD59 is expressed on both hepatocytes and BECs, were generated by crossing ihCD59 mice with albumin-Cre–transgenic mice (The Jackson Laboratory). ihCD59 mice were generated on a C57BL/6 background, and littermate control mice were used for ihCD59BEC-TG and ihCD59LIV-TG mice. Integrin αvβ6–deficient (Itgb6KO) mice on a C57BL/6 background were provided by Dean Sheppard’s laboratory (UCSF, San Francisco, California, USA) (50). ihCD59LIV-TG Itgb6KO double-mutant mice were generated via several steps of crossing of ihCD59LIV-TG mice with Itgb6KO mice. Itgb6KO (with Cre– ihCD59) littermates were used as controls for the ihCD59LIV-TG Itgb6KO double-mutant mice. Hepatocyte-specific hCD59-transgenic (ihCD59HEP-TG) mice were generated by injecting 5 × 10¹⁰ genome copies per ihCD59 mouse of AAV8-TBG-PI-Cre-rBG (Perelman School of Medicin at the University of Pennsylvania, Philadelphia, Pennsylvania, USA) (16). Hepatocyte injury in these mice was induced by 3 daily ILY tail vein injections (140 μg/kg). Mice were euthanized 48 hours after the last injection. The Sox9CreERT+, Cx3cr1GFP, Ccr2RFP mouse strains that express tamoxifen-inducible Cre, GFP, or RFP under the Sox9, Cx3cr1, or Ccr2 promoters, respectively, were purchased from The Jackson Laboratory. Homozygous Ccr2RFP mice were used as Ccr2-KO animals, and heterozygous Ccr2RFP mice were used as CCR2 reporter mice. Cx3cr1GFP and Ccr2RFP mice were on a C57BL/6J background as described on The Jackson Laboratory’s website. Coll1GFP mice expressing GFP under the Col1a1 promoter were described previously in the C3H/C57B1 strain (51). All mouse strains used in this study were backcrossed for at least 5 generations on a C57BL/6J background. Tamoxifen- and ILY-injected ihCD59 littermates were used as negative controls.
Other mouse liver injury models included carbon tetrachloride (CCl4) injection and BDL. CCl4 was injected once (1 mL/kg, diluted 10% v/v in corn oil), and samples were collected 72 hours later. BDL and sectioning was performed as previously described (52), and tissues were collected 3 or 7 days after surgery.
Macrophage depletion was performed by intravenous injection of 70 mg/kg clodronate disodium–loaded liposomes (FormuMax). Mice were injected with 30 μg/g BrdU (MilliporeSigma) 2 hours before euthanasia to assess cell proliferation.
Monocyte cell culture.
Primary monocytes were isolated from bone marrow as previously described, using the mouse Monocyte Isolation Kit (BM) (Miltenyi Biotec, Bergisch Gladbach). RAW264.7 murine macrophages were obtained from the American Type Culture Collection (ATCC). Cells were treated with TLCA at a final concentration of 20 μM or with vehicle (0.5‰ dimethyl sulfoxide, MilliporeSigma).
Liver myofibroblast sorting.
Coll1GFP mice were intraperitoneally injected with CCl4(1 injection of 0.5 mL/kg diluted 25% v/v in corn oil, every 3 days) to induce liver myofibroblast accumulation. Twenty-four hours after the last injection, livers were perfused with GBSS containing 0.5 g/L collagenase IV (Millipore Sigma), collected and minced with scissors, and further digested for 20 minutes at 37°C under agitation in GBSS containing 0.5 g/L collagenase IV and 0.5 g/L pronase (MilliporeSigma). Cells were then passed through a 70 μm cell strainer, and hepatocytes were removed after 3 consecutive low-speed centrifugations (60g for 5 minutes). Red blood cells were lysed using ACK Lysing Buffer (Thermo Fisher Scientific). CD45– (Coll1) GFP+ cells were sorted. The antibodies used for flow cytometry are listed in Supplemental Table 1. Myofibroblasts were then transferred onto Transwell plates and incubated with preattached BECs overnight.
MoMFs.
Monocyte-derived CCR2+ macrophages (CD45+CD11b+CCR2hiGR-1int) were isolated from ihCD59BEC-TG mouse livers 48 hours after ILY injection.
BEC culture and proliferation assay.
SV40-transformed BECs were provided by Gianfranco Alpini’s group (Indiana University School of Medicine, Indianapolis, Indiana, USA) (53). Cell culture supernatant from activated monocytes or RAW264.7 cells were collected, centrifuged to remove potential cell debris, supplemented with 2% heat-inactivated FBS and blocking ITGβ6 antibody (Abcam) as indicated, and then added to the BEC culture. Following treatments, the cells were fixed in 4% paraformaldehyde for 15 minutes and then incubated with an anti-Ki67 antibody (Dako, Agilent Technologies) in 5% normal goat serum and 0.3% Triton X-100. Cell proliferation was assessed using a colorimetric MTS Assay Kit (Cell Proliferation, Abcam).
Immunohistochemical and multiplex immunofluorescence staining.
Formalin-fixed, paraffin-embedded liver samples were sectioned and stained as described in the Supplemental Methods. For BDL samples, multiplex immunostaining was performed as previously described (27).
Staining and microdissection of BECs.
BECs were stained for microdissection using a modified immunohistochemistry protocol that preserves RNA integrity for further next-generation sequencing. Briefly, ihCD59BEC-TG and ihCD59 (control) mice were intravenously injected with ILY, and the liver was dissected 48 hours later, immediately mounted with O.C.T. and frozen on dry ice and then stored at –80°C. Fresh-frozen liver sections (12 µm thick) were used, and a solution containing 1 mg/mL BSA and 0.1% Tween-20 was used for blocking and permeabilization. BECs were stained with the monoclonal anti–cytokeratin-19 antibody (TROMA-III, Developmental Studies Hybridoma Bank) and revealed with an HRP-conjugated, anti-rat secondary antibody and DAB substrate (both from Vector Laboratories). Every step was performed at 4°C, except for the DAB reaction and dehydration, which were performed at room temperature. Blocking and antibody mixes contained 0.5 U/L RNase Inhibitor (Applied Biosystems). Incubation durations were kept short: 30 minutes for blocking and permeabilization, 1 hour for the primary antibody, and 30 minutes for the secondary antibody. The capture was achieved by xMD, as previously described (54). Laser irradiation consisted of 5 discharges at intensity level 5, against a white background with a SensEpil lamp (Home Skinovations).
BEC RNA purification, amplification, and next-generation sequencing.
Total RNA was purified using a PicoPure RNA Isolation Kit (Thermo Fisher Scientific), including DNase treatment. Preferential mRNA amplification was performed using the Ovation RNA-seq System V2 (NuGEN). The amplified material was quantified and its quality assessed using Qubit (dsDNA HS Assay Kit, Thermo Fisher Scientific) and Bioanalyzer (High Sensitivity DNA Kit, Agilent Technologies), respectively. The amplified material was sheared to approximately 150 bp fragments using Covaris microtubes and a sonicator (Covaris S2). Sequencing libraries were made using the Ion Plus Fragment Library Kit and Ion Xpress Barcode Adapters (IonTorrent, Thermo Fisher Scientific). Quantification and quality were assessed as in the previous step, as well as with the Ion Library TaqMan Quantitation Kit (IonTorrent, Thermo Fisher Scientific). Sequencing was performed using Ion P1 Hi-Q kits and the Ion P1 Chip Kit, version 3 in an Ion Torrent Proton sequencer.
RNA-Seq bioinformatics analysis.
CLC Genomics Workbench (QIAGEN Bioinformatics, version 10) was used to map sequencing reads to the mouse reference genome (Mm10) and for subsequent analysis. All steps were run using default settings for RNA-Seq analysis. Only protein-coding genes (21,950 genes) with an expression value of reads per kilobase per million mapped reads (RPKM) of 0.5 or higher were considered for the analysis (8483 genes). Filtering on a FDR-corrected P value of 0.05 or lower and a fold change greater than 2 resulted in 135 genes. Pathway and Gene Ontology (GO) term enrichment analysis was performed using DAVID (55). RNA-Seq data are available in the NCBI’s GenBank via BioProject (accession number PRJNA510784).
Liver microcirculation and portal vein pressure.
Hepatic microcirculation was assessed by the laser speckle contrast approach as described previously (52). To measure mean portal pressure, a polyethylene cannula (PE-8) connected to a fluid-filled pressure catheter (ADInstruments) was introduced into the portal vein. After stabilization, pressure signal was recorded using the PowerLab data acquisition system and analyzed by LabChart 7 Software (ADInstruments).
Statistics.
Results are expressed as the mean ± SEM (n = 3–10 per group as indicated), and statistical significance was determined by a 2-tailed, unpaired Student’s t test or 1-way ANOVA as appropriate (GraphPad Prism, GraphPad Software). Results were considered significantly different for P values of less than 0.05. For RNA-Seq data analysis, a FDR-corrected P value was used. Correlations were calculated using Pearson’s r.
Study approval.
Mice were cared for in accordance with NIH guidelines. The study was approved by the IACUC of the NIAAA. Normal human liver samples and chronic liver disease tissues were obtained from donor livers or recipient livers during liver transplantation from the Liver Tissue Procurement and Distribution System at the University of Minnesota (Minneapolis, Minnesota, USA), with the patients’ written informed consent (supported by the NIH contract HHSN276201200017C).
Author contributions
AG, LG, DF, SJK, YH, YAA, JP, and KS were involved in the acquisition, analysis, statistical analysis, and interpretation of the data. SD, FL, and XQ provided the ILY and were involved in data analysis. PP, TK, XQ, DG, and FT provided relevant intellectual input and edited the manuscript. AG and BG designed the study and wrote the manuscript. BG obtained funding and supervised the study. All authors approved the final manuscript.
Acknowledgment
This work was supported by the intramural program of the NIAAA, NIH (to BG). AG was a visiting postdoctoral fellow supported by the intramural program of the NIAAA, NIH during 2015–2019 and is currently a recipient of a Humboldt Research Fellowship for Postdoctoral Researchers (Alexander von Humboldt Foundation). We thank Gianfranco Alpini (Indiana University School of Medicine) for providing the biliary epithelial cell line, Dean Sheppard (UCSF) for providing the Itgb6KO mice, and Martha Kirby (National Human Genome Research Institute [HGRI], NIH) for her assistance with myofibroblast cell sorting.
Supplementary Material
Version 1. 03/16/2021
In-Press Preview
Version 2. 05/03/2021
Electronic publication
Footnotes
SJK’s present address is: Department of Biochemistry, College of Natural Sciences, and Kangwon Institute of Inclusive Technology, Kangwon National University, Chuncheon, Korea.
KS’s present address is: Experimental and Computational Genomics Core, CRB 2, Sidney Kimmel Comprehensive Cancer Center, The Johns Hopkins University School of Medicine, Baltimore, Maryland, USA.
Conflict of interest: The authors have declared that no conflict of interest exists.
Copyright: © 2021, American Society for Clinical Investigation.
Reference information: J Clin Invest. 2021;131(9):e132305.https://doi.org/10.1172/JCI132305.
Contributor Information
Adrien Guillot, Email: adrien.guillot@charite.de.
Lucia Guerri, Email: lucia.guerri@nih.gov.
Dechun Feng, Email: dechun.Feng@nih.gov.
Seung-Jin Kim, Email: sjk@kangwon.ac.kr.
Yeni Ait Ahmed, Email: yeniait.75@gmail.com.
Janos Paloczi, Email: janos.paloczi@nih.gov.
Yong He, Email: yong.he@nih.gov.
Kornel Schuebel, Email: kschueb1@jhmi.edu.
Shen Dai, Email: daishen209@gmail.com.
Fengming Liu, Email: fliu6@tulane.edu.
Pal Pacher, Email: pacher@mail.nih.gov.
Tatiana Kisseleva, Email: tkisseleva@ucsd.edu.
Xuebin Qin, Email: xqin2@tulane.edu.
David Goldman, Email: davidgoldman@mail.nih.gov.
Frank Tacke, Email: frank.tacke@charite.de.
Bin Gao, Email: bgao@mail.nih.gov.
References
- 1.Cheung AC, et al. Pathobiology of biliary epithelia. Biochim Biophys Acta Mol Basis Dis. 2018;1864(4 Pt B):1220–1231. doi: 10.1016/j.bbadis.2017.06.024. [DOI] [PMC free article] [PubMed] [Google Scholar]
- 2.Lazaridis KN, LaRusso NF. The cholangiopathies. Mayo Clin Proc. 2015;90(6):791–800. doi: 10.1016/j.mayocp.2015.03.017. [DOI] [PMC free article] [PubMed] [Google Scholar]
- 3.Edwards K, et al. Secondary sclerosing cholangitis in critically ill patients: a rare disease precipitated by severe SARS-CoV-2 infection. BMJ Case Rep. 2020;13(11):e237984. doi: 10.1136/bcr-2020-237984. [DOI] [PMC free article] [PubMed] [Google Scholar]
- 4.Baker TB, et al. Biliary reconstructive techniques and associated anatomic variants in adult living donor liver transplantations: The adult-to-adult living donor liver transplantation cohort study experience. Liver Transpl. 2017;23(12):1519–1530. doi: 10.1002/lt.24872. [DOI] [PMC free article] [PubMed] [Google Scholar]
- 5.Guillot A, et al. Interleukins-17 and 27 promote liver regeneration by sequentially inducing progenitor cell expansion and differentiation. Hepatol Commun. 2018;2(3):329–343. doi: 10.1002/hep4.1145. [DOI] [PMC free article] [PubMed] [Google Scholar]
- 6.Sancho-Bru P, et al. Liver progenitor cell markers correlate with liver damage and predict short-term mortality in patients with alcoholic hepatitis. Hepatology. 2012;55(6):1931–1941. doi: 10.1002/hep.25614. [DOI] [PubMed] [Google Scholar]
- 7.Knight B, et al. Liver inflammation and cytokine production, but not acute phase protein synthesis, accompany the adult liver progenitor (oval) cell response to chronic liver injury. Immunol Cell Biol. 2005;83(4):364–374. doi: 10.1111/j.1440-1711.2005.01346.x. [DOI] [PubMed] [Google Scholar]
- 8.Fabris L, et al. Emerging concepts in biliary repair and fibrosis. Am J Physiol Gastrointest Liver Physiol. 2017;313(2):G102–G116. doi: 10.1152/ajpgi.00452.2016. [DOI] [PMC free article] [PubMed] [Google Scholar]
- 9.Banales JM, et al. Cholangiocyte pathobiology. Nat Rev Gastroenterol Hepatol. 2019;16(5):269–281. doi: 10.1038/s41575-019-0125-y. [DOI] [PMC free article] [PubMed] [Google Scholar]
- 10.Mariotti V, et al. Animal models of cholestasis: an update on inflammatory cholangiopathies. Biochim Biophys Acta Mol Basis Dis. 2019;1865(5):954–964. doi: 10.1016/j.bbadis.2018.07.025. [DOI] [PubMed] [Google Scholar]
- 11.Liu Y, et al. Animal models of chronic liver diseases. Am J Physiol Gastrointest Liver Physiol. 2013;304(5):G449–G468. doi: 10.1152/ajpgi.00199.2012. [DOI] [PubMed] [Google Scholar]
- 12.Waisbourd-Zinman O, et al. The toxin biliatresone causes mouse extrahepatic cholangiocyte damage and fibrosis through decreased glutathione and SOX17. Hepatology. 2016;64(3):880–893. doi: 10.1002/hep.28599. [DOI] [PMC free article] [PubMed] [Google Scholar]
- 13.Guicciardi ME, et al. Macrophages contribute to the pathogenesis of sclerosing cholangitis in mice. J Hepatol. 2018;69(3):676–686. doi: 10.1016/j.jhep.2018.05.018. [DOI] [PMC free article] [PubMed] [Google Scholar]
- 14.Ferreira-Gonzalez S, et al. Paracrine cellular senescence exacerbates biliary injury and impairs regeneration. Nat Commun. 2018;9(1):1020. doi: 10.1038/s41467-018-03299-5. [DOI] [PMC free article] [PubMed] [Google Scholar]
- 15.Guillot A, et al. Cannabinoid receptor 2 counteracts interleukin-17-induced immune and fibrogenic responses in mouse liver. Hepatology. 2014;59(1):296–306. doi: 10.1002/hep.26598. [DOI] [PubMed] [Google Scholar]
- 16.Feng D, et al. Cre-inducible human CD59 mediates rapid cell ablation after intermedilysin administration. J Clin Invest. 2016;126(6):2321–2333. doi: 10.1172/JCI84921. [DOI] [PMC free article] [PubMed] [Google Scholar]
- 17.Meng L, et al. Functional role of cellular senescence in biliary injury. Am J Pathol. 2015;185(3):602–609. doi: 10.1016/j.ajpath.2014.10.027. [DOI] [PMC free article] [PubMed] [Google Scholar]
- 18.Patsenker E, et al. Inhibition of integrin alphavbeta6 on cholangiocytes blocks transforming growth factor-beta activation and retards biliary fibrosis progression. Gastroenterology. 2008;135(2):660–670. doi: 10.1053/j.gastro.2008.04.009. [DOI] [PMC free article] [PubMed] [Google Scholar]
- 19.Peng ZW, et al. Integrin αvβ6 critically regulates hepatic progenitor cell function and promotes ductular reaction, fibrosis, and tumorigenesis. Hepatology. 2016;63(1):217–232. doi: 10.1002/hep.28274. [DOI] [PMC free article] [PubMed] [Google Scholar]
- 20.Patsenker E, et al. The alphavbeta6 integrin is a highly specific immunohistochemical marker for cholangiocarcinoma. J Hepatol. 2010;52(3):362–369. doi: 10.1016/j.jhep.2009.12.006. [DOI] [PubMed] [Google Scholar]
- 21.Pi L, et al. Connective tissue growth factor and integrin αvβ6: a new pair of regulators critical for ductular reaction and biliary fibrosis in mice. Hepatology. 2015;61(2):678–691. doi: 10.1002/hep.27425. [DOI] [PMC free article] [PubMed] [Google Scholar]
- 22.Wen Y, et al. Hepatic macrophages in liver homeostasis and diseases-diversity, plasticity and therapeutic opportunities. Cell Mol Immunol. 2021;18(1):45–56. doi: 10.1038/s41423-020-00558-8. [DOI] [PMC free article] [PubMed] [Google Scholar]
- 23.Guillot A, Tacke F. Liver macrophages: old dogmas and new insights. Hepatol Commun. 2019;3(6):730–743. doi: 10.1002/hep4.1356. [DOI] [PMC free article] [PubMed] [Google Scholar]
- 24.Lavin Y, et al. Tissue-resident macrophage enhancer landscapes are shaped by the local microenvironment. Cell. 2014;159(6):1312–1326. doi: 10.1016/j.cell.2014.11.018. [DOI] [PMC free article] [PubMed] [Google Scholar]
- 25.Kim SJ, et al. Adipocyte death preferentially induces liver injury and inflammation through the activation of chemokine (C-C Motif) receptor 2-positive macrophages and lipolysis. Hepatology. 2019;69(5):1965–1982. doi: 10.1002/hep.30525. [DOI] [PMC free article] [PubMed] [Google Scholar]
- 26.Rehg JE, et al. The utility of immunohistochemistry for the identification of hematopoietic and lymphoid cells in normal tissues and interpretation of proliferative and inflammatory lesions of mice and rats. Toxicol Pathol. 2012;40(2):345–374. doi: 10.1177/0192623311430695. [DOI] [PubMed] [Google Scholar]
- 27.Guillot A, et al. Deciphering the immune microenvironment on a single archival formalin-fixed paraffin-embedded tissue section by an immediately implementable multiplex fluorescence immunostaining protocol. Cancers (Basel) 2020;12(9):E2449. doi: 10.3390/cancers12092449. [DOI] [PMC free article] [PubMed] [Google Scholar]
- 28.Guillot A, et al. Kupffer cell and monocyte-derived macrophage identification by immunofluorescence on formalin-fixed, paraffin-embedded (FFPE) mouse liver sections. Methods Mol Biol. 2020;2164:45–53. doi: 10.1007/978-1-0716-0704-6_6. [DOI] [PubMed] [Google Scholar]
- 29.Tirnitz-Parker JE, et al. Tumor necrosis factor-like weak inducer of apoptosis is a mitogen for liver progenitor cells. Hepatology. 2010;52(1):291–302. doi: 10.1002/hep.23663. [DOI] [PubMed] [Google Scholar]
- 30.Hogenauer K, et al. G-protein-coupled bile acid receptor 1 (GPBAR1, TGR5) agonists reduce the production of proinflammatory cytokines and stabilize the alternative macrophage phenotype. J Med Chem. 2014;57(24):10343–10354. doi: 10.1021/jm501052c. [DOI] [PubMed] [Google Scholar]
- 31.Biagioli M, et al. The bile acid receptor GPBAR1 regulates the M1/M2 phenotype of intestinal macrophages and activation of GPBAR1 rescues mice from murine colitis. J Immunol. 2017;199(2):718–733. doi: 10.4049/jimmunol.1700183. [DOI] [PubMed] [Google Scholar]
- 32.Tacke F. Targeting hepatic macrophages to treat liver diseases. J Hepatol. 2017;66(6):1300–1312. doi: 10.1016/j.jhep.2017.02.026. [DOI] [PubMed] [Google Scholar]
- 33.Takeuchi M, et al. Neutrophils interact with cholangiocytes to cause cholestatic changes in alcoholic hepatitis. Gut. 2021;70(2):342–356. doi: 10.1136/gutjnl-2020-322540. [DOI] [PMC free article] [PubMed] [Google Scholar]
- 34.Kisseleva T, et al. Bone marrow-derived fibrocytes participate in pathogenesis of liver fibrosis. J Hepatol. 2006;45(3):429–438. doi: 10.1016/j.jhep.2006.04.014. [DOI] [PubMed] [Google Scholar]
- 35.Scholten D, et al. Migration of fibrocytes in fibrogenic liver injury. Am J Pathol. 2011;179(1):189–198. doi: 10.1016/j.ajpath.2011.03.049. [DOI] [PMC free article] [PubMed] [Google Scholar]
- 36.Weiskirchen R, et al. Organ and tissue fibrosis: Molecular signals, cellular mechanisms and translational implications. Mol Aspects Med. 2019;65:2–15. doi: 10.1016/j.mam.2018.06.003. [DOI] [PubMed] [Google Scholar]
- 37.Xu J, et al. Contribution of bone marrow-derived fibrocytes to liver fibrosis. Hepatobiliary Surg Nutr. 2015;4(1):34–47. doi: 10.3978/j.issn.2304-3881.2015.01.01. [DOI] [PMC free article] [PubMed] [Google Scholar]
- 38.Hall C, et al. Regulators of cholangiocyte proliferation. Gene Expr. 2017;17(2):155–171. doi: 10.3727/105221616X692568. [DOI] [PMC free article] [PubMed] [Google Scholar]
- 39.Tanimizu N, et al. Liver progenitor cells develop cholangiocyte-type epithelial polarity in three-dimensional culture. Mol Biol Cell. 2007;18(4):1472–1479. doi: 10.1091/mbc.e06-09-0848. [DOI] [PMC free article] [PubMed] [Google Scholar]
- 40.He Y, et al. Interaction of CD44 and hyaluronic acid enhances biliary epithelial proliferation in cholestatic livers. Am J Physiol Gastrointest Liver Physiol. 2008;295(2):G305–G312. doi: 10.1152/ajpgi.90229.2008. [DOI] [PubMed] [Google Scholar]
- 41.Jakubowski A, et al. TWEAK induces liver progenitor cell proliferation. J Clin Invest. 2005;115(9):2330–2340. doi: 10.1172/JCI23486. [DOI] [PMC free article] [PubMed] [Google Scholar]
- 42.Karaca G, et al. TWEAK/Fn14 signaling is required for liver regeneration after partial hepatectomy in mice. PLoS One. 2014;9(1):e83987. doi: 10.1371/journal.pone.0083987. [DOI] [PMC free article] [PubMed] [Google Scholar]
- 43.Locatelli L, et al. Macrophage recruitment by fibrocystin-defective biliary epithelial cells promotes portal fibrosis in congenital hepatic fibrosis. Hepatology. 2016;63(3):965–982. doi: 10.1002/hep.28382. [DOI] [PMC free article] [PubMed] [Google Scholar]
- 44.Cao D, et al. Retinoic acid-related orphan receptor C regulates proliferation, glycolysis, and chemoresistance via the PD-L1/ITGB6/STAT3 signaling axis in bladder cancer. Cancer Res. 2019;79(10):2604–2618. doi: 10.1158/0008-5472.CAN-18-3842. [DOI] [PubMed] [Google Scholar]
- 45.Lu D, et al. Beyond T cells: understanding the role of PD-1/PD-L1 in tumor-associated macrophages. J Immunol Res. 2019;2019:1919082. doi: 10.1155/2019/1919082. [DOI] [PMC free article] [PubMed] [Google Scholar]
- 46.Lu L, et al. Hippo pathway coactivators Yap and Taz are required to coordinate mammalian liver regeneration. Exp Mol Med. 2018;50(1):e423. doi: 10.1038/emm.2017.205. [DOI] [PMC free article] [PubMed] [Google Scholar]
- 47.Lee DH, et al. LATS-YAP/TAZ controls lineage specification by regulating TGFβ signaling and Hnf4α expression during liver development. Nat Commun. 2016;7:11961. doi: 10.1038/ncomms11961. [DOI] [PMC free article] [PubMed] [Google Scholar]
- 48.Planas-Paz L, et al. YAP, but not RSPO-LGR4/5, signaling in biliary epithelial cells promotes a ductular reaction in response to liver injury. Cell Stem Cell. 2019;25(1):39–53. doi: 10.1016/j.stem.2019.04.005. [DOI] [PubMed] [Google Scholar]
- 49.Ishikawa T, et al. Hepatocyte growth factor/c-met signaling is required for stem-cell-mediated liver regeneration in mice. Hepatology. 2012;55(4):1215–1226. doi: 10.1002/hep.24796. [DOI] [PMC free article] [PubMed] [Google Scholar]
- 50.Huang XZ, et al. Inactivation of the integrin beta 6 subunit gene reveals a role of epithelial integrins in regulating inflammation in the lung and skin. J Cell Biol. 1996;133(4):921–928. doi: 10.1083/jcb.133.4.921. [DOI] [PMC free article] [PubMed] [Google Scholar]
- 51.Yata Y, et al. DNase I-hypersensitive sites enhance alpha1(I) collagen gene expression in hepatic stellate cells. Hepatology. 2003;37(2):267–276. doi: 10.1053/jhep.2003.50067. [DOI] [PubMed] [Google Scholar]
- 52.Varga ZV, et al. Disruption of renal arginine metabolism promotes kidney injury in hepatorenal syndrome in mice. Hepatology. 2018;68(4):1519–1533. doi: 10.1002/hep.29915. [DOI] [PMC free article] [PubMed] [Google Scholar]
- 53.Glaser S, et al. Differential transcriptional characteristics of small and large biliary epithelial cells derived from small and large bile ducts. Am J Physiol Gastrointest Liver Physiol. 2010;299(3):G769–G777. doi: 10.1152/ajpgi.00237.2010. [DOI] [PMC free article] [PubMed] [Google Scholar]
- 54.Rosenberg AZ, et al. High-throughput microdissection for next-generation sequencing. PLoS One. 2016;11(3):e0151775. doi: 10.1371/journal.pone.0151775. [DOI] [PMC free article] [PubMed] [Google Scholar]
- 55.Huang da W, et al. Systematic and integrative analysis of large gene lists using DAVID bioinformatics resources. Nat Protoc. 2009;4(1):44–57. doi: 10.1038/nprot.2008.211. [DOI] [PubMed] [Google Scholar]
Associated Data
This section collects any data citations, data availability statements, or supplementary materials included in this article.


