Abstract
The angiopoietin (Ang)/Tie pathway is essential for the proper maturation and remodeling of the vasculature. Despite its importance in disease, the mechanisms that control signal transduction through this pathway are poorly understood. Here, we demonstrate that heparan sulfate glycosaminoglycans (HS GAGs) regulate Ang/Tie signaling through direct interactions with both Ang ligands and the Tie1 receptor. HS GAGs bound to Ang1/4 ligands and formed ternary Ang-Tie2 receptor complexes, thereby potentiating endothelial survival signaling. In addition, we found that HS GAGs are novel ligands for the orphan receptor Tie1. The HS-Tie1 interaction promoted Tie1-Tie2 heterodimerization and enhanced Tie1 stability within the mature vasculature. Loss of HS-Tie1 binding using CRISPR/Cas9-mediated mutagenesis in vivo led to decreased Tie protein levels, pathway suppression, and aberrant retinal vascularization. Together, these results reveal that sulfated glycans use dual mechanisms to regulate Ang/Tie signaling and are important for the development and maintenance of the vasculature.
Introduction
Vascular tissue changes dynamically over the lifespan of an organism in response to development, growth, and injury.1,2 The balance between vessel formation, stabilization, and regression is coordinated by numerous signaling molecules at the surface of endothelial cells.3 During angiogenesis, endothelial cells are regulated by several receptor tyrosine kinase (RTK) pathways, including the vascular endothelial growth factor receptor (VEGFR),4 fibroblast growth factor receptor (FGFR),5 and platelet-derived growth factor receptor (PDGFR) pathways,6 via the spatiotemporally controlled expression and release of ligands from the surrounding tissue. Mechanisms to coordinate the assembly and activation of ligand-receptor complexes at the cell surface are thus vital for the proper growth, patterning, and maturation of blood and lymphatic vessels.
Many of these ligands and receptors bind to linear, sulfated polysaccharides known as glycosaminoglycans (GAGs), which are anchored to the cell surface or secreted into the extracellular matrix.7,8 Interactions between GAGs and proteins modulate signal transduction in various important biological contexts, such as cell differentiation,9 tissue formation,10 and wound repair.11 However, the structural complexity of GAG chains, which contain up to 100 disaccharide units and display diverse sulfation motifs,7,8 has challenged efforts to identify and characterize GAG-protein interactions.
Numerous studies have revealed that heparan sulfate GAGs (HS GAGs) are key regulators of vascular development. For example, genetic deletion of HS biosynthetic enzymes leads to severe vascular defects, edema, as well as embryonic or neonatal lethality in mice.12,13 At the molecular level, HS GAGs facilitate the interactions of VEGF165 and VEGFR2, and thereby promote cell proliferation, migration, and endothelial tube formation.4,14,15 HS GAGs are also implicated in the regulation of other angiogenic ligand-receptor complexes such as FGF2/FGFR15,16,17 and PDGF-BB/PDGFR.18 While prior work has focused on HS GAGs during sprouting angiogenesis,13,19 the functions of GAGs during blood vessel maturation and homeostasis have received far less attention. Therefore, we postulated that HS GAGs might play additional roles in regulating the vascular system through as yet unidentified GAG-protein interactions.
The Ang/Tie RTK pathway is critical for the establishment and maintenance of both normal and disease-associated vaculature.20,21 This endothelial signaling pathway is required for the maturation and pruning of blood and lymphatic vessels during development and their homeostasis during adulthood. In mammals, the pathway is comprised of two cell-surface receptors, Tie1 and Tie2, and three soluble ligands, Ang1, Ang2, and Ang4. Genetic deletion of either receptor is embryonic or neonatal lethal in mice, and the resultant embryos exhibit severe edemic phenotypes.22,23 Signaling in the Ang/Tie pathway is thought to occur exclusively via activation of Tie2 receptors. Ang1 or Ang4 ligands promote the oligomerization of Tie2, which leads to Tie2 cross-phosphorylation, stimulation of downstream Akt signaling, and nuclear export of the transcription factor FOXO1 (Fig. 1a).20 In contrast, Ang2 acts as a context-dependent agonist or antagonist of Tie2 activity during vessel remodeling.24 Aberrations in these signaling pathways contribute to tumor development, sepsis, and diabetes-associated complications.21 As such, numerous therapeutics targeting Ang1, Ang2, and Tie2 have entered clinical trials to treat a diverse range of diseases.21
Figure 1. HS GAGs engage Ang1 and Ang4 ligands to form ternary complexes with Tie2.
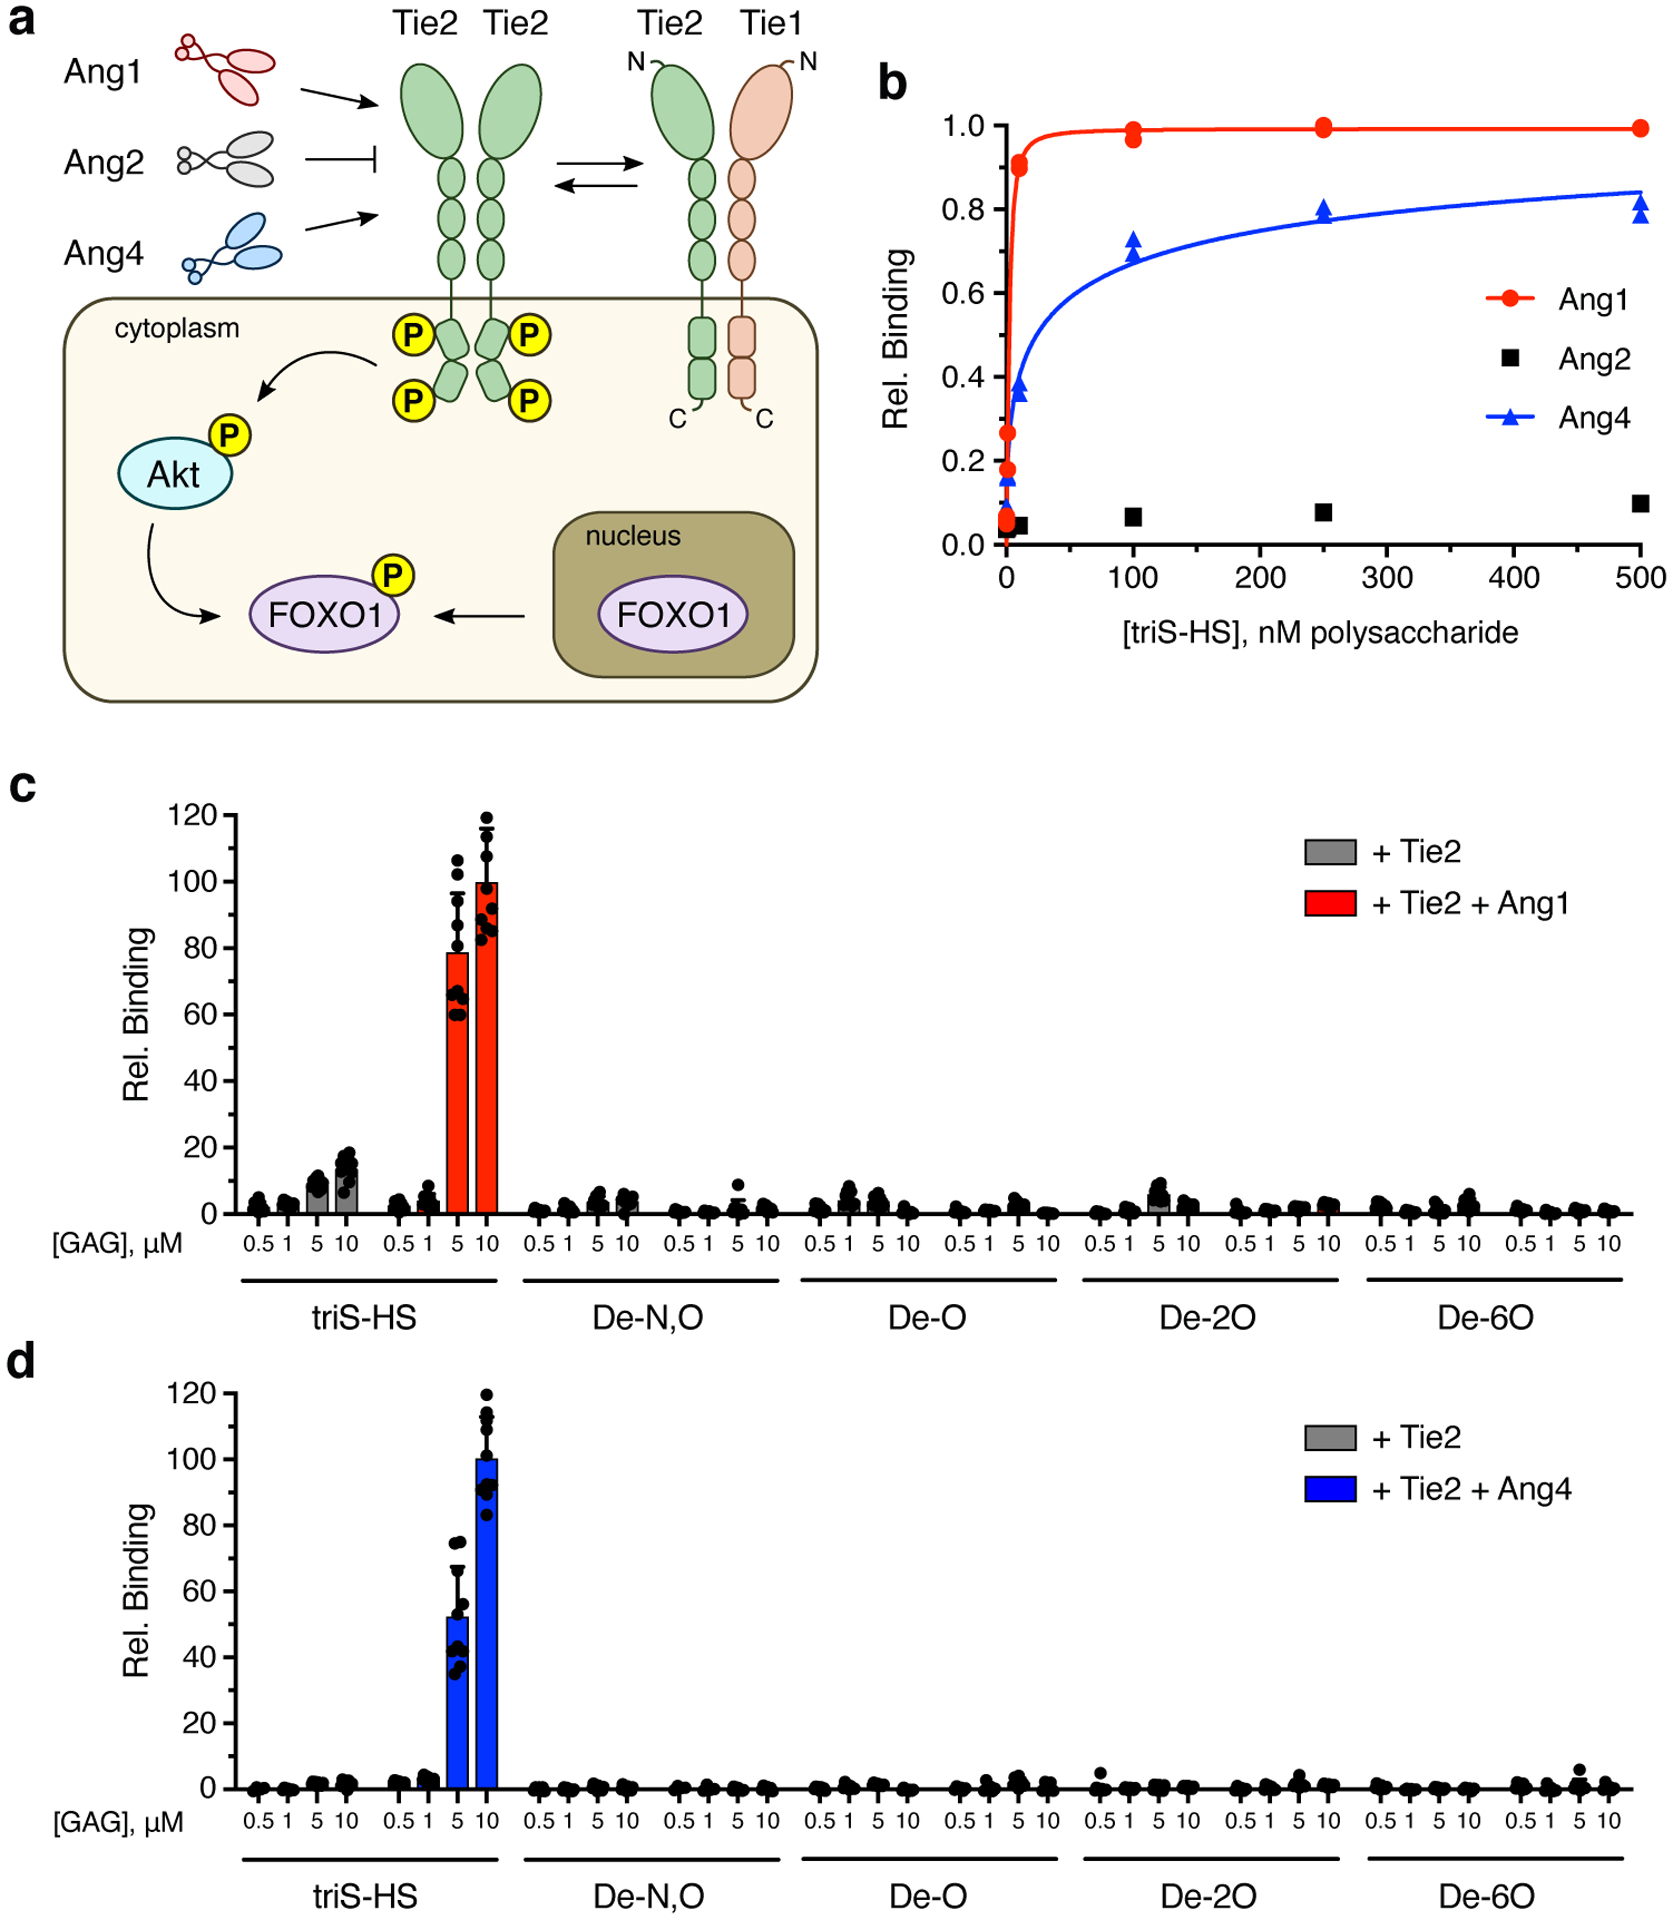
(a) Schematic of the Ang/Tie signaling pathway in which Ang ligands and Tie1 can act as agonists or antagonists of Tie2 phosphorylation and downstream signaling. N- and C-termini of the Tie proteins are indicated by N and C, respectively. (b) ELISA-based detection of biotinylated triS-HS bound to immobilized Ang1, Ang2, and Ang4. Dissociation constants: KD,app (Ang1) = 2.23 nM (1.69 to 2.87 nM), KD,app (Ang4) = 41.8 nM (9.73 nM to 21.0 μM). Values represent mean (95% CI); graphed data represent n = 2 independent replicates. (c, d) Binding of Tie2-Fc ectodomain to a chemically-defined HS GAG microarray in the presence or absence of Ang1 (c) or Ang4 (d). Data represent mean ± s.e.m., n = 10 individual spots per glycan concentration.
Unlike Tie2, the Tie1 receptor is an orphan receptor,25 and its functions are much less well understood. Although early studies proposed that Tie1 inhibits Tie2 signaling,26 recent evidence suggests that Tie1 acts in a context-dependent manner via transient interactions with Tie2.27,28 The formation of Tie1-Tie2 heterodimers has been suggested to prevent Tie2 activation and rapid internalization, which in turn maintains a population of Tie2 receptors at the cell surface and sustains Tie2 signaling (Fig. 1a).29,30 Interestingly, Tie1 was also recently linked to tumor progression and metastasis, wherein loss of Tie1 on endothelial cells decreased new vessel formation in primary tumors and reduced secondary lung metastases.31,32 These studies implicate Tie1 as an anti-cancer target and further highlight the importance of obtaining a better mechanistic understanding of Ang/Tie pathway regulation.
Here, we report that HS GAGs play a key role in regulating the Ang/Tie RTK signaling axis. Through direct interactions with both Ang ligands and the orphan receptor Tie1, HS GAGs direct the assembly of cell-surface receptor complexes and modulate pro-survival signaling. Furthermore, loss of HS GAG regulation leads to decreased pathway activation and altered vascularization in vivo. Together, these results provide new insights into the molecular mechanisms that control Ang/Tie RTK signaling and suggest new roles for HS GAGs in the formation, maturation, and homeostasis of complex vascular tissue.
Results
HS GAGs bind to angiopoietin ligands Ang1 and Ang4
As HS GAGs regulate other RTK pathways by interacting with soluble ligands,8,13 we first examined whether HS GAGs bind to the angiopoietins, Ang1, Ang2, and Ang4. A modified enzyme-linked immunosorbent assay (ELISA)33 was employed to detect the binding of biotinylated HS GAGs to immobilized Ang ligands. HS GAGs enriched in the N-, 2-O-, and 6-O-sulfated HS motif (triS-HS) showed nanomolar affinity for Ang1 and Ang4 and no measurable affinity for the antagonist Ang2 (Fig. 1b). Interestingly, the observed binding preferences for anionic HS GAGs were unexpected based on the theoretical isoelectric (pI) values of the ligands (6.20 for Ang1, 5.34 for Ang2, 8.65 for Ang4).
We next examined whether HS GAGs could form ternary complexes with Ang1 or Ang4 and the Tie2 receptor. For this, we employed our GAG microarray platform, which was successfully used to detect HS-FGF-FGFR interactions.34 Tie2 alone showed little affinity for any of the HS GAG structures on the microarray (Figs. 1c,d), as confirmed by ELISA (Extended Data Fig. 1). However, when Tie2 was added with Ang1 or Ang4, we observed robust localization of Tie2 to triS-HS on the microarray. These results suggest that angiopoietin ligands recruited by the immobilized HS GAGs can interact with the Tie2 receptor and form ternary GAG-ligand-receptor complexes. Notably, complex formation was hindered by loss of HS sulfation, indicating that Ang1/4 binding to HS GAGs and ternary complex formation occurred in a sulfation-dependent manner.
Cell-surface triS-HS regulates pro-survival signaling
As triS-HS bound to agonists of Tie2 signaling, we hypothesized that HS GAGs may promote the formation of activated signaling complexes and positively regulate cell survival pathways. To test this, we stimulated human umbilical vein endothelial cells (HUVECs) with Ang1 and monitored the export of FOXO1 from the nucleus (Fig. 1a). Compared to unstimulated cells, we saw a significant increase in the number of FOXO1− nuclei (Figs. 2a,b), consistent with an increase in Ang1-dependent Tie2 signaling. Nuclear export of FOXO1 was significantly blocked by pre-incubation of Ang1 with an excess of soluble triS-HS, suggesting that Ang1 binding to cell-surface HS GAGs was competed away by soluble GAGs.
Figure 2. Ang-HS binding positively regulates pro-survival signaling.
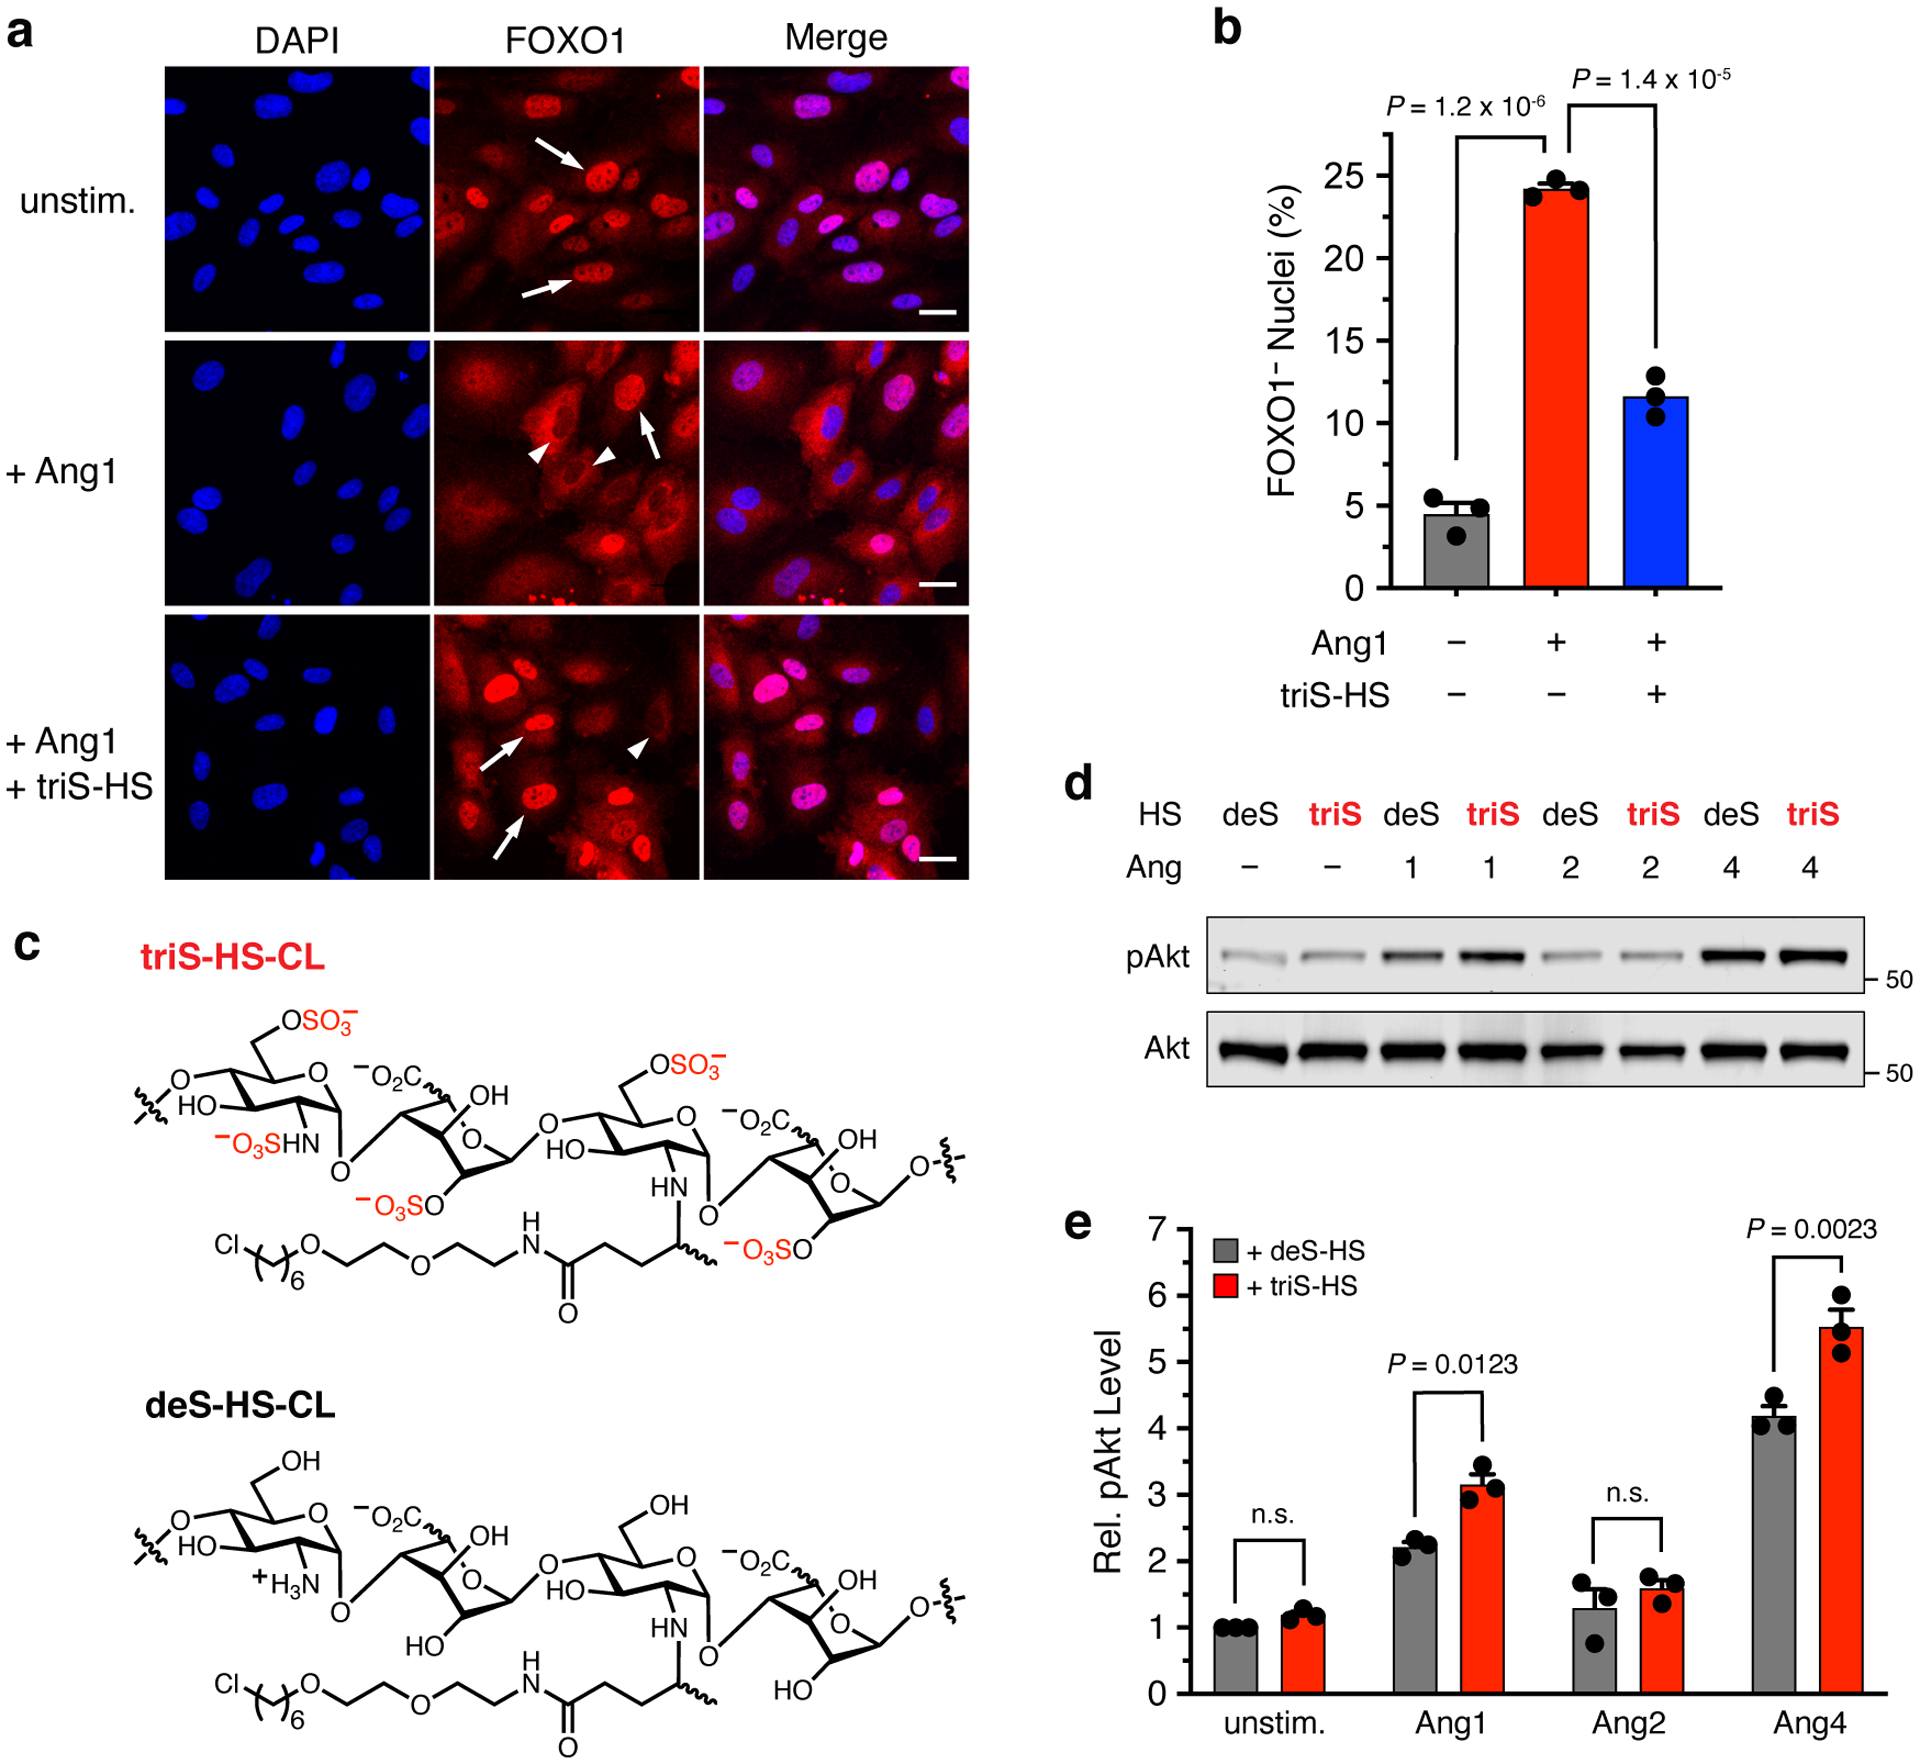
(a) Representative images and (b) quantification of FOXO1 export (red) from the nuclei (blue, DAPI) of HUVECs after stimulation with either Ang1 alone or Ang1 pre-incubated with excess triS-HS. Arrows indicate FOXO1+ nuclei, whereas arrowheads indicate FOXO1− nuclei, scale bar = 50 μm. Data represent mean ± s.e.m., n = 3 biologically independent samples, one-way ANOVA with Tukey’s post-hoc test. (c) Chemical structures of triS-HS and deS-HS conjugated to the chlorohexyl linker (CL) for cell-surface glycan engineering of HaloTag protein (HTP)-expressing cells. (d) Representative Western blots and (e) quantification of Akt phosphorylation in EA.hy926 cells engineered to display either triS-HS or deS-HS after stimulation with Ang1, Ang2, or Ang4. pAkt values were normalized to the corresponding total Akt levels and are reported relative to unstimulated deS-HS. Data represent mean ± s.e.m., n = 3 biologically independent samples, two-way ANOVA with Sidak’s multiple comparisons test.
We next investigated whether Tie2 signaling was potentiated by directly remodeling HS GAGs on the cell surface. For this, we utilized our established glycan engineering method, whereby a transmembrane HaloTag protein (HTP) is heterologously expressed on the cell surface.35 Reaction of an aspartic acid residue in the HTP with a chloroalkyl group on functionalized GAGs forms a covalent linkage, enabling cell-surface display of desired GAG structures and mimicking the natural presentation of GAGs on proteoglycans (Supplementary Fig. 1a). We first produced a lentivirus to stably express the HTP on the surface of EA.hy926 human endothelial cells. HTP expression was confirmed by labeling the cells with Alexa Fluor 488 dye conjugated to a chlorohexyl linker (AF488-CL) (Supplementary Fig. 1b). We then treated the cells with chlorohexyl linker-modified triS-HS (triS-HS-CL)35 or chemically desulfated HS (deS-HS-CL) (Fig. 2c) prior to stimulating the cells with different Ang ligands. Cells engineered to display triS-HS showed a marked increase in Akt phosphorylation compared to cells engineered with deS-HS upon stimulation with the Tie2 agonists Ang1 and Ang4, but not the Tie2 antagonist Ang2 (Figs. 2d,e). Together, these results demonstrate that HS GAGs can engage in ternary complexes with Ang1/4 and Tie2 and regulate downstream activation of the pathway.
Sulfated GAGs are ligands for the orphan receptor Tie1
In addition to recruiting ligands to the cell surface, GAGs have been shown to engage transmembrane receptors directly.16,33,36,37 Consistent with the microarray results (Figs. 1c,d), no direct interaction was observed between triS-HS GAGs and Tie2 receptors using our modified ELISA (Fig. 3a). However, the orphan receptor Tie1 bound to tri-HS with nanomolar affinity (KD,app = 6.16 nM, 5.40 to 7.01 nM, 95% confidence interval (CI); Fig. 3a). Interestingly, Tie1 also bound to the disulfated chondroitin sulfate-E (CS-E) motif (Extended Data Figs. 2a,b). To study the importance of the GAG sulfation pattern further, we assessed Tie1 binding to a panel of sulfated GAGs. A soluble Tie1-Fc ectodomain showed strong binding to both triS-HS and CS-E-enriched polysaccharides (Fig. 3b, Extended Data Figs. 2c and 3). Notably, loss of any sulfate group on HS or CS caused a significant decrease in binding, demonstrating the requirement of these sulfation motifs for Tie1 binding. Surface plasmon resonance (SPR) experiments using immobilized GAGs revealed apparent dissociation constants for Tie1-GAG interactions in the nanomolar range, comparable to those obtained by ELISA (Fig. 3c, Extended Data Fig. 2d).
Figure 3. The orphan receptor Tie1 binds to the trisulfated motif of HS.
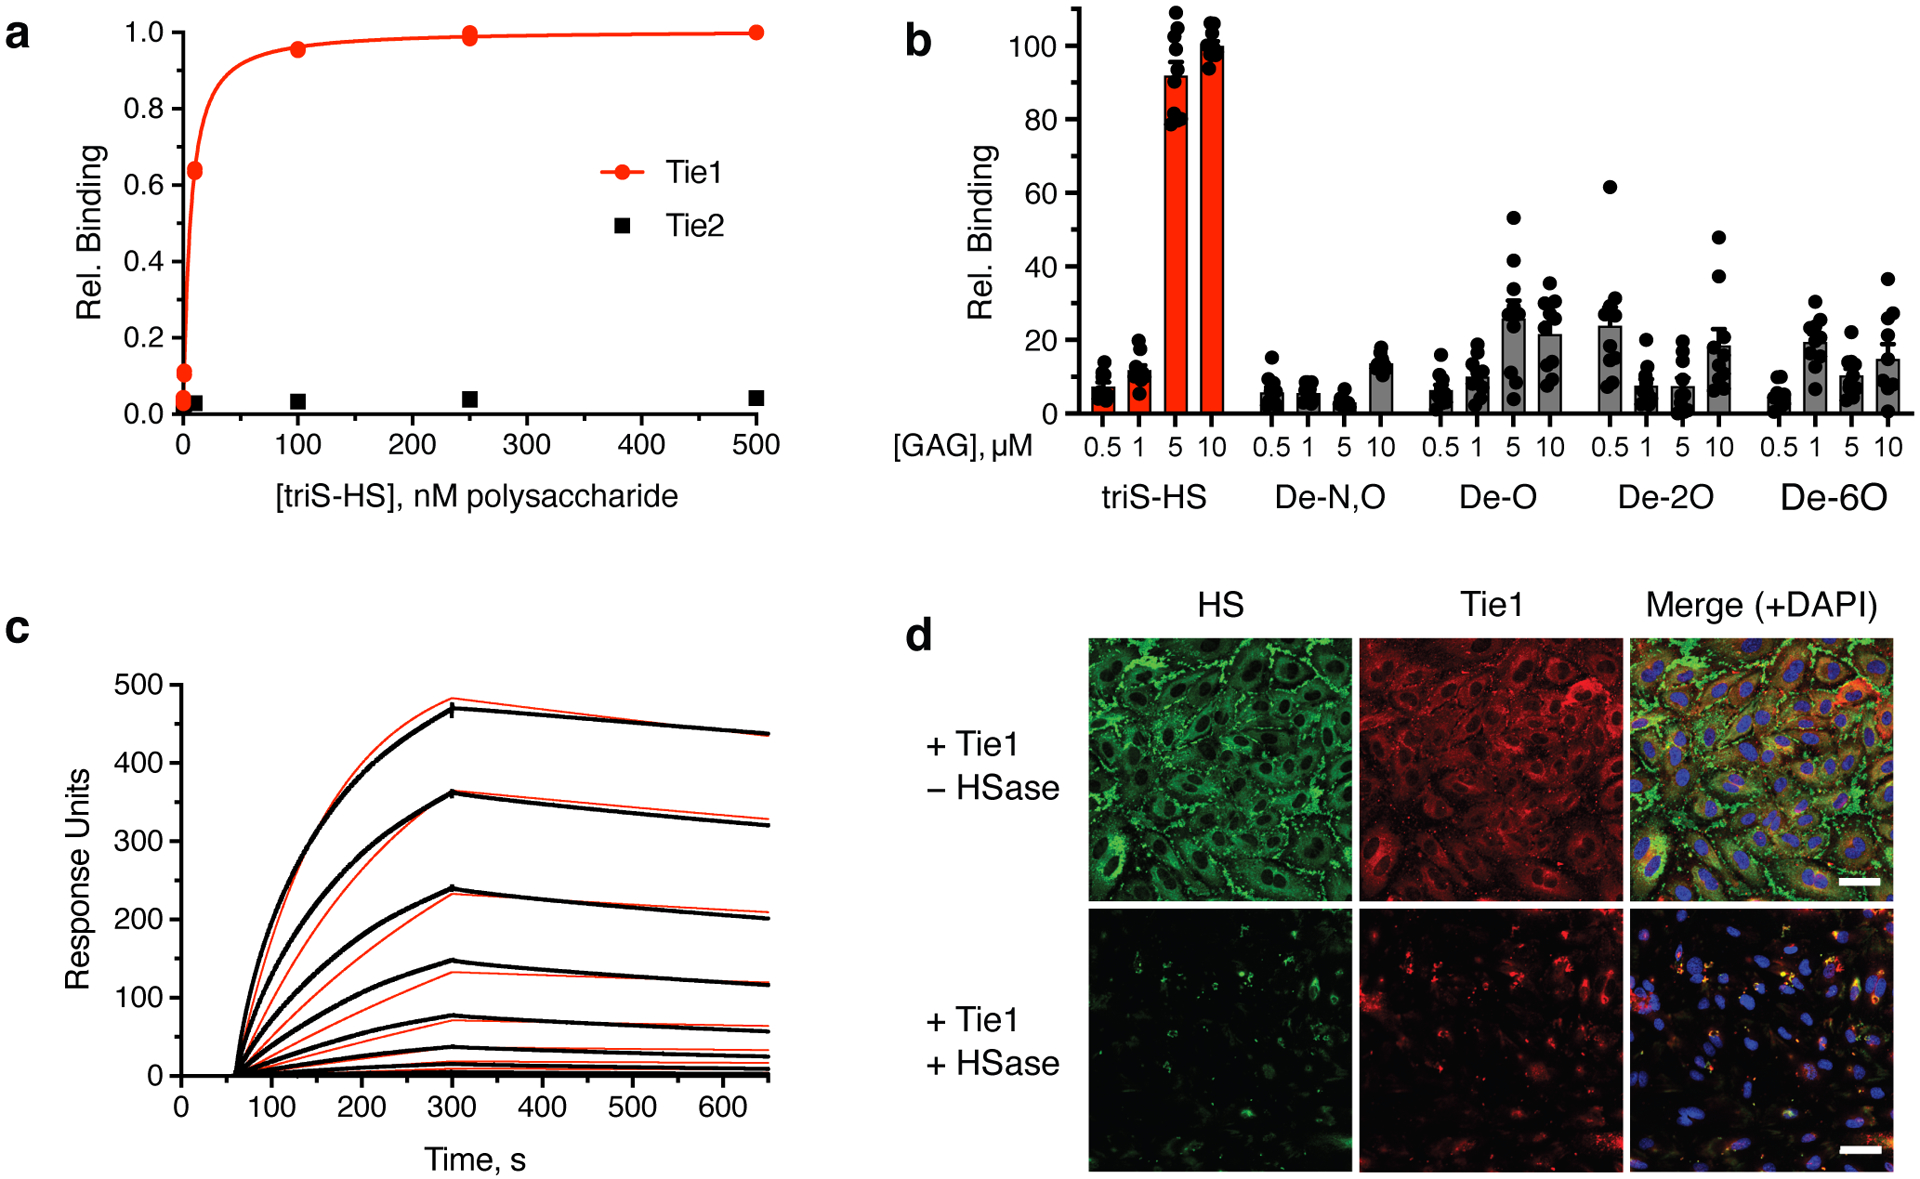
Binding was demonstrated by (a) ELISA, (b) glycan microarray, and (c) surface plasmon resonance. Dissociation constant for Tie1, as determined by ELISA: KD,app = 6.16 nM (5.40 to 7.01 nM); value represents mean (95% CI); graphed data represent n = 2 independent replicates. This value is similar to dissociation constants reported for other GAG-protein interactions.33,37 For glycan microarrays, data represent mean ± s.e.m., n = 10 individual spots per glycan concentration. Dissociation constant for Tie1, as determined by SPR: KD,app = 3.14 nM (3.12 to 3.15 nM); value represents mean (95% CI). SPR data were fit using a 1:1 Langmuir model shown in red. (d) Immunofluorescence images of HS GAGs (green) and Tie1-Fc ectodomain (red) binding to HUVECs treated with or without heparinase (HSase), scale bar = 50 μm. Nuclear staining by DAPI is shown in blue. Images are representative of 3 biologically independent samples.
To identify the physiologically relevant binding motif, we examined whether Tie1 interacted with endogenous GAGs on HUVECs. As Tie1 is most highly expressed during embryonic and early postnatal development,29 the glycocalyx of HUVECs likely mimics the carbohydrate structures encountered by Tie1 during development. We found that Tie1 showed robust binding to HUVECs (Fig. 3d, Extended Data Fig. 4). Importantly, this binding was nearly abolished when HUVECs were pre-treated with heparinase to remove endogenous HS GAGs, suggesting that HS GAGs are the major carbohydrate binding partner of Tie1 on endothelial cells. Our results are consistent with a previous report that HUVECs display more of the triS-HS motif than all CS motifs combined,38 although it is possible that Tie1 may encounter and bind to CS-E in other physiological contexts.
Sulfated GAGs bind the N-terminal Ig-like domain of Tie1
To explore the molecular basis of the GAG-Tie1 interaction, we expressed and purified a C-terminal truncation of the Tie1 ectodomain lacking its three FN3 domains (Tie1-N; Extended Data Figs. 5a,b). We found that this Tie1-N construct maintained similar binding affinity for sulfated GAGs compared to wild-type construct (Tie1-WT, Extended Data Figs. 5c,d), indicating that HS GAGs engage the N-terminal region of the protein.
To map the Tie1-GAG binding site, we turned to our GAG-Dock computational method, which has successfully predicted the interactions of sulfated GAGs with protein receptors.39 Although no crystal structure of Tie1 exists, Tie1 shares 41.6% overall sequence identity with Tie2, along with the same predicted domain structure (Extended Data Fig. 6a). In accordance with previous studies,27 we generated a structural homology model of the Tie1 N-terminus based on a crystal structure of the Tie2 ectodomain40 using SWISS-MODEL (Fig. 4a). The electrostatic potential surface of Tie1 revealed a large electropositive region centered on the first immunoglobulin-like (Ig-like) domain of Tie1 (Fig. 4b). In contrast, this strong electropositive region was absent from Tie2 (Extended Data Fig. 6b). We computationally sampled possible binding sites in the Tie1 structure using a triS-HS hexasaccharide and ranked the docked poses according to the calculated binding energies. The top 10 binding poses of the hexasaccharide all localized to a single electropositive region within the first Ig-like domain (Fig. 4c). The energetic contributions from Coulombic forces dominated over hydrogen bonding and van der Waals forces in all ten poses (Extended Data Fig. 7a). Consistent with the importance of ionic interactions, Tie1 binding to heparin sepharose diminished with increasing salt concentration and was abolished by 0.8 M NaCl (Extended Data Fig. 7b).
Figure 4. HS engages Tie1 within its first Ig-like domain (Ig1).
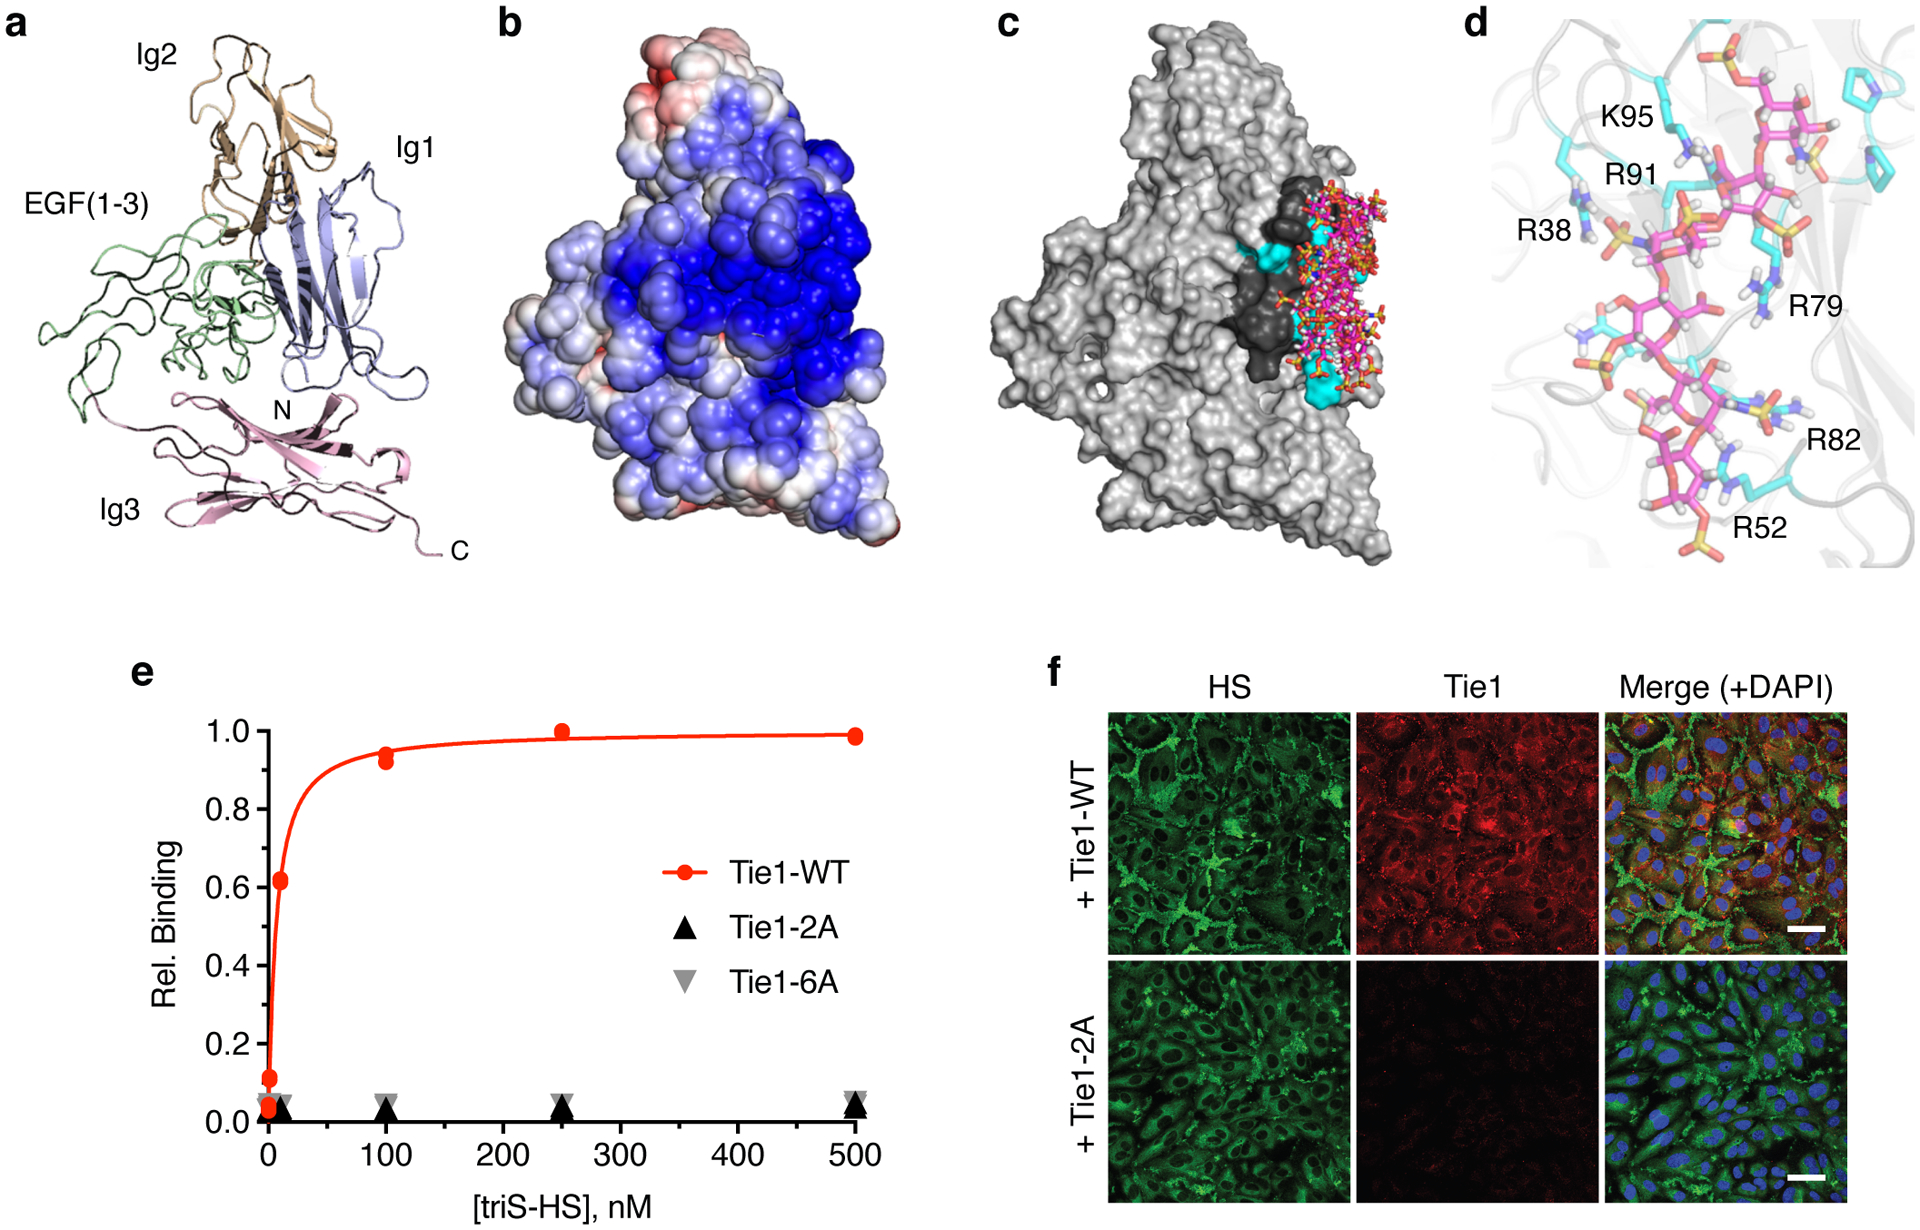
(a) Ribbon diagram and (b) electrostatic potential surface of the N-terminal Tie1 homology model produced by SWISS-MODEL. The red to blue scale in (b) represents relative electrostatic potential (electronegative to electropositive). (c) Superimposed top ten binding poses of triS-HS hexasaccharides (pink), as ranked by calculated binding energies from GAG-Dock. (d) Groove of six electropositive residues within 5–10 Å of the top 10 docked triS-HS hexasaccharide poses. The top ranked pose is shown. (e) Carbohydrate-ELISA binding assay for Tie1-WT and mutants (2A = R38A, R82A; 6A = R38A, R52A, R79A, R82A, R91A, and K95A). Dissociation constant for Tie1-WT: KD,app = 6.51 nM (5.58 to 7.63 nM). Data represent mean (95% CI), n = 2 independent replicates. (f) Immunofluorescence imaging of HUVECs with cell-associated HS GAGs (green) and soluble Tie1-WT or Tie1-2A (red), scale bar = 50 μm. Nuclear staining by DAPI is shown in blue. Images are representative of 3 biologically independent samples.
Close inspection of the docked hexasaccharides revealed that all of the glycan structures were within 5–10 Å of six positively charged amino acid residues (R38, R52, R79, R82, R91, and K95; Fig. 4d, Extended Data Fig. 6c). Four of these residues are conserved across mammals, suggesting that this interaction may play a critical, evolutionarily important role (Supplementary Fig. 2). Moreover, only one of the six electropositive residues (K95) is conserved between Tie1 and Tie2, underscoring the specificity of HS for Tie1. Interestingly, the HS binding site is located ~30 Å away from one of the two reported Tie2 binding sites,27,28 suggesting the potential for HS to modulate Tie1-Tie2 interactions (Extended Data Fig. 6d). Based on these findings, we generated two Tie1 constructs, in which all six residues (Tie1-6A) or only two central, conserved residues (R38 and R82, Tie1-2A) were mutated to alanine. Both mutant proteins were expressed and secreted from HEK-293T cells in equivalent amounts compared to Tie1-WT, consistent with proper folding and processing of the proteins (Extended Data Fig. 6e). As anticipated from our computational model, we found that both mutants lost all affinity for triS-HS (Fig. 4e). Moreover, Tie1-2A showed minimal binding to HUVECs (Fig. 4f), further indicating that our GAG-Dock method had accurately predicted the residues necessary for the HS-Tie1 interaction.
HS-Tie1 binding promotes Tie1/Tie2 heterodimerization
To elucidate the biological functions of the HS-Tie1 interaction, we examined whether this interaction altered the heterodimerization of Tie1 and Tie2.27,28 The Tie1-Tie2 heterodimer has been reported to be transient and difficult to detect, thus requiring the use of crosslinking agents.26,27 We first treated HUVECs with the cell-impermeable, cleavable crosslinker 3,3’-dithiobis(sulfosuccinimidylpropionate) (DTSSP) to capture transient interactions between cell-surface receptors, then immunoprecipitated Tie1 and blotted for co-purifying Tie2. Consistent with previous studies,26,27 the relatively transient Tie1-Tie2 heterodimer was detectable only upon crosslinking. Notably, heparinase treatment of HUVECs prior to crosslinking led to a moderate but statistically significant decrease in co-immunoprecipitated Tie2 (Figs. 5a,b). To confirm these results using an independent method, we developed a proximity ligation assay to observe Tie1-Tie2 heterodimers directly at the cell surface. Here, we again observed a decrease in the amount of Tie1-Tie2 heterodimers after heparinase treatment (Figs. 5c,d). Together, these data suggest that the HS-Tie1 interaction helps to promote or stabilize Tie1-Tie2 heterodimers. Moreover, our proximity ligation assay provides a new approach to directly observe transient Tie1-Tie2 interactions.
Figure 5. Loss of the HS-Tie1 interaction decreases Tie1-Tie2 heterodimerization.
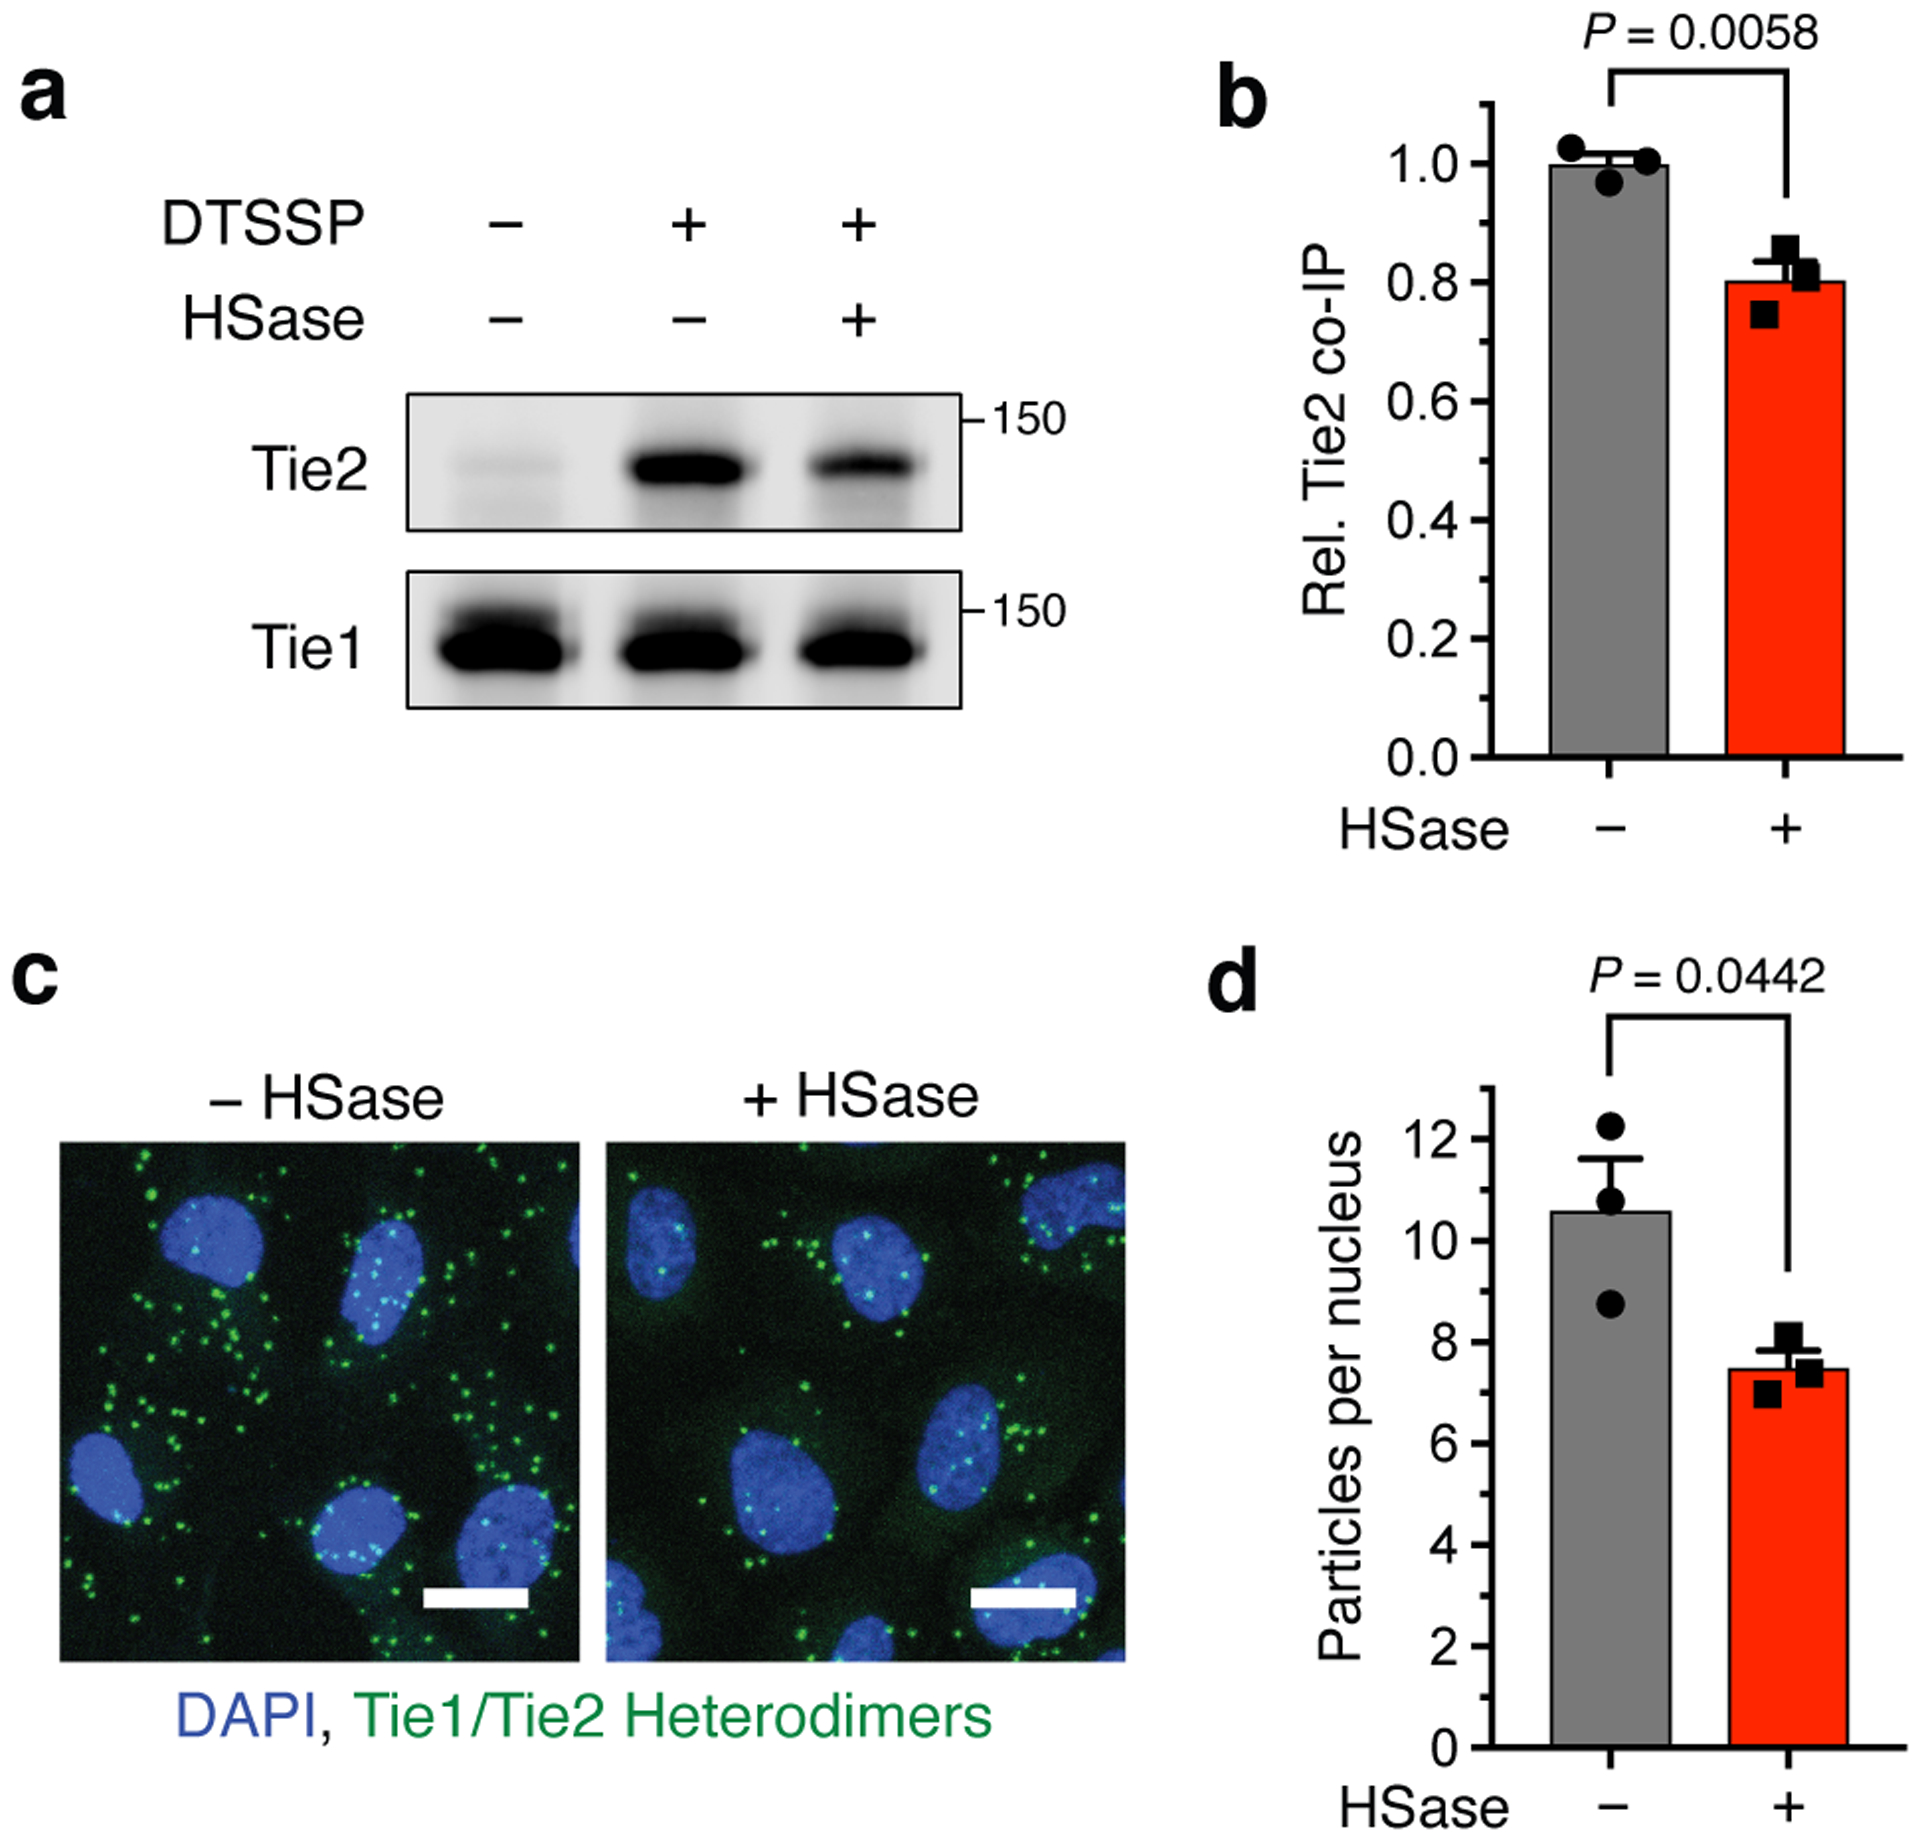
(a) Representative Western blots and (b) quantification of Tie2 co-immunoprecipitation by Tie1 from HUVECs after treatment with or without heparinase (HSase) and chemical crosslinking. Co-immunoprecipitated Tie2 values were normalized to the corresponding Tie1 levels and are reported relative to the non-HSase-treated control. Data represent mean ± s.e.m., n = 3 biologically independent samples, unpaired, two-tailed Student’s t test. (c) Representative images and (d) quantification of Tie1/Tie2 heterodimers (green) revealed by proximity ligation assay from HUVECs with and without HSase treatment, scale bar = 20 μm. Nuclear staining by DAPI is shown in blue. Data represent mean ± s.e.m., n = 3 biologically independent samples, unpaired, two-tailed Student’s t test.
HS-Tie1 promotes pathway activation and vascularization
Lastly, we assessed the functional importance of the HS-Tie1 interaction in vivo. As complete knockout of either Tie1 or HS GAGs results in embryonic lethality in mice and disrupts multiple aspects of their function,12,22,23 we utilized CRISPR/Cas9 technology to selectively disrupt the HS-Tie1 interaction in mice. Briefly, homology-directed recombination with a double-stranded DNA donor template was used to mutate R38 and R82 in the endogenous Tie1 gene to alanine (Fig. 6a, Extended Data Fig. 8a). We also included silent mutations to remove the NGG protospacer adjacent motif and introduce restriction enzyme sites for facile genotyping (Extended Data Fig. 8b). The resulting Tie1-2A allele exhibited Mendelian inheritance (χ2 = 0.87, P > 0.5). When heterozygous mice were crossed, mice homozygous for the Tie1-2A allele did not show embryonic lethality as observed for Tie1 knockout animals. No obvious difference in gross phenotype was observed between homozygous mutant mice and their wild-type littermates, although a slight decrease in overall weight was observed in adult homozygous mutant mice (Extended Data Fig. 8c).
Figure 6. Ablation of the HS-Tie1 interaction in vivo causes aberrant retinal vascularization and loss of endothelial pro-survival signaling.
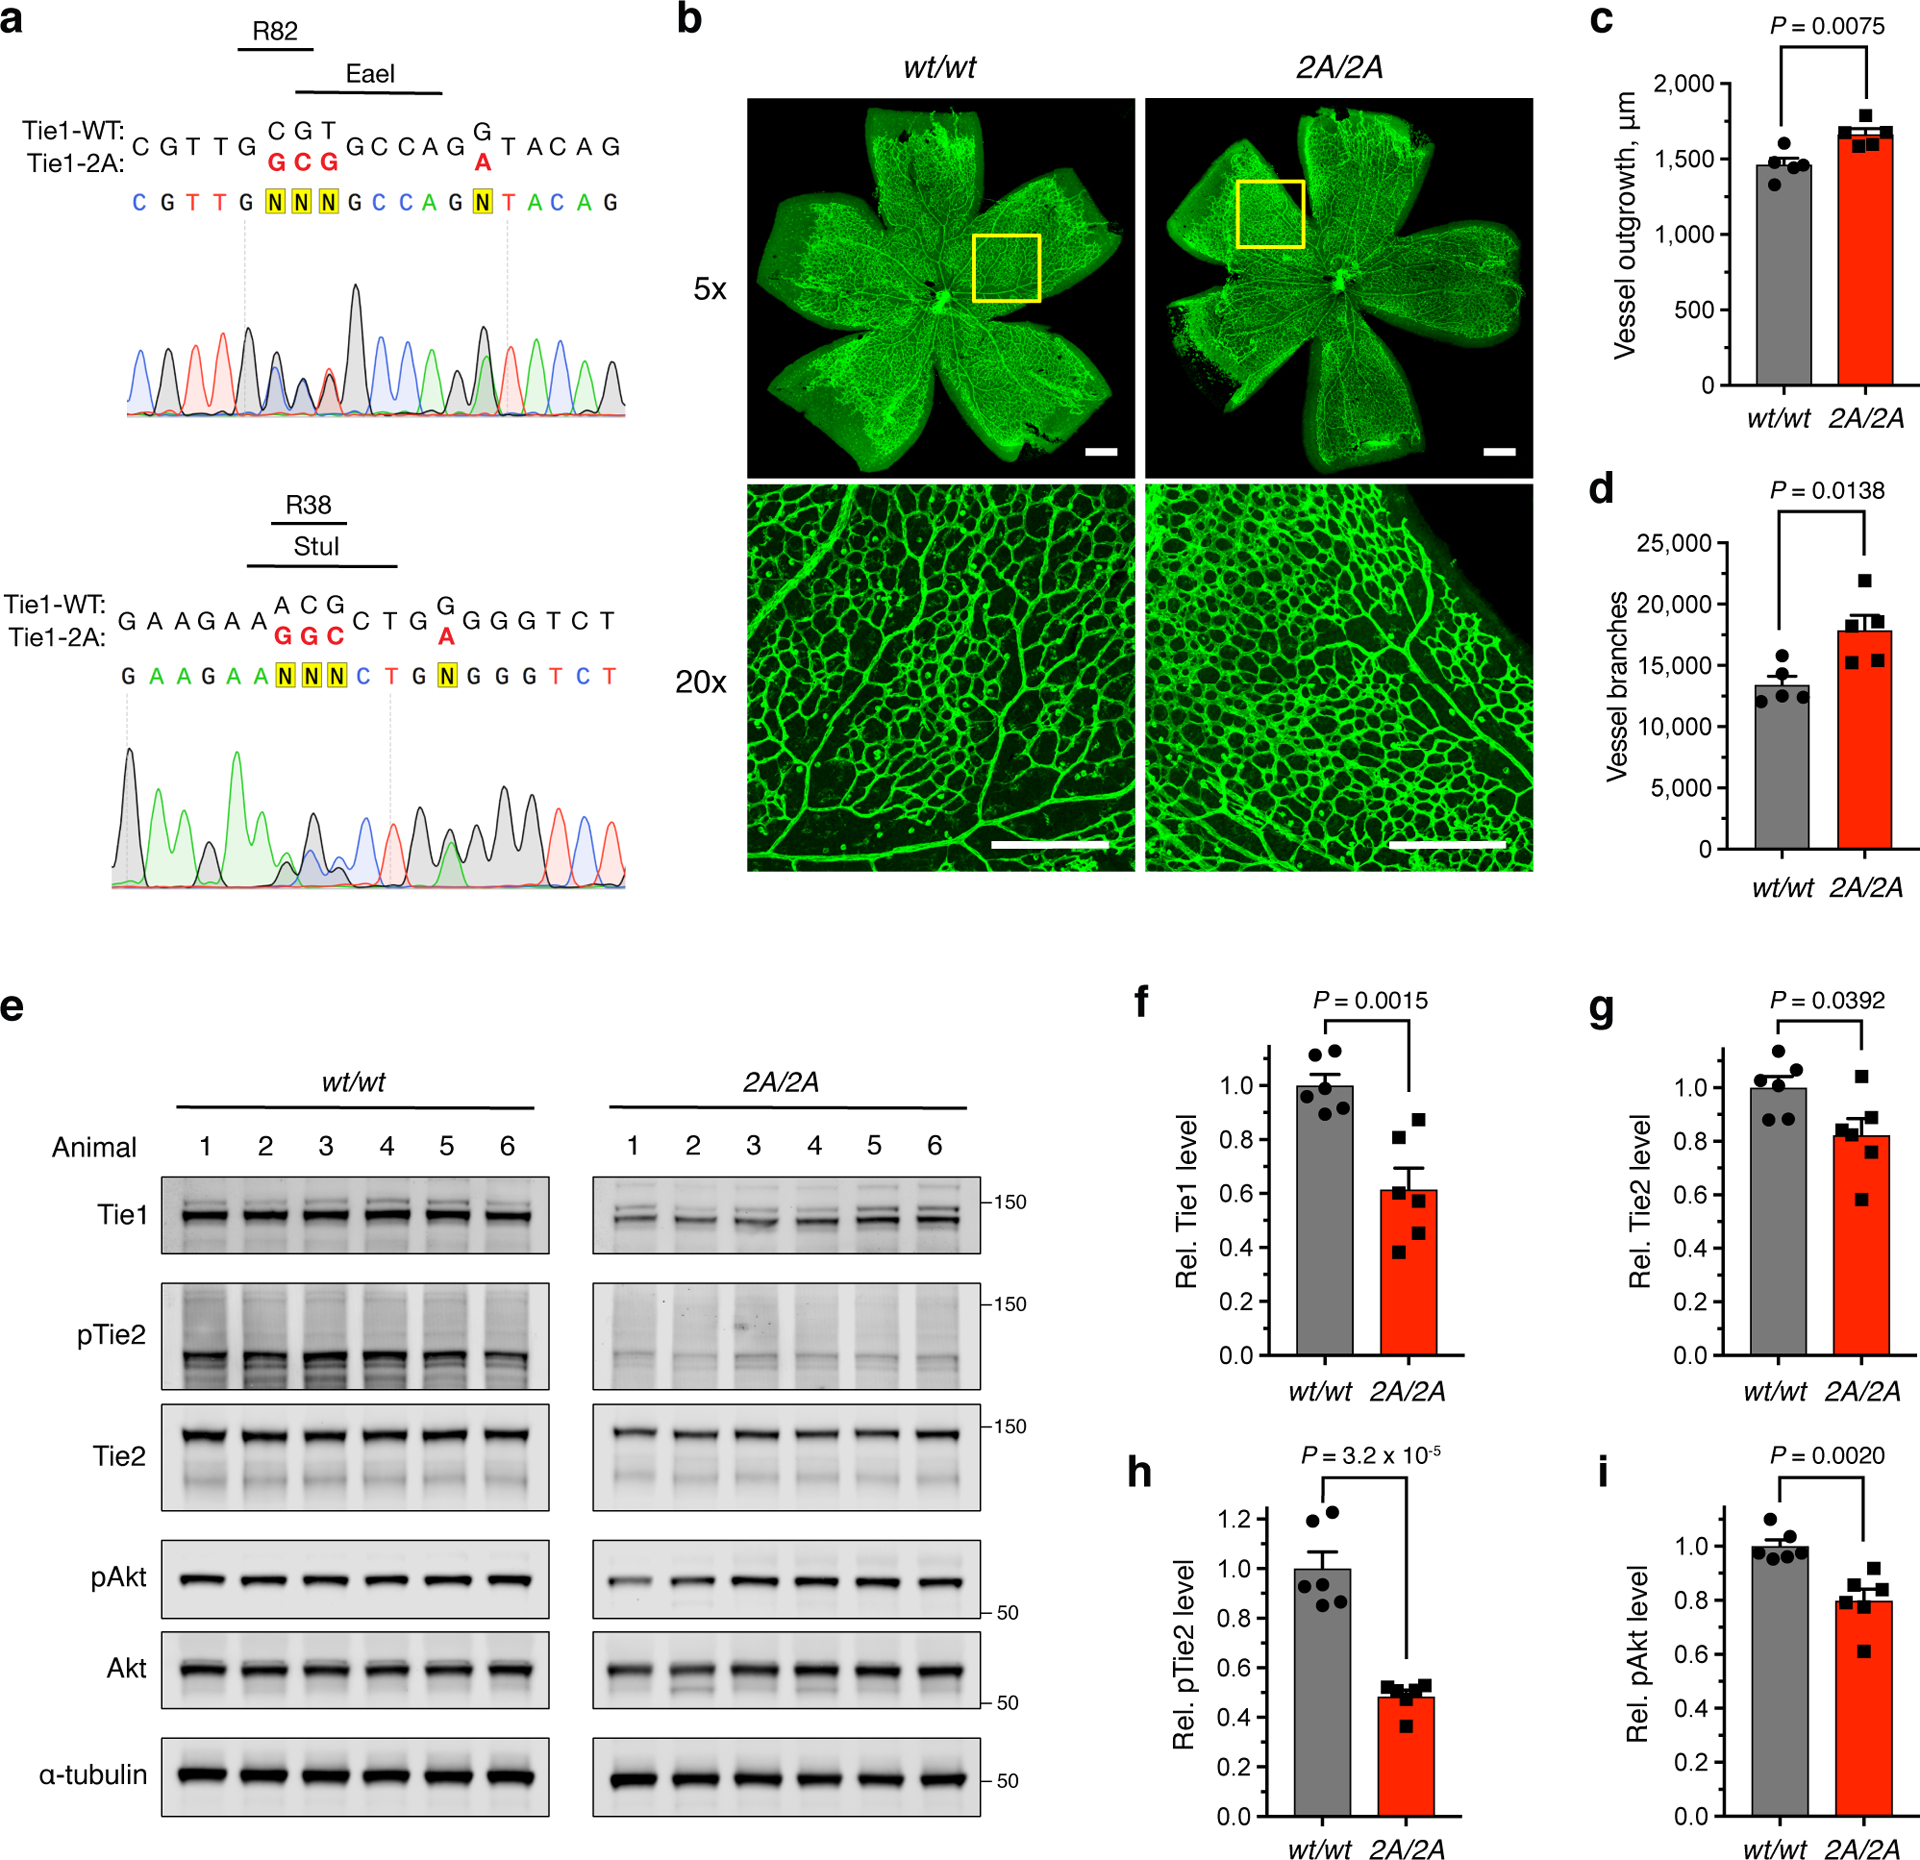
(a) Sequencing results from a heterozygous Tie12A/wt mouse. Mutated nucleobases are shown in red with the mutated amino acid residues, newly generated restriction enzyme sites, and removed NGG protospacer adjacent motifs displayed above the sequence. (b) Representative images and (c,d) quantification of retinal blood vessel radial outgrowth and vessel branching from 7-day-old Tie1-2A and wild-type littermates using the endothelial-specific isolectin GS-IB4 (green), scale bar = 200 μm, n = 5 retina per genotype. (e) Western blotting and (f-i) quantification of total protein and phosphoprotein levels within the Ang/Tie pathway using lung tissue samples from Tie12A/2A and wild-type 4-month-old littermates, n = 6 animals per genotype. All protein levels are normalized to the corresponding ɑ-tubulin loading control, and all phosphoprotein levels are normalized to the corresponding total protein level. Proteins were imaged on the same blot to allow for direct comparison between samples. Data are reported relative to the wild-type control. All data represent mean ± s.e.m., unpaired, two-tailed Student’s t test.
To examine whether loss of the HS-Tie1 interaction in vivo led to alterations in the blood vasculature, we investigated postnatal retinal vascularization.29 Retinas from postnatal day 7 pups were fluorescently labeled with the endothelial-specific isolectin GS-IB4, and the distance that blood vessels grew from the optic disk was quantified. We found that retinas from the Tie1-2A animals displayed increases in radial outgrowth, vessel area, and branching (Figs. 6b–d, Extended Data Figs. 8d,e), indicating that loss of HS-Tie1 binding had perturbed vascularization of the retina.
As Tie1 is highly expressed in the vascularized tissue of the lungs throughout development and into adulthood,41 we also examined adult lung tissue for differences induced by loss of the HS-Tie1 interaction in vivo. We observed a robust decrease in Tie1 protein expression levels in adult Tie1-2A mice relative to the WT animals (38.5 ± 7.9%; Fig. 6e,f), indicating that the HS-Tie1 interaction may be necessary for stable expression of Tie1 in vivo. Notably, no differences in Tie1-WT and Tie1-2A protein levels were detected upon heterologous expression in cultured cells (Extended Data Fig. 6e and Supplementary Fig. 3), suggesting that the observed decrease in vivo was not caused by the misfolding or inherent instability of Tie1-2A. The Tie1-2A mice also exhibited a decrease in Tie2 protein expression levels (18.7 ± 6.2%; Fig. 6g) and a substantial decrease in Tie2 phosphorylation levels relative to the WT mice (51.6 ± 2.5%; Fig. 6h). Moreover, we detected a reduction of basal Akt phosphorylation levels in lung tissue from mutant mice compared to the WT mice (19.1 ± 4.3%; Fig. 6i), indicative of a decrease in downstream signaling through Tie2. Although decreases in Akt phosphorylation could result from changes in both endothelial and non-endothelial tissues, non-endothelial Akt is not expected to be affected by the Tie1-2A mutation as Tie1 and Tie2 are endothelial-specific proteins20,21 and have not been reported to modulate Akt signaling outside of endothelial tissue. The reduction was specific to the Tie2-Akt signaling pathway, as levels of phospho-Erk1/2 remained unchanged between the genotypes (Extended Data Fig. 9). Together, these results provide strong evidence for an overall decrease in Ang/Tie pathway activation and pro-survival signaling in Tie1-2A mice.
Discussion
In this work, we demonstrate that HS GAGs are key regulators of the Ang/Tie signaling axis. Our studies indicate that HS GAGs bind to Ang1 and Ang4 with nanomolar affinity and form active ternary HS-Ang-Tie2 complexes (Extended Data Fig. 10a). Additionally, we discovered that HS GAGs directly interact with Tie1 receptors and stabilize Tie1-Tie2 heterodimer formation (Extended Data Fig. 10b). Through these dual mechanisms, HS GAGs potentiate Ang/Tie pathway signaling, revealing new modes of Ang/Tie pathway regulation.
Our work highlights a common mechanism employed by GAGs to direct cellular signaling. HS GAGs have been previously shown to recruit numerous soluble vascular growth factors to the cell surface, including VEGF165,4,15 FGF2,5,16 and PDGF-BB.18 The assembly of activated HS-ligand-receptor complexes has also been implicated in the rheostatic regulation of these RTK signaling pathways during sprouting angiogenesis.16,18,36 Thus, our work extends a conserved process of ligand and receptor recruitment by GAGs to a new signaling pathway involved in later stages of vascular development.
Since its discovery over 25 years ago, Tie1 has been known as an orphan receptor.25 Although originally described as an inhibitor of Tie2 activation,26 Tie1 has recently been suggested to have a complex regulatory role. Upon its induction in endothelial stalk cells, Tie1 has been found to sustain pro-survival signaling by sequestering Tie2.29 Our results suggest that the amount and sulfation pattern of cell-surface HS GAGs modulates Tie1-Tie2 heterodimerization and the sequestered Tie2 population, thus providing a means to prolong Tie2 signaling.
Tie1-Tie2 heterodimer formation has been reported to occur at two distinct protein interfaces: (1) the multidomain N-terminal regions27 and (2) the third FN3 domains of Tie1 and Tie2.28 We found that HS binds to an electropositive region in the first Ig-like domain of Tie1, adjacent to the N-terminal region interface. The proximity of the HS binding site to one of the two Tie1-Tie2 interfaces may account for the ability of HS to modulate Tie1-Tie2 interactions. The phenotypes observed in the Tie1-2A mice are consistent with the notion that HS GAGs provide an additional level of control over the context-specific activity of Tie1. Interestingly, the Tie1-2A mice survived to adulthood in contrast to the embryonic lethality of Tie1 knockout mice,22,23 and they exhibited milder defects in retinal angiogenesis than those reported for complete Tie1 and/or Tie2 knockouts.29,31 Given that loss of the HS-Tie1 interaction only partially affected Tie1-Tie2 heterodimerization, it is not unexpected that the Tie1-2A mutation produced milder phenotypes overall. Indeed, incomplete Tie1 knockout of up to 85% was previously reported to cause no significant retinal phenotypes,31 consistent with the milder phenotypes of the Tie1-2A mice and suggesting that compensatory effects likely exist to ameliorate vascular defects in vivo. Additionally, we observed an increase in vascularization, in contrast to the hypovascularization reported upon complete Tie1 knockout.29,31 This finding reinforces previous studies showing that Tie1 both positively and negatively regulates Tie2 signaling in a context-specific manner and indicates that loss of HS-Tie1 binding disrupts the balance of Tie2 signaling differently from complete Tie1 knockout. Taken together, our studies suggest that HS functions as a rheostat to tune signaling through the Ang/Tie pathway and balance new vessel growth with vascular maturation and homeostasis.
The discovery that HS GAGs bind to the Tie1 receptor highlights an alternative mechanism that has only recently emerged for the regulation of cellular signaling by GAGs. The ability of GAGs to engage cell-surface receptors directly and control downstream signaling, independent of the canonical ligands, is exemplified by the receptor protein tyrosine phosphatase PTPσ, whose interaction with CS or HS GAGs inhibits or stimulates neuronal growth, respectively.33,42 GAGs have also been demonstrated to bind cell-surface receptors that indirectly modulate signaling, such as VEGFR137,43 and neuropilin-1.44 Our observation that the HS-Tie1 interaction affects Tie1-Tie2 heterodimerization and downstream signaling indicates that HS binding to cell-surface receptors can modulate signal transduction by altering the populations of receptor complexes. More broadly, these results reveal diverse mechanisms by which GAGs orchestrate signaling events at the cell surface beyond simple ligand recruitment.
Exciting questions remain regarding the assembly and overall structure of these newly discovered complexes. The exact structural organization of these and other GAG-ligand-receptor complexes remains elusive (Supplementary Fig. 4a). With the exception of the HS-FGF-FGFR complex,16,17 structures of GAG-ligand-receptor complexes have not been solved. Nonetheless, our results suggest that the HS-Ang-Tie complex may resemble the HS-VEGF-VEGFR2 complex, wherein HS is predicted to interact primarily with the ligand (Supplementary Fig. 4b).37 Similar to our biochemical observations, the VEGFR2 receptor was shown not to bind immobilized HS, but VEGFR2 could be recruited to HS in the presence of VEGF.37 However, it is possible that weak interactions between HS and Tie2 receptors may exist but were not detected because our ELISA and microarray techniques utilize stringent wash conditions to minimize nonspecific binding. As such, the HS-Ang-Tie2 complex may also share similarities with the HS-FGF2-FGFR1 complex (Supplementary Fig. 4c).16,17 In this complex, HS binds within a groove that spans both the ligand and receptor and engages in contacts with both proteins (Supplementary Fig. 4d), although studies have shown that HS binds to FGF2 with much greater affinity than FGFR1.45 In addition to studying the ternary complex, it will be interesting to determine whether HS chains participate in higher-order receptor clustering, which has been implicated in signal transduction through RTKs such as Tie2.28 Future studies using cryo-electron microscopy or super-resolution microscopy may help to illuminate the roles of HS in RTK signalosome assembly at the cell surface.
Despite accruing evidence that GAGs mediate many signal transduction events, their precise roles are only beginning to be understood due to the challenges of identifying and studying GAG-protein interactions. Here, we have developed an integrated chemical biology-based platform to discover novel GAG-protein interactions and elucidate their complex functions. The rapid screening and characterization of GAG-protein interactions using GAG microarrays, ELISA-based assays, and SPR, combined with computational modeling and mutagenesis to identify the binding interface, enables investigations into the function of the interaction. The development of glycan engineering techniques46 allows for dissection of GAG function through the installation of defined carbohydrate structures at the cell surface, providing a much-needed, gain-of-function approach to complement traditional, loss-of-function techniques involving degradative enzymes or genetic knockout. With CRISPR/Cas9 technologies, the role of specific GAG-protein interactions can now be directly interrogated in vivo. To our knowledge, the Tie1-2A mouse model is the first example where an individual glycan-protein interaction has been selectively disrupted in vivo. Perturbing a specific glycan-protein interaction using the approach herein effectively revealed the precise contributions of the glycan to pathway regulation and diverged from the phenotypes of total protein knockouts. This general strategy will advance a fundamental understanding of the regulatory roles of GAGs and other carbohydrates in vivo, particularly in complex systems that cannot be recapitulated in vitro or using complete gene deletions.
In conclusion, we have demonstrated that sulfated GAGs regulate vascular function via the Ang/Tie RTK pathway through both direct ligand and receptor engagement. By recruitment of Ang1/4 and Tie1 stabilization, our results illustrate novel mechanisms underlying the multifaceted regulation of cellular signaling and vascular physiology by HS GAGs. Given the emerging roles of the Ang/Tie RTK pathway in numerous vascular abnormalities during cancer, sepsis, and diabetes, our findings may provide novel approaches to target this pathway and ameliorate disease-associated vascular defects.
Online Methods
Materials.
All chemicals were obtained from MilliporeSigma unless otherwise noted. All reagents used for molecular biology were obtained from New England Biolabs unless otherwise noted. All primers were obtained from Integrated DNA Technologies. Recombinant proteins were purchased from R&D Systems and resuspended according to the manufacturer’s specifications. TriS-HS natural heparin/HS polysaccharides were purchased from Neoparin and Amsbio as clinical grade preparations. The triS-HS polysaccharide is >70% enriched in the trisulfated 2-O-, 6-O-, and N-sulfation motif. All desulfated HS polysaccharides were commercially produced by chemical desulfation of triS-HS and were obtained from Neoparin. N-desulfated, N-acetylated HS was obtained from Millipore Sigma. The average molecular weight of all heparin/HS molecules is approximately 15 kDa (~20–25 disaccharide units). CS-E-enriched polysaccharides isolated from squid cartilage were purchased from Seikagaku. The polysaccharides contain ~60% of the disulfated 4-O- and 6-O-sulfation motif and have an average molecular weight of approximately 70 kDa (~110–120 disaccharide units). Primary antibodies were obtained from Cell Signaling Technology, R&D Systems, or Millipore Sigma unless otherwise noted. All cell culture reagents and secondary antibodies were obtained from ThermoFisher Scientific unless otherwise noted. The HEK-293T (CRL-3216) and EA.hy926 (CRL-2922) cell lines, as well as primary pooled HUVECs (PCS-100-013), were obtained from American Type Culture Collection and used as received. B6SJL-F1/J (100012) and C57BL/6J (000664) mice were obtained from The Jackson Laboratory.
Molecular biology.
All miniprep, maxiprep, and gel extraction steps were conducted using Zymogen kits (Genesee Scientific). Cloning was performed using the NEBuilder HiFi Cloning Master Mix (New England Biolabs) unless otherwise noted. Human Tie1 cDNA was obtained from pDONR223-TIE1 plasmid (23946, Addgene). The Tie1 extracellular domain excluding the native secretion signal (A21 to Q759) was cloned into a pcDNA3.1 vector (ThermoFisher Scientific) containing an N-terminal Ig κ-leader sequence and C-terminal human IgG1 Fc and 6xHis tags. Truncation (Tie1-N: A21 to S431) and site mutation (Tie1-2A, Tie1-6A) constructs were generated using the Q5 site-directed mutagenesis kit (New England Biolabs). The transmembrane HTP construct was produced as previously described.35 To obtain the lentiviral construct, the HTP sequence was first cloned into the pENTR4 vector (17424, Addgene) and then transferred into the pLenti-CMV-Blast vector (17451, Addgene) using the Gateway LR Clonase kit (ThermoFisher Scientific). The vectors pCAG-EGxxFP (50716, Addgene) and pX459 (62988, Addgene) were used to test gRNA sequences.
Cell culture.
EA.hy926 and HEK-293T cells were cultured in DMEM with 10% fetal bovine serum (FBS) and 1x penicillin/streptomycin (P/S) (referred to hereafter as complete DMEM). HUVECs were cultured using endothelial cell basal medium (EBM-2, Lonza) with the EGM-2 Bulletkit additives (Lonza) and were used for experiments between 0 and 5 passages. For serum starvation, EA.hy926 cells were cultured in DMEM with 0.5% FBS and 1x P/S. Cells were generally grown on plastic, tissue culture treated plates (Sarstedt) without any coating. For experiments, HUVECs or EA.hy926 cells were plated onto plastic dishes, glass-bottom 96-well plates, or μ-Slide VI 0.5 glass bottom channel slides (80607, ibidi) precoated with 5 μg/cm2 of bovine fibronectin (MilliporeSigma) and 10 μg/cm2 of rat tail collagen type I (MilliporeSigma). Plates were coated by incubation with proteins dissolved in sterile PBS for 1 h at 37 °C, followed by two rinses with sterile PBS, and were used immediately.
Western blotting.
Protein samples were diluted with one-fourth volume of 4x sodium dodecyl sulfate-polyacrylamide gel electrophoresis (SDS-PAGE) loading buffer (200 mM Tris pH 6.8, 400 mM DTT, 8% SDS, 40% glycerol, 0.4% bromophenol blue) and heated to 95 °C for 10 min. Samples were then loaded onto NuPAGE 4–12% Bis-Tris protein gels (NP0355BOX, ThermoFisher Scientific) and resolved using 180 V at RT for 1 h. The molecular weight of protein targets was estimated using Precision Plus Protein Dual Color Standards (Bio-Rad). Gels were transferred onto Immobilion-FL PVDF membrane (IPFL00010, EMD Millipore) using 250 mA at 4 °C for 1–1.5 h. Membranes were then blocked for 1 h at RT with either 5% BSA in TBST (50 mM Tris pH 7.4, 150 mM NaCl, 0.1% Tween) for phosphoprotein detection, 1:1 mixture of LI-COR blocking buffer (LI-COR Biosciences) and TBS for goat primary antibodies, or 5% nonfat milk in TBST, depending on the manufacturer’s specifications. Primary antibodies used for Western blotting, dilutions, and commercial sources are as follows: Rb anti-His-tag (1:1,000, 12698S, Cell Signaling Technology), Gt anti-Tie2 (1:200, AF313, R&D Systems), Gt anti-Tie1 (1:200, AF619, R&D Systems), Rb anti-Tie1 (1:1000, 23111S, Cell Signaling Technology), Rb anti-phospho-Tie2 (1:200, AF2720, R&D Systems), Rb anti-phospho-Akt (1:1,000, 9275S, Cell Signaling Technology), Ms anti-Akt (1:1,000, 9275S, Cell Signaling Technology), Ms anti-ɑ-tubulin (1:2,000, T9026, Millipore Sigma), Rb anti-phospho-p44/42 MAPK/Erk1/2 (1:1,000, 9101S, Cell Signaling Technology), and Ms anti-p44/42 MAPK/Erk1/2 (1:1,000, 4696S, Cell Signaling Technology). Primary antibodies were diluted in the same buffer as the blocking step and incubated at 4 °C overnight with gentle rocking. Blots were rinsed three times with TBST prior to incubation with secondary antibodies. For all Western blots, highly cross-adsorbed Gt anti-Ms, Gt anti-Rb, or Dk anti-Gt secondary antibodies conjugated to Alexa Fluor 680 or Alexa Fluor 790 (ThermoFisher Scientific) were used at 1:10,000 (0.2 μg/mL) in the same buffer as the blocking step with incubation at RT for 1 h with gentle rocking. Blots were then washed three times for 5 min with TBST prior to imaging with the LI-COR Odyssey CLx. Data acquisition and quantification was performed using ImageStudio Software (Ver. 5.2.5, LI-COR). If necessary, blots were stripped using NewBlot PVDF Stripping Buffer (LI-COR) according to the manufacturer’s protocol.
Protein expression and purification.
For each protein construct, five 15-cm plates of 90% confluent HEK-293T cells in 20 mL of complete DMEM were transfected with 20–30 μg of Tie1-WT, Tie1-N, Tie1-6A, or Tie1-2A plasmids using poly(ethyleneimine) (PEI, 23966-2, Polysciences, Inc.). Briefly, DNA was diluted in 2 mL of pre-warmed, serum-free DMEM, and PEI (1 mg/mL in sterile ddH2O) was added dropwise with vigorous shaking at a 3:1 w/w PEI/DNA ratio. DNA/PEI complexes were allowed to form for 20 min at RT and then added dropwise to each plate. After 24 h, the medium in each plate was replaced with DMEM containing 2% FBS, 1x P/S, and 0.5x cOmplete protease inhibitor cocktail without ETDA (PIC, 11697498001, MilliporeSigma). At 3 d post-transfection, the medium was harvested and centrifuged to remove cell debris. A new 20-mL aliquot of DMEM, 2% FBS, 1x P/S was added, which was harvested 2 d later, centrifuged, and combined with the first aliquot. The solution pH was adjusted to 8.0 using 2 M Tris (pH unadjusted), and the collected medium was rotated end-over-end for 2 h at 4 °C with 500 μL of Ni-NTA resin (30230, Qiagen) that had been prerinsed twice with PBS. The resin was separated from the medium by centrifugation and loaded onto a disposable Poly-Prep chromatography column (Bio-Rad). The resin was washed with 10 mL of phosphate wash buffer (100 mM sodium phosphate pH 7.4, 300 mM NaCl, 10 mM imidazole), and protein was eluted with two 1-mL aliquots of elution buffer (50 mM sodium phosphate pH 7.4, 150 mM NaCl, 250 mM imidazole). Elution samples were combined and the buffer exchanged by centrifugation with PBS. Samples were stored at 4 °C for up to one week or flash-frozen and stored at −20 °C. Multiple attempts using this protocol to express N-terminal truncation constructs were unsuccessful, producing low to undetectable amounts of protein by Western blot analysis.
Carbohydrate enzyme-linked immunosorbent assays.
Biotinylation of CS-E, HS and chemically desulfated HS polysaccharides was conducted as previously described.33 ELISAs were generally performed using commercially available Ang1-His6, Ang2- His6, Ang4-His6, Tie1-Fc, and Tie2-Fc conjugates (R&D Systems). For ELISAs of truncated or mutant Tie1 constructs, all proteins used in the experiments were overexpressed and purified from mammalian cells as described above. Wells of copper-coated (Ang1-4) or Protein A/G-coated (Tie1/2) 8-well strips (ThermoFisher Scientific) were rinsed twice with 200 μL of PBST (PBS + 0.02% Tween-20) and then incubated with 100 μL of 10 μg/mL protein of interest in PBS containing 1% bovine serum albumin (BSA, Fisher Scientific) for 1 h at RT with gentle rocking. Wells were rinsed three times with PBST and then blocked with 200 μL of 5% BSA in PBS for 1 h at RT. During this incubation step, a dilution series of biotinylated CS-E or HS was separately prepared in PBS. Wells were again rinsed three times with PBST, and 50 μL of each GAG-containing solution was added to the wells. For experiments to detect the GAG-Ang-Tie2 ternary complex, Ang1 or Ang4 (10 μg/mL) was also added at this step. Wells were incubated with GAG-containing solutions for 3 h at RT with gentle rocking, then rinsed four times with PBST, and incubated with 100 μL of HRP-conjugated streptavidin (1:15,000 in PBST, ThermoFisher Scientific) for 1 h at RT with gentle rocking. Wells were again rinsed four times with PBST and then incubated with 100 μL of development solution (R&D Systems) for 15 min at RT in the dark. Reactions were quenched by the addition of 100 μL of 2 N aqueous H2SO4, and the absorbance was read at 450 nm. Assays were performed in duplicate for each concentration, and data were collected using a FlexStation 3 (Molecular Devices) operated with SoftMax Pro acquisition and analysis software (Ver. 5, Molecular Devices). Values were reported as the average ± s.e.m. KD,app values were calculated with Prism 7 (GraphPad) using the nonlinear curve fitting of specific binding with Hill slope function. 95% confidence intervals for the derived KD,app values were calculated as asymmetrical values by Prism 7. For experiments with overexpressed, purified proteins, protein concentrations were first normalized using the bicinchoninic acid (BCA) assay (ThermoFisher Scientific) and then used as described above.
GAG microarrays.
GAG microarrays were generated and used as previously described.34 Briefly, slides were blocked with 10% FBS in PBS for 1 h at RT. Stock solutions of Tie1-Fc, Tie2-Fc, Ang1, and Ang4 (2 μM) were prepared in PBS containing 1% BSA. Blocked slides were washed once with PBS and slowly rocked with 150 μL of 1% BSA in PBS containing 1 μM Tie1-Fc for 2 h at RT. For ternary complex formation, 150 μL of 1% BSA in PBS containing 1 μM Tie2-Fc with or without 1 μM ligand (i.e., 1 μM Tie2-Fc ± 1 μM Ang1; 1 μM Tie2-Fc ± 1 μM Ang4) were used immediately without prior incubation. Slides were washed three times with PBS and incubated with 1:5,000 Alexa Fluor 647-conjugated Gt anti-human Fc antibody (109-605-098, Jackson ImmunoResearch Laboratories) in 1% BSA in PBS for 1 h at RT in the dark with gentle rocking. Slides were then washed three times with PBS and twice with ddH2O and blown dry under a stream of filtered air. Arrays were scanned using a G2565BA DNA Microarray Scanner (Agilent), and fluorescence was measured and quantified using GenePix software (Ver. 5.0, Molecular Devices) with normalization against local background. Data processing was conducted using Microsoft Excel for Mac (Ver. 16.16.2). The data represent the average of 10 spots per concentration of polysaccharide.
Surface plasmon resonance.
All experiments were conducted using a Biacore T200 instrument (GE Healthcare). A CM5 sensor chip (GE Healthcare) was first functionalized with streptavidin using the manufacturer’s amine coupling protocol. Briefly, all flow cells of a CM5 sensor chip were incubated at a flow rate of 10 μL/min with a 1:1 molar ratio of N-hydroxysuccinimide and 1-ethyl-3-(3-dimethylaminopropyl)carbodiimide for 3 min, followed by 1 μM of streptavidin in 0.01 NaOAc pH 5.0 until the response rate leveled off (saturating the flow cell surface). Remaining reactive groups were quenched with ethanolamine. Solutions of biotinylated CS-E or HS were then each flowed over one of the four flow cells (CS-E: flow cell 2; HS: flow cell 4) at a flow rate of 10 μL/min to provide a response value of roughly 25 RU. As a control, an antibody specific to CS-E33,47 was flowed over the CS-E-containing flow cell and corresponding control cell at a flow rate of 20 μL/min to ensure successful loading of biotinylated GAG. To test binding of Tie1-Fc to the biotinylated GAGs, a two-fold dilution series of Tie1-Fc (starting at 100 nM) was produced and flowed over the flow cells for 300 s at a rate of 20 μL/min. Dissociation of Tie1-Fc was then monitored for 350 s using the same flow rate. Between each run, the surface was regenerated using 2.5 M MgCl2 at a flow rate of 30 μL/min. Response values are reported after subtraction of the control (-GAG) cell. Data were collected by and the resulting curves were fit to the 1:1 Langmuir binding model equation using Biacore T200 evaluation software (v. 1, GE Healthcare). Although the naturally-derived polysaccharides may have multiple, heterogeneous binding sites, the simple 1:1 binding model was conservatively chosen to avoid overfitting the data with a multivalent regression model. 95% confidence intervals were estimated as the mean ± 1.96 × (s.e.m.).
Heparin affinity chromatography.
Heparin sepharose (Abcam) was loaded into a Poly-Prep column (Bio-Rad) with a bed volume of 0.5 mL and equilibrated with loading buffer (10 mM HEPES pH 7.0, 0.1 M NaCl). Protein (1 μg) was loaded onto the column, and the column was washed twice with 0.5 mL of loading buffer. Protein was then eluted in 0.5-mL fractions using a stepwise gradient of increasing NaCl concentration in 10 mM HEPES pH 7.0. Fractions were desalted and concentrated by buffer exchange into PBS using 3-kDa MWCO Amicon filters. Samples were processed by Western blotting for Tie1 as described above.
Isoelectric point calculation.
The isoelectric point (pI) of proteins was calculated by inputting the FASTA sequence of the protein of interest without the signal peptide into the protein isoelectric point calculator (isoelectric.org), which aggregates and averages 15 different pI predictive algorithms.
Tie1 cell-surface binding.
HUVECs were plated onto precoated 96-well glass bottom plates at 50,000 cells per well in EGM-2 and grown overnight at 37 °C. Cells were rinsed once with PBS and then incubated for 3 h at 37 °C in the presence or absence of 0.5 U/mL heparinase I/III (MilliporeSigma) in serum-starved DMEM (0.5% FBS). Cells were rinsed once with ice-cold PBS and then fixed with 4% paraformaldehyde in PBS for 20 min at RT. Cells were rinsed three times with PBS and then blocked with 2% BSA and 10% normal goat serum (16210064, ThermoFisher Scientific) in PBS for 1 h at RT. Cells were incubated overnight at 4 °C with 1:400 Ms anti-HS (clone F58-10E4, 370255-S, Amsbio LLC) and 10 μg/mL of recombinant Tie1-WT or Tie1-2A in 1% BSA in PBS. Cells were then washed for 5 min three times with PBS and incubated with 1:1,000 Alexa Fluor 488-conjugated Gt anti-Ms IgG (A-11001, ThermoFisher Scientific), 1:1,000 Alexa Fluor 647-conjugated Gt anti-human Fc (109-605-098, Jackson ImmunoResearch Laboratories), and 1 μg/mL of DAPI (D9542, MilliporeSigma) in 1% BSA in PBS for 1 h at RT in the dark. Cells were rinsed three times with PBS and then visualized using an LSM 700 confocal microscope (Carl Zeiss) with a Plan-Apochromat 10x/0.45 M27 objective using ZEN software (Ver. 8.1, Carl Zeiss). For acquisition of xz- and yz-plane cell sections, samples were imaged using a Plan-Apochromat 63x/1.4 oil immersion objective, and z-stacks were acquired with a slice distance of 0.335 μm. Images were acquired in ZEN software and processed in FIJI/ImageJ and deconvoluted using Diffraction PSF 3D and Iterative Deconvolve 3D plugins.
Structural modeling.
The Tie1 homology model was constructed using the program SWISS-MODEL (accessed May 2016, https://swissmodel.expasy.org/)48 with human Tie2 ligand-binding domain (PDB ID 2GY5)40 as a template and the sequence of human Tie1 (UniProt ID P35590). The Tie1 homology model was briefly minimized in vacuum using the DREIDING force field (Ver. May 2016)49 to reduce steric clashes built into the model. Preparation of the carbohydrate structure and docking experiments were conducted using the GAG-Dock method with MPsim (Ver. May 2016) for molecular modeling and SCREAM (Ver. May 2016) for side chain optimization as previously described.39
Cell-surface crosslinking.
Detection of Tie1/Tie2 heterodimers by chemical crosslinking and immunoprecipitation was adapted from a previous protocol.26 HUVECs were gently trypsinized for 5 min at 37 °C with TrypLE Express (12604-013, ThermoFisher Scientific) and resuspended in PBS and pelleted at 1,000 × g twice. Cells were then resuspended in serum-starved DMEM in the presence or absence of 1 U/mL of heparinase I/III for 2 h at 37 °C with gentle mixing every 15 min. Cells were plated on precoated six-well plates and grown overnight at 37 °C in EGM-2. On the following day, cells were rinsed three times with ice-cold PBS and then incubated with 100 μL of 1 mM DTSSP in PBS (freshly prepared) for 30 min at RT with gentle rocking. Unreacted DTSSP was quenched by addition of 5 μL of 1 M Tris pH 8.0 with incubation for 15 min at RT. The crosslinking solution was then removed, and cells were lysed by scraping with 200 μL of ice-cold Triton lysis buffer (20 mM HEPES pH 7.9, 150 mM NaCl, 1% Triton X-100, 5% glycerol, 1x PIC). Lysates were rotated end-over-end for 10 min at 4 °C and then centrifuged for 10 min at 21,000 × g to remove all insoluble material. The lysates were transferred to new tubes, diluted to 500 μL with Triton lysis buffer, and rotated end-over-end with 1:100 Gt anti-Tie1 (AF619, R&D Systems) overnight at 4 °C. The next day, 20 μL of magnetic Protein A/G beads (ThermoFisher Scientific) prerinsed with HBS (50 mM HEPES pH 7.9, 150 mM NaCl) was added to each sample, and the samples were rotated end-over-end for 1 h at 4 °C. Beads were then washed with 500 μL of HBS, 0.1% Triton X-100 three times for 5 min at 4 °C. After the final wash, all wash buffer was removed, and the beads were resuspended in 30 μL of 1x SDS-PAGE loading buffer + 20 mM DTT (freshly prepared) and heated to 95 °C for 10 min. Samples were processed by Western blotting for Tie1 and Tie2 as described above. The assay was performed in triplicate. As a negative control for nonspecific binding, the co-immunoprecipitation protocol was also carried out without DTSSP treatment for each replicate. Co-immunoprecipitated Tie2 values were normalized to the total immunoprecipitated Tie1 levels and are reported relative to the non-heparinase-treated control. Statistical analysis was performed by Prism 7 using a paired, two-tailed Student’s t test.
Proximity ligation assays.
HUVECs were treated in suspension in the presence or absence of heparinase I/III as described above. Cells were then plated at 50,000 cells per well onto precoated 96-well glass bottom plates and grown overnight at 37 °C with EGM-2. On the following day, cells were washed twice with PBS and fixed with 4% paraformaldehyde in PBS for 20 min at RT. Cells were rinsed three times with PBS and blocked with the DuoLink blocking buffer (MilliporeSigma) for 1 h at RT. After rinsing twice with PBS, cells were incubated overnight at 4 °C with 1:100 Ms anti-Tie1 (MAB619, R&D Systems) and 1:100 Rb anti-Tie2 (H176, Santa Cruz Biotechnology) in 1% BSA in PBS. Cells were then carried through the Duolink labeling protocol scaled to 30 μL reactions per well according to the manufacturer’s protocol (DUO92101, MilliporeSigma). Cells were mounted using DuoLink in situ Mounting Medium with DAPI (MilliporeSigma) and were visualized using an LSM 700 confocal microscope with a Plan-Apochromat 40x/1.4 oil immersion DIC M27 objective and preset filter settings for Texas Red and DAPI using ZEN software. A Z-stack of images was collected for each field of view and combined to form a single maximum intensity projection. Puncta depicted in Fig. 5 are pseudo-colored green for clarity. Nuclei and individual interaction puncta were quantified using FIJI/ImageJ (Ver. 2.0.0-rc-43/1.51w, NIH). The assay was performed in triplicate. Data are reported as absolute values of the average number of puncta per nucleus. Statistical analysis was performed by Prism 7 using an unpaired, two-tailed Student’s t test.
Lentivirus production.
Lentiviruses were produced by co-transfecting two to four 10-cm plates of 90% confluent HEK-293T cells in complete DMEM with the HTP lentiviral plasmid and pLP1, pLP2, and VSV-G packaging plasmids (ThermoFisher Scientific) at 4.3, 6.2, 3.1, and 3.7 μg, respectively, using Lipofectamine 3000 (ThermoFisher Scientific) according to the manufacturer’s protocol. Medium was harvested and replaced with complete DMEM at 24, 48, and 72 h, centrifuged to remove cell debris, and combined. Lentivirus particles were either directly flash frozen and stored at −80 °C or were concentrated by PEG-6000 precipitation as previously described.50 Precipitated lentiviruses were resuspended in complete DMEM, flash frozen, and stored at −80 °C.
Generation and validation of EA.hy926-HTP cell line.
EA.hy926 cells were grown to 80% confluency in a six-well plate with 2 mL of complete DMEM and then treated with 0–20 μL of the concentrated HTP lentivirus stock along with 8 μg/mL of polybrene (MilliporeSigma). After 48 h, cells were split 1:3 into new six-well plates in 2 mL of complete DMEM containing 5 μg/mL of blasticidin (InvivoGen). Medium was changed every 2 d until all cells in the untreated well had died (roughly 1–1.5 weeks). Cells were treated for an additional 3 d with 5 μg/mL of blasticidin, and cells from the well treated with the lowest amount of lentivirus that survived selection were expanded and cryopreserved. To validate expression of HTP, treated and untreated EA.hy926 cells were plated onto precoated 96-well glass bottom plates and grown to confluency. Cells were then treated with 1:1,000 cell-impermeable Alexa Fluor 488-conjugated CL (AF488-CL, G1001, Promega) and 1:1,000 Hoescht 33342 (H3750, ThermoFisher Scientific) in complete DMEM at 37 °C for 15 min. Cells were rinsed three times with FluoroBrite DMEM (A18967, ThermoFisher Scientific), and live-cell imaging was performed using an LSM 700 confocal microscope with a Plan-Apochromat 10x/0.45 M27 objective.
FOXO1 localization assay.
The stimulation, detection, and quantification of FOXO1 nuclear export were adapted from a previous protocol.30 HUVECs were treated in suspension in the presence or absence of heparinase I/III as described above. Cells were then plated on precoated μ-Slide VI 0.5 glass bottom channel slides (80607, ibidi) at 50,000 cells per channel and grown overnight at 37 °C with EGM-2. On the following day, the medium was replaced with serum-starved DMEM for 6 h. Prior to treatment, Ang1 was diluted to 400 ng/mL in serum-starved DMEM in the presence or absence of 20 μg/mL of triS-HS and incubated for 30 min at 37 °C. The Ang1-containing medium was then added to the serum-starved HUVECs. After 15 min at 37 °C, cells were rinsed with ice-cold PBS and fixed with 4% paraformaldehyde in PBS for 20 min at RT. Cells were permeabilized with 0.1% Triton X-100 in PBS for 15 min at RT and blocked with PBS containing 2% BSA and 10% normal goat serum for 1 h at RT. Antibody staining was performed overnight by incubating with 1:100 Rb anti-FOXO1 (2880S, Cell Signaling Technology) in 1% BSA in PBS. Cells was washed for 5 min three times with PBS and then stained with 1:1,000 Alexa Fluor 568-conjugated Gt anti-Rb IgG (A11036, ThermoFisher Scientific) and 1 μg/mL of DAPI in 1% BSA/PBS for 1 h at RT in the dark. Cells were rinsed three times with PBS and then visualized using an LSM 700 confocal microscope with Plan-Apochromat 10x/0.45 M27 and 20x/0.45 M27 objectives. The number of DAPI-stained nuclei (>100 per condition per replicate) was quantified using FIJI/ImageJ (NIH), and FOXO1+ and FOXO1− negative nuclei were counted manually. The assay was performed in triplicate. Data are reported as the percentage of FOXO1− nuclei. Statistical analyses were by Prism 7 performed using a one-way ANOVA with Tukey’s post-hoc test.
Glycan engineering and stimulation assay.
Cell surfaces were engineered with defined HS GAG structures using minor modifications to the published protocol.35 A chlorohexyl linker was attached to the low-abundance glucosamine sugar of tri-HS and de-HS polysaccharides via reductive amination chemistry as reported35 to give triS-HS-CL and deS-HS-CL. EA.hy926-HTP cells were treated in suspension with heparinase I/III as described above. Cells were then plated on precoated six-well plates and grown overnight at 37 °C with complete DMEM. On the following day, the medium was replaced with serum-starved DMEM containing 5 μg/mL of deS-HS-CL or triS-HS-CL. After 2 h, the medium was removed, and cells were treated with serum-starved DMEM for an additional 4 h. Cells were then stimulated with serum-starved DMEM containing 500 ng/mL of Ang1, Ang2, or Ang4 or no ligand for 30 min at 37 °C. Cells were rinsed with ice-cold PBS and then lysed with 200 μL of SDS lysis buffer (50 mM Tris pH 7.6, 150 mM NaCl, 1% SDS, 1x PIC, 1x Phos-STOP (MilliporeSigma)) at RT. Lysates were sonicated for 10 s at 40% intensity to sheer DNA and then centrifuged for 5 min at 21,000 × g to remove any insoluble debris. Lysates were subjected to Western blotting as described above. The assay was performed in triplicate. Phospho-Akt values were normalized to total Akt levels and are reported as the average value normalized to the untreated deS-HS-CL control. Statistical analyses were performed by Prism 7 using a two-way ANOVA with Sidak’s multiple comparisons test.
General animal care and maintenance.
All animal experiments were conducted according to protocols approved by the Caltech Institutional Animal Care and Use Committee. Animals were maintained with no more than five adult animals per cage in small mouse cages with enrichment under 20–26 °C ambient temperature, 30–70% relative humidity, and a 12-h light-dark cycle. General animal maintenance and timed matings were performed by members of the Caltech Office of Laboratory Animal Resources with cage changes performed weekly.
Transgenic Tie1-2A mouse model generation.
Guide RNA sequences were designed using the online CHOPCHOP tool (Ver. 2, https://chopchop.cbu.uib.no/)51 against the Dec. 2011 (GRCm38/mm10) murine genome assembly against regions surrounding the Tie1 R38 and R82 codons. Sequences were selected based on predicted activity and minimal off-target homology. Candidate gRNA sequences were assayed as previously described.52 Two gRNAs were selected to target R38 (CGCAGGTCAGGAAGAAACGC) and R82 (GGTGAGAACCGTTGCGTGCC) and purchased as Alt-R crRNA products (Integrated DNA Technologies) along with a double-stranded DNA (dsDNA) repair template GeneBlock (Integrated DNA Technologies) containing the R38A and R82A mutations, as well as silent mutations to insert StuI and EaeI restriction sites and remove the NGG PAM sequence. Reagents were prepared according to the manufacturer’s suggested protocol. RNA molecules were dissolved in sterile injection buffer (1 mM Tris pH 7.5, 0.1 mM EDTA) at 1 μg/μL. Mature crRNA:tracrRNA complexes were produced by combining 5 μL of 1 μg/μL crRNA and 10 μL of 1 μg/μL tracrRNA. Samples were incubated in a thermocycler at 95 °C for 5 min and then ramped down to 25 °C at 5 °C/min. Samples were diluted two-fold in injection buffer, and 4 μL of each complex was combined, along with 64 μL injection buffer. Cas9 protein (Integrated DNA Technologies) was diluted to 500 ng/μL in injection buffer, and 8 μL was added to the RNA mixture. Samples were incubated for 15 min at RT. The Cas9/gRNA mixture was aliquoted at 20 μL, and 5 μL of 100 ng/μL dsDNA repair template was added. Samples were centrifuged for 10 min at 21,000 × g, and 20 μL was transferred to a new tube. The final concentrations of the injection solution were 20 ng/μL each of gRNA/Cas9 complex and 20 ng/μL of repair template. Pronuclear injections and subsequent culture and implantation steps were adapted from a previous protocol.53 Roughly 300 zygotes from superovulated, mated B6SJL-F1/J mice were injected with the solution into one of the pronuclei. Zygotes that had proceeded to the blastocyst stage were implanted into surrogate B6SJL-F1/J mice, and viable offspring were tailed for genotyping. Three animals were obtained with one allele correctly modified, of which one was used to establish the colony. Animals were backcrossed for at least three generations with C57BL/6J mice prior to use. Genotyping was performed by first purifying genomic DNA from tail snips using the DNeasy Blood and Tissue Kit (69504, Qiagen). PCR reactions (35 cycles, 66 °C annealing temperature, 2-min extension time) were set up by combining the following: 12.5 μL of 2x Q5 Hot Start High Fidelity 2x master mix (M0494S, New England Biolabs), 8 μL of H2O, 2 μL of genomic DNA, 1.25 μL of 10 μM forward primer (5’-AGAGCTACAGATGAGAGGGAAG-3’), 1.25 μL of 10 μM reverse primer (5’-CACATTCTTCTCCTCGGTCTTG-3’). To each reaction, 1 μL of StuI (R0187S, New England Biolabs) was added, and the mixture was incubated at 37 °C for 1.5 h. Samples were diluted with 6x purple loading dye (B7025S, New England Biolabs) and resolved on a 1% agarose gel by application of a constant voltage of 120 V for 30 min. Bands were visualized using an Enduro GDS Touch gel imager (Aplegen).
Tissue harvesting and processing.
Male and female mice were both used in all experiments except for direct weight comparisons. Tissue samples were acquired from litter mates from at least two independent litters that were processed and analyzed together after genotyping. Retinal tissue harvesting, dissection, and immunostaining with the Alexa Fluor 488-conjugated endothelial-specific isolectin GS-IB4 (I21411, ThermoFisher Scientific) were performed as previously described.29 Entire retinal areas and representative regions were imaged using an LSM 700 confocal microscope with a Plan-Apochromat 5x/0.16 M27 or Plan-Apochromat 20x/0.8 M27 objective, respectively. Images were acquired using 4×4 or 5×5 tiling scans, respectively, with automatic stitching by ZEN software (Zeiss). All image analysis was performed using FIJI/ImageJ as previously described.29 Vessel outgrowth was measured as the distance from the optic disk to the retinal front. Relative vessel area was calculated as the IB4+ area per entire retinal area. The number of branches and branchpoints were measured by skeletonizing the IB4-stained vessels of the entire retinal area and automated skeleton analysis via the AnalyzeSkeleton plugin of FIJI/ImageJ. Statistical analysis was performed by Prism 7 using an unpaired, two-tailed Student’s t test. Lung tissues were harvested from adult 4-month-old mice, rinsed with PBS, and immediately lysed by douncing with 1 mL of ice-cold T-PER extraction reagent (78510, ThermoFisher Scientific) containing 1x PIC and 1x Phos-STOP. Lysates were clarified by centrifugation at 16,000 × g for 10 min at 4 °C, and protein concentrations were quantified by BCA assay. Lysates were analyzed by Western blotting as described above. Total protein levels were normalized to the corresponding ɑ-tubulin protein loading control, and phosphoprotein values were normalized to the corresponding total protein level. All data are reported relative to the wild-type animal control. Statistical analyses were performed by Prism 7 using an unpaired, two-tailed Student’s t test.
Extended Data
Extended Data Fig. 1. Ang-Tie2 complex formation occurs in a sulfation-dependent manner.
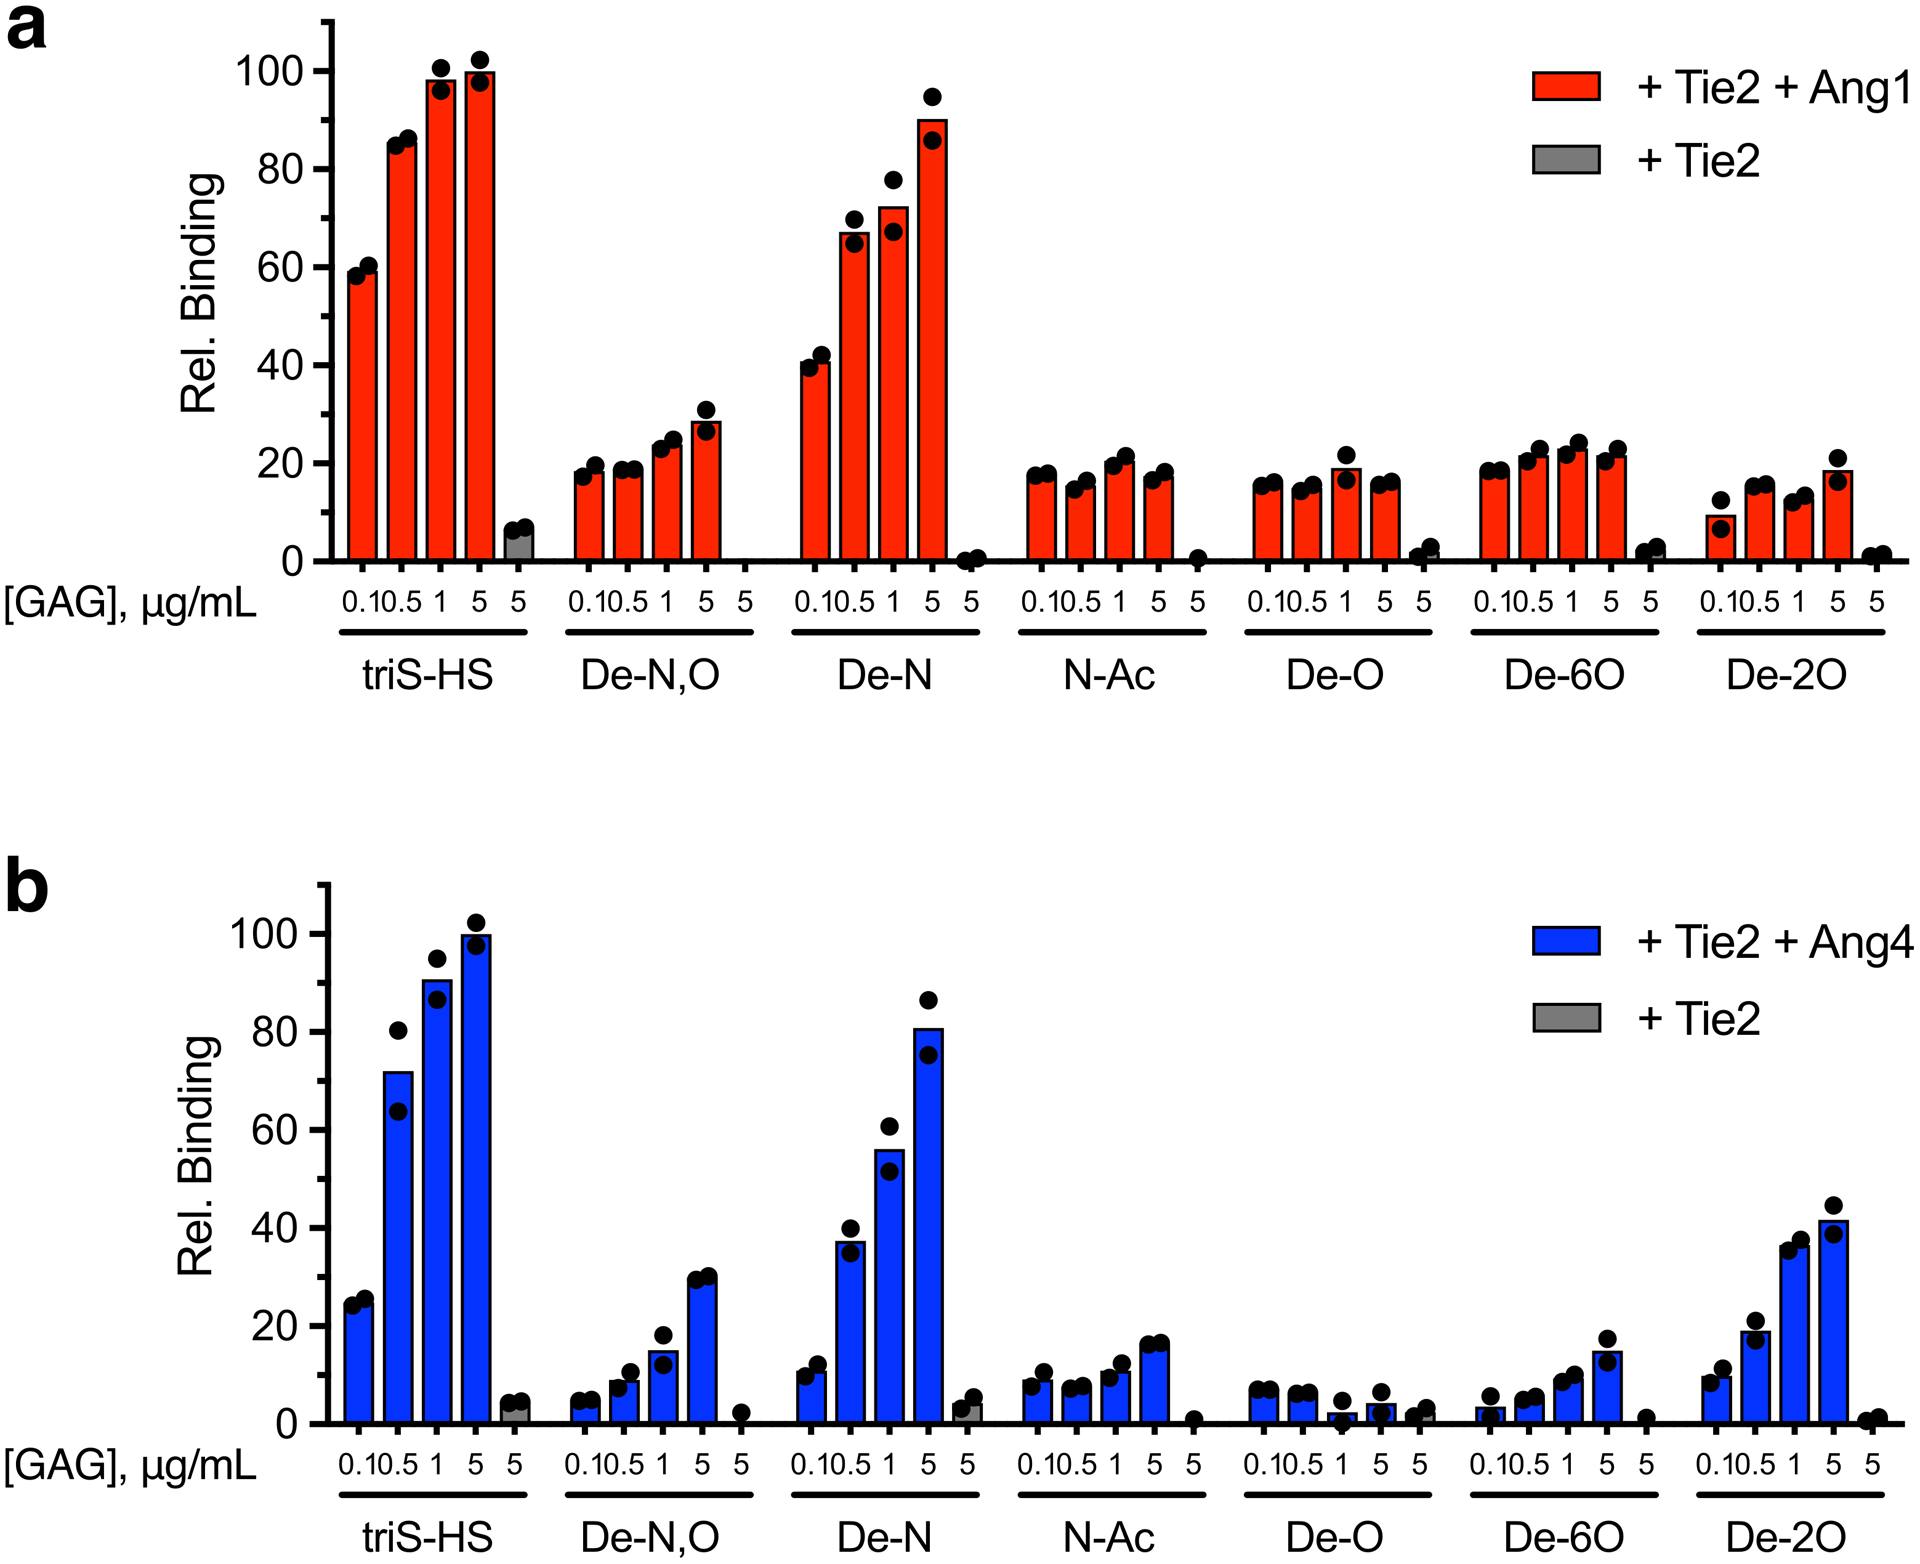
Binding of biotinylated HS sulfation motifs to immobilized Tie2 in the presence or absence of (a) Ang1 or (b) Ang4, as detected by ELISA. Removal of the N- and O-sulfate groups (De-N,O), the N-sulfate groups (De-N), the O-sulfate groups (De-O), the 6-O-sulfate groups (De-6O), or the 2-O-sulfate groups (De-2O), or conversion of the N-sulfate to N-acetyl groups (N-Ac) reduced formation of HS-Ang1/4-Tie2 ternary complexes. Data represent mean ± s.e.m., n = 2 independent replicates.
Extended Data Fig. 2. Orphan receptor Tie1 binds to the CS-E motif.
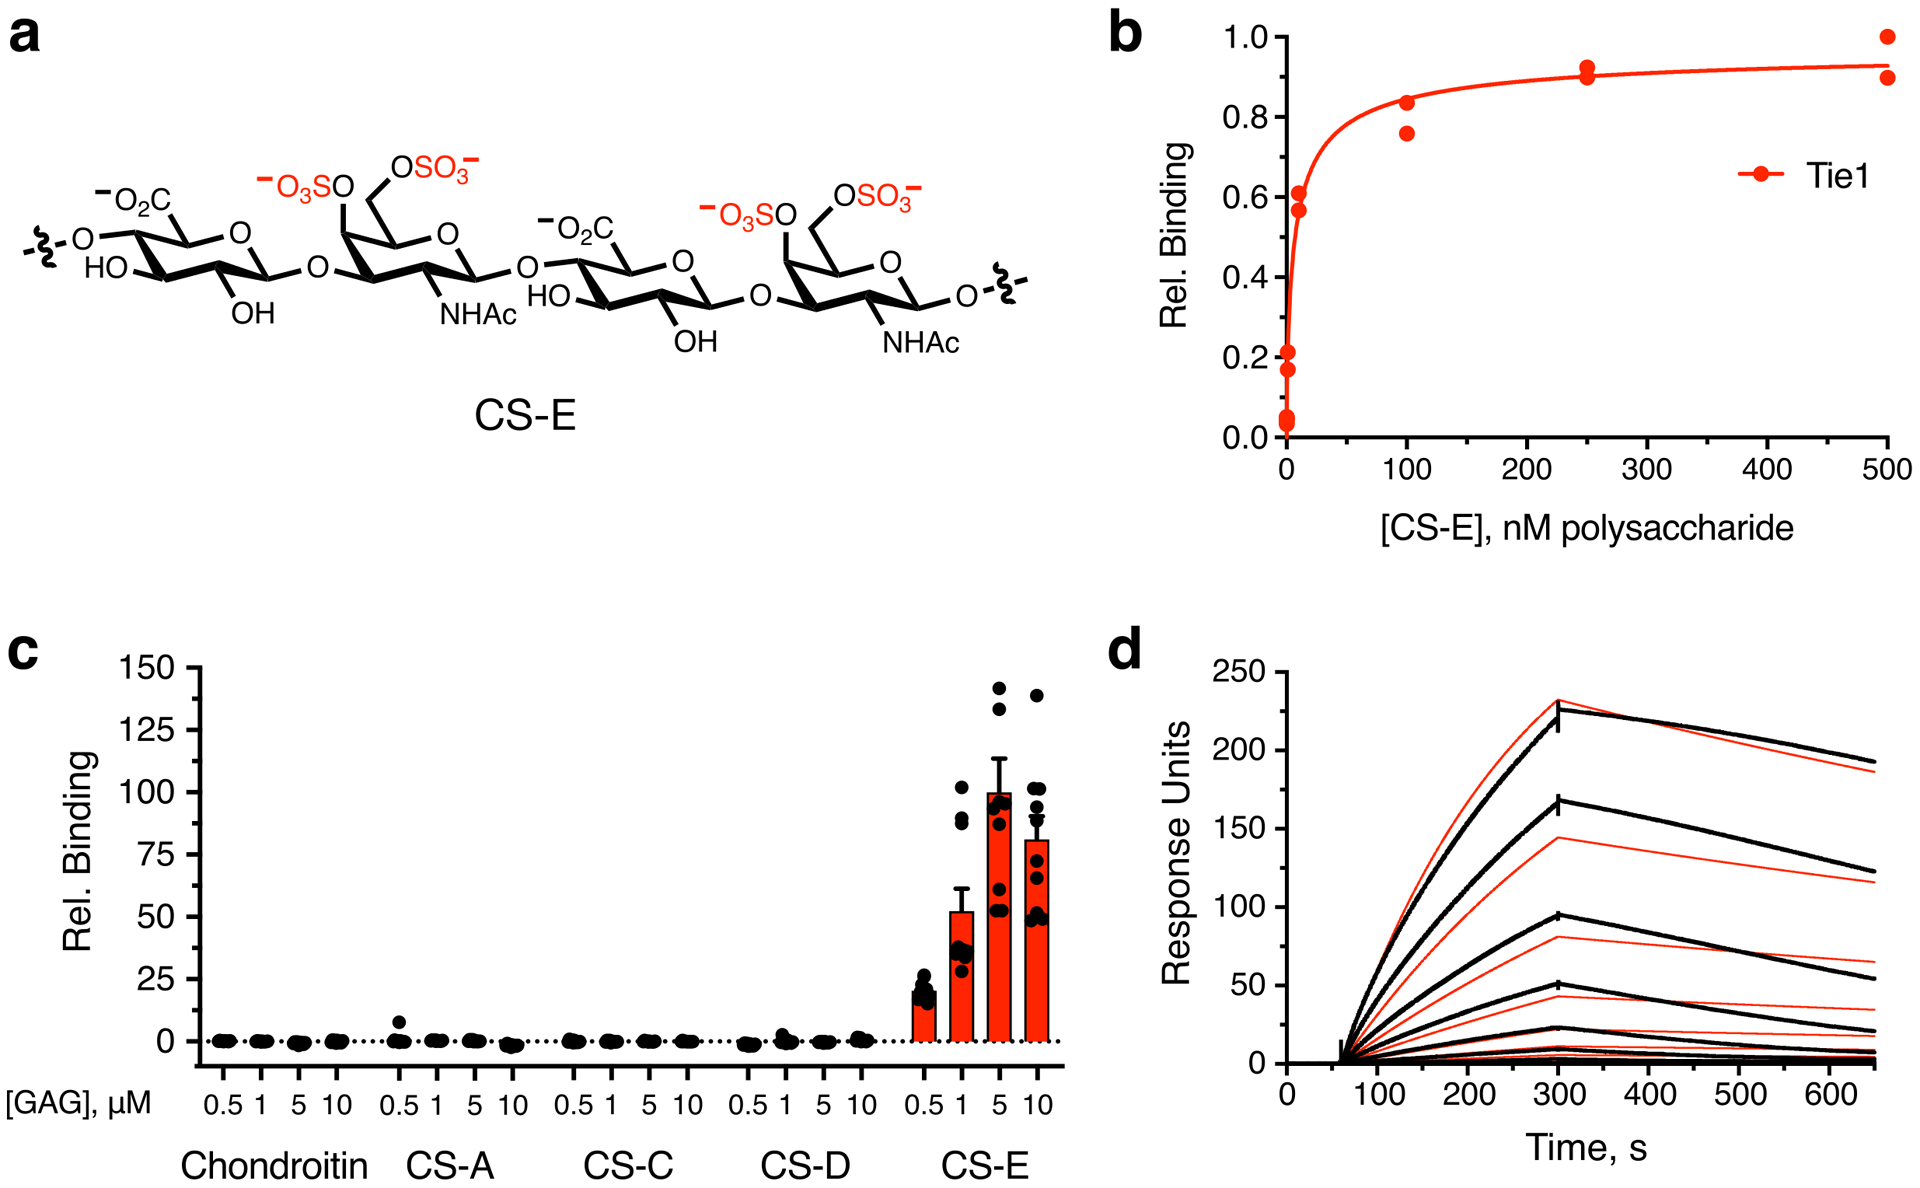
(a) Chemical structure of the CS-E sulfation motif in CS polysaccharides. Interaction of CS-E and Tie1 by (b) ELISA, (c) glycan microarray, and (d) surface plasmon resonance. Dissociation constant for Tie1, as determined by ELISA: KD,app = 19.9 nM (10.5 to 53.5 nM); value represents mean (95% CI); graphed data represent n = 2 independent replicates. For glycan microarrays, data represent mean ± s.e.m., n = 10 individual spots per glycan concentration. Dissociation constant for Tie1, as determined by SPR: KD,app = 14.7 nM (14.6 to 14.8 nM); value represents mean (95% CI). SPR data were fit using a 1:1 Langmuir model shown in red.
Extended Data Fig. 3. HS engages Tie1 in a sulfation-specific manner.
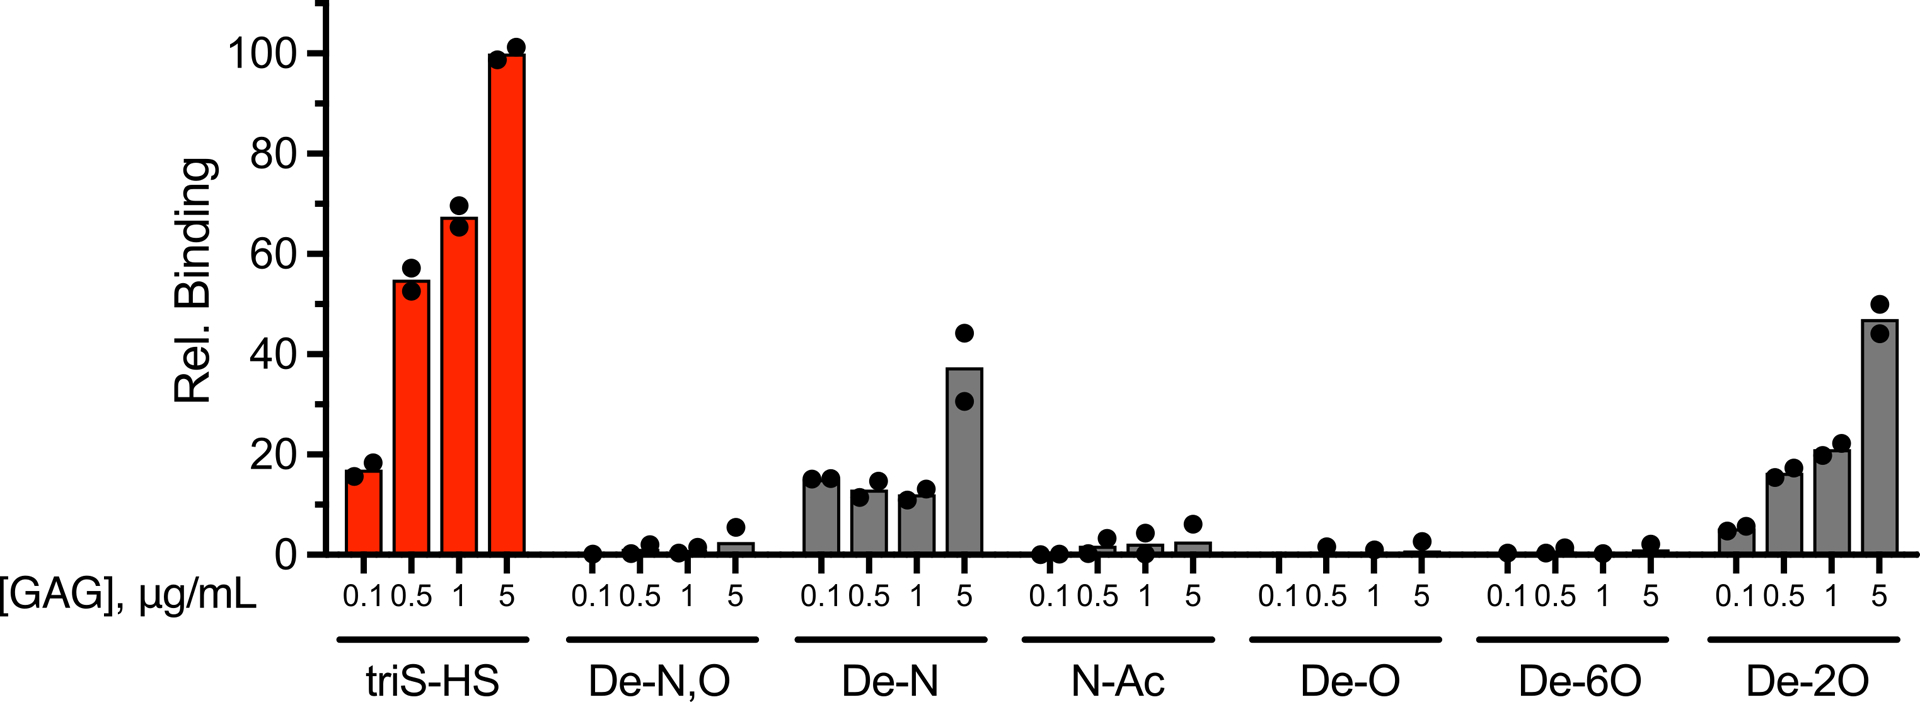
Binding of Tie1-Fc to different HS sulfation motifs, as determined by ELISA. Removal of the N- and O-sulfate groups (De-N,O), the O-sulfate groups (De-O), or the 6-O-sulfate groups (De-6O), or conversion of the N-sulfate to N-acetyl groups (N-Ac) abolished the HS-Tie1 interaction. Removal of the N-sulfate groups (De-N) or the 2-O-sulfate groups (De-2O) greatly reduced HS-Tie1 binding. Data represent mean ± s.e.m., n = 2 independent replicates.
Extended Data Fig. 4. Soluble Tie1 binds to HUVECs.
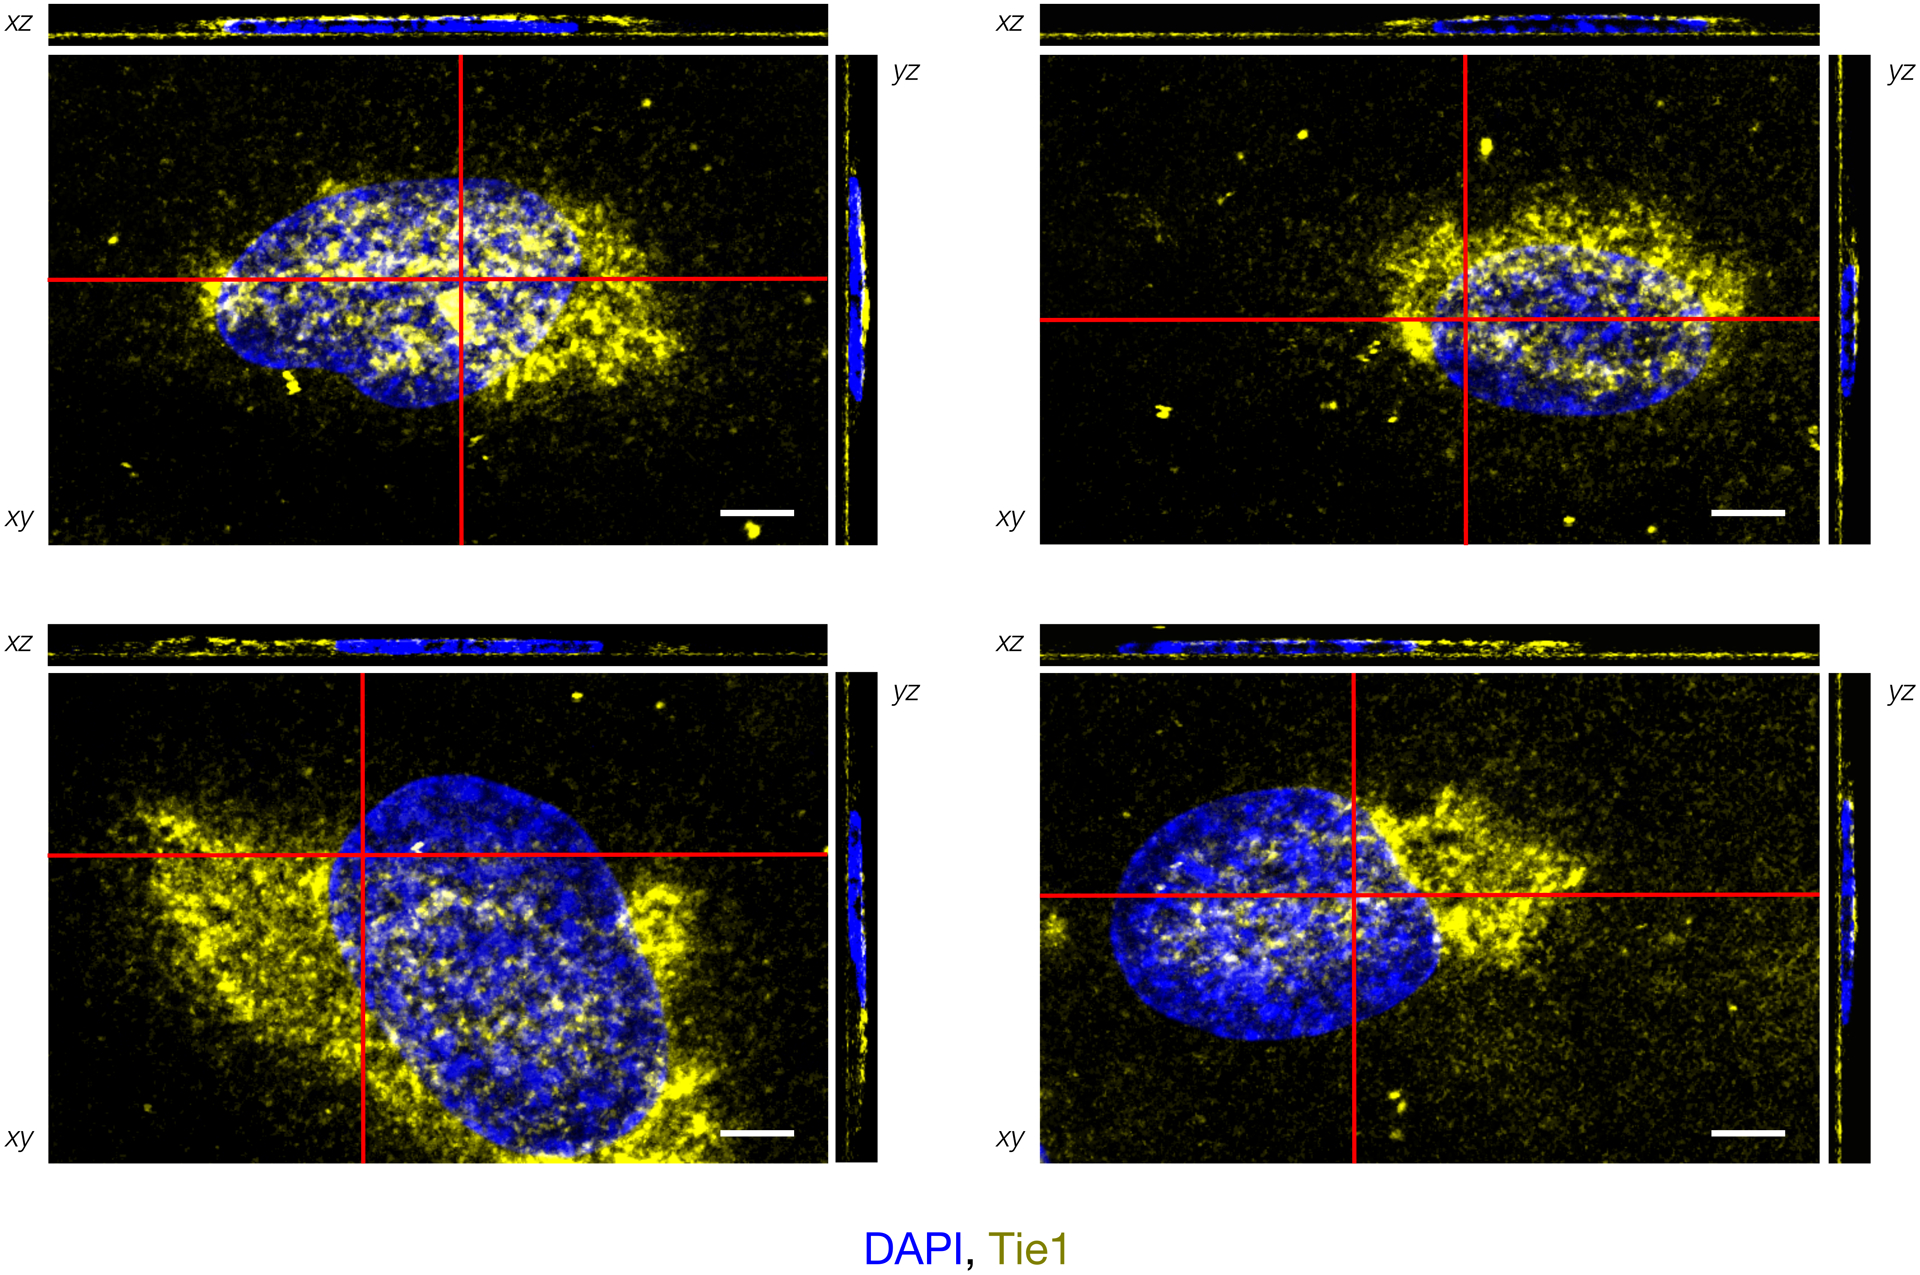
Immunofluorescence imaging and orthogonal plane views of HUVECs with cell-associated Tie1-Fc (yellow), scale bar = 5 μm. Red bars indicate cross-sectional views in xz and yz images, which were produced by combining z-stack images using FIJI/ImageJ. The majority of Tie1 appears at the apical or basolateral cell surface. Representative images from four individual cells are shown.
Extended Data Fig. 5. Sulfated HS GAGs engage Tie1 in its N-terminal domains.
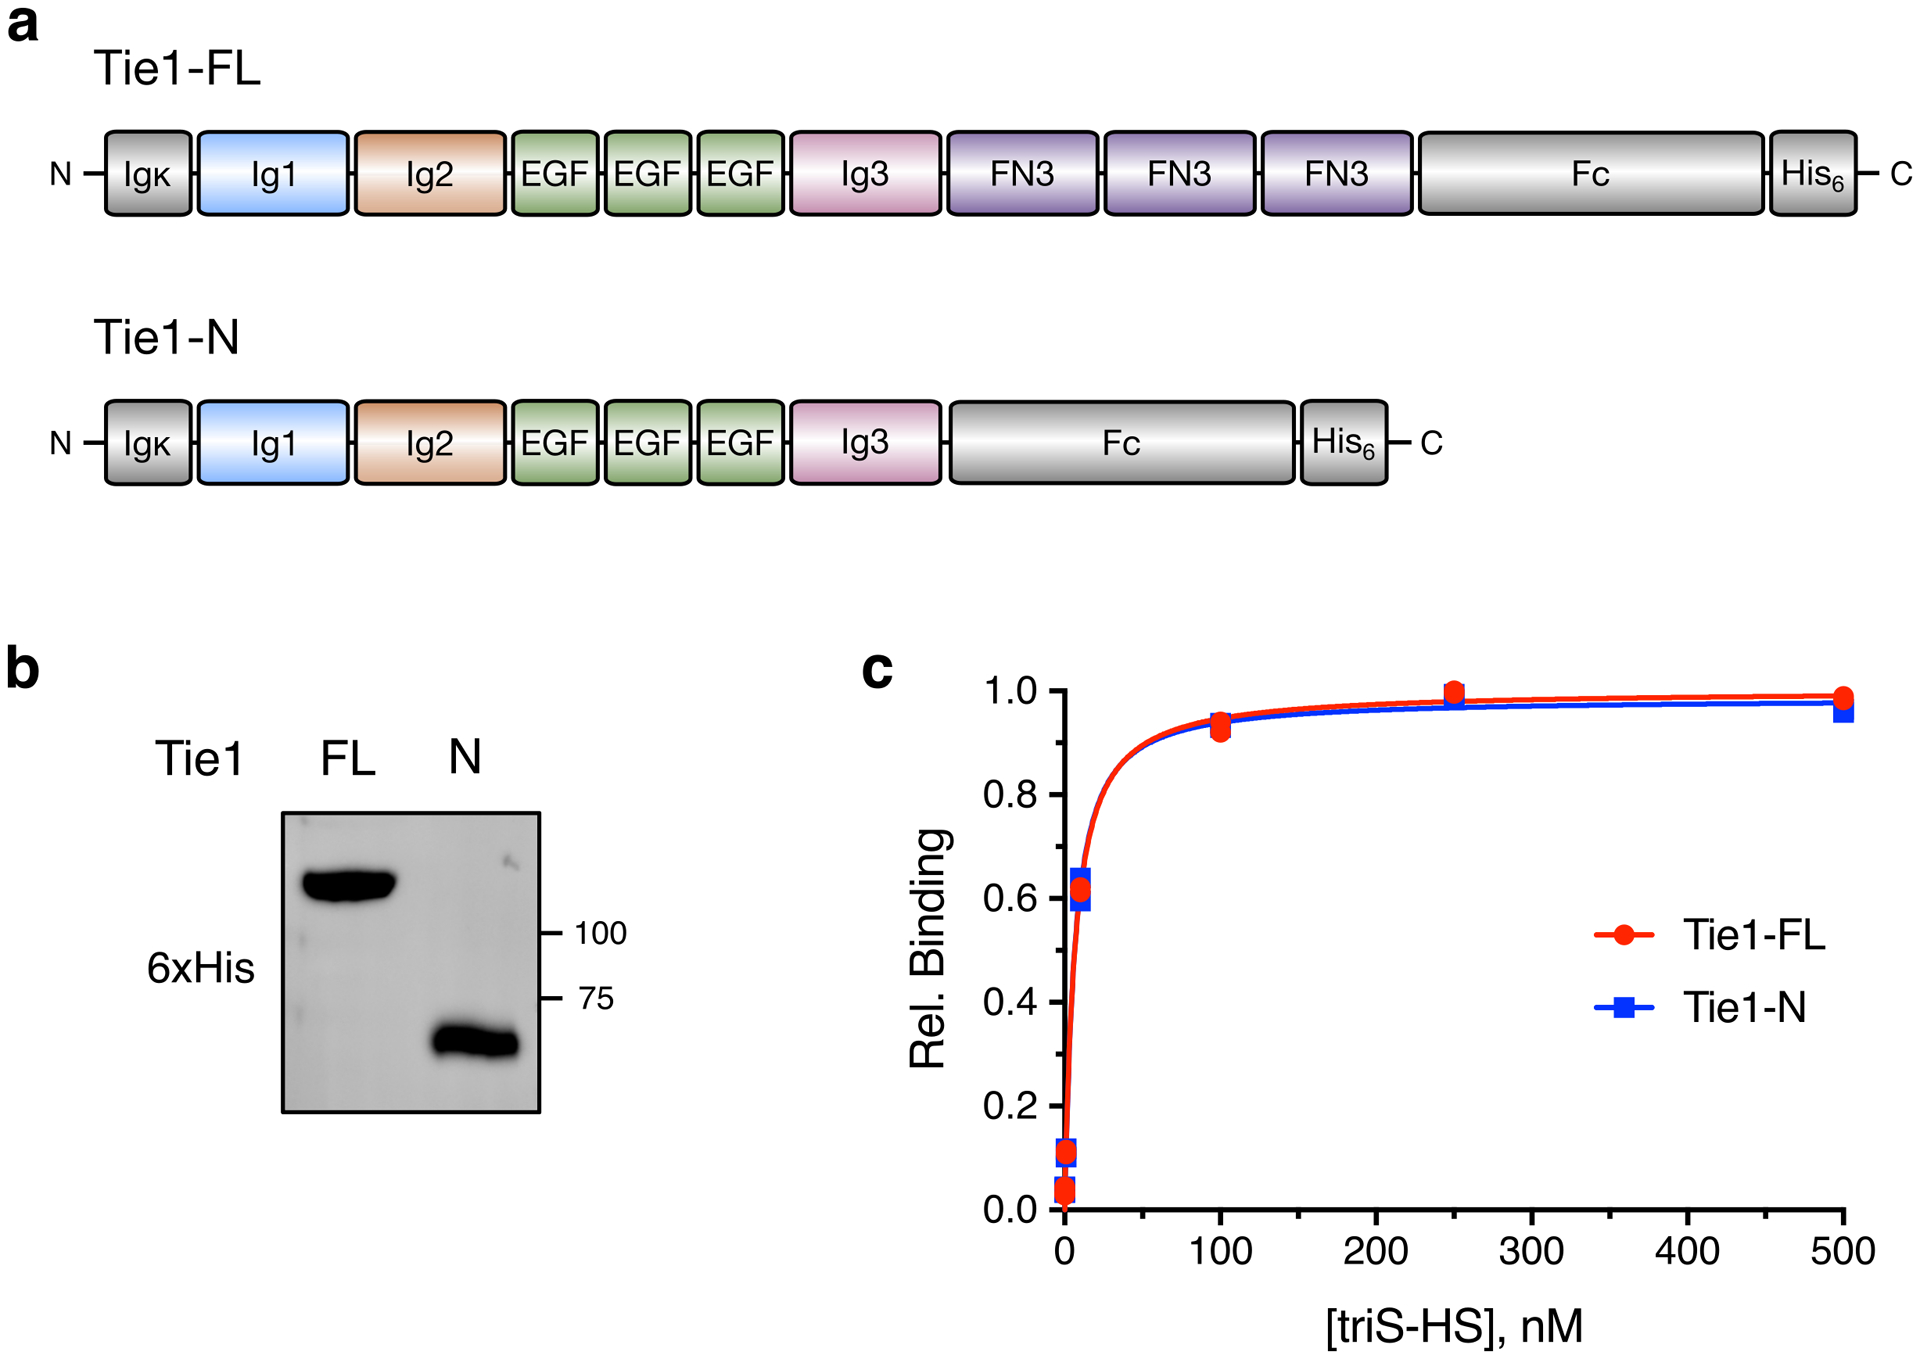
(a) Schematic and (b) Western blot of overexpressed, purified full-length (Tie1-FL) and C-terminal truncated (Tie-N) Tie1 ectodomains. Colors in (a) correspond to the ribbon diagram of Tie1 in Fig. 4a. Gray sections are derived from the expression plasmid. (c) Binding of biotinylated triS-HS to recombinant Tie1-FL and Tie-N by ELISA. Data for (c) were obtained in the same experiment as Fig. 4e. Dissociation constants, as determined by ELISA: KD,app (Tie1-FL) = 6.51 nM (5.58 to 7.63 nM), KD,app (Tie1-N) = 6.26 nM (5.26 to 7.45 nM); values represent mean (95% CI); graphed data represent n = 2 independent replicates.
Extended Data Fig. 6. HS GAGs engage Tie1 in an electropositive region of the first N-terminal Ig-like domain.
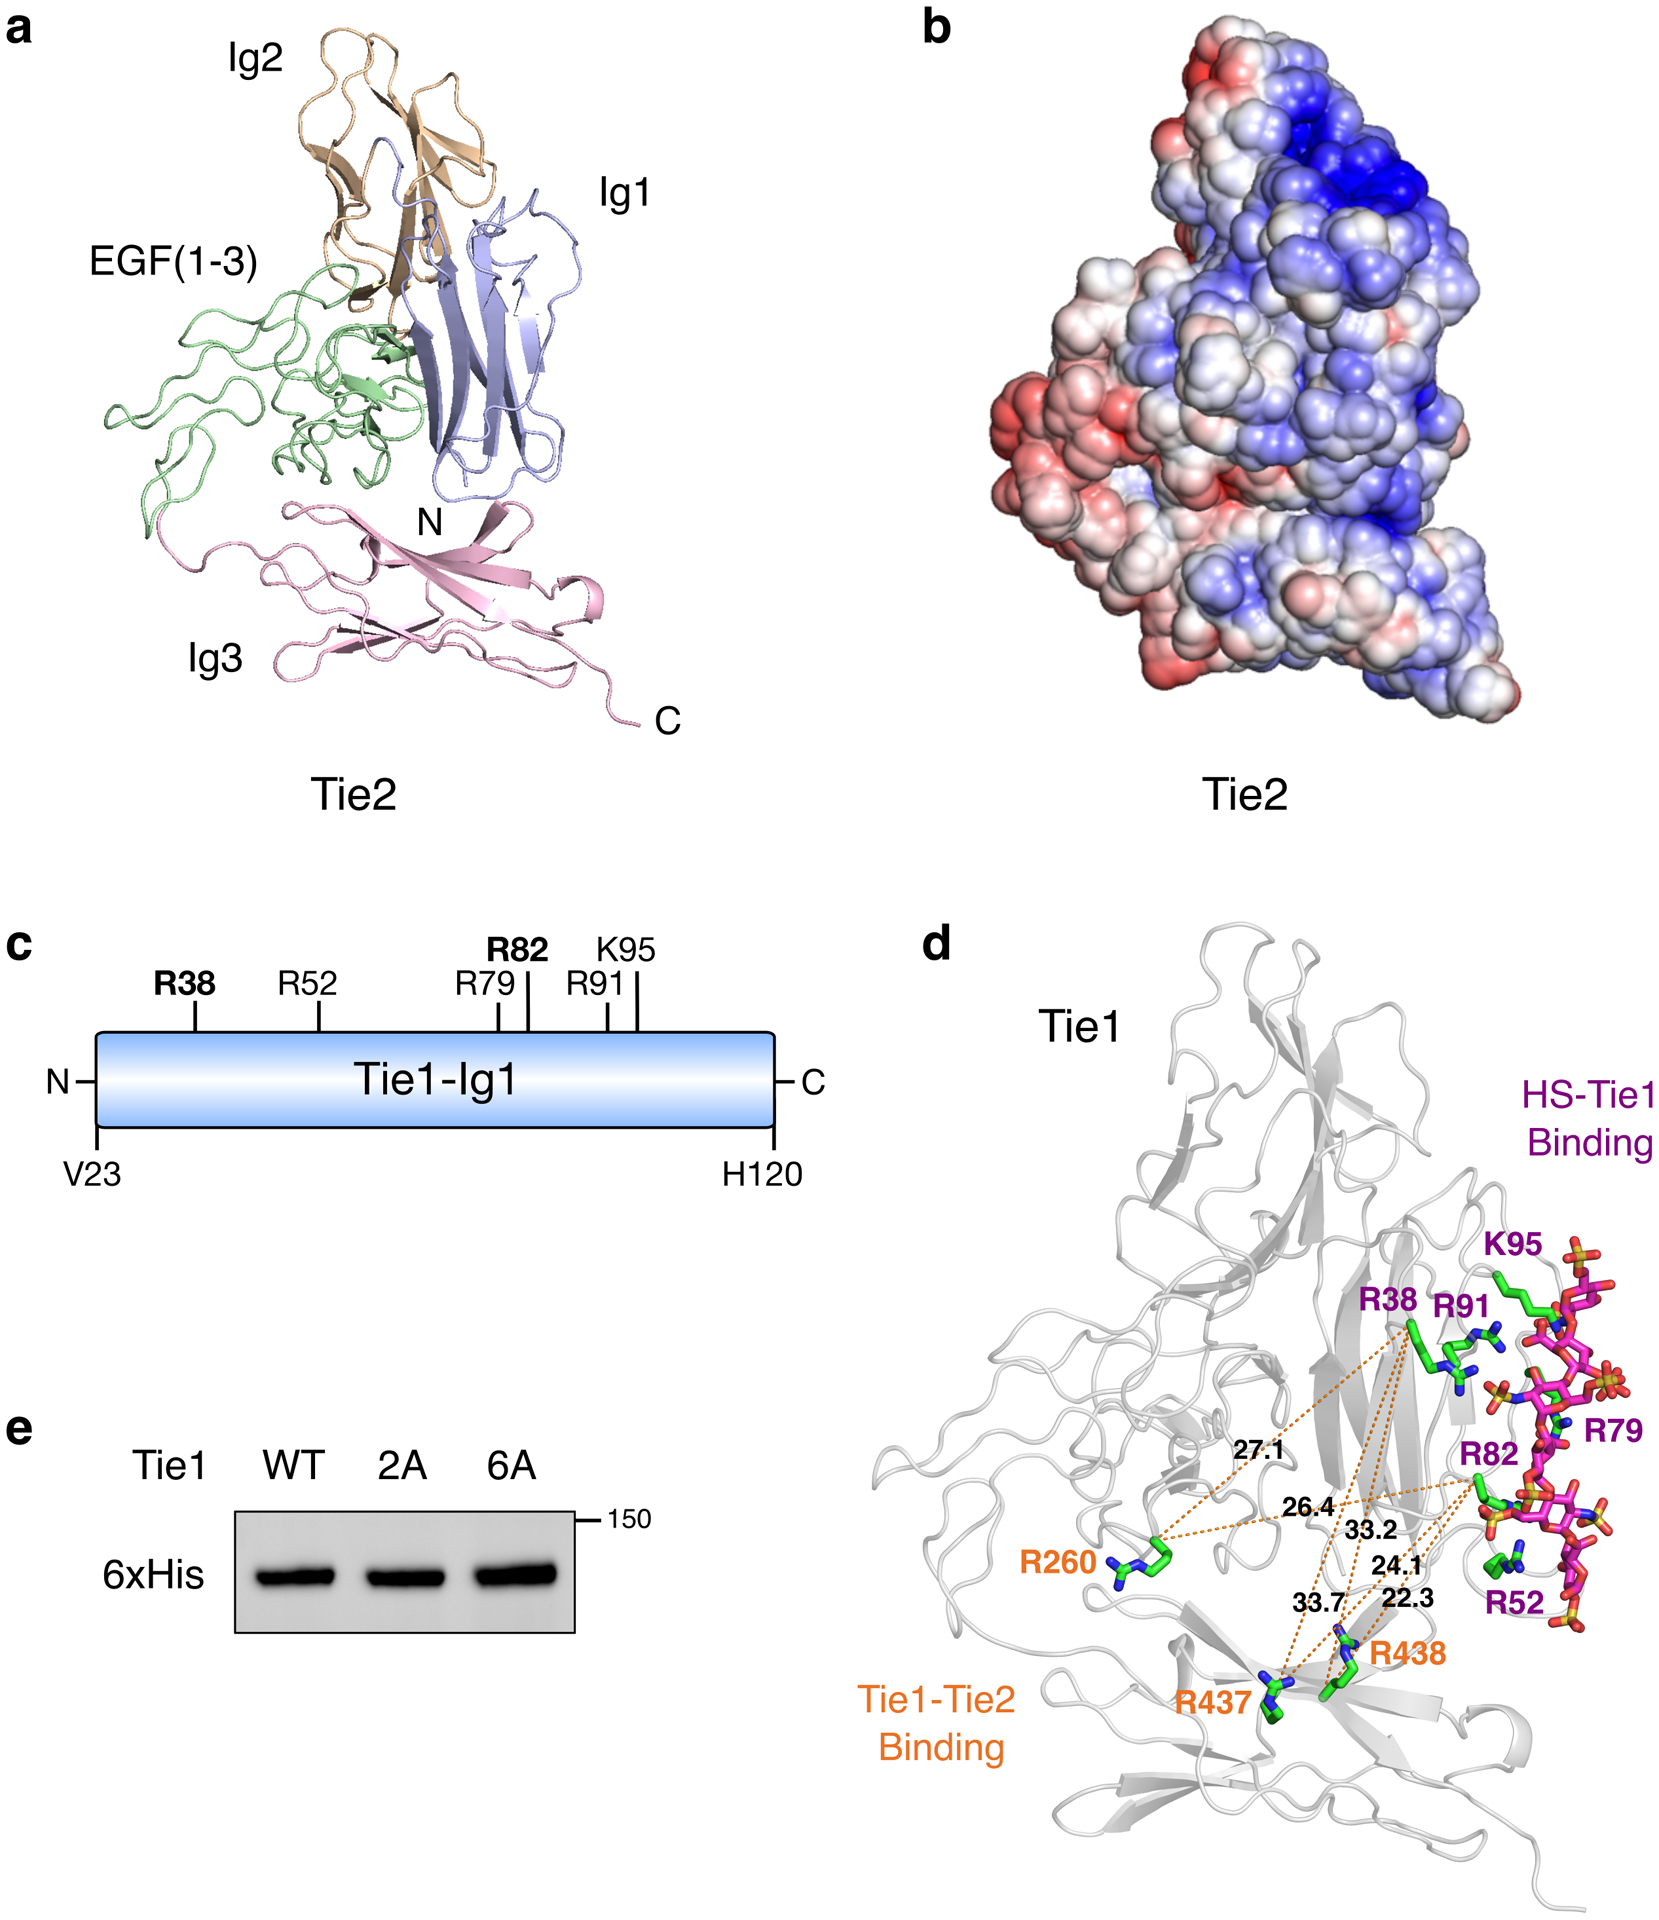
(a) Ribbon diagram and (b) electrostatic potential surface of the Tie2 crystal structure (pdb 2GY5), which lacks the electropositive HS binding site found in Tie1. The red to blue scale in (b) represents relative electrostatic potential (electronegative to electropositive). (c) Schematic of the first N-terminal Ig-like domain (Ig1) of Tie1, highlighting the six positively charged amino acids within 5–10 Å of the top 10 highest ranked HS GAG docked poses. All residues are mutated to alanine in the Tie1-6A construct, whereas only the two bolded residues are mutated in Tie1-2A. (d) Structural model of the Tie1 N-terminal region (residues 22–447) indicating key amino acid residues involved in HS binding (purple) and those reported to be involved in Tie2 binding (orange).27 Distances are displayed in angstroms between the alpha carbon of each residue. (e) Western blot showing expression of secreted Tie1 ectodomain constructs from HEK-293T cells after purification.
Extended Data Fig. 7. The HS-Tie1 interaction is driven primarily by ionic interactions.
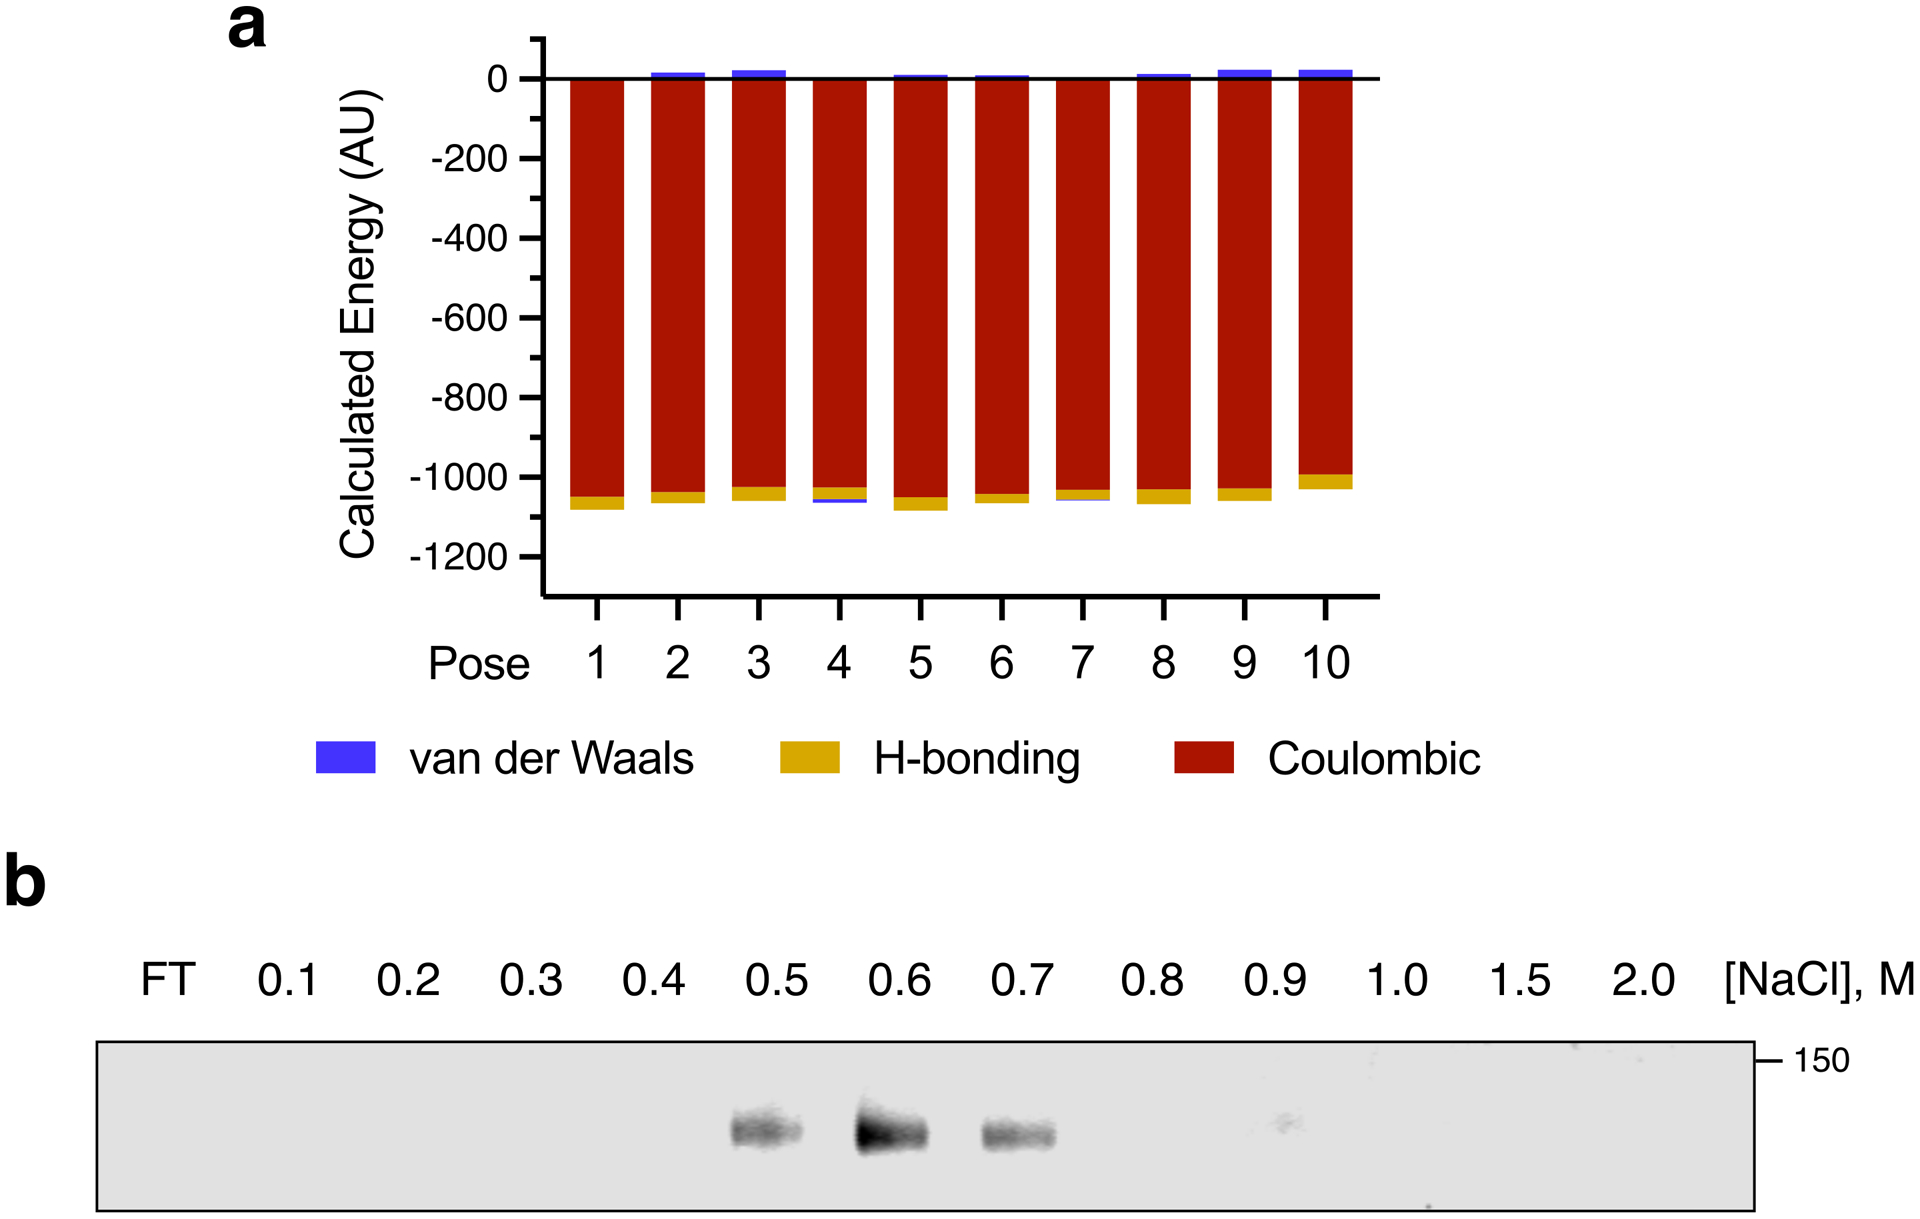
(a) Relative energetic contributions of van der Waals, hydrogen bonding, and Coulombic forces to the total calculated nonbonding energy are shown for the top 10 HS-Tie1 binding poses. In all cases, Coulombic forces dominated the calculated energy. (b) Salt elution profile of Tie1 bound to heparin sepharose shows loss of the HS-Tie1 interaction with increasing NaCl concentrations, indicative of strong ionic interactions between HS and Tie1. FT = flow-through.
Extended Data Fig. 8. Generation, genotyping, and characterization of Tie1-2A mice.
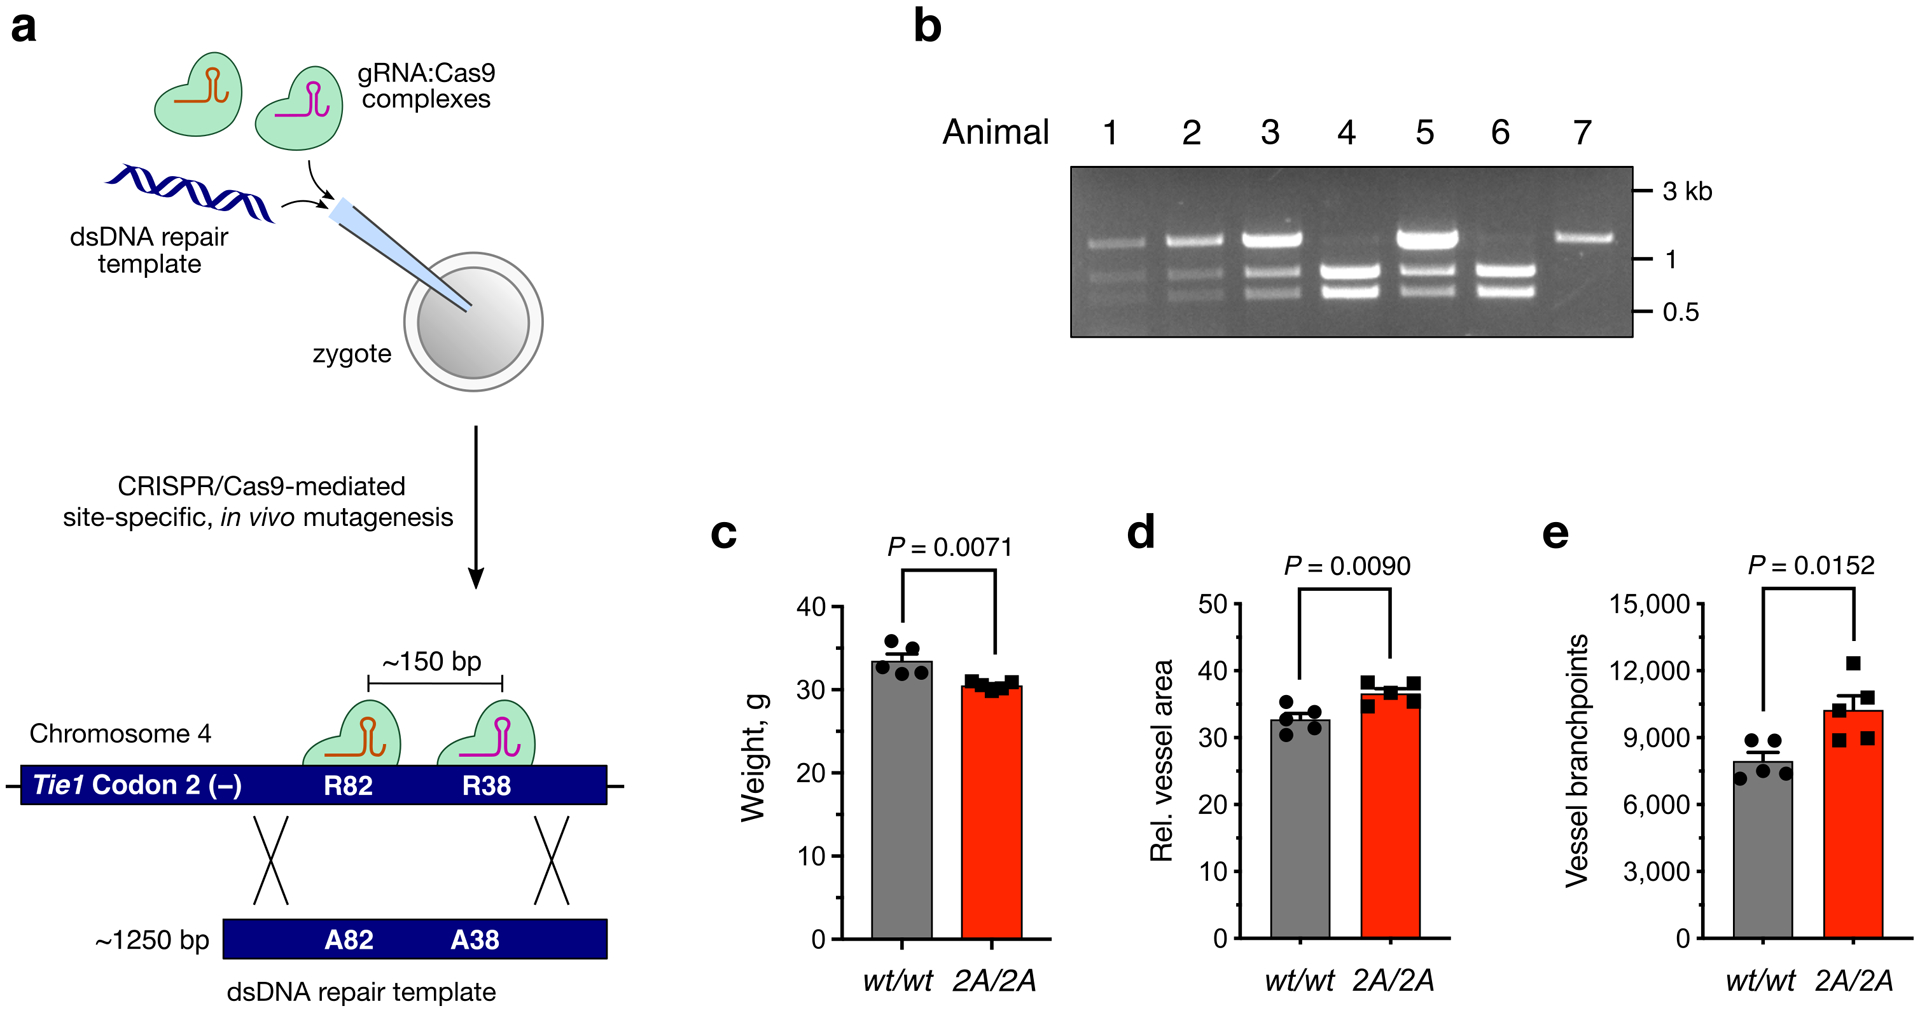
(a) Schematic of the homology-directed repair method used to generate the Tie1-2A mouse line incorporating R38A and R82A mutations into the endogenous murine Tie1 gene. (b) Representative genotyping results from a Tie12A/wt × Tie12A/wt breeding pair after the Tie1 locus was amplified by PCR and digested with StuI. Animal 7 is Tie1wt/wt, animals 1, 2, 3, and 5 are Tie12A/wt, and animals 4 and 6 are Tie12A/2A. (c) Quantification of weight differences between Tie12A/2A (2A/2A) and wild-type (wt/wt) 4-month-old, male littermates, n = 5 per genotype. (d,e) Quantification of relative vessel area and branchpoints from retinal samples described in Fig. 6, n = 5 per genotype. Data represent mean ± s.e.m., unpaired, two-tailed Student’s t test.
Extended Data Fig. 9. Tie1 mutation does not affect Erk1/2 phosphorylation in vivo.
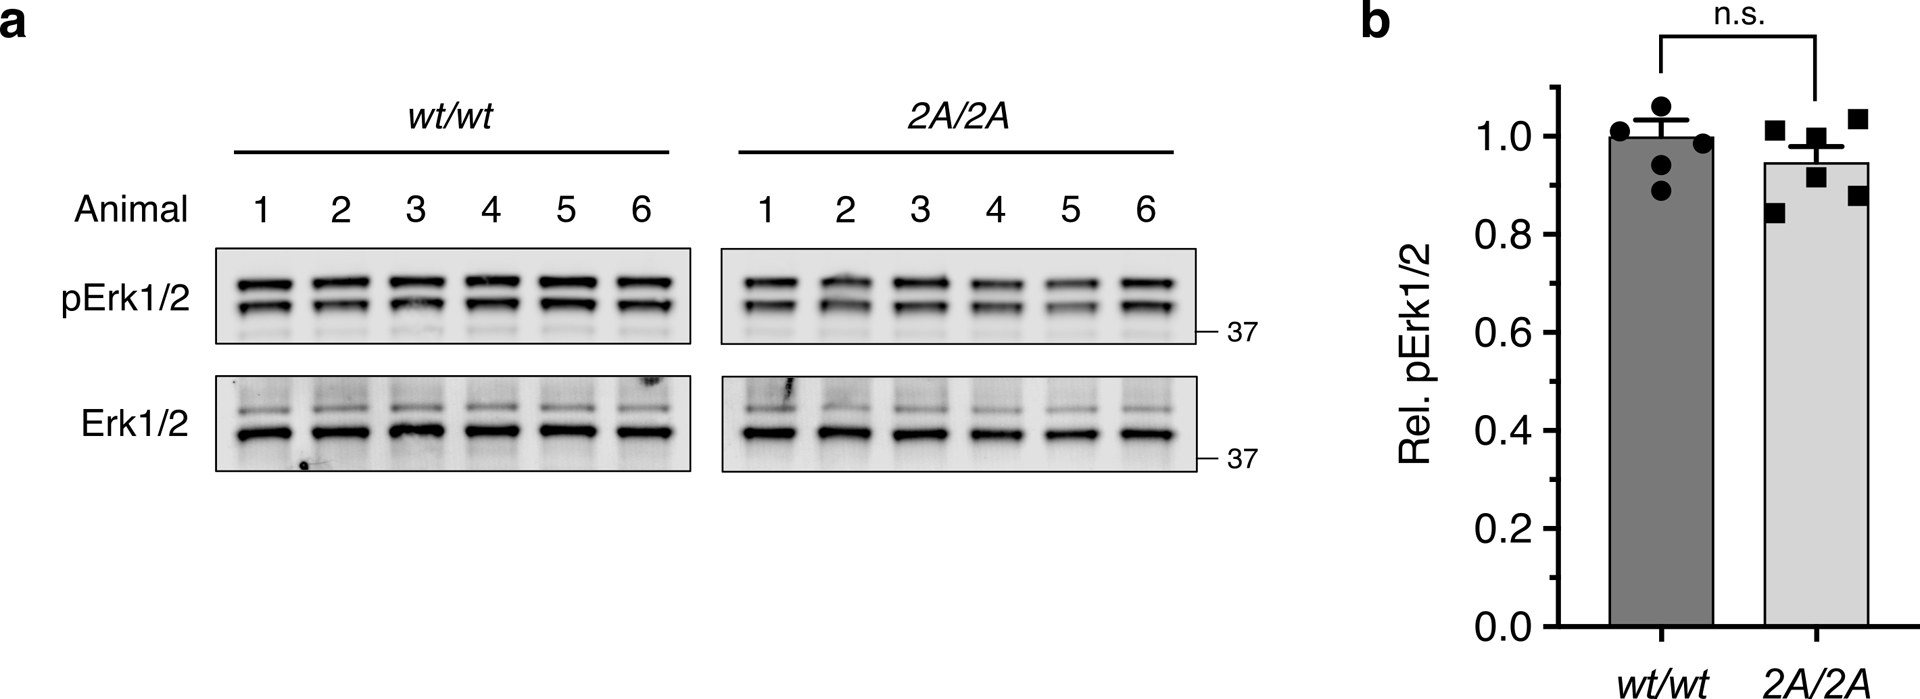
(a) Representative Western blots and (b) quantification of pErk1/2 from lung tissue harvested from 7-day-old pups, n = 6 per genotype. pErk1/2 values were normalized to the corresponding total Erk1/2 levels and are reported relative to the wild-type animals. Proteins were imaged on the same blot to allow for direct comparison between samples. Data represent mean ± s.e.m., unpaired, two-tailed Student’s t test.
Extended Data Fig. 10. HS GAGs regulate the Ang/Tie signaling pathway.
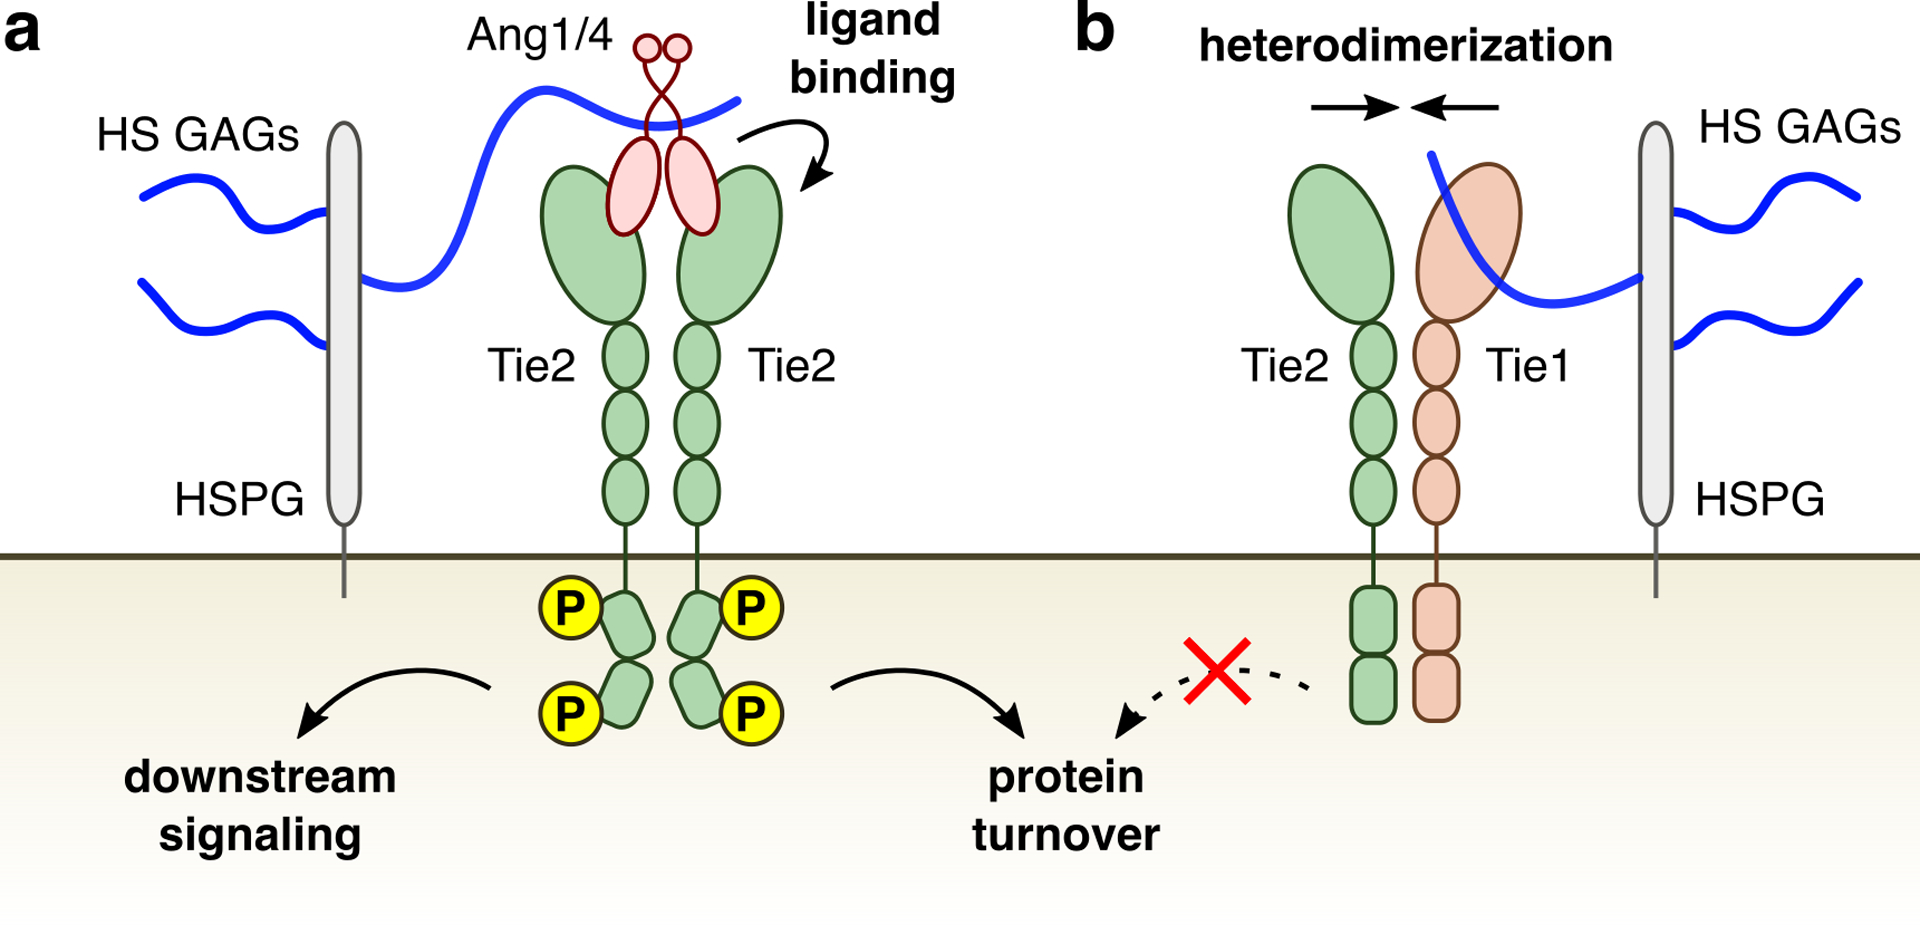
HS GAGs utilize two distinct binding modes to promote pathway activation. (a) Endothelial cell-associated HS GAGs recruit agonistic ligands Ang1 and Ang4 to form HS-Ang-Tie2 complexes and elicit downstream signaling. (b) HS GAGs also bind to the orphan receptor Tie1 to promote the Tie1-Tie2 interaction, which maintains Tie2 protein levels and prevents protein turnover at the cell surface to sustain downstream signaling.
Supplementary Material
Acknowledgements
We thank S. Pease and staff of the Caltech Genetically Engineered Mouse Services Core for help with generating the Tie1-2A mouse line and J. Costanza and A. Gomez of the Caltech Office of Laboratory Animal Resources for mouse line care and maintenance. We also thank J. Vielmetter and the Caltech Protein Expression Center of the Beckman Institute for help with conducting the SPR experiments. This work was supported by the National Institutes of Health (L.C.H-W., 5R01GM093627 and 5R01GM127920) and the National Science Foundation (M.E.G., DGE-1144469).
Footnotes
Competing Financial Interests Statement
The authors declare no competing interests.
Data Availability Statement
Any data generated or analyzed during this study are included in the article and related supplemental information or are available from the corresponding author on reasonable request. Publicly available data used in this study include the Tie2 crystal structure (PDB ID 2GY5), the Tie1 protein sequence (UniProt ID P335590), the Dec. 2011 murine genome assembly (GRCm38/mm10), and the CHOPCHOP guide RNA design tool (https://chopchop.cbu.uib.no/).
References
- 1.Potente M, Gerhardt H & Carmeliet P Basic and therapeutic aspects of angiogenesis. Cell 146, 873–887 (2011). [DOI] [PubMed] [Google Scholar]
- 2.Carmeliet P & Jain RK Molecular mechanisms and clinical applications of angiogenesis. Nature 473, 298–307 (2011). [DOI] [PMC free article] [PubMed] [Google Scholar]
- 3.Adams RH & Alitalo K Molecular regulation of angiogenesis and lymphangiogenesis. Nat. Rev. Mol. Cell Biol 8, 464–478 (2007). [DOI] [PubMed] [Google Scholar]
- 4.Simons M, Gordon E & Claesson-Welsh L Mechanisms and regulation of endothelial VEGF receptor signalling. Nat. Rev. Mol. Cell Biol 17, 611–625 (2016). [DOI] [PubMed] [Google Scholar]
- 5.Beenken A & Mohammadi M The FGF family: biology, pathophysiology and therapy. Nat. Rev. Drug Discov 8, 235–253 (2009). [DOI] [PMC free article] [PubMed] [Google Scholar]
- 6.Andrae J, Gallini R & Betsholtz C Role of platelet-derived growth factors in physiology and medicine. Genes Dev. 22, 1276–1312 (2008). [DOI] [PMC free article] [PubMed] [Google Scholar]
- 7.Capila I & Linhardt RJ Heparin-protein interactions. Angew. Chem. Int. Ed Engl 41, 391–412 (2002). [DOI] [PubMed] [Google Scholar]
- 8.Xu D & Esko JD Demystifying heparan sulfate-protein interactions. Annu. Rev. Biochem 83, 129–157 (2014). [DOI] [PMC free article] [PubMed] [Google Scholar]
- 9.Poulain FE & Yost HJ Heparan sulfate proteoglycans: a sugar code for vertebrate development? Development 142, 3456–3467 (2015). [DOI] [PMC free article] [PubMed] [Google Scholar]
- 10.Bishop JR, Schuksz M & Esko JD Heparan sulphate proteoglycans fine-tune mammalian physiology. Nature 446, 1030–1037 (2007). [DOI] [PubMed] [Google Scholar]
- 11.Olczyk P, Mencner Ł & Komosinska-Vassev K Diverse roles of heparan sulfate and heparin in wound repair. BioMed Res. Int 2015, (2015). [DOI] [PMC free article] [PubMed] [Google Scholar]
- 12.Forsberg E & Kjellen L Heparan sulfate: lessons from knockout mice. J. Clin. Invest 108, 175–180 (2001). [DOI] [PMC free article] [PubMed] [Google Scholar]
- 13.Fuster MM & Wang L Endothelial heparan sulfate in angiogenesis. Prog. Mol. Biol. Transl. Sci 93, 179–212 (2010). [DOI] [PMC free article] [PubMed] [Google Scholar]
- 14.Jakobsson L et al. Heparan sulfate in trans potentiates VEGFR-mediated angiogenesis. Dev. Cell 10, 625–634 (2006). [DOI] [PubMed] [Google Scholar]
- 15.Xu D, Fuster MM, Lawrence R & Esko JD Heparan sulfate regulates VEGF165- and VEGF121-mediated vascular hyperpermeability. J. Biol. Chem 286, 737–745 (2011). [DOI] [PMC free article] [PubMed] [Google Scholar]
- 16.Schlessinger J et al. Crystal structure of a ternary FGF-FGFR-heparin complex reveals a dual role for heparin in FGFR binding and dimerization. Mol. Cell 6, 743–750 (2000). [DOI] [PubMed] [Google Scholar]
- 17.Pellegrini L, Burke DF, von Delft F, Mulloy B & Blundell TL Crystal structure of fibroblast growth factor receptor ectodomain bound to ligand and heparin. Nature 407, 1029–1034 (2000). [DOI] [PubMed] [Google Scholar]
- 18.Abramsson A et al. Defective N-sulfation of heparan sulfate proteoglycans limits PDGF-BB binding and pericyte recruitment in vascular development. Genes Dev. 21, 316–331 (2007). [DOI] [PMC free article] [PubMed] [Google Scholar]
- 19.van Wijk XMR & van Kuppevelt TH Heparan sulfate in angiogenesis: a target for therapy. Angiogenesis 17, 443–462 (2014). [DOI] [PubMed] [Google Scholar]
- 20.Augustin HG, Koh GY, Thurston G & Alitalo K Control of vascular morphogenesis and homeostasis through the angiopoietin-Tie system. Nat. Rev. Mol. Cell Biol 10, 165–177 (2009). [DOI] [PubMed] [Google Scholar]
- 21.Saharinen P, Eklund L & Alitalo K Therapeutic targeting of the angiopoietin-TIE pathway. Nat. Rev. Drug Discov 16, 635–661 (2017). [DOI] [PubMed] [Google Scholar]
- 22.Sato TN et al. Distinct roles of the receptor tyrosine kinases Tie-1 and Tie-2 in blood vessel formation. Nature 376, 70–74 (1995). [DOI] [PubMed] [Google Scholar]
- 23.Puri MC, Rossant J, Alitalo K, Bernstein A & Partanen J The receptor tyrosine kinase TIE is required for integrity and survival of vascular endothelial cells. EMBO J. 14, 5884–5891 (1995). [DOI] [PMC free article] [PubMed] [Google Scholar]
- 24.Kim M et al. Opposing actions of angiopoietin-2 on Tie2 signaling and FOXO1 activation. J. Clin. Invest 126, 3511–3525 (2016). [DOI] [PMC free article] [PubMed] [Google Scholar]
- 25.Partanen J et al. A novel endothelial cell surface receptor tyrosine kinase with extracellular epidermal growth factor homology domains. Mol. Cell. Biol 12, 1698–1707 (1992). [DOI] [PMC free article] [PubMed] [Google Scholar]
- 26.Saharinen P et al. Multiple angiopoietin recombinant proteins activate the Tie1 receptor tyrosine kinase and promote its interaction with Tie2. J. Cell Biol 169, 239–243 (2005). [DOI] [PMC free article] [PubMed] [Google Scholar]
- 27.Seegar TCM et al. Tie1-Tie2 interactions mediate functional differences between angiopoietin ligands. Mol. Cell 37, 643–655 (2010). [DOI] [PMC free article] [PubMed] [Google Scholar]
- 28.Leppänen V-M, Saharinen P & Alitalo K Structural basis of Tie2 activation and Tie2/Tie1 heterodimerization. Proc. Natl. Acad. Sci. U. S. A 114, 4376–4381 (2017). [DOI] [PMC free article] [PubMed] [Google Scholar]
- 29.Savant S et al. The orphan receptor Tie1 controls angiogenesis and vascular remodeling by differentially regulating Tie2 in tip and stalk cells. Cell Rep. 12, 1761–1773 (2015). [DOI] [PMC free article] [PubMed] [Google Scholar]
- 30.Korhonen EA et al. Tie1 controls angiopoietin function in vascular remodeling and inflammation. J. Clin. Invest 126, 3495–3510 (2016). [DOI] [PMC free article] [PubMed] [Google Scholar]
- 31.D’Amico G et al. Tie1 deletion inhibits tumor growth and improves angiopoietin antagonist therapy. J. Clin. Invest 124, 824–834 (2014). [DOI] [PMC free article] [PubMed] [Google Scholar]
- 32.La Porta S et al. Endothelial Tie1-mediated angiogenesis and vascular abnormalization promote tumor progression and metastasis. J. Clin. Invest 128, 834–845 (2018). [DOI] [PMC free article] [PubMed] [Google Scholar]
- 33.Brown JM et al. A sulfated carbohydrate epitope inhibits axon regeneration after injury. Proc. Natl. Acad. Sci. U. S. A 109, 4768–4773 (2012). [DOI] [PMC free article] [PubMed] [Google Scholar]
- 34.Rogers CJ et al. Elucidating glycosaminoglycan-protein-protein interactions using carbohydrate microarray and computational approaches. Proc. Natl. Acad. Sci. U. S. A 108, 9747–9752 (2011). [DOI] [PMC free article] [PubMed] [Google Scholar]
- 35.Pulsipher A, Griffin ME, Stone SE & Hsieh-Wilson LC Long-lived engineering of glycans to direct stem cell fate. Angew. Chem. Int. Ed Engl 54, 1466–1470 (2015). [DOI] [PMC free article] [PubMed] [Google Scholar]
- 36.Powell AK, Fernig DG & Turnbull JE Fibroblast growth factor receptors 1 and 2 interact differently with heparin/heparan sulfate: implications for dynamic assembly of a ternary signaling complex. J. Biol. Chem 277, 28554–28563 (2002). [DOI] [PubMed] [Google Scholar]
- 37.Teran M & Nugent MA Synergistic binding of vascular endothelial growth factor-A and its receptors to heparin selectively modulates complex affinity. J. Biol. Chem 290, 16451–16462 (2015). [DOI] [PMC free article] [PubMed] [Google Scholar]
- 38.Li G et al. Glycosaminoglycanomics of cultured cells using a rapid and sensitive LC-MS/MS approach. ACS Chem. Biol 10, 1303–1310 (2015). [DOI] [PubMed] [Google Scholar]
- 39.Griffith AR et al. Predicting glycosaminoglycan surface protein interactions and implications for studying axonal growth. Proc. Natl. Acad. Sci. U. S. A 114, 13697–13702 (2017). [DOI] [PMC free article] [PubMed] [Google Scholar]
- 40.Barton WA et al. Crystal structures of the Tie2 receptor ectodomain and the angiopoietin-2-Tie2 complex. Nat. Struct. Mol. Biol 13, 524–532 (2006). [DOI] [PubMed] [Google Scholar]
- 41.Taichman DB et al. A unique pattern of Tie1 expression in the developing murine lung. Exp. Lung Res 29, 113–122 (2003). [DOI] [PubMed] [Google Scholar]
- 42.Coles CH et al. Proteoglycan-specific molecular switch for RPTPsigma clustering and neuronal extension. Science 332, 484–488 (2011). [DOI] [PMC free article] [PubMed] [Google Scholar]
- 43.Meyer RD, Mohammadi M & Rahimi N A single amino acid substitution in the activation loop defines the decoy characteristic of VEGFR-1/FLT-1. J. Biol. Chem 281, 867–875 (2006). [DOI] [PMC free article] [PubMed] [Google Scholar]
- 44.Vander Kooi CW et al. Structural basis for ligand and heparin binding to neuropilin B domains. Proc. Natl. Acad. Sci. U. S. A 104, 6152–6157 (2007). [DOI] [PMC free article] [PubMed] [Google Scholar]
- 45.Ibrahimi OA, Zhang F, Hrstka SCL, Mohammadi M & Linhardt RJ Kinetic model for FGF, FGFR, and proteoglycan signal transduction complex assembly. Biochemistry 43, 4724–4730 (2004). [DOI] [PubMed] [Google Scholar]
- 46.Griffin ME & Hsieh-Wilson LC Glycan engineering for cell and developmental biology. Cell Chem. Biol 23, 108–121 (2016). [DOI] [PMC free article] [PubMed] [Google Scholar]
- 47.Tully SE, Rawat M & Hsieh-Wilson LC Discovery of a TNF-alpha antagonist using chondroitin sulfate microarrays. J. Am. Chem. Soc 128, 7740–7741 (2006). [DOI] [PubMed] [Google Scholar]
- 48.Waterhouse A et al. SWISS-MODEL: homology modelling of protein structures and complexes. Nucleic Acids Res. 46, W296–W303 (2018). [DOI] [PMC free article] [PubMed] [Google Scholar]
- 49.Mayo SL, Olafson BD & Goddard III WA DREIDING: a generic force field for molecular simulations. J. Phys. Chem 94, 8897–8909 (1990). [Google Scholar]
- 50.Kutner RH, Zhang X-Y & Reiser J Production, concentration and titration of pseudotyped HIV-1-based lentiviral vectors. Nat. Protoc 4, 495–505 (2009). [DOI] [PubMed] [Google Scholar]
- 51.Montague TG, Cruz JM, Gagnon JA, Church GM & Valen E CHOPCHOP: a CRISPR/Cas9 and TALEN web tool for genome editing. Nucleic Acids Res. 42, W401–407 (2014). [DOI] [PMC free article] [PubMed] [Google Scholar]
- 52.Mashiko D et al. Generation of mutant mice by pronuclear injection of circular plasmid expressing Cas9 and single guided RNA. Sci. Rep 3, 3355 (2013). [DOI] [PMC free article] [PubMed] [Google Scholar]
- 53.Wang H et al. One-step generation of mice carrying mutations in multiple genes by CRISPR/Cas-mediated genome engineering. Cell 153, 910–918 (2013). [DOI] [PMC free article] [PubMed] [Google Scholar]
Associated Data
This section collects any data citations, data availability statements, or supplementary materials included in this article.


