

Keywords: choline, CYP2E1, IL-1β, lipid peroxidation, 3-NT
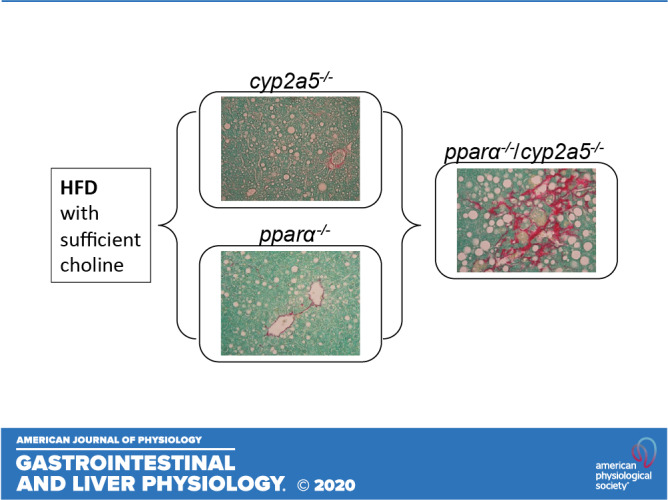
PPARα is upregulated in cyp2a5−/− mice, but HFD-induced steatosis is still deteriorated. PPARα abrogation makes cyp2a5−/− mice more sensitive to HFD-induced steatosis, liver inflammation, and fibrosis, suggesting that PPARα upregulation in cyp2a5−/− mice is a compensation response. HFD-induced liver inflammation, fibrosis, and nitrotyrosine formation in pparα−/−/cyp2a5−/− mice are all within clusters of lipid droplets, and lipid droplets are all within CYP2E1-positive area.
Abstract
Obesity is linked to nonalcoholic steatohepatitis. Peroxisome proliferator-activated receptor-α (PPARα) regulates lipid metabolism. Cytochrome P-450 2A5 (CYP2A5) is a potential antioxidant and CYP2A5 induction by ethanol is CYP2E1 dependent. High-fat diet (HFD)-induced obesity and steatosis are more severe in CYP2A5 knockout (cyp2a5−/−) mice than in wild-type mice although PPARα is elevated in cyp2a5−/− mice. To examine why the upregulated PPARα failed to prevent the enhanced steatosis in cyp2a5−/− mice, we abrogate the upregulated PPARα in cyp2a5−/− mice by cross-breeding cyp2a5−/− mice with PPARα knockout (pparα−/−) mice to create pparα−/−/cyp2a5−/− mice. The pparα−/−/cyp2a5−/− mice, pparα−/− mice, and cyp2a5−/− mice were fed HFD to induce steatosis. After HFD feeding, more severe steatosis was developed in pparα−/−/cyp2a5−/− mice than in pparα−/− mice and cyp2a5−/− mice. The pparα−/−/cyp2a5−/− mice and pparα−/−mice exhibited comparable and impaired lipid metabolism. Elevated serum alanine transaminase and liver interleukin-1β, liver inflammatory cell infiltration, and foci of hepatocellular ballooning were observed in pparα−/−/cyp2a5−/− mice but not in pparα−/− mice and cyp2a5−/− mice. In pparα−/−/cyp2a5−/− mice, although redox-sensitive transcription factor nuclear factor erythroid 2-related factor 2 and its target antioxidant genes were upregulated as a compensation, thioredoxin was suppressed, and phosphorylation of JNK and formation of nitrotyrosine adduct were increased. Liver glutathione was decreased, and lipid peroxidation was increased. Interestingly, inflammation and fibrosis were all observed within the clusters of lipid droplets, and these lipid droplet clusters were all located inside the area with CYP2E1-positive staining. These results suggest that HFD-induced fibrosis in pparα−/−/cyp2a5−/− mice is associated with steatosis, and CYP2A5 interacts with PPARα to participate in regulating steatohepatitis-associated fibrosis.
NEW & NOTEWORTHY PPARα is upregulated in cyp2a5−/− mice, but HFD-induced steatosis is still deteriorated. PPARα abrogation makes cyp2a5−/− mice more sensitive to HFD-induced steatosis, liver inflammation, and fibrosis, suggesting that PPARα upregulation in cyp2a5−/− mice is a compensation response. HFD-induced liver inflammation, fibrosis, and nitrotyrosine formation in pparα−/−/cyp2a5−/− mice are all within clusters of lipid droplets, and lipid droplets are all within CYP2E1-positive area.
INTRODUCTION
Obesity is closely linked with nonalcoholic fatty liver disease (NAFLD). In all obese individuals, prevalence of NAFLD is up to 90% (30). When adipose triglyceride (TG) is under lipolysis, free fatty acids (FFA) are released in blood and absorbed by liver for resynthesis of TG in endoplasmic reticulum (ER). Newly synthesized TG binds to apolipoprotein B (apo B) to be released in blood in the form of very low-density lipoprotein (VLDL). If TG is accumulated in liver, TG binds to adipose differentiation-related protein (ADRP) to form lipid droplets, and hepatic steatosis (fatty liver) will be formed (38). The early stages of hepatic steatosis are primarily asymptomatic; however, the long-term fatty liver leads to nonalcoholic steatohepatitis (NASH), NASH-associated fibrosis and cirrhosis, and even liver cancer [hepatocellular carcinoma (HCC); see Ref. 2]. In experimental animal models, high-fat diet (HFD)-induced obesity and hepatic steatosis are common in mice, whereas fibrosis and cirrhosis and HCC are rare (27, 42). To induce full range of NAFLD, including NASH, fibrosis, and HCC, choline-deficient HFD is usually used (42).
Previously when we studied cytochrome P-450 2A6 (CYP2A6) and its mouse ortholog CYP2A5 in the development of alcohol-associated fatty liver disease (ALD), we found that alcohol feeding induces CYP2A5 in mouse liver (21, 23), and ALD was more severe in cyp2a5 knockout (cyp2a5−/−) mice than in wild-type (WT) mice, suggesting that CYP2A5 protects against ALD (4, 12). The protective effects of CYP2A5 are also observed in NAFLD, i.e., HFD-induced obesity and hepatic steatosis are also more severe in cyp2a5−/− mice than in WT mice (39). Interestingly, the basal level of peroxisome proliferator-activated receptor α (PPARα) was elevated in the cyp2a5−/− mice (4, 12, 39). PPARα is a well-known lipid metabolism regulator. Global or organ-specific abrogation of peroxisome proliferator-activated receptor-α (pparα) deteriorated abnormal lipid metabolism in mice (25). PPARα agonist prevented obesity in ob/ob obese mice (14), and pparα absence in ob/ob obese mice makes the mice more obese (9), suggesting that PPARα protects against obesity. PPARα also regulates fatty acid oxidation (FAO) and protects against hepatic steatosis (17). For example, expression of PPARα in human liver is reduced in NASH patients and negatively correlates with NASH severity (7, 32, 33). To examine why the upregulated PPARα failed to prevent the enhanced obesity and steatosis in cyp2a5−/− mice, we designed a model to abrogate the upregulated PPARα in cyp2a5−/− mice by crossing cyp2a5−/− mice with pparα knockout (pparα−/−) mice to create pparα−/−/cyp2a5−/− mice. In response to HFD feeding, the female pparα−/−/cyp2a5−/− mice developed more severe steatosis, which suggests that PPARα interacts with CYP2A5 to protect against steatosis (39). In this study, we report that PPARα interacts with CYP2A5 to participate in regulating the development of steatohepatitis-associated fibrosis in male mice.
MATERIALS AND METHODS
Antibodies and biochemical assay kits.
Anti-CYP2A5 antibody was a gift from Dr. Risto Juvonen (Department of Pharmacology and Toxicology, University of Kuopio, Kuopio, Finland) and anti-CYP2E1 was a gift from Dr. Jerome Lasker (Hackensack Biomedical Research Institute, Hackensack, NJ). The other antibodies and assay kits are listed in Supplemental Table S1 (all supplemental material can be found at https://doi.org/10.6084/m9.figshare.12407261.v2).
Animals and treatments.
The colony of cyp2a5−/− mice was created by crossing male C57BL/6 cyp2a5−/− mice (kindly provided by Dr. Xinxin Ding, SUNY College of Nanoscale Science and Engineering, Albany, NY) and female C57BL/6 mice (purchased from Charles River Laboratory). Littermates (cyp2a5+/+) were bred as a colony of WT control. The pparα−/− mice were purchased from Jackson Laboratory (strain no. 008154). The colony of pparα−/−/cyp2a5−/− mice (designated as P−/A− mice) was created by crossing the pparα−/− mice with cyp2a5−/− mice. Littermates expressing pparα but not expressing cyp2a5 (P+/A− mice, equivalent to cyp2a5−/− mice) and expressing cyp2a5 but not expressing pparα (P−/A+ mice, equivalent to pparα−/− mice) were also set up as new colonies. All of the mice were housed in temperature-controlled animal facilities with 12:12-h light-dark cycles and were permitted consumption of tap water and Purina standard chow ad libitum. The mice received humane care, and experiments were carried out according to the criteria outlined in the Guide for the Care and Use of Laboratory Animals. The animal studies were approved by Institutional Animal Care and Use Committees.
Male, 7- to 8-wk-old mice were fed HFD to induce NAFLD. The mice in control groups were fed control diet (CD). The diets were purchased from Bio-Serv company (Frenchtown, NJ). The diets contain dl-methionine (7.1 g/kg in both HFD and CD) and choline chloride (1,148 mg/kg in HFD and 1,005 mg/kg in CD). In HFD, 60% calories are from fat, but in CD 16% calories are from fat. HFD and CD contain the same amount (20.5%) of protein. The mice were grouped as follows: 1) P−/A− CD (n = 4); 2) P−/A− HFD (n = 4); 3) P+/A− CD (n = 5); 4) P+/A− HFD (n = 5); 5) P−/A+ CD (n = 5); and 6) P−/A+ HFD (n = 5). All mice were permitted consumption of tap water and HFD or CD ad libitum.
Mouse body weight and diet consumption were measured weekly. The mice were euthanized following an overnight fast (15 h). Blood was collected for serum biochemical assays using commercially available kits (Supplemental Table S1). The livers were rapidly excised into fragments and washed with cold saline. Liver tissues from left lobes were preserved in neutral formalin solution for paraffin bedding. The other liver tissue aliquots were stored at −80°C for future assays.
Liver total glutathione, thiobarbituric acid reactive substances, interleukin-1β, and tumor necrosis factor-α.
Liver tissues (200 mg) were homogenized in 0.5 mL 0.15 M potassium chloride (KCl), and the homogenates were centrifuged at 10,000 g under 4°C. On the top of supernatants there is a layer of white fat, which was carefully taken with supernatants (total 100 µL) for thiobarbituric acid reactive substances (TBARS) assay. The supernatants without fat were aliquoted for tumor necrosis factor-α (TNF-α, 50 µL), interleukin-1β (IL-1β, 50 µL), and glutathione (GSH) assay (50 µL). For TNF-α and IL-1β, supernatants were directly used for the assays using ELISA kits purchased from R&D Systems (Supplemental Table S1). For TBARS, 0.1 mL of the samples was incubated with 0.2 mL of 0.25 N HCl solution containing 15% (wt/vol) trichloroacetic acid (TCA) and 0.375% (wt/vol) thiobarbituric acid (TBA) in a boiling water bath for 5 min. The TBARS was extracted by 0.3 mL of 15:1 butanol-pyridine solution for reading at 535 nm (20). 1,1,3,3-Tetraethoxypropane (TEP) was used as a positive control. For GSH assay, 50 µL supernatants were mixed with 50 µL 10% TCA followed by centrifuging 10,000 g under 4°C to exclude the denatured protein. GSH assay kit from Cayman was used (Supplemental Table S1).
Statistical analysis.
Results are expressed as means ± SE. Statistical evaluation was carried out using two-way analysis of variance (ANOVA followed by the Student-Newman-Keuls post hoc test). P < 0.05 was considered as statistical significance.
For other methods, including liver histology, Western blotting analyses, nuclear factor erythroid 2-related factor 2 (Nrf2)- and PPARα-binding activity assay, and RNA sequencing, please see the Supplemental document under materials and methods.
RESULTS
HFD-induced steatosis is more pronounced in cyp2a5−/− mice than in WT mice.
Male cyp2a5−/− mice and WT mice were fed HFD for 8 wk. Starting from the 2nd wk through the end of the HFD feeding, body weights were higher in HFD-fed cyp2a5−/− mice than in HFD-fed WT mice (Supplemental Fig. S1A). Expectedly, HFD-induced fatty liver as indicated by lipid droplets in H&E-stained liver sections was more pronounced in cyp2a5−/− mice than in WT mice (Supplemental Fig S1B). These results suggest that cyp2a5−/− mice developed more severe obesity and steatosis than WT mice, which is consistent with our previous report with female mice (39).
HFD-induced steatosis is more pronounced in P−/A− mice than in P+/A− mice and P−/A+ mice.
The P−/A− mice, P+/A− mice, and P−/A+ mice were genotyped by tail DNA samples. To further prove the identity of these mice, PPARα DNA-binding activity and hepatic CYP2A5 expression were measured. PPARα-binding activity was much lower in P−/A− mice and P−/A+ mice than in P+/A− mice (Fig. 1A). While liver CYP2A5 was expressed in P−/A+ mice, it was undetectable in P−/A− mice and P+/A− mice (Fig. 1B). Male P−/A− mice, P+/A− mice, and P−/A+ mice were fed HFD for 14 wk. Body weights were increased in P−/A− mice to a greater extent than in P−/A+ mice, but to a less extent than in P+/A− mice (Fig. 1C). Liver TG contents were increased by HFD feeding in P−/A− mice to a greater extent than in P+/A− mice and P−/A+ mice (Fig. 1D). Consistently, HFD induced more lipid droplets in liver (macrovacuoles in liver sections with H&E staining) in P−/A− mice than in P+/A− mice and P−/A+ mice (Fig. 1E, Supplemental Table S3). IHC staining indicates that most vacuoles were positive for ADRP, a lipid droplet coat protein (Fig. 1F). These results suggest that HFD-induced steatosis is more pronounced in P−/A− mice than in P+/A− mice and P−/A+ mice.
Fig. 1.
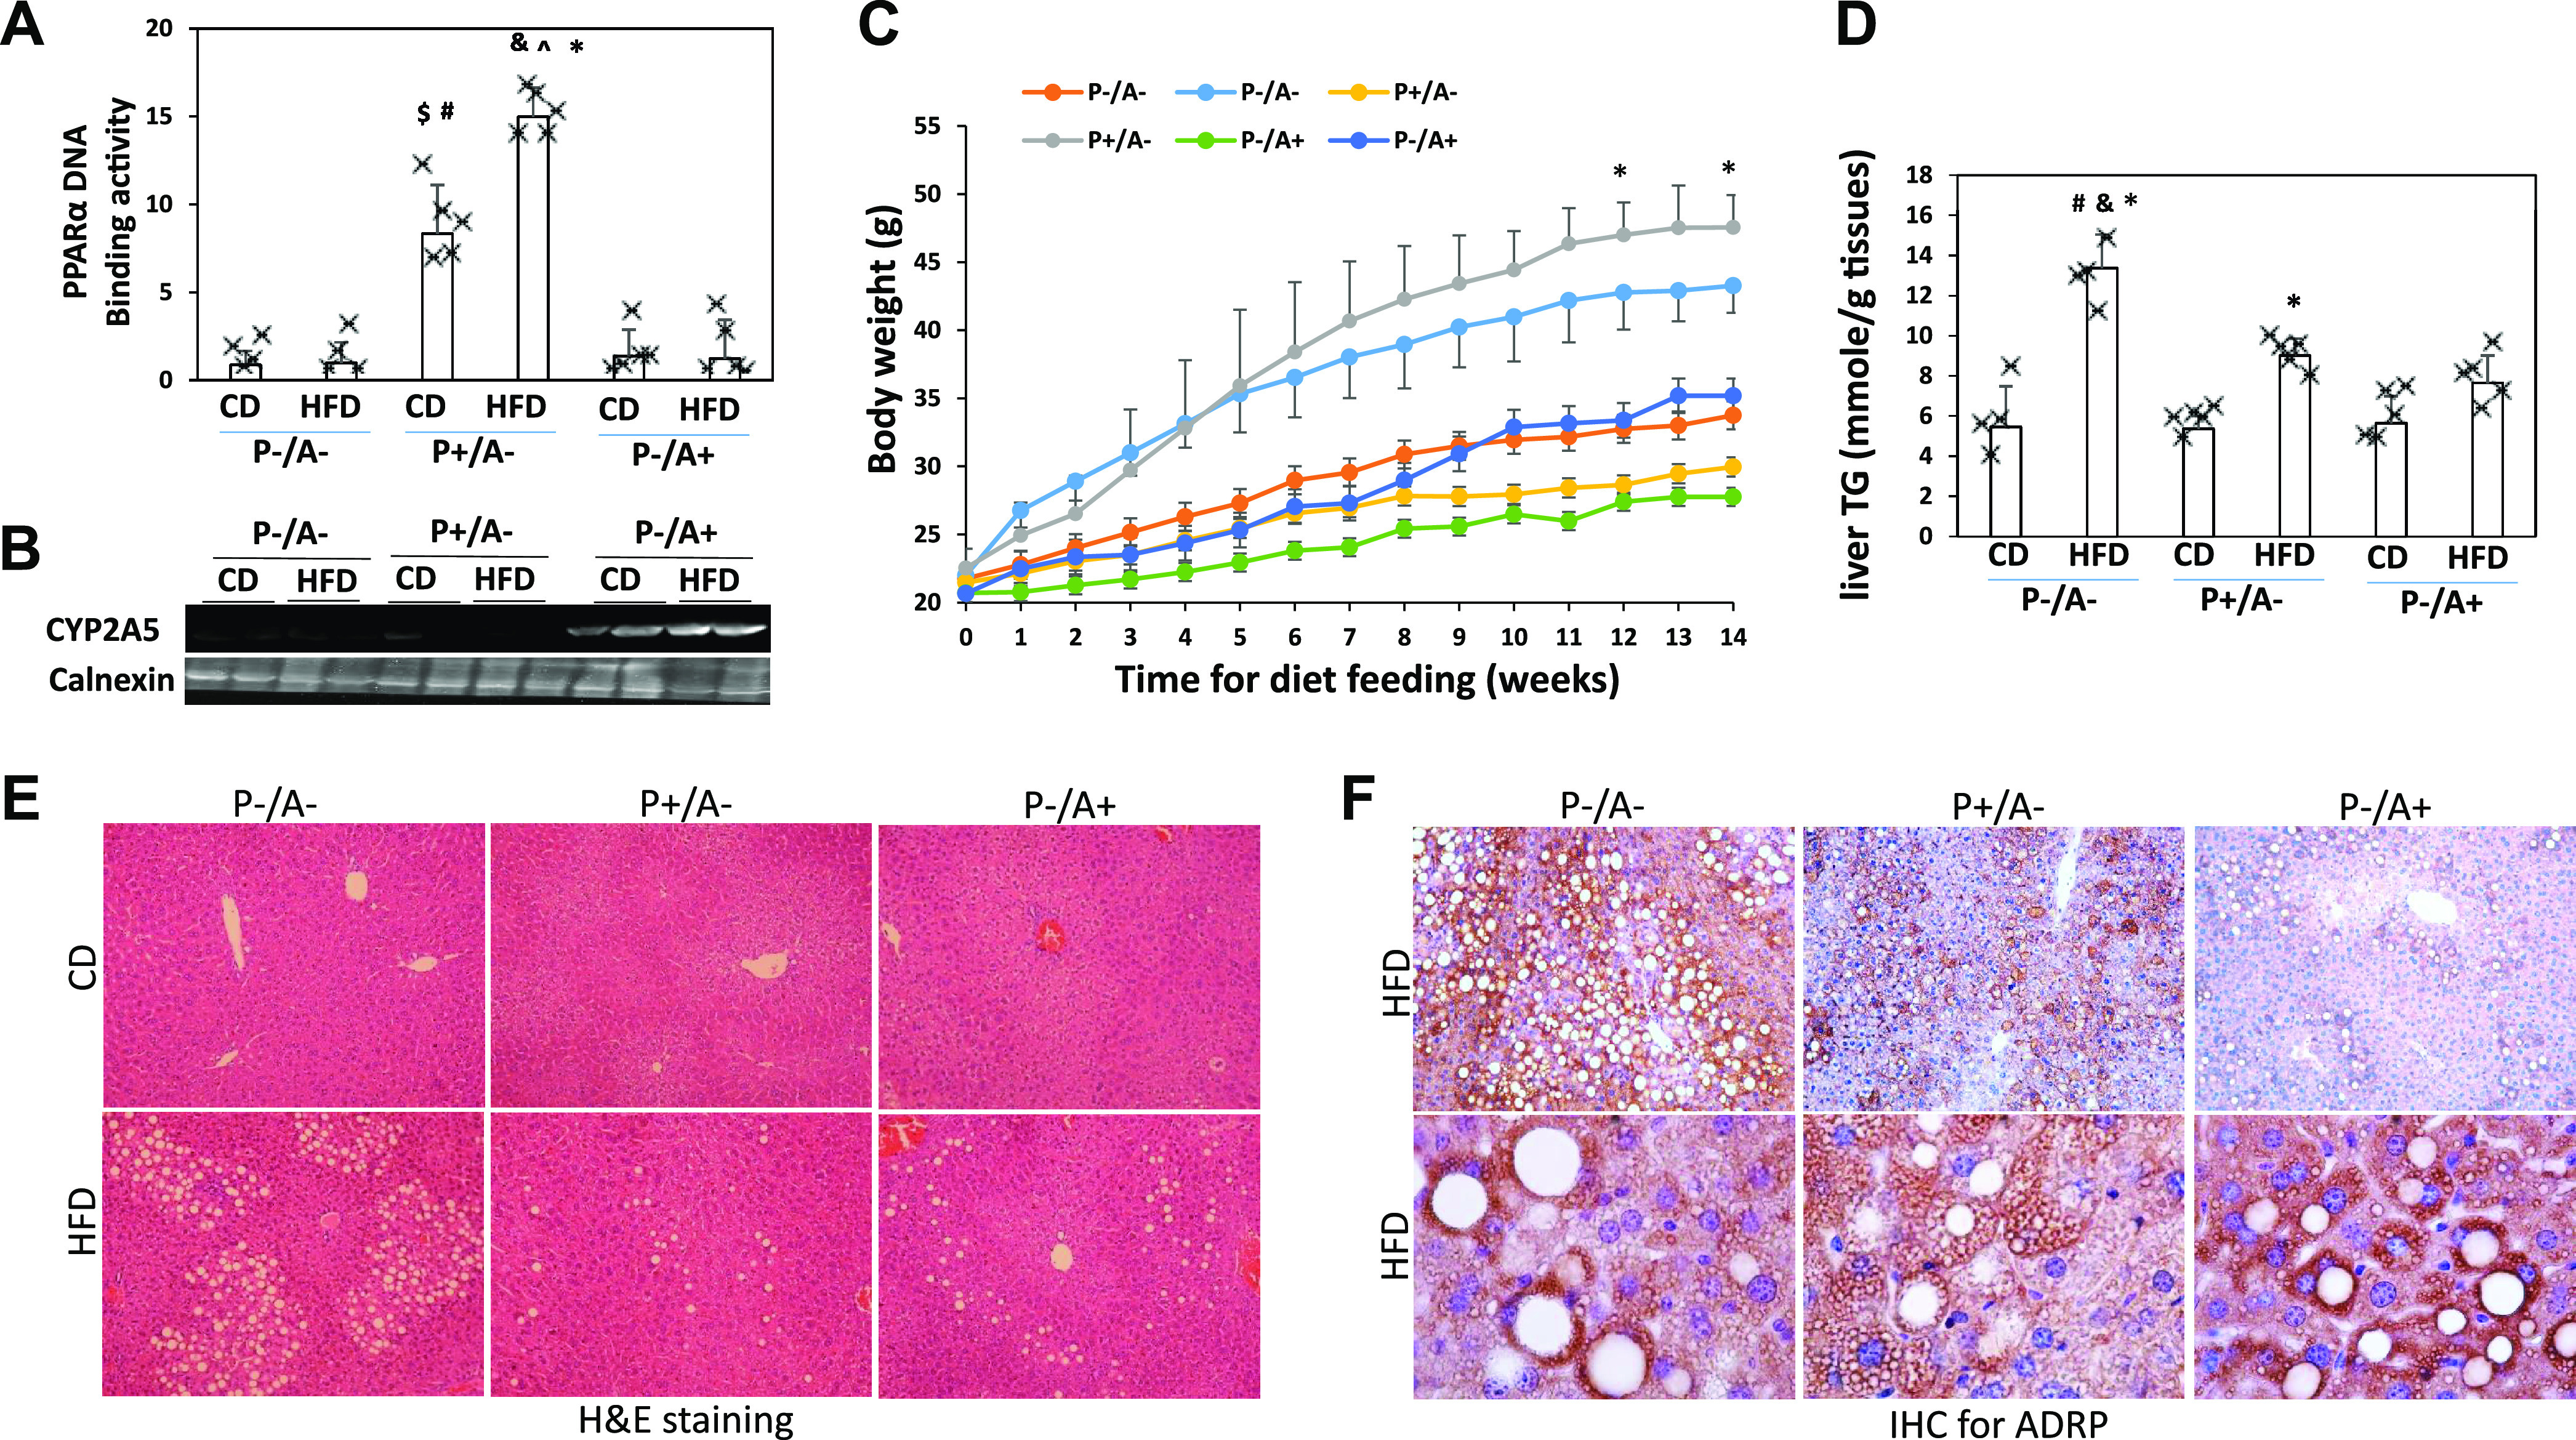
High-fat diet (HFD)-induced hepatic steatosis is more severe in peroxisome proliferator-activated receptor-α knockout (pparα−/−)/cytochrome P-450 2A5 knockout (cyp2a5−/−) mice (P−/A−) than in mice expressing cyp2a5 but not expressing pparα (P−/A+) and mice expressing pparα but not expressing cyp2a5 (P+/A−). A: liver nuclear peroxisome proliferator-activated receptor α (PPARα) DNA-binding activity (n = 4–5 mice). *P < 0.05 compared with P−/A− control diet (CD) group; $P < 0.05 compared with P−/A− CD group; #P < 0.05 compared with P−/A+ CD group; &P < 0.05 compared with P−/A− HFD group; ^P < 0.05 compared with P−/A+ HFD group. B: liver expression of cytochrome P-450 2A5 (CYP2A5). C: body weight (n = 4–5 mice). *P < 0.05 compared with P−/A− HFD group. D: liver contents of triglyceride (TG, n = 4–5 mice). *P < 0.05 compared with corresponding CD group; #P < 0.05 compared with P+/A− HFD group; &P < 0.05 compared with P−/A+ HFD group. E: liver sections with H&E staining. F: adipose differentiation-related protein (ADRP) IHC staining.
HFD induces steatohepatitis in P−/A− mice rather than in P+/A− mice or P−/A+ mice.
In response to HFD, P+/A− mice and P−/A+ mice developed mainly steatosis, occasionally some small inflammatory foci were observed, but, in P−/A− mice, usually larger inflammatory foci were observed within the clusters of lipid droplets. Naphthol AS-D chloroacetate esterase (NASDCA) staining for neutrophil was negative in these inflammatory foci although the single separated positive staining was observed (Fig. 2A). HFD-induced inflammatory cell infiltration was observed in P−/A− mice but not in P+/A− mice and P−/A+ mice; some satellite-like inflammatory cells are surrounding lipid droplets (satellitosis) (Fig. 2B). F4/80, a marker of macrophage, was positively stained in the infiltrated inflammatory cells (Fig. 2C). CD3, a marker of T cells, was partially stained, but CD335, a marker of NK cells, was negative (Fig. 2C). Specifically, in HFD-fed P−/A− mice, foci of hepatocellular ballooning were observed. The foci look like coagulative necrosis. These foci also exhibited vesicular changes, but ADRP staining was negative (Fig. 2D). The cells in foci were negatively stained for Ki-67, a biomarker for cell proliferation, and α-fetoprotein (AFP), a marker for cell dedifferentiation (Fig. 2D), suggesting that foci are not cancerous. Instead, the foci were positive for collagen type I (Fig. 2D), suggesting that they are associated with fibrosis. Consistent with the NASH pathological changes, serum alanine transaminase (ALT) was increased only in HFD-fed P−/A− mice (Fig. 2E). Inflammatory cytokine IL-1β was also increased only in livers from HFD-fed P−/A− mice (Fig. 2F). These results suggest that HFD induces steatohepatitis in P−/A− mice but not in P+/A− mice and P−/A+ mice.
Fig. 2.
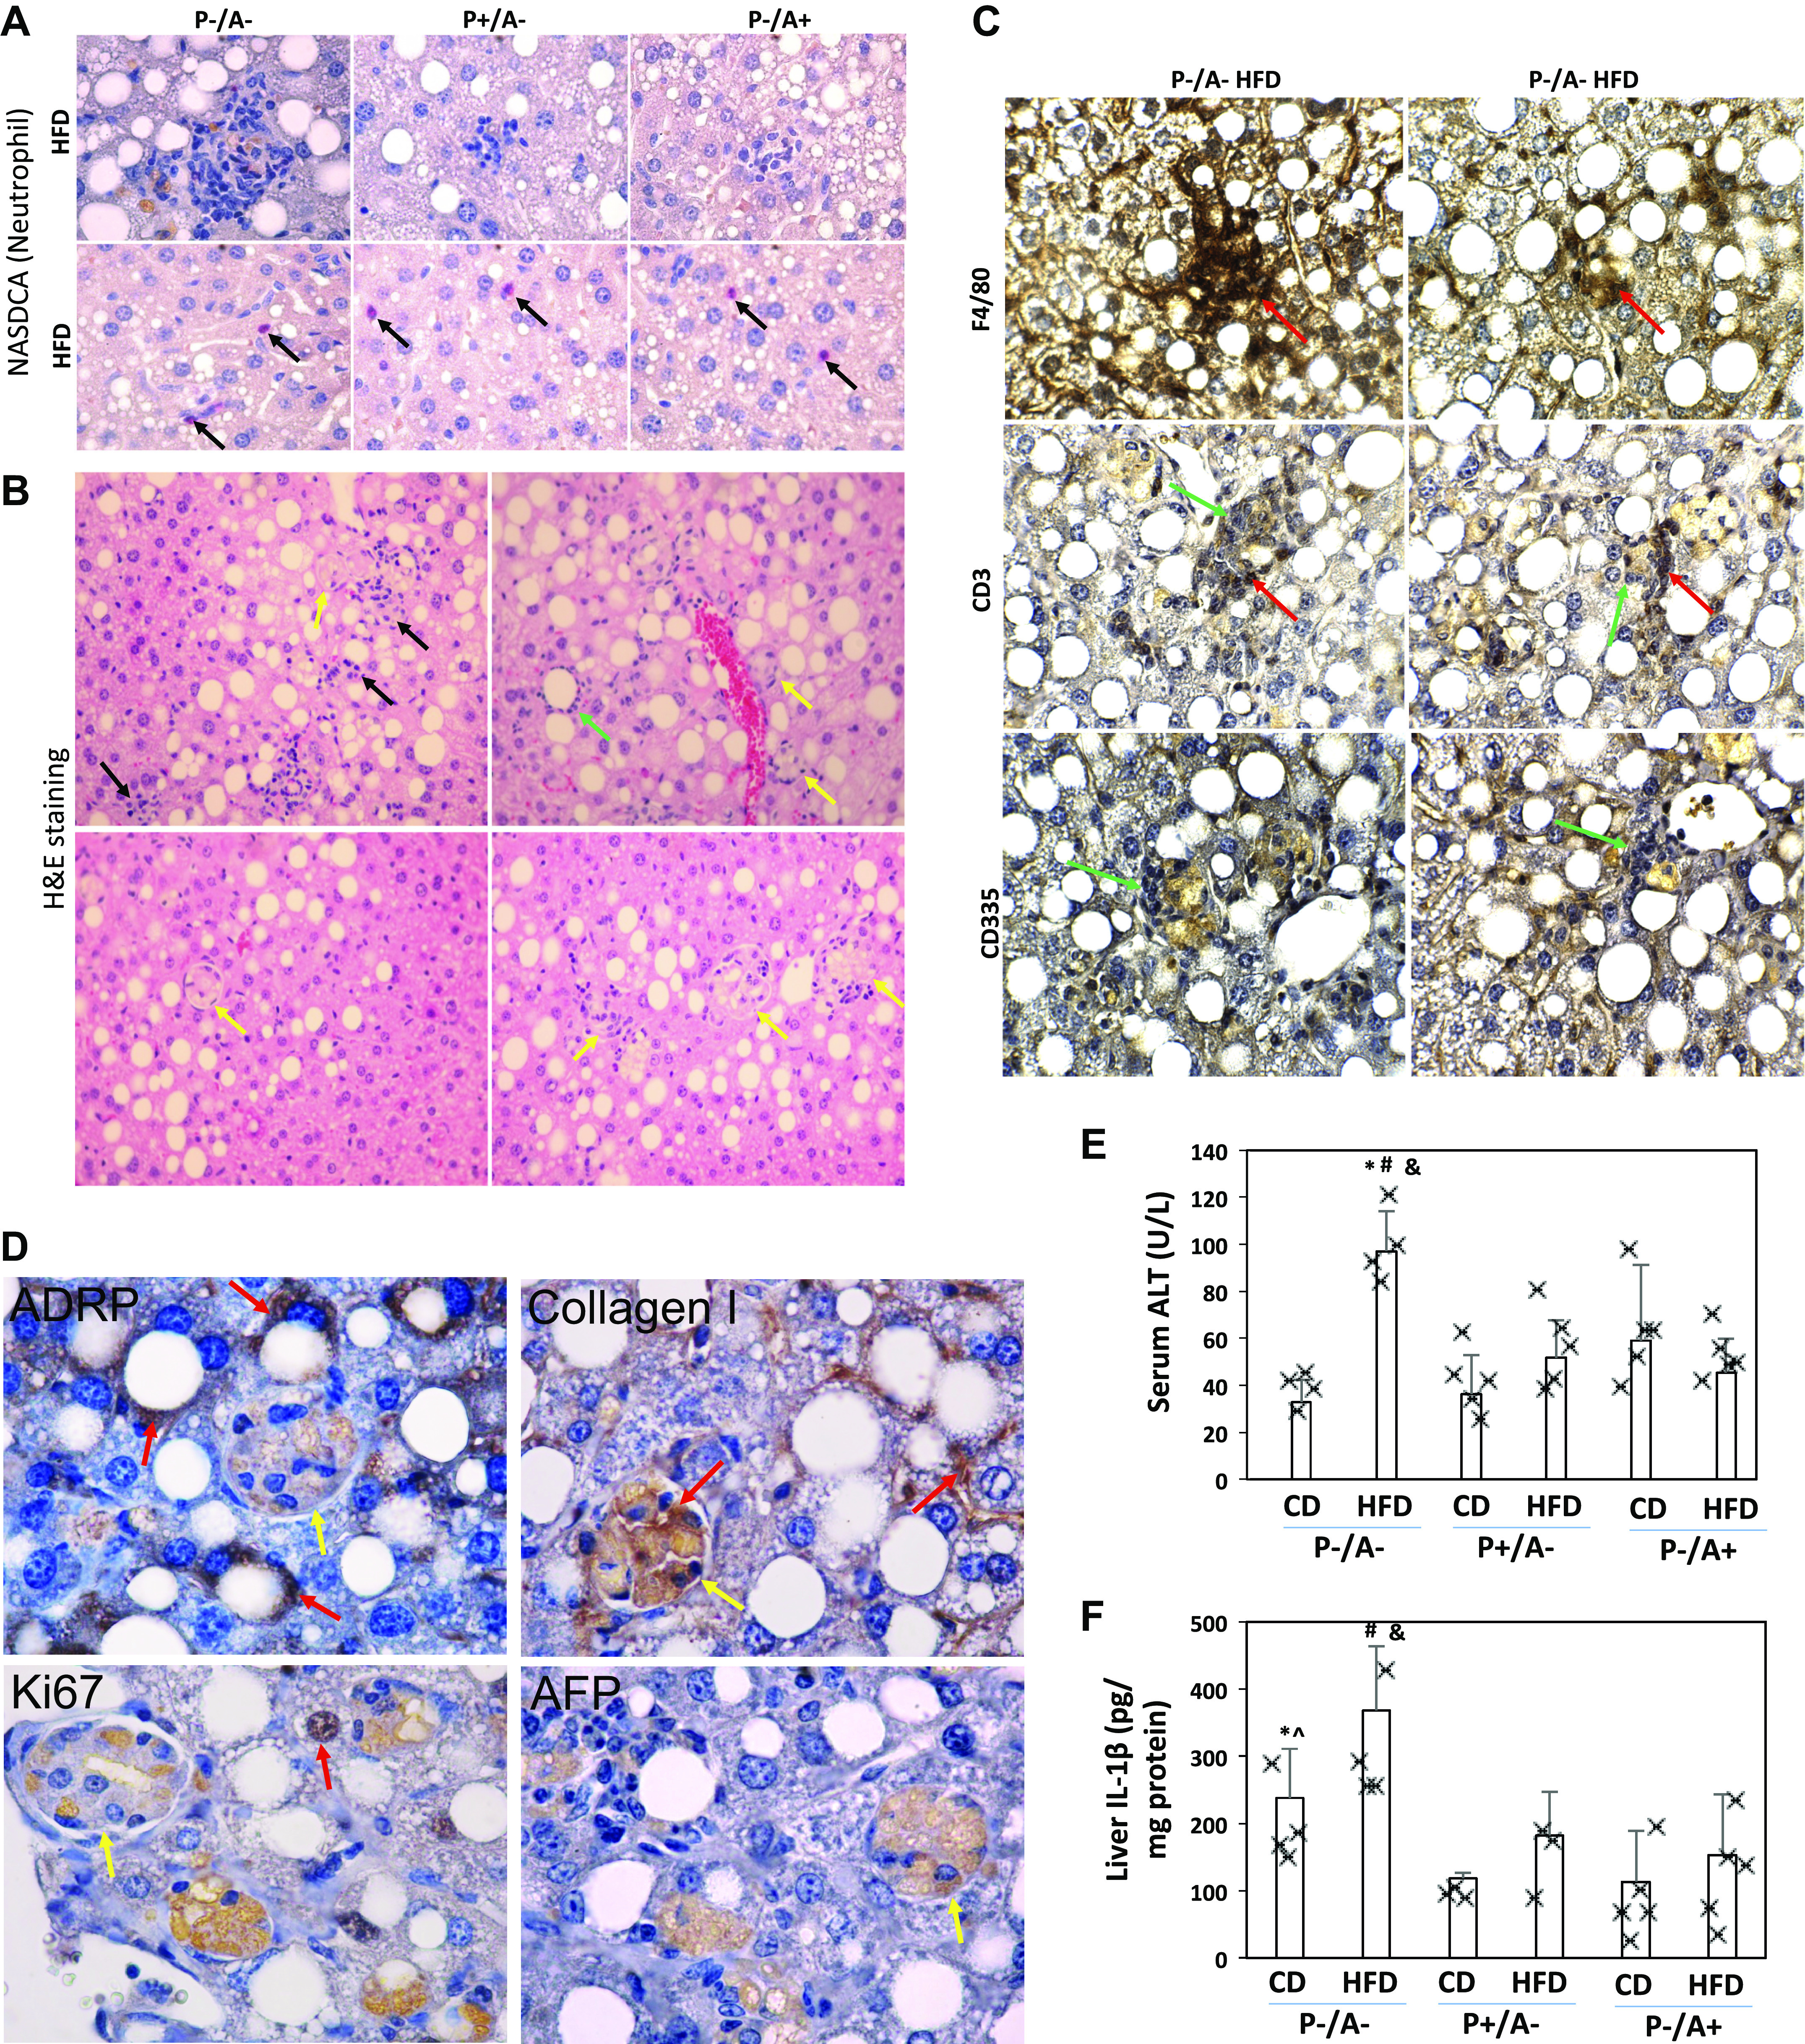
High-fat diet (HFD) induces steatohepatitis in peroxisome proliferator-activated receptor-α knockout (pparα−/−)/cytochrome P-450 2A5 knockout (cyp2a5−/−) mice (P−/A−) rather than in mice expressing cyp2a5 but not expressing pparα (P−/A+) and mice expressing pparα but not expressing cyp2a5 (P+/A−). A: neutrophil [naphthol AS-D chloroacetate esterase (NASDCA)] staining. Top, negative staining in the foci; arrows on bottom show isolated positive staining. B: H&E staining in liver sections from HFD-fed P−/A− mice. Black arrows show inflammatory infiltration; a green arrow shows a lipid droplet surrounded by inflammatory cells; yellow arrows show foci of hepatocellular ballooning fibrosis. C: IHC for CD3, F4/80, and CD335 in liver sections from HFD-fed P−/A− mice. Red arrows show positive staining, and green arrows show negative staining. D: IHC for adipose differentiation-related protein (ADRP), Ki-67, α-fetoprotein (AFP), and collagen I in liver sections from HFD-fed P−/A− mice. Red arrows show positive staining; yellow arrows show foci of hepatocellular ballooning. Note that foci of hepatocellular ballooning with negative staining have unspecific orange staining. E: serum alanine transaminase (ALT) level (n = 4–5 mice). *P < 0.05 compared with P−/A− control diet (CD) group; #P < 0.05 compared with P+/A− HFD group; &P < 0.05 compared with P−/A+ HFD group. F: liver contents of interleukin-1β (IL-1β, n = 3–5 mice). *P < 0.05 compared with P+/A− CD group; ^P < 0.05 compared with P−/A+ CD group; #P < 0.05 compared with P+/A− HFD group; &P < 0.05 compared with P−/A+ HFD group.
HFD induces liver fibrosis in P−/A− mice but not in P+/A− mice and P−/A+ mice.
Sirius Red staining and Masson’s trichrome staining shows that HFD-induced moderate dense zone 3 perisinusoidal fibrosis was evident in P−/A− mice, but P−/A+ mice exhibited mild delicate zone 3 perisinusoidal fibrosis. Fibrosis was not detected in P+/A− mice (Fig. 3A and Supplemental Table S3). RNA sequencing indicates that, after HFD feeding, collagen genes were upregulated: 3 genes in P−/A+ mice, 2 genes in P+/A− mice, and 10 genes in P−/A− mice (Supplemental Table S2). Col3a1 and Col5a3 were upregulated in all HFD-fed mice. While Col5a3 upregulation was comparable among all the mice, Col3a1 was upregulated in P−/A− mice to a greater extent than in P−/A+ mice and P+/A− mice. Interestingly, Col1a1 was upregulated in P−/A− mice to a greater extent than in P−/A+ mice, but Col1a1 was not upregulated in P+/A− mice, suggesting that Col1a1 is essential for the HFD-induced fibrosis. The foci of hepatocellular ballooning were usually surrounded by collagenous fibers in P−/A− mice (Fig. 3A). Consistently, α-smooth muscle actin (α-SMA), a marker of activated hepatic stellate cells (HSC), was only observed in HFD-fed P−/A− mice (Fig. 3B). The increased α-SMA and collagen type I were further confirmed by Western blotting analysis (Supplemental Fig S2). Interestingly, the fibrosis was pericellular and perisinusoidal fibrosis and was identified within clusters of lipid droplets around central veins (Fig. 3C), indicating that the fibrosis is closely associated with steatosis, so we call it steatofibrosis in an attempt to distinguish from necrofibrosis, which usually forms bridges from portal veins to central veins and is associated with massive confluent hepatocyte necrosis, e.g., thioacetamide (TAA)-induced necrofibrosis (Fig. 3D). This steatofibrosis is also different from liver fibrosis induced by multiple binges on chronic ethanol feeding in humanized CYP2E1 knock-in mice (cyp2e1−/− KI mice; see Ref. 19), which is also necrofibrosis and independent of lipid droplets (Fig. 3D).
Fig. 3.
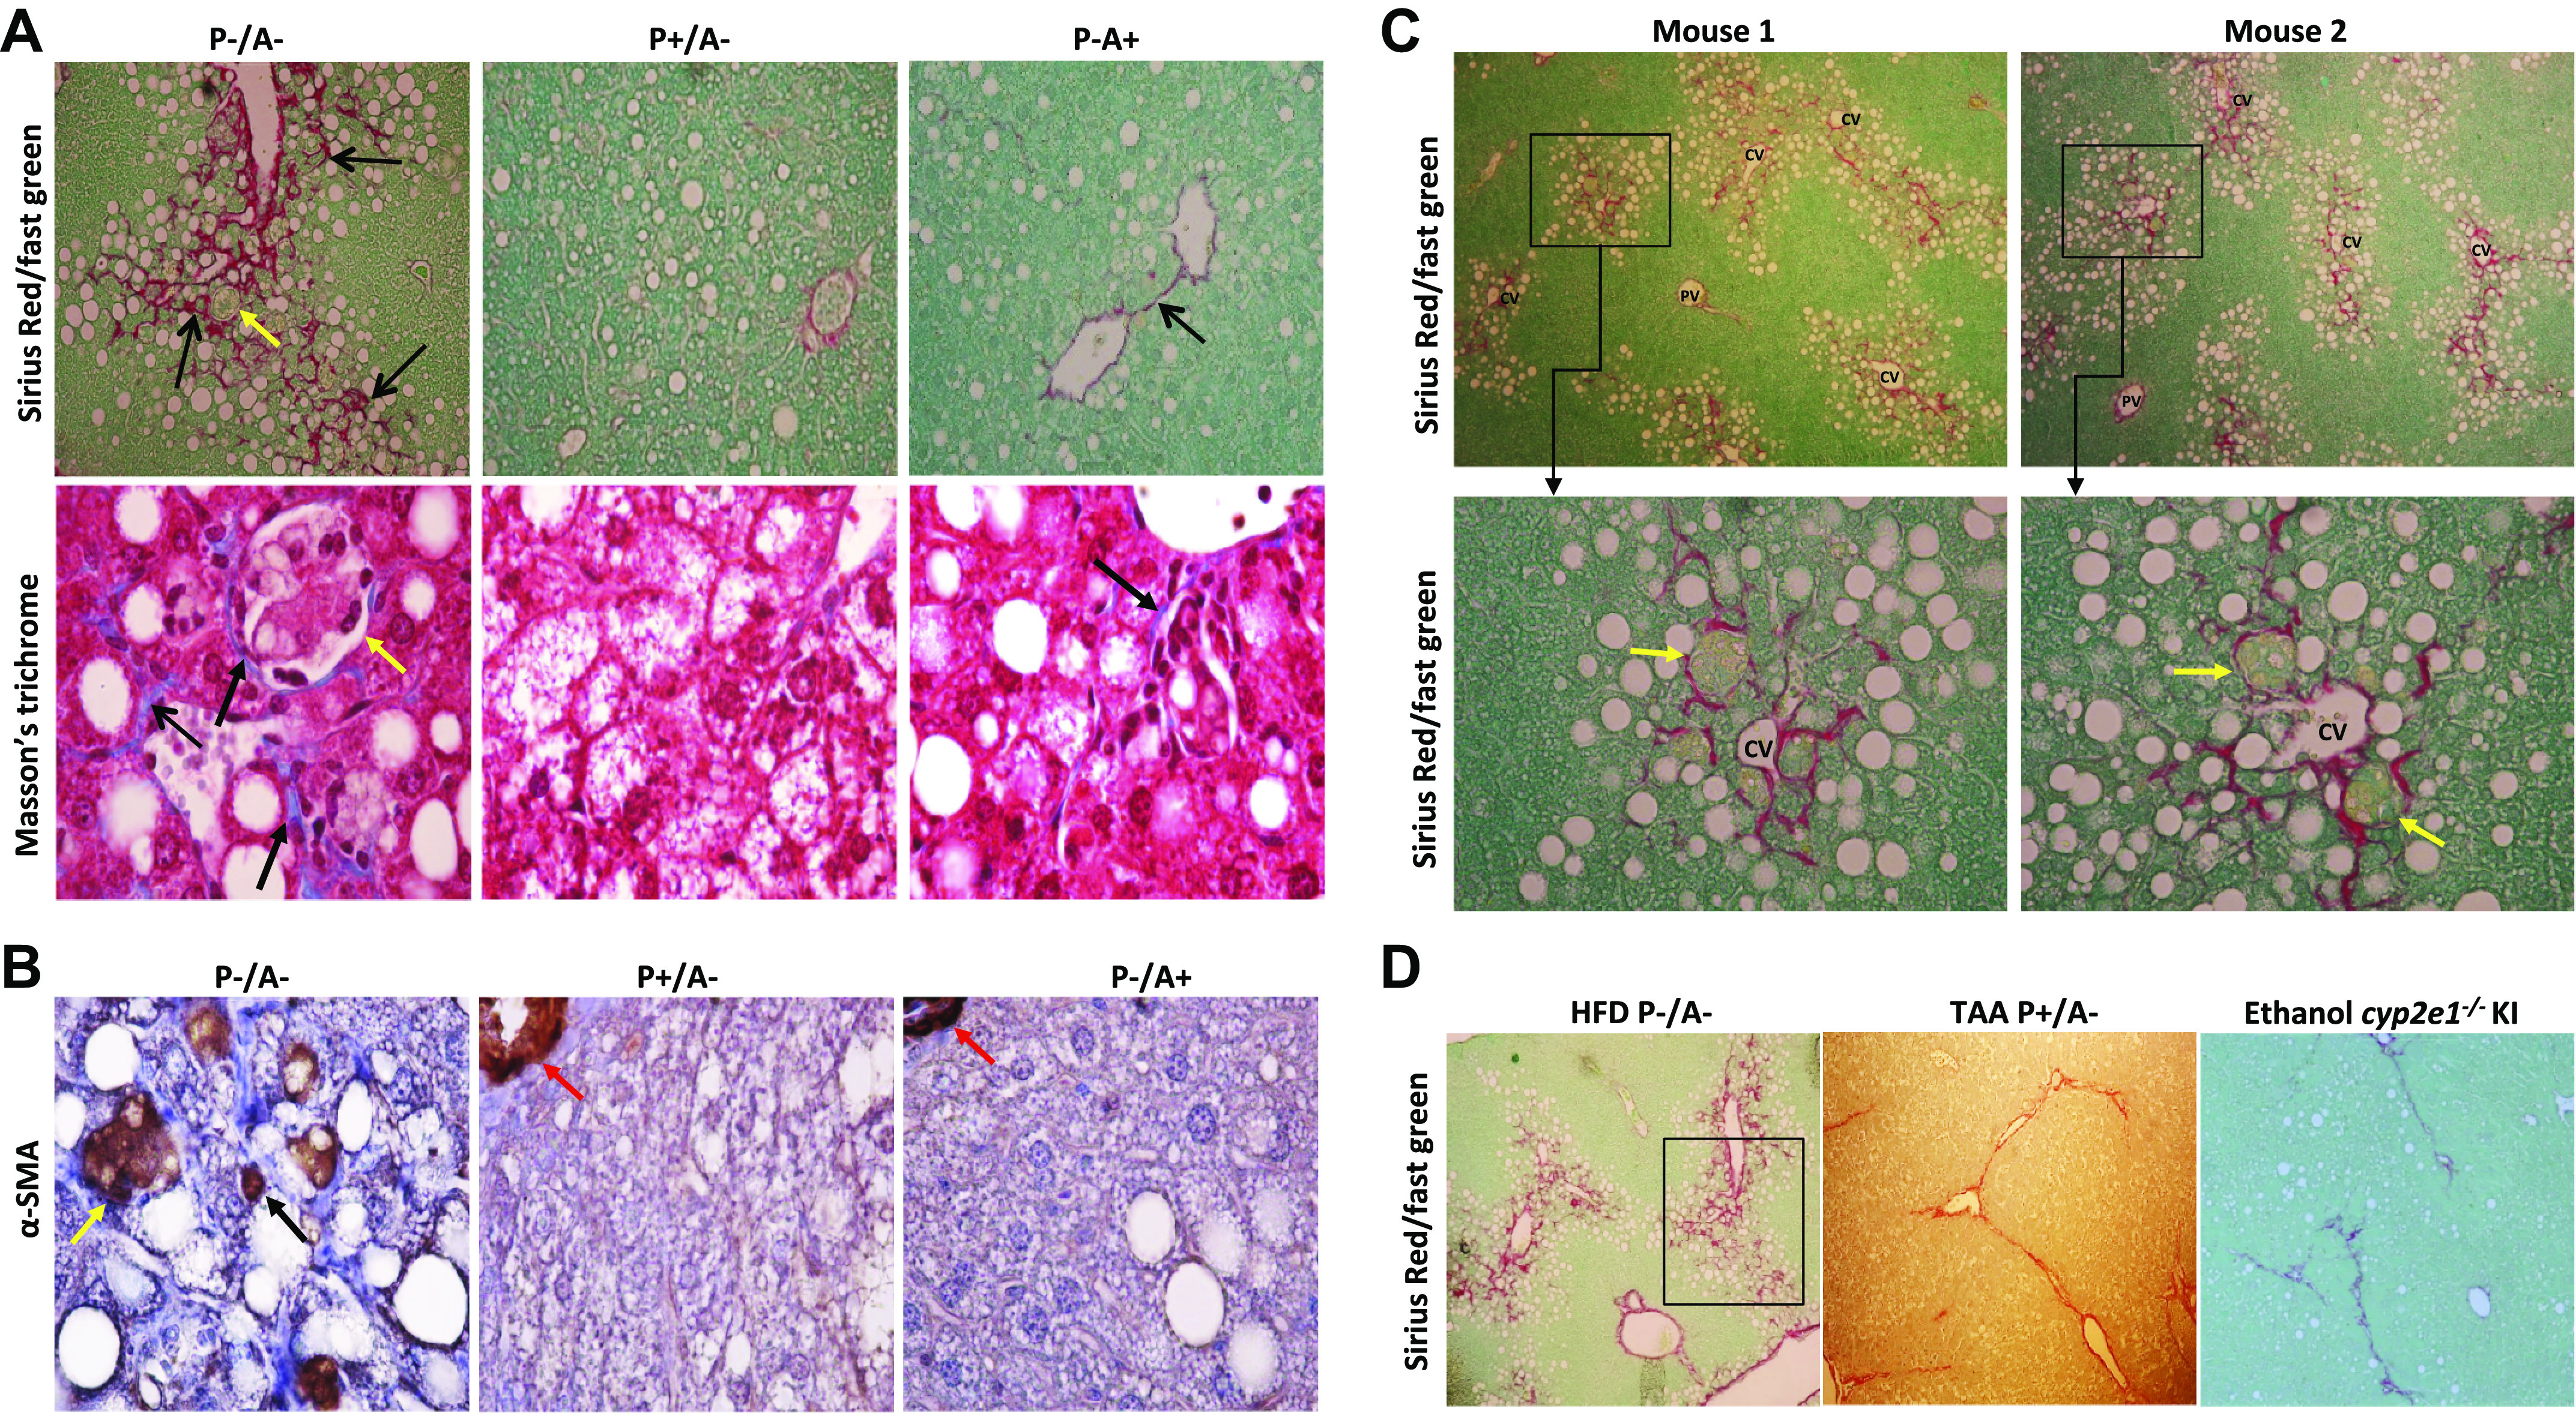
High-fat diet (HFD) induces steatofibrosis in peroxisome proliferator-activated receptor-α knockout (pparα−/−)/cytochrome P-450 2A5 knockout (cyp2a5−/−) mice (P−/A−) but not in mice expressing cyp2a5 but not expressing pparα (P−/A+) and mice expressing pparα but not expressing cyp2a5 (P+/A−). A: fibrosis was visualized by Sirius red/fast green staining (top) and Masson’s trichrome staining (bottom). Black arrows show positive staining, and yellow arrows show foci of hepatocellular ballooning. B: α-smooth muscle actin (α-SMA) staining. A black arrow shows positive staining, a yellow arrow shows foci of hepatocellular ballooning, and red arrows show blood vessel walls with positive staining. C: Sirius red/fast green staining in liver sections from HFD-fed P−/A− mice. Bottom, higher magnification of top. Yellow arrows show foci of hepatocellular ballooning. D: comparison of different fibrosis models. Left, HFD-induced steatofibrosis in P−/A− mice (squared area is shown in A with a higher magnification); middle, thioacetamide (TAA)-induced necrofibrosis in P+/A−mice (TAA was injected ip at 200 mg/kg two times a week for 30 days); right, necrofibrosis induced by binge-on-chronic ethanol in humanized cytochrome P-450 2E1 (CYP2E1) knock-in mice (cyp2e1−/− KI mice). The cyp2e1−/− KI mice were fed liquid ethanol diet for 5 wk, and binge ethanol was administrated by gavage at 5 g/kg one time per week for 5 times during the chronic ethanol feeding.
Previously we reported that cyp2a5−/− mice were more sensitive to TAA-induced necrofibrosis than WT mice (13). However, here, HFD feeding did not induce steatofibrosis in cyp2a5−/− mice-equivalent P+/A− mice, instead HFD-fed P−/A− mice developed steatofibrosis, suggesting that pparα absence is essential for the development of steatofibrosis. To identify biological pathways that contribute to steatofibrosis, differential gene expression analyses were performed following RNA sequencing. Those genes participating in metabolism-related biological pathways had a suppressed expression in the HFD-fed P−/A− mice compared with HFD-fed P+/A− mice. Among those 25 pathways with the lowest P values, eight suppressed pathways are related to lipid metabolism and four pathways involve pyruvate metabolism (Supplemental Table S4–1), suggesting that these suppressed metabolism pathways are regulated by PPARα. In addition, nine collagen genes were upregulated in the HFD-fed P−/A− mice compared with the HFD-fed P+/A−mice (Supplemental Table S5–1). These results suggest that the suppressed metabolism pathways in P−/A− mice are associated with steatofibrosis.
On the other hand, four collagen genes were upregulated in the HFD-fed P−/A− mice compared with the HFD-fed P−/A+ mice (Supplemental Table S5–2), and HFD-fed P−/A+ mice did not develop obvious steatofibrosis while evident steatofibrosis was observed in HFD-fed P−/A− mice. The differential gene expression analysis indicates that those pathways related to AUF1 (hnRNP D0) degrading mRNA were suppressed in the HFD-fed P−/A− mice compared with HFD-fed P−/A+ mice (Supplemental Table S4–2). AUF1 binds and destabilizes mRNAs encoding inflammatory cytokines like IL-1β and TNF-α (10). Inflammation is an important risk factor for the development of liver fibrosis (8). We did not observe an elevation of IL-1β and TNF-α in RNA sequencing data. We measured serum IL-1β and TNF-α. However, neither IL-1β nor TNF-α was detectable in serum. We further measured liver IL-1β and TNF-α. In liver, although TNF-α was still undetectable, IL-1β was elevated in P−/A− mice (Fig. 2F), implicating that IL-1β-mediated inflammation in liver may contribute to steatofibrosis in P−/A− mice.
Abnormal lipid metabolism is comparable in the P−/A− mice and P−/A+ mice.
PPARα mainly regulates hepatic lipid metabolism (17, 26, 33). Liver TG may come from adipose tissues (5). Serum glycerol, a marker of adipose lipolysis, was comparable in all HFD-fed groups of mice (Fig. 4A), suggesting that PPARα has no significant effect on adipose lipolysis. After an overnight fasting, serum TG is not from food but mainly secreted from liver. The observation that serum TG was comparable in all groups (Fig. 4B) suggests that PPARα does not influence liver TG secretion. Liver is the major organ to absorb FFA under fasting conditions. In P−/A− mice and P−/A+ mice, basal levels of serum FFA were higher than in P+/A−mice (Fig. 4C). In contrast to FFA, serum β-hydroxylbutyrate, a ketone body, was lower in P−/A− mice and P−/A+ mice than in P+/A−mice (Fig. 4D). Higher serum FFA and lower β-hydroxybutyrate levels reflect a markedly reduced rate of FAO, which is associated with the enhanced steatosis in pparα−/− mice (17). In hepatocytes, liver fatty acid-binding protein (L-FABP) delivers FFAs to PPARα (15), and PPARα regulates expression of L-FABP (25). Indeed, L-FABP was undetectable in P−/A+ mice and P−/A− mice (Fig. 4E). Fatty acid synthase (FAS) was induced by HFD in P−/A− mice (Fig. 4E). FAS is regulated by sterol regulatory element-binding protein-1 (SREBP-1; see Ref. 37). Although the precursor of SREBP-1 (125 kDa) was not changed, the mature SREBP-1 (68 kDa) was induced by HFD in P−/A− mice (Fig. 4E). However, the mature SREBP-1 was decreased by HFD feeding in P+/A−mice (Fig. 4E). The other lipogenic regulators like phosphorylated AMPKα and PPARγ were also decreased in HFD-fed P+/A−mice while no changes were observed in P−/A− mice and P−/A+ mice (Fig. 4E).
Fig. 4.
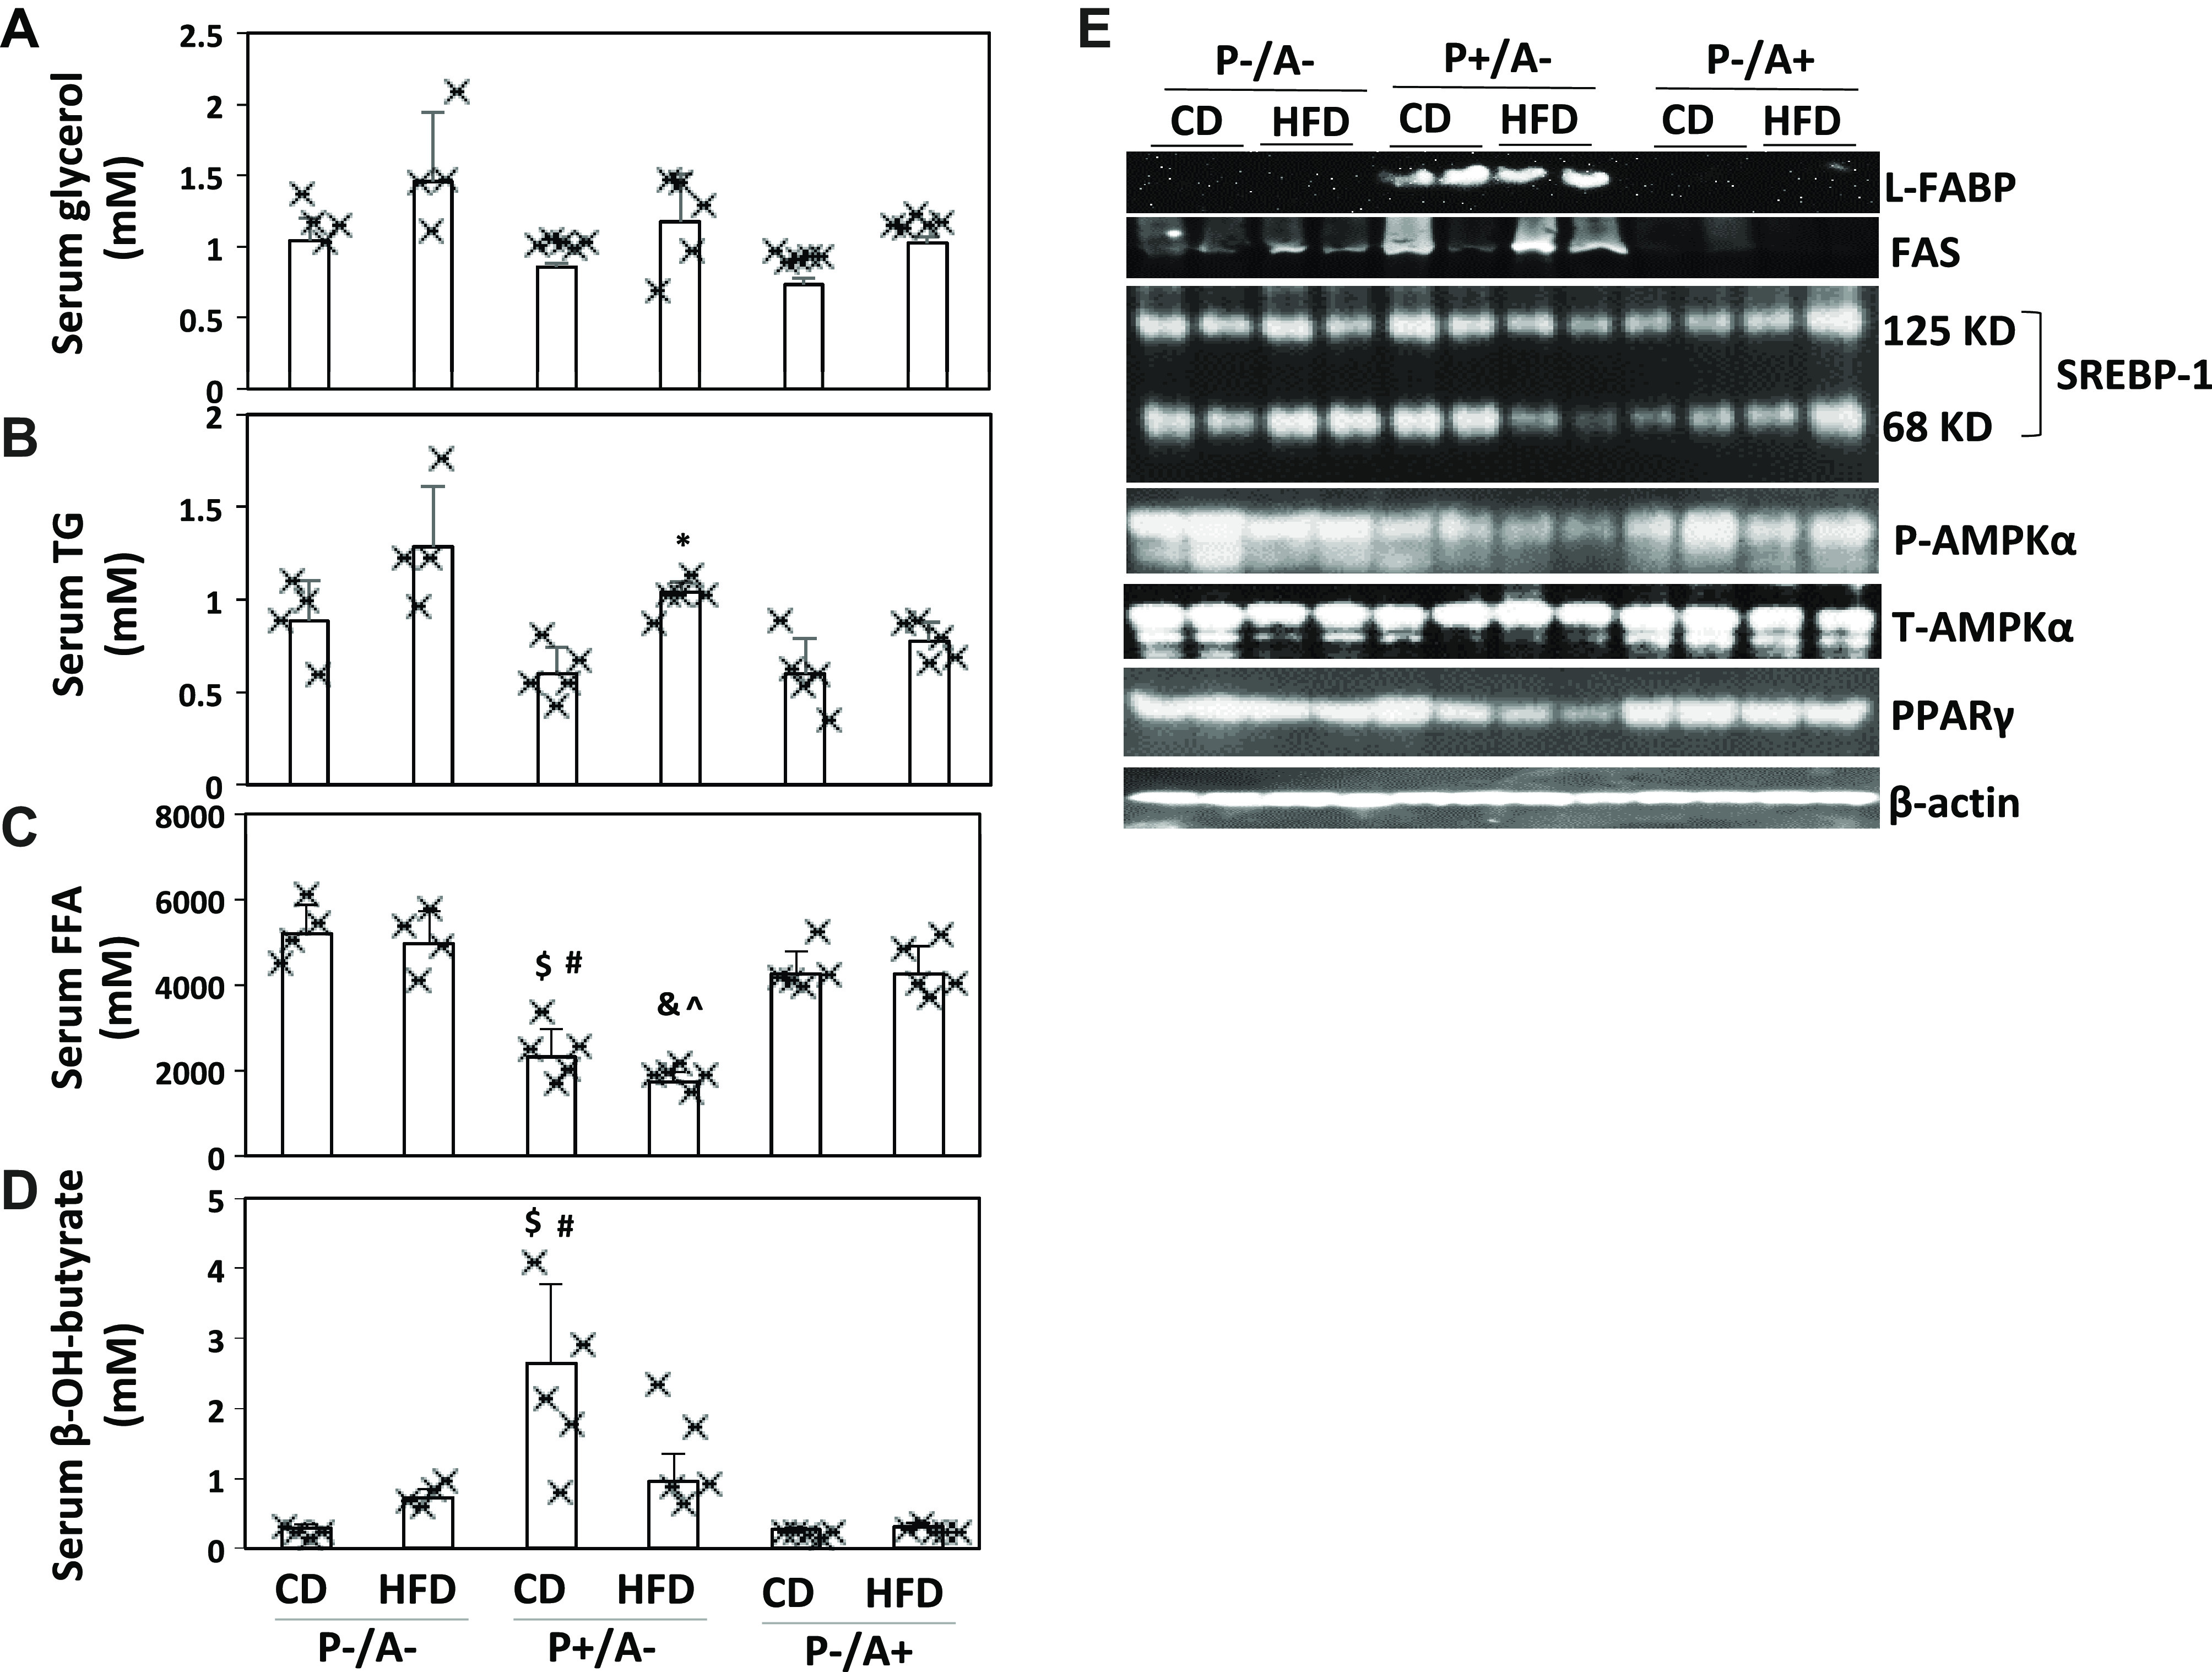
Lipid metabolism is comparable in peroxisome proliferator-activated receptor-α knockout (pparα−/−)/cytochrome P-450 2A5 knockout (cyp2a5−/−) mice (P−/A−) and mice expressing cyp2a5 but not expressing pparα (P−/A+) mice. A: serum glycerol. B: serum triglyceride (TG, n = 4–5 mice). C: serum free fatty acids (FFAs, n = 4–5 mice). D: serum β-hydroxylbutyrate (n = 4–5 mice). E: liver expression of liver fatty acid-binding protein (L-FABP), fatty acid synthase (FAS), and lipogenic regulators. SREBP-1, sterol regulatory element-binding protein-1. *P < 0.05 compared with group of mice expressing pparα but not expressing cyp2a5 (P+/A−) and given control diet (CD); $ P < 0.05 compared with P−/A− CD group; #P < 0.05 compared with P−/A+ CD group; &P < 0.05 compared with P−/A− high-fat diet (HFD) group; ^P < 0.05 compared with P−/A+ HFD group.
P−/A− mice exhibited compensated but impaired antioxidant capacity in response to HFD.
In addition to lipotoxicity, oxidative stress is an essential factor for the transition of steatosis to NASH and fibrosis (6). Nrf2-binding activity was upregulated by HFD in those mice lacking CYP2A5, i.e., P−/A− mice and P+/A− mice, but not in P−/A+ mice (Fig. 5A). Glutamylcysteine synthetase (GCS) and catalase are regulated by Nrf2 (45). While GCS and catalase were induced by HFD in P+/A−mice and P−/A+ mice, they were not induced in P−/A− mice, even though their basal expressions were elevated in P−/A− mice (Fig. 5B). GCS is a rate-limiting enzyme for GSH synthesis. Consistently, liver contents of total GSH were increased by HFD in P+/A− mice and P−/A+ mice but not in P−/A− mice (Fig. 5C). These results imply that Nrf2 elevation is a compensation response to HFD-induced oxidative stress in P−/A− mice. Basal level of thioredoxin (Trx) was suppressed in P−/A− mice, but phosphorylation of JNK was increased in P−/A− mice (Fig. 5B), which is consistent with the notion that Trx inhibition leads to phosphorylation of JNK (43). JNK may regulate CYP2E1-mediated oxidative stress (35). CYP2E1 is a generator of reactive oxygen species (ROS) and contributes to ALD and NASH (1, 18, 22). Interestingly, lipid droplets were only observed in the CYP2E1 positively stained areas (Fig. 5D). Nitrotyrosine (3-NT), a biomarker of oxidative stress, was positively stained in P−/A− mice but not in P+/A−mice and P−/A+ mice. Like CYP2E1, 3-NT was also mainly stained in the steatotic areas (Fig. 5E). The 3-NT was mainly stained in foci of hepatocellular ballooning (Fig. 5F), but CYP2E1 was negative in the foci of hepatocellular ballooning (Fig. 5F), suggesting that the foci are composed of dead cells not expressing CYP2E1. TBARS, a marker of lipid peroxidation, was increased by HFD in P−/A− mice but not in P+/A− mice and P−/A+ mice (Fig. 5G).
Fig. 5.
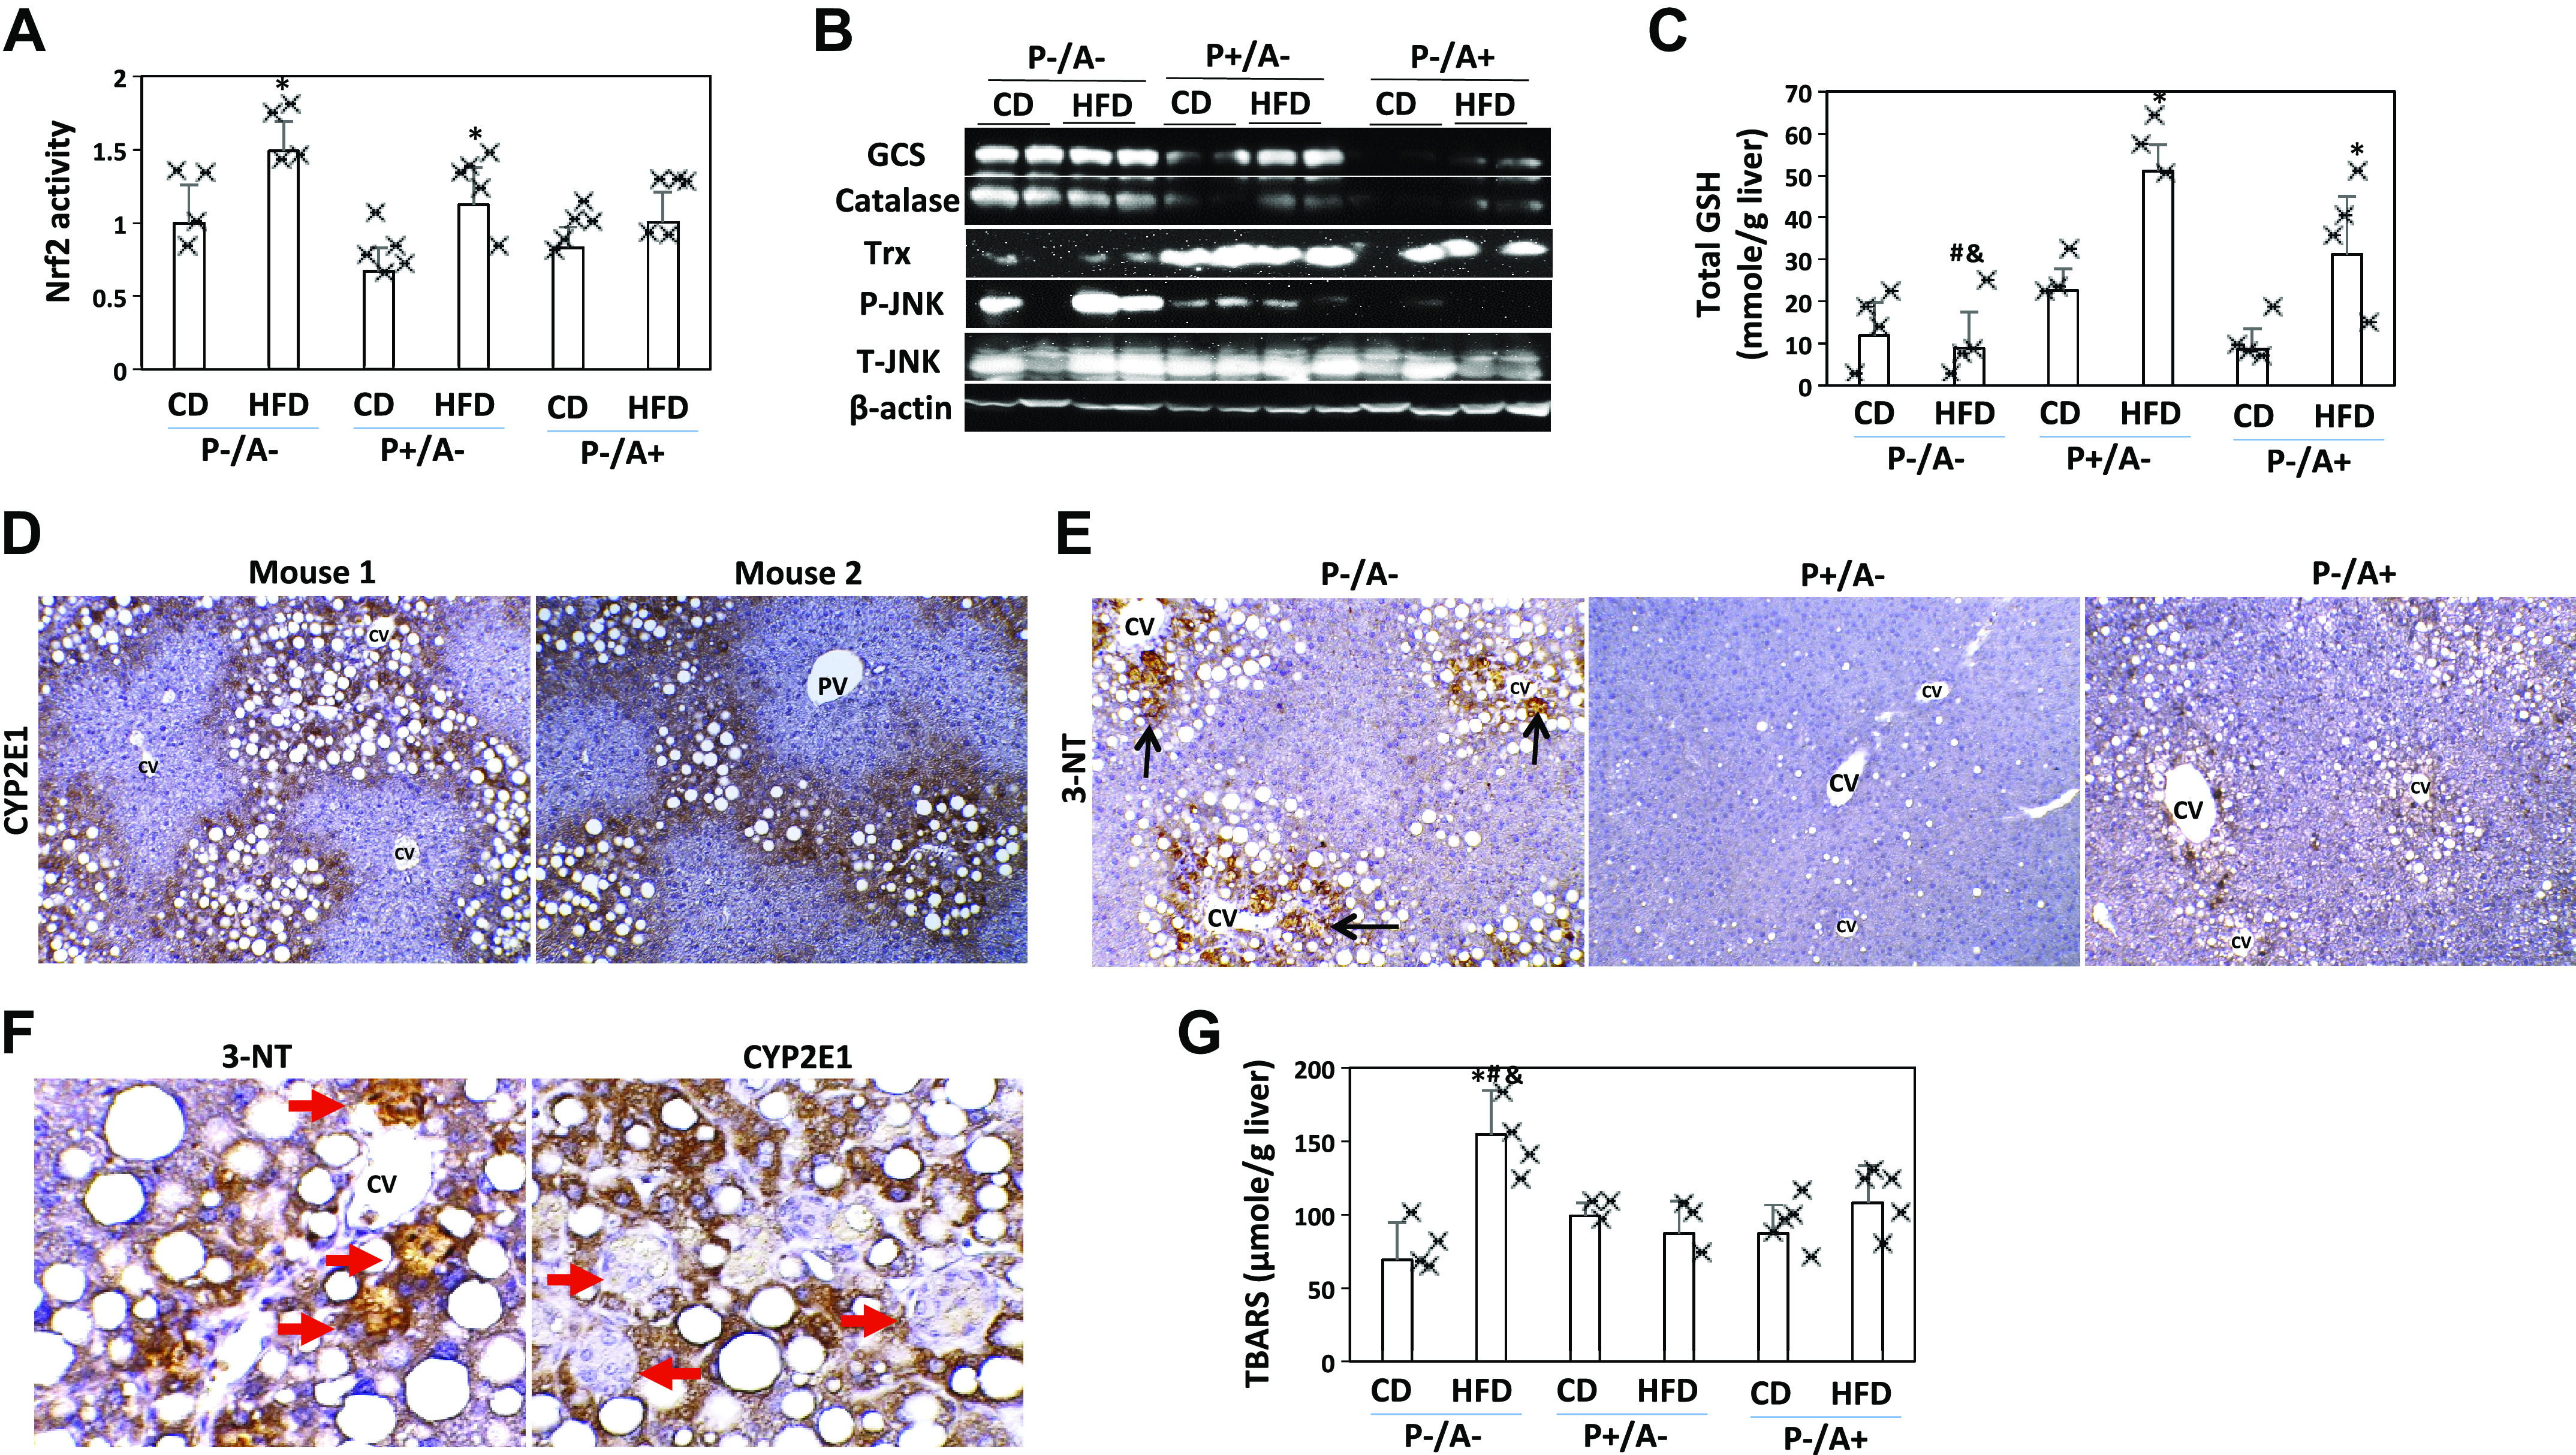
Antioxidant capacity is compensated and oxidative stress is induced in peroxisome proliferator-activated receptor-α knockout (pparα−/−)/cytochrome P-450 2A5 knockout (cyp2a5−/−) mice (P−/A−). A: nuclear factor erythroid 2-related factor 2 (Nrf2)-binding activity (n = 4–5 mice). *P < 0.05 compared with corresponding control diet (CD) group. B: hepatic expression of glutamylcysteine synthetase (GCS), catalase, thioredoxin, and JNK. Trx, thioredoxin. C: total glutathione (GSH) levels in liver (n = 4–5 mice). *P < 0.05 compared with corresponding CD group; #P < 0.05 compared with mice expressing pparα but not expressing cyp2a5 (P+/A−) and given a high-fat diet (HFD); &P < 0.05 compared with mice expressing cyp2a5 but not expressing pparα (P−/A+) and given HFD. F: IHC nitrotyrosine (3-NT) staining was positive in the HFD-fed P−/A− mice. PV, portal vein; CV, central vein. D: foci of hepatocellular ballooning were positive with 3-NT but negative for cytochrome P-450 2E1 (CYP2E1). The arrows show the foci of hepatocellular ballooning. Black arrows show positive staining. E: IHC staining for CYP2E1 in the HFD-fed P−/A− mice. Red arrows show foci of hepatocellular ballooning. G: thiobarbituric acid reactive substances (TBARS) levels in liver (n = 3–5 mice). *P < 0.05 compared with P−/A− CD group; #P < 0.05 compared with P+/A− HFD group; &P < 0.05 compared with P−/A+ HFD group.
DISCUSSION
Previously we fed female mice with HFD and found that HFD-induced obesity and steatosis were more severe in cyp2a5−/− mice (equivalent to P+/A− mice) than in WT mice; PPARα absence in cyp2a5−/− mice (i.e., P−/A− mice) deteriorated steatosis but protected against obesity (39). In this study, those phenomena observed in female P−/A− mice were repeatable in male P−/A− mice. What is more, male P−/A− mice developed overt steatohepatitis and steatofibrosis, which was not observed in the previous study with female mice. In the previous study, the female mice were fed HFD for 10 wk, but in this study, the male mice were fed HFD for 14 wk. It is possible that male mice are more sensitive to HFD-induced NASH and fibrosis than female mice, but it still needs to further address gender-dependent difference in fibrosis by experiments that age-matched male and female mice are simultaneously fed HFD during the same period of time.
In P−/A− mice, HFD-induced NASH is unique. First, foci of hepatocellular ballooning and infiltrated inflammatory cells are observed in the steatotic areas, i.e., inside clusters of lipid droplets. Second, fibrosis is detected only in the steatosis areas, suggesting that HFD-induced fibrosis in this mouse model is steatohepatitis associated. Therefore, we name it steatofibrosis to differentiate from necrofibrosis i.e., massive hepatocyte necrosis-induced severe fibrosis. Finally, oxidative stress marker 3-NT is also formed in the steatosis area. Therefore, lipid droplets are essential for steatohepatitis and steatofibrosis. PPARα is a well-known lipid metabolism regulator. For CYP2A5/6, previous studies suggest that they are a potential regulator of lipid metabolism. For example, in the liver sections from patients with NAFLD, CYP2A6 expression is increased (28). CYP2A6 gene was identified to be associated with obesity in a genome-wide association study sample, and animal experiments showed that CYP2A5 absence made mice more obese and develop more severe steatosis (39). In this study, the impaired FAO (elevated FFA and reduced ketone body) is comparable in P−/A− mice and P−/A+ mice, suggesting that PPARα is a more powerful metabolism regulator than CYP2A5, and the modulating effects of CYP2A5 are masked by PPARα. However, CYP2A5 still exerts its effect, and it is CYP2A5 absence that makes steatosis in P−/A− mice more severe than in P−/A+ mice (Fig. 6).
Fig. 6.
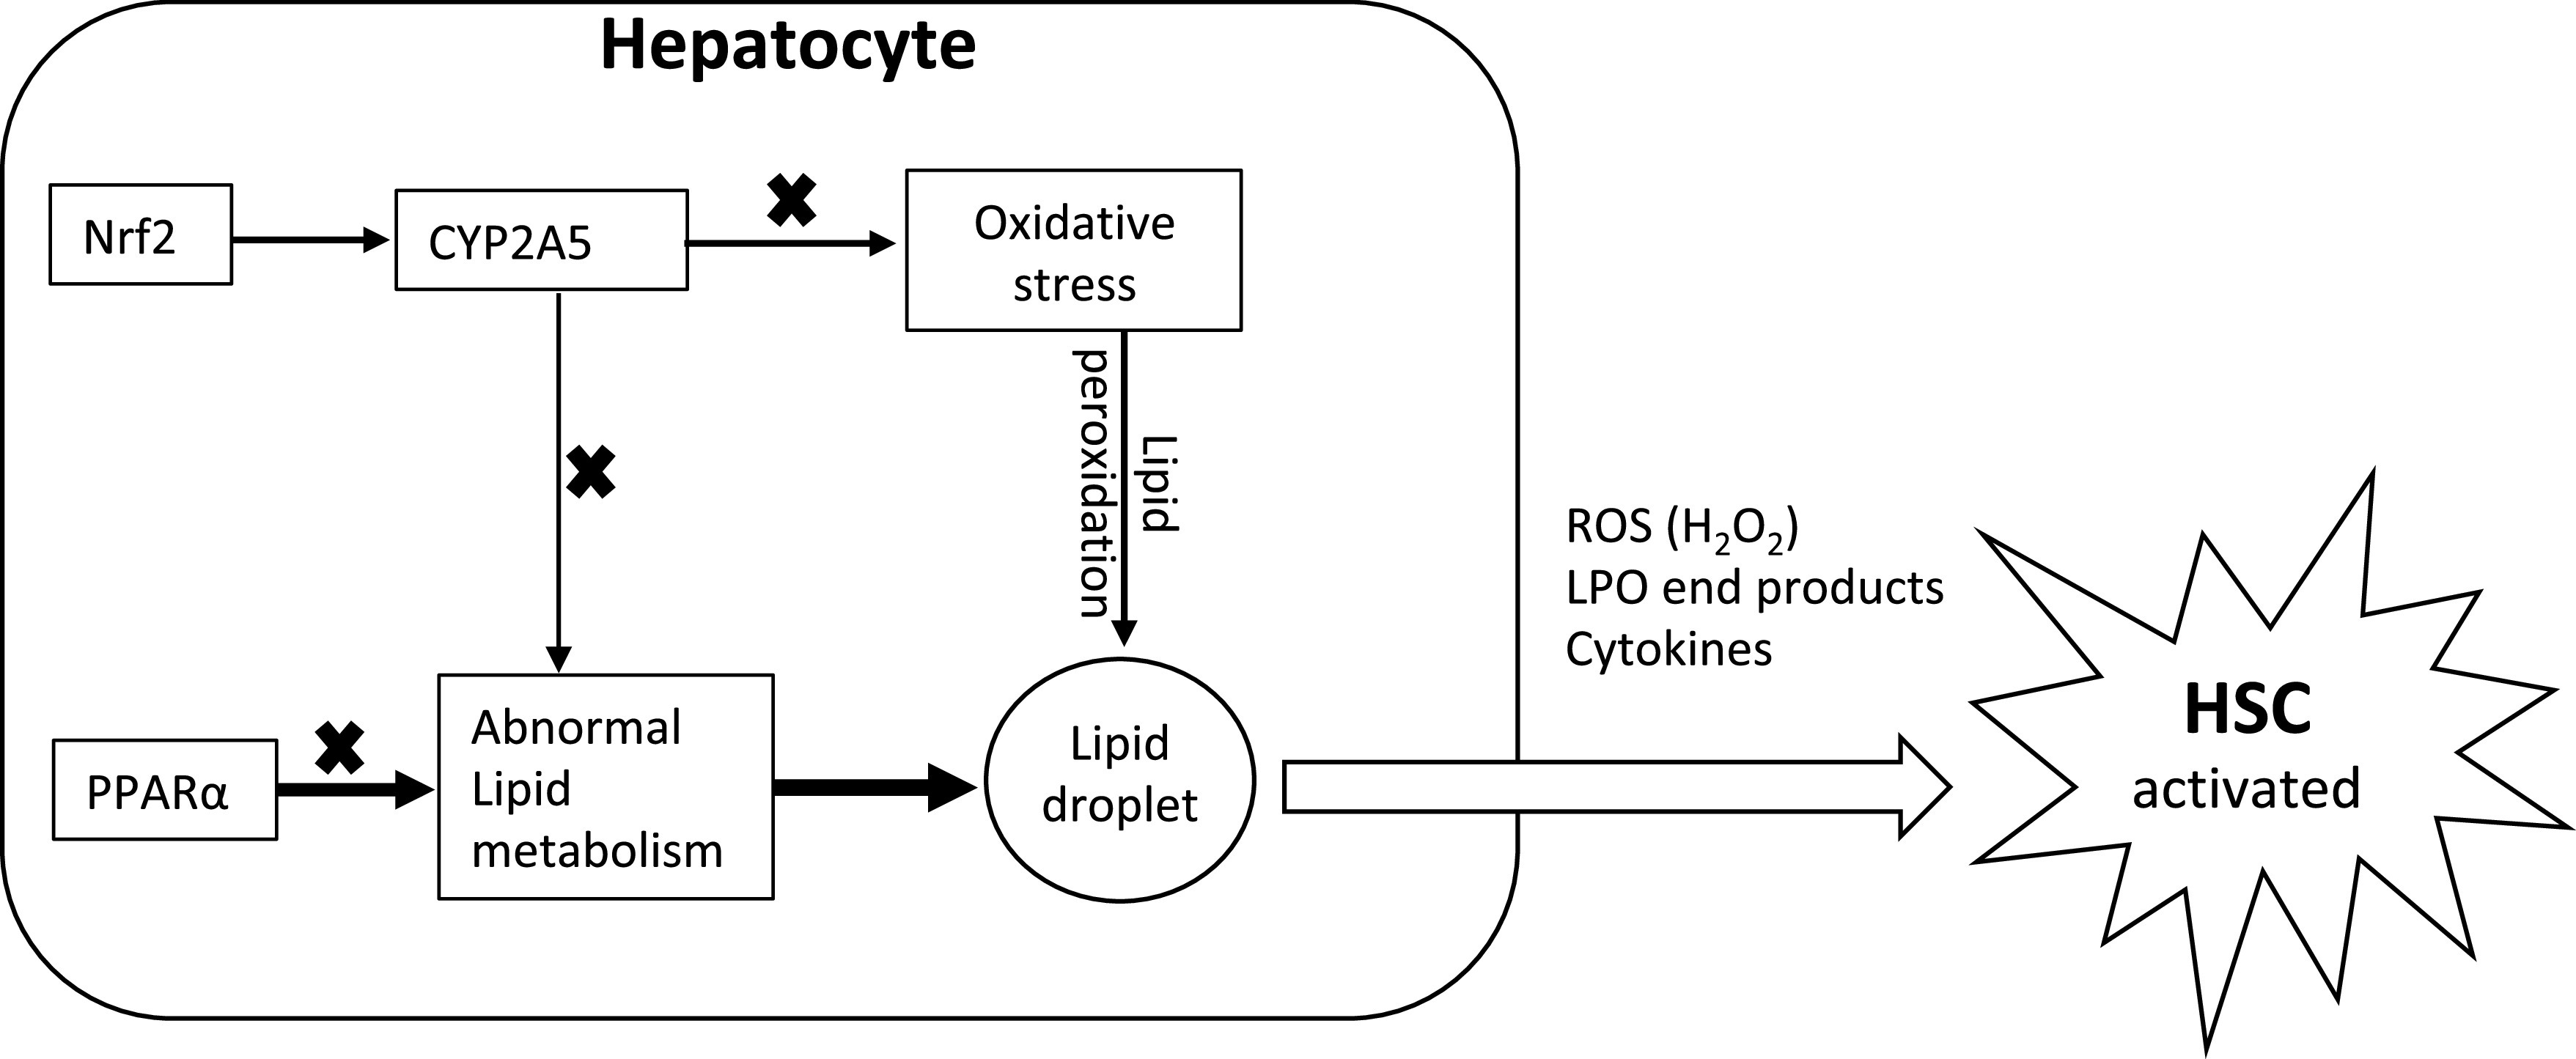
Schematic hypothesized mechanism of peroxisome proliferator-activated receptor-α (PPARα) and cytochrome P-450 2A5 (CYP2A5) interaction in the development of steatofibrosis. ROS, reactive oxygen species; LPO, lipid peroxidation; HSC, hepatic stellate cells; Nrf2, nuclear factor erythroid 2-related factor 2.
In liver, steatosis is in hepatocytes, but fibrosis is produced by hepatic stellate cells (HSC). Normally, HSC are quiescent. When they are activated, HSC synthesize and secrete collagen (8). HSC activation needs energy, and lipid metabolism (e.g., FAO) in HSC produces ATP to fuel HSC activation and liver fibrosis (11). Serum levels of FFA are comparable in P−/A− mice and P−/A+ mice to provide FFA for HSC, but P−/A− mice developed more evident steatofibrosis. HSC also expresses L-FABP to facilitate FFA delivery for FAO (3), but P−/A− mice expressed lower L-FABP than P+/A− mice. These results suggest that other mechanisms are involved. Oxidative stress is related to liver fibrosis (31). In vitro cell coculture study showed that hepatocytes may interplay with HSC to promote HSC activation, e.g., HSC can be activated by hydrogen peroxide (H2O2) released by hepatocytes (29). In NASH patients, the stage of fibrosis significantly correlated with 4-hydroxynonenal, an end product of lipid peroxidation (36). Thus, HSC might also be activated by lipid peroxidation end products that are derived from peroxidation of lipid droplets under oxidative stress (Fig. 6). In this study, liver inflammation, fibrosis, and 3-NT formation in P−/A− mice are all within clusters of lipid droplets, and lipid droplets are all within CYP2E1-positive area, suggesting that CYP2E1 is a prime factor for these liver lesions. It is possible that ROS oxidizes lipid droplets-provided substrates and generates lipid peroxidation end products, which activate HSC and promotes steatofibrosis.
In this study, although Nrf2 was upregulated by HFD feeding in both P−/A− mice and P+/A− mice, liver GCS expression and total GSH contents were induced by HFD in P+/A− mice but not in P−/A− mice, and, consistently, oxidative stress and lipid peroxidation (TBARS and 3-NT) were induced by HFD feeding in P−/A− mice but not in P+/A−mice. CYP2A5 is regulated by Nrf2, and it might be among the Nrf2-regulated antioxidant panel because ethanol-induced oxidative stress is more severe in cyp2a5−/− mice than in WT mice (12, 21). TAA-induced oxidative stress and necrofibrosis are more severe in cyp2a5−/− mice than in WT mice (13), suggesting that CYP2A5 absence-associated oxidative stress promotes TAA-induced necrofibrosis. Therefore, CYP2A5 absence contributes to HFD-induced oxidative stress in P−/A− mice (Fig. 6). How PPARα absence enhances oxidative stress in P−/A− mice is unclear. In fact, PPARα mediates ROS production. Microsomal FAO enzyme CYP4A, a source of microsomal ROS in liver, is regulated by PPARα (16). H2O2 can be produced in the process of FAO, which is regulated by PPARα (34). On the other hand, PPARα activation induces CYP4A, but hepatic lipid peroxidation is not increased because PPARα activation enhances hepatic lipid turnover, which makes substrates for lipid peroxidation unavailable (16). Further studies are needed to address how PPARα interacts with CYP2A5 or Nrf2 to regulate redox status or oxidative stress.
Inflammation is an important risk factor for the development of liver fibrosis (8). Methionine-choline-deficient diet can induce liver inflammation and fibrosis in pparα−/− mice (32). In this study, we applied HFD containing methionine and choline to induce steatofibrosis. The P−/A+ mice that are equivalent to pparα−/− mice just developed minor liver fibrosis, whereas P−/A− mice developed liver inflammation and overt steatofibrosis. ROS can activate NLRP3-ASC inflammasome and cause IL-1β production (40, 44), which might cause inflammation and subsequent steatofibrosis (24). In addition, inhibition of ARE-directed mRNA decay also contributes to rapid increases in cytokine and inflammatory mediator production (41). Indeed, the pathways related to AUF1 (hnRNP D0) degrading mRNA were suppressed in the HFD-fed P−/A− mice compared with HFD-fed P−/A+ mice, and, consistently, liver IL-1β was increased in the HFD-fed P−/A− mice.
In summary, CYP2A5 protects against obesity and steatosis in mice, and PPARα suppresses the CYP2A5-protective effects on obesity but contributes to the CYP2A5-protective effects on steatosis, steatohepatitis, and steatofibrosis, which is associated with oxidative stress. The P−/A− mice may serve as a new animal model to study lipid metabolism-mediated liver fibrosis.
GRANTS
This study is partially supported by National Institute on Alcohol Abuse and Alcoholism Grant AA-024723.
DISCLOSURES
No conflicts of interest, financial or otherwise, are declared by the authors.
AUTHOR CONTRIBUTIONS
F.H., A.I.C. and Y.L. conceived and designed research; X.C. and Y.L. performed experiments; G.K.A., K.L.D., K.W., J.D. and Y.L. analyzed data; J.M.P., K.W. and Y.L. interpreted results of experiments; K.L.D. and Y.L. prepared figures; Y.L. drafted manuscript; K.L.D., J.M.P. and Y.L. edited and revised manuscript; X.C. and Y.L. approved final version of manuscript.
ACKNOWLEDGMENTS
We thank Dr. Xinxin Ding for the cyp2a5−/− mice, Dr. Frank Gonzalez for cyp2e1−/− KI mice, Dr. Risto Juvonen for anti-CYP2A5 IgG, and Dr. Jerome Lasker for anti-CYP2E1 IgG. We acknowledge the Marshall University Molecular and Biological Imaging Center (supported by COBRE ACCORD Grant 5P20-GM-121299) for help with imaging needs.
Parts of contents in this manuscript were presented as abstracts and posters in American Association For The Study of Liver Diseases (AASLD) meeting in Boston, MA in Nov. 2019 (title: CYP2A5 absence promotes alcoholic and non-alcoholic fatty liver disease in pparα−/− mice), Society of Toxicology (SOT) annual meeting in Baltimore, MD in March 2019 (title: CYP2A5-absent pparα−/− mice develop less obesity but more severe NAFLD in response to high-fat diet), and AASLD meeting in Washington DC in October 2017 (title: Pparα interplays with CYP2A5 to regulate high-fat diet-induced fatty liver).
REFERENCES
- 1.Abdelmegeed MA, Banerjee A, Yoo SH, Jang S, Gonzalez FJ, Song BJ. Critical role of cytochrome P450 2E1 (CYP2E1) in the development of high fat-induced non-alcoholic steatohepatitis. J Hepatol 57: 860–866, 2012. doi: 10.1016/j.jhep.2012.05.019. [DOI] [PMC free article] [PubMed] [Google Scholar]
- 2.Bhala N, Younes R, Bugianesi E. Epidemiology and natural history of patients with NAFLD. Curr Pharm Des 19: 5169–5176, 2013. doi: 10.2174/13816128113199990336. [DOI] [PubMed] [Google Scholar]
- 3.Chen A, Tang Y, Davis V, Hsu FF, Kennedy SM, Song H, Turk J, Brunt EM, Newberry EP, Davidson NO. Liver fatty acid binding protein (L-Fabp) modulates murine stellate cell activation and diet-induced nonalcoholic fatty liver disease. Hepatology 57: 2202–2212, 2013. doi: 10.1002/hep.26318. [DOI] [PMC free article] [PubMed] [Google Scholar]
- 4.Chen X, Ward SC, Cederbaum AI, Xiong H, Lu Y. Alcoholic fatty liver is enhanced in CYP2A5 knockout mice: the role of the PPARα-FGF21 axis. Toxicology 379: 12–21, 2017. doi: 10.1016/j.tox.2017.01.016. [DOI] [PMC free article] [PubMed] [Google Scholar]
- 5.Donnelly KL, Smith CI, Schwarzenberg SJ, Jessurun J, Boldt MD, Parks EJ. Sources of fatty acids stored in liver and secreted via lipoproteins in patients with nonalcoholic fatty liver disease. J Clin Invest 115: 1343–1351, 2005. doi: 10.1172/JCI23621. [DOI] [PMC free article] [PubMed] [Google Scholar]
- 6.Font-Burgada J, Sun B, Karin M. Obesity and cancer: the oil that feeds the flame. Cell Metab 23: 48–62, 2016. doi: 10.1016/j.cmet.2015.12.015. [DOI] [PubMed] [Google Scholar]
- 7.Francque S, Verrijken A, Caron S, Prawitt J, Paumelle R, Derudas B, Lefebvre P, Taskinen MR, Van Hul W, Mertens I, Hubens G, Van Marck E, Michielsen P, Van Gaal L, Staels B. PPARα gene expression correlates with severity and histological treatment response in patients with non-alcoholic steatohepatitis. J Hepatol 63: 164–173, 2015. doi: 10.1016/j.jhep.2015.02.019. [DOI] [PubMed] [Google Scholar]
- 8.Friedman SL. Hepatic fibrosis–overview. Toxicology 254: 120–129, 2008. doi: 10.1016/j.tox.2008.06.013. [DOI] [PubMed] [Google Scholar]
- 9.Gao Q, Jia Y, Yang G, Zhang X, Boddu PC, Petersen B, Narsingam S, Zhu YJ, Thimmapaya B, Kanwar YS, Reddy JK. PPARα-deficient ob/ob obese mice become more obese and manifest severe hepatic steatosis due to decreased fatty acid oxidation. Am J Pathol 185: 1396–1408, 2015. doi: 10.1016/j.ajpath.2015.01.018. [DOI] [PMC free article] [PubMed] [Google Scholar]
- 10.Guhaniyogi J, Brewer G. Regulation of mRNA stability in mammalian cells. Gene 265: 11–23, 2001. doi: 10.1016/S0378-1119(01)00350-X. [DOI] [PubMed] [Google Scholar]
- 11.Hernández-Gea V, Ghiassi-Nejad Z, Rozenfeld R, Gordon R, Fiel MI, Yue Z, Czaja MJ, Friedman SL. Autophagy releases lipid that promotes fibrogenesis by activated hepatic stellate cells in mice and in human tissues. Gastroenterology 142: 938–946, 2012. doi: 10.1053/j.gastro.2011.12.044. [DOI] [PMC free article] [PubMed] [Google Scholar]
- 12.Hong F, Liu X, Ward SS, Xiong H, Cederbaum AI, Lu Y. Absence of cytochrome P450 2A5 enhances alcohol-induced liver injury in mice. Dig Liver Dis 47: 470–477, 2015. doi: 10.1016/j.dld.2015.02.012. [DOI] [PMC free article] [PubMed] [Google Scholar]
- 13.Hong F, Si C, Gao P, Cederbaum AI, Xiong H, Lu Y. The role of CYP2A5 in liver injury and fibrosis: chemical-specific difference. Naunyn Schmiedebergs Arch Pharmacol 389: 33–43, 2016. doi: 10.1007/s00210-015-1172-8. [DOI] [PMC free article] [PubMed] [Google Scholar]
- 14.Huang J, Jia Y, Fu T, Viswakarma N, Bai L, Rao MS, Zhu Y, Borensztajn J, Reddy JK. Sustained activation of PPARα by endogenous ligands increases hepatic fatty acid oxidation and prevents obesity in ob/ob mice. FASEB J 26: 628–638, 2012. doi: 10.1096/fj.11-194019. [DOI] [PMC free article] [PubMed] [Google Scholar]
- 15.Huang H, Starodub O, McIntosh A, Atshaves BP, Woldegiorgis G, Kier AB, Schroeder F. Liver fatty acid-binding protein colocalizes with peroxisome proliferator activated receptor alpha and enhances ligand distribution to nuclei of living cells. Biochemistry 43: 2484–2500, 2004. doi: 10.1021/bi0352318. [DOI] [PubMed] [Google Scholar]
- 16.Ip E, Farrell GC, Robertson G, Hall P, Kirsch R, Leclercq I. Central role of PPARalpha-dependent hepatic lipid turnover in dietary steatohepatitis in mice. Hepatology 38: 123–132, 2003. doi: 10.1053/jhep.2003.50307. [DOI] [PubMed] [Google Scholar]
- 17.Kersten S, Seydoux J, Peters JM, Gonzalez FJ, Desvergne B, Wahli W. Peroxisome proliferator-activated receptor alpha mediates the adaptive response to fasting. J Clin Invest 103: 1489–1498, 1999. doi: 10.1172/JCI6223. [DOI] [PMC free article] [PubMed] [Google Scholar]
- 18.Leclercq IA, Farrell GC, Field J, Bell DR, Gonzalez FJ, Robertson GR. CYP2E1 and CYP4A as microsomal catalysts of lipid peroxides in murine nonalcoholic steatohepatitis. J Clin Invest 105: 1067–1075, 2000. doi: 10.1172/JCI8814. [DOI] [PMC free article] [PubMed] [Google Scholar]
- 19.Lu Y, Cederbaum AI. Cytochrome P450s and alcoholic liver disease. Curr Pharm Des 24: 1502–1517, 2018. doi: 10.2174/1381612824666180410091511. [DOI] [PMC free article] [PubMed] [Google Scholar]
- 20.Lu Y, Wang X, Cederbaum AI. Lipopolysaccharide-induced liver injury in rats treated with the CYP2E1 inducer pyrazole. Am J Physiol Gastrointest Liver Physiol 289: G308–G319, 2005. doi: 10.1152/ajpgi.00054.2005. [DOI] [PubMed] [Google Scholar]
- 21.Lu Y, Zhang XH, Cederbaum AI. Ethanol induction of CYP2A5: role of CYP2E1-ROS-Nrf2 pathway. Toxicol Sci 128: 427–438, 2012. doi: 10.1093/toxsci/kfs164. [DOI] [PMC free article] [PubMed] [Google Scholar]
- 22.Lu Y, Zhuge J, Wang X, Bai J, Cederbaum AI. Cytochrome P450 2E1 contributes to ethanol-induced fatty liver in mice. Hepatology 47: 1483–1494, 2008. doi: 10.1002/hep.22222. [DOI] [PubMed] [Google Scholar]
- 23.Lu Y, Zhuge J, Wu D, Cederbaum AI. Ethanol induction of CYP2A5: permissive role for CYP2E1. Drug Metab Dispos 39: 330–336, 2011. doi: 10.1124/dmd.110.035691. [DOI] [PMC free article] [PubMed] [Google Scholar]
- 24.Lukens JR, Gross JM, Kanneganti TD. IL-1 family cytokines trigger sterile inflammatory disease. Front Immunol 3: 315, 2012. doi: 10.3389/fimmu.2012.00315. [DOI] [PMC free article] [PubMed] [Google Scholar]
- 25.Montagner A, Polizzi A, Fouché E, Ducheix S, Lippi Y, Lasserre F, Barquissau V, Régnier M, Lukowicz C, Benhamed F, Iroz A, Bertrand-Michel J, Al Saati T, Cano P, Mselli-Lakhal L, Mithieux G, Rajas F, Lagarrigue S, Pineau T, Loiseau N, Postic C, Langin D, Wahli W, Guillou H. Liver PPARα is crucial for whole-body fatty acid homeostasis and is protective against NAFLD. Gut 65: 1202–1214, 2016. doi: 10.1136/gutjnl-2015-310798. [DOI] [PMC free article] [PubMed] [Google Scholar]
- 26.Motojima K, Passilly P, Peters JM, Gonzalez FJ, Latruffe N. Expression of putative fatty acid transporter genes are regulated by peroxisome proliferator-activated receptor alpha and gamma activators in a tissue- and inducer-specific manner. J Biol Chem 273: 16710–16714, 1998. doi: 10.1074/jbc.273.27.16710. [DOI] [PubMed] [Google Scholar]
- 27.Nakagawa H, Umemura A, Taniguchi K, Font-Burgada J, Dhar D, Ogata H, Zhong Z, Valasek MA, Seki E, Hidalgo J, Koike K, Kaufman RJ, Karin M. ER stress cooperates with hypernutrition to trigger TNF-dependent spontaneous HCC development. Cancer Cell 26: 331–343, 2014. doi: 10.1016/j.ccr.2014.07.001. [DOI] [PMC free article] [PubMed] [Google Scholar]
- 28.Niemelä O, Parkkila S, Juvonen RO, Viitala K, Gelboin HV, Pasanen M. Cytochromes P450 2A6, 2E1, and 3A and production of protein-aldehyde adducts in the liver of patients with alcoholic and non-alcoholic liver diseases. J Hepatol 33: 893–901, 2000. doi: 10.1016/S0168-8278(00)80120-8. [DOI] [PubMed] [Google Scholar]
- 29.Nieto N, Friedman SL, Cederbaum AI. Cytochrome P450 2E1-derived reactive oxygen species mediate paracrine stimulation of collagen I protein synthesis by hepatic stellate cells. J Biol Chem 277: 9853–9864, 2002. doi: 10.1074/jbc.M110506200. [DOI] [PubMed] [Google Scholar]
- 30.Nobili V, Alisi A, Newton KP, Schwimmer JB. Comparison of the phenotype and approach to pediatric vs adult patients with nonalcoholic fatty liver disease. Gastroenterology 150: 1798–1810, 2016. doi: 10.1053/j.gastro.2016.03.009. [DOI] [PMC free article] [PubMed] [Google Scholar]
- 31.Parola M, Robino G. Oxidative stress-related molecules and liver fibrosis. J Hepatol 35: 297–306, 2001. doi: 10.1016/S0168-8278(01)00142-8. [DOI] [PubMed] [Google Scholar]
- 32.Pawlak M, Baugé E, Bourguet W, De Bosscher K, Lalloyer F, Tailleux A, Lebherz C, Lefebvre P, Staels B. The transrepressive activity of peroxisome proliferator-activated receptor alpha is necessary and sufficient to prevent liver fibrosis in mice. Hepatology 60: 1593–1606, 2014. doi: 10.1002/hep.27297. [DOI] [PubMed] [Google Scholar]
- 33.Pawlak M, Lefebvre P, Staels B. Molecular mechanism of PPARα action and its impact on lipid metabolism, inflammation and fibrosis in non-alcoholic fatty liver disease. J Hepatol 62: 720–733, 2015. doi: 10.1016/j.jhep.2014.10.039. [DOI] [PubMed] [Google Scholar]
- 34.Reddy JK, Hashimoto T. Peroxisomal beta-oxidation and peroxisome proliferator-activated receptor alpha: an adaptive metabolic system. Annu Rev Nutr 21: 193–230, 2001. doi: 10.1146/annurev.nutr.21.1.193. [DOI] [PubMed] [Google Scholar]
- 35.Schattenberg JM, Czaja MJ. Regulation of the effects of CYP2E1-induced oxidative stress by JNK signaling. Redox Biol 3: 7–15, 2014. doi: 10.1016/j.redox.2014.09.004. [DOI] [PMC free article] [PubMed] [Google Scholar]
- 36.Seki S, Kitada T, Yamada T, Sakaguchi H, Nakatani K, Wakasa K. In situ detection of lipid peroxidation and oxidative DNA damage in non-alcoholic fatty liver diseases. J Hepatol 37: 56–62, 2002. doi: 10.1016/S0168-8278(02)00073-9. [DOI] [PubMed] [Google Scholar]
- 37.Shimano H, Yahagi N, Amemiya-Kudo M, Hasty AH, Osuga J, Tamura Y, Shionoiri F, Iizuka Y, Ohashi K, Harada K, Gotoda T, Ishibashi S, Yamada N. Sterol regulatory element-binding protein-1 as a key transcription factor for nutritional induction of lipogenic enzyme genes. J Biol Chem 274: 35832–35839, 1999. doi: 10.1074/jbc.274.50.35832. [DOI] [PubMed] [Google Scholar]
- 38.Smith BW, Adams LA. Non-alcoholic fatty liver disease. Crit Rev Clin Lab Sci 48: 97–113, 2011. doi: 10.3109/10408363.2011.596521. [DOI] [PubMed] [Google Scholar]
- 39.Wang K, Chen X, Ward SC, Liu Y, Ouedraogo Y, Xu C, Cederbaum AI, Lu Y. CYP2A6 is associated with obesity: studies in human samples and a high fat diet mouse model. Int J Obes 43: 475–486, 2019. doi: 10.1038/s41366-018-0037-x. [DOI] [PMC free article] [PubMed] [Google Scholar]
- 40.Wen H, Gris D, Lei Y, Jha S, Zhang L, Huang MT, Brickey WJ, Ting JP. Fatty acid-induced NLRP3-ASC inflammasome activation interferes with insulin signaling. Nat Immunol 12: 408–415, 2011. doi: 10.1038/ni.2022. [DOI] [PMC free article] [PubMed] [Google Scholar]
- 41.Wilson GM, Lu J, Sutphen K, Sun Y, Huynh Y, Brewer G. Regulation of A + U-rich element-directed mRNA turnover involving reversible phosphorylation of AUF1. J Biol Chem 278: 33029–33038, 2003. doi: 10.1074/jbc.M305772200. [DOI] [PubMed] [Google Scholar]
- 42.Wolf MJ, Adili A, Piotrowitz K, Abdullah Z, Boege Y, Stemmer K, Ringelhan M, Simonavicius N, Egger M, Wohlleber D, Lorentzen A, Einer C, Schulz S, Clavel T, Protzer U, Thiele C, Zischka H, Moch H, Tschöp M, Tumanov AV, Haller D, Unger K, Karin M, Kopf M, Knolle P, Weber A, Heikenwalder M. Metabolic activation of intrahepatic CD8+ T cells and NKT cells causes nonalcoholic steatohepatitis and liver cancer via cross-talk with hepatocytes. Cancer Cell 26: 549–564, 2014. doi: 10.1016/j.ccell.2014.09.003. [DOI] [PubMed] [Google Scholar]
- 43.Yang L, Wu D, Wang X, Cederbaum AI. Depletion of cytosolic or mitochondrial thioredoxin increases CYP2E1-induced oxidative stress via an ASK-1-JNK1 pathway in HepG2 cells. Free Radic Biol Med 51: 185–196, 2011. doi: 10.1016/j.freeradbiomed.2011.04.030. [DOI] [PMC free article] [PubMed] [Google Scholar]
- 44.Zhou R, Tardivel A, Thorens B, Choi I, Tschopp J. Thioredoxin-interacting protein links oxidative stress to inflammasome activation. Nat Immunol 11: 136–140, 2010. doi: 10.1038/ni.1831. [DOI] [PubMed] [Google Scholar]
- 45.Zhu H, Itoh K, Yamamoto M, Zweier JL, Li Y. Role of Nrf2 signaling in regulation of antioxidants and phase 2 enzymes in cardiac fibroblasts: protection against reactive oxygen and nitrogen species-induced cell injury. FEBS Lett 579: 3029–3036, 2005. doi: 10.1016/j.febslet.2005.04.058. [DOI] [PubMed] [Google Scholar]