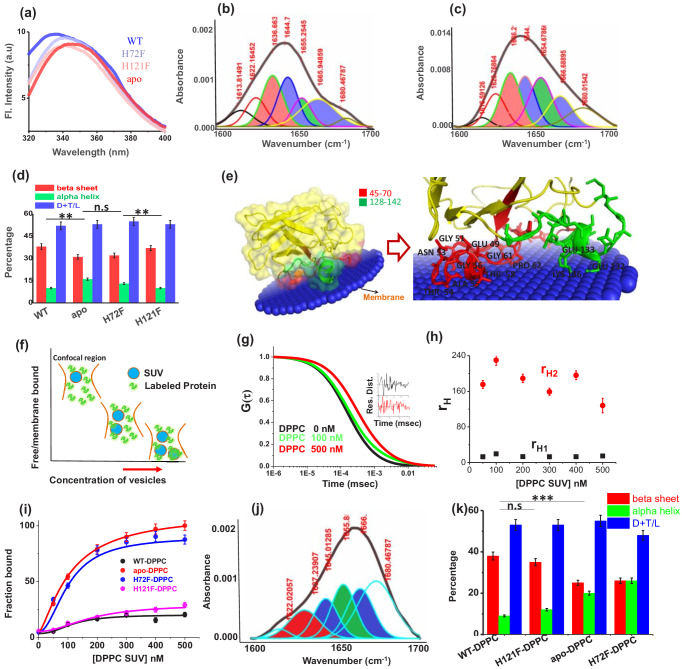
Figure 2. Structural characterization of SOD1 mutants and membrane association.
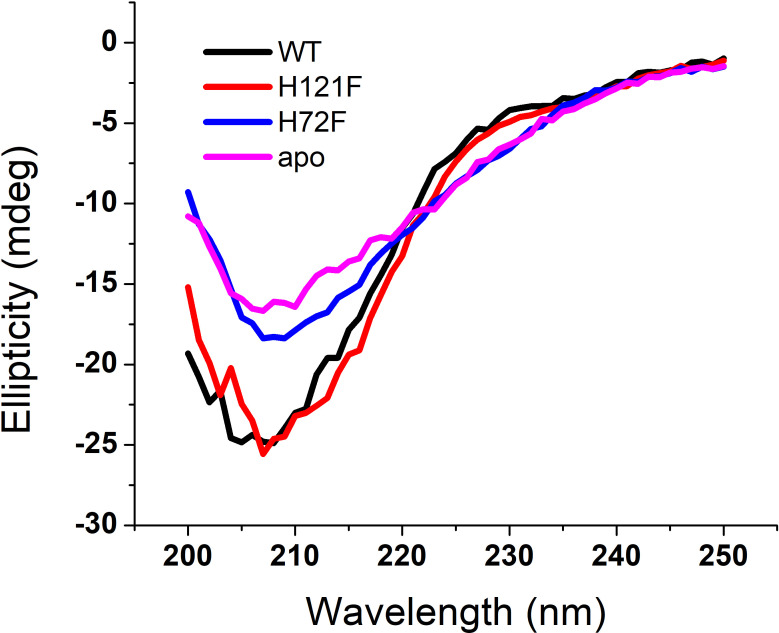
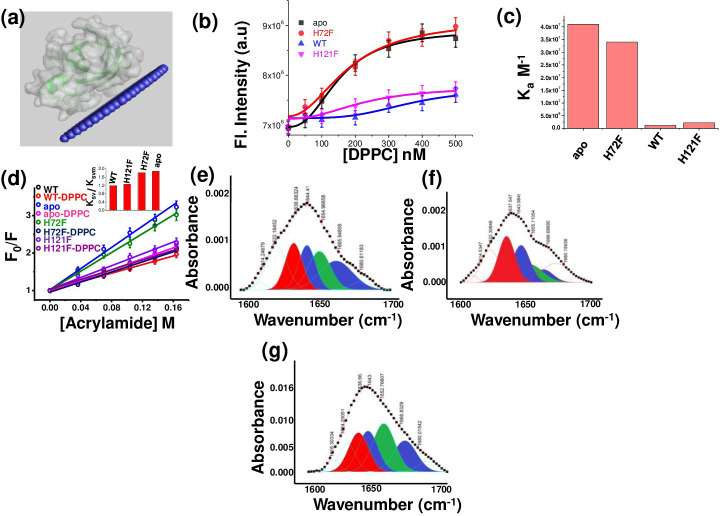
(a) Steady-state tryptophan fluorescence spectra of WT, apo, and other two metal mutants (H121F and H72F). The WT displays an emission maximum at 332 nm, whereas the apo variant shows a red-shifted spectrum with the emission maximum at 350 nm. On the other hand, H121F and H72F show emission maxima at intermediate wavelengths. Deconvoluted FTIR spectral signatures of (b) WT and (c) apo. Red contour (~1637 cm−1) indicates beta sheet; blue color contour stands for disorder (1644 cm−1) and loops and turns (~1667 cm−1); green contour represents alpha helical character. All these secondary signatures were obtained by considering the amide-I spectra, which arises due to carbonyl frequency (C = O). (d) Percentage of different secondary structural components in WT, apo, H121F, and H72F are shown in this figure. n.s denotes nonsignificant change, while ** stands for significant change with p-value<0.01. Error bars indicate the standard deviation of the data, which were obtained from triplicate experiments. Here, D + T/L stands for Disorder +Turns/Loops. (e) The membrane association of the apo protein as suggested by the OPM calculations. The membrane association of apo protein through the stretches 45–70 and 128–142 has been evaluated from the calculations. The residues which are involved in binding with membrane (Thr54,58, Ala54, Gly56,61, Pro62, Asn53, Glu49, Lys136, Glu132,133) are mentioned. (f) A schematic representation regarding the membrane binding experiments through FCS which suggests that with increasing concentration of DPPC small unilamellar vesicles (SUVs), the alexa labeled free monomeric protein populations (fast component of diffusion model) decreases with concomitant increase in the membrane bound labeled protein that is the slow component. (g) The correlation functions of alexa 488 maleimide labeled apo SOD1 in the absence (black) and presence of DPPC SUVs (red) where DPPC concentration was kept 500 nM. The green correlation curve corresponds to an intermediate DPPC concentration (100 nM). The inset shows the residual distributions of the correlation curves. (h) The hydrodynamic radii of free alexa 488-apo SOD1 and membrane bound labeled apo SOD1 were plotted against the concentrations of added DPPC SUVs. The average hydrodynamic radius of fast component that is free monomeric apo SOD1 (rH1) was found to be 13.5 Å, whereas the average radius for slow membrane bound protein molecule (rH2) was found to be 170 Å. The change of rH1 and rH2 with increasing DPPC SUV concentration remains invariant. (i) Percentage populations of membrane bound alexa-labeled protein variants were plotted against the concentrations of DPPC SUVs added to evaluate the binding affinities of the protein variants towards membranes. (j) Deconvoluted FTIR spectra of apo in membrane (DPPC SUV) bound condition. (k) Percentage of different secondary structural components in WT, apo, H121F, and H72F in the presence of DPPC SUVs are shown in this figure. n.s denotes nonsignificant change, while *** stands for significant change with p-value<0.001.
Figure 2—figure supplement 1. Activity assay (pyrogallol auto-oxidation) for WT and other metal mutants of SOD1.
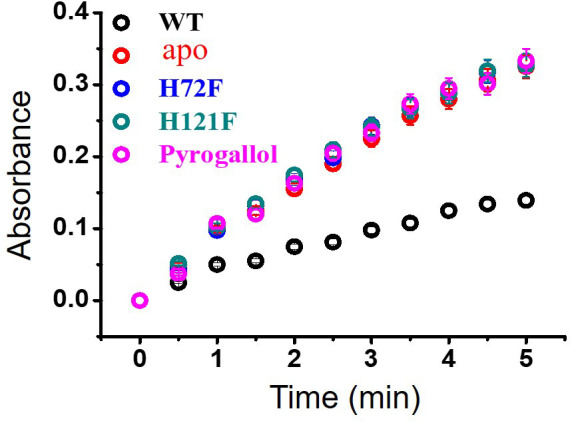
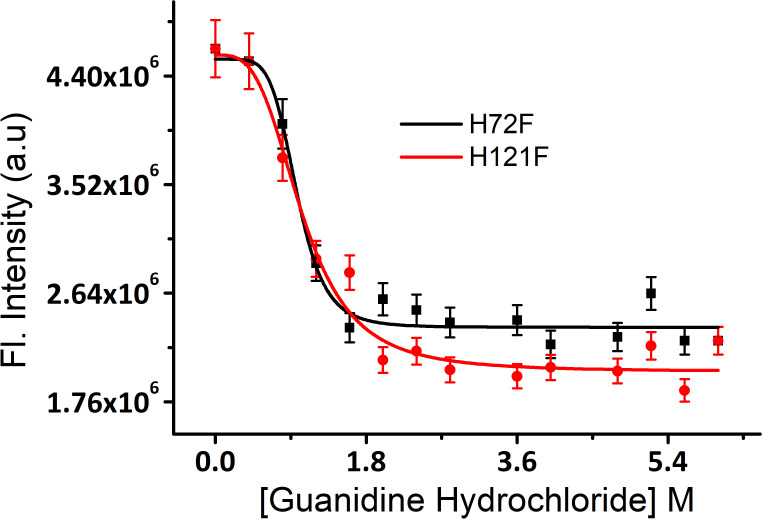
Figure 2—figure supplement 2. Equilibrium unfolding transitions of H121F and H72F mutants using guanidinium hydrochloride as chemical denaturant.
Figure 2—figure supplement 3. Acrylamide quenching experiments for the different variants.
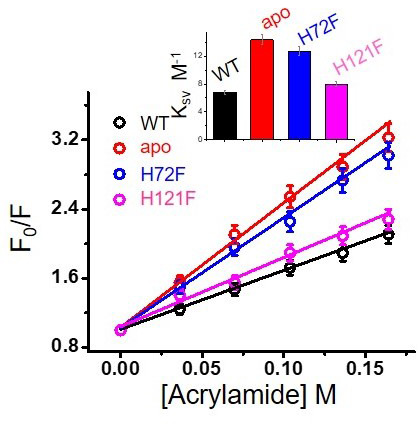
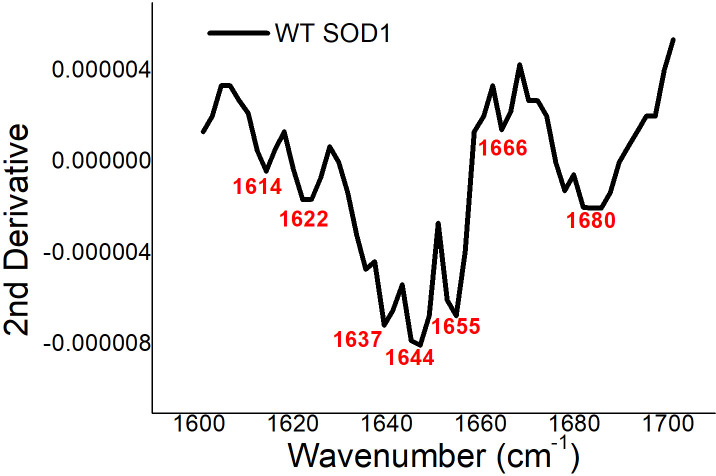
Figure 2—figure supplement 5. Second derivative of the FT-IR data obtained with WT SOD1.
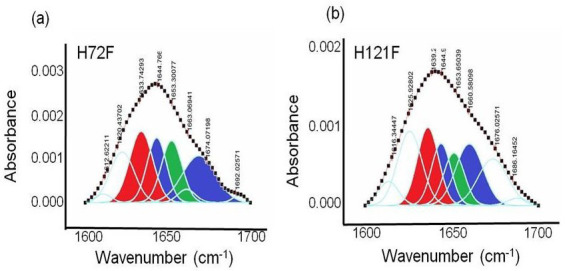
Figure 2—figure supplement 6. FTIR assessment of the H72F and H121F mutant.
