Abstract
Objectives:
To determine the feasibility and performance of a deep learning system (DLS) used to create synthetic artificial intelligence-based fat-suppressed (FS) MR images (AFSMRI) of the knee.
Materials and Methods:
This single-center study was approved by the Institutional Review Board. Artificial intelligence-based fat-suppressed MR images were created from non-FS images using a deep learning system with a modified Convolutional Neural Networks-based U-Net that employed a training set of 25,920 images and validation set of 16,416 images. Three musculoskeletal radiologists reviewed 88 knee MR studies in two sessions, the original (proton density (PD) + FSPD) and the synthetic (PD + AFSMRI). Readers recorded AFSMRI quality (diagnostic/non-diagnostic), and the presence or absence of meniscal, ligament and tendon tears, cartilage defects, and bone marrow abnormalities. Contrast-to-noise (CNR) measurements were made between subcutaneous fat, fluid, bone marrow, cartilage, and muscle. The original MR imaging sequences were used as the reference standard to determine the diagnostic performance of AFSMRI (combined with the original PD sequence). This is a fully balanced study design, where all readers read all images the same number of times, which allowed the determination of the interchangeability of the original and synthetic protocols. Descriptive statistics, intermethod agreement, interobserver concordance, and interchangeability tests were applied. A p value < 0.01 was considered statistically significant for the likelihood ratio testing, and p value <0.05 for all other statistical analyses.
Results:
AFSMRI quality was rated as diagnostic (98.9%[87/88]-100%[88/88], all readers). Diagnostic performance (sensitivity/specificity) of the synthetic protocol was high, for tears of the menisci (91%[71/78], 86%[84/98]), cruciate ligaments (92%[12/13], 98%[160/163]), collateral ligaments (80%[16/20], 100%[156/156]), and tendons (90%[9/10], 100 %166/166)). For cartilage defects and bone marrow abnormalities, the synthetic protocol offered an overall sensitivity/specificity of 77% (170/221)/93%(287/307), and 76%(95/125)/90%(443/491), respectively. Intermethod agreement ranged from moderate to substantial for almost all evaluated structures (menisci, cruciate ligaments, collateral ligaments, and bone marrow abnormalities). No significant difference was observed between methods for all structural abnormalities by all readers (p>0.05), except for cartilage assessment. Interobserver agreement ranged from moderate to substantial for almost all evaluated structures. Original and synthetic protocols were interchangeable for the diagnosis of all evaluated structures. There was no significant difference for the common exact match proportions for all combinations (p> 0.01). The conspicuity of all tissues assessed through CNR was higher on AFSMRI than on original FSPD images (P<0.05).
Conclusions:
Artificial intelligence-based fat-suppressed MR imaging (3D AFSMRI) is feasible, and offers a method for fast imaging, with similar detection rates for structural abnormalities of the knee, compared with original 3D MR sequences.
Keywords: Synthetic MRI, Knee, Deep Learning, Machine learning, CNN, U-Net, GAN, Musculoskeletal imaging
INTRODUCTION
Magnetic resonance (MR) imaging is the modality of choice for assessing internal derangement of the knee1. Artificial intelligence (AI) algorithms, and in particular, deep learning systems (DLS), provide new ways for detection, segmentation, and classification of imaging datasets and have been applied to knee MR imaging, primarily for the purpose of enhancing or automating diagnostic performance for the evaluation of articular cartilage, the anterior cruciate ligament (ACL) and the menisci2–9.
For clinical knee MR imaging, there is also a continual emphasis on the need for fast imaging, particularly to meet increasing demand 10–15. Not only do the advantages of fast imaging include the ability to increase MR throughput and reduce patient discomfort and motion artifacts, the protocol can be expanded to include other types of sequences (such as related to cartilage mapping) given the imaging time savings. Faster knee imaging has been achieved clinically through the improvement of conventional sequences and scan times. In particular, with the advent of 3D sequences, knee MR imaging can be achieved through only two sagittal acquisitions (an intermediate-weighted/proton density (PD) acquisition and a fluid-sensitive acquisition with fat suppression), which can in turn be reformatted in any plane of choice, including traditional coronal and axial planes, thereby improving the assessment of complex or obliquely-lying structures16–20.
We hypothesized that a synthetic, AI-based method of fat suppression derived from an intermediate-weighted non-fat-suppressed 3D sequence is feasible and could replace the need for acquiring separate fat-suppressed imaging of the knee. AI-based image synthesis methods have previously been applied to medical imaging to convert images between modalities, such as MR-to-CT and CT-to-MR synthesis21, with the most commonly used techniques Cycle-GAN22 and Pix2Pix23, both having the core algorithm, a U-Net24. The purpose of our study was to develop and optimize a convolutional neural network (CNN)-based U-Net for creating synthetic fat-suppressed MR imaging (AFSMRI) of the knee from a single 3D non fat-suppressed PD acquisition, and to evaluate the diagnostic performance of this AI-based technique for the assessment of common knee abnormalities.
MATERIALS AND METHODS
Overview
A modified CNN-based U-Net was used to create synthetic fat-suppressed imaging from non-fat-suppressed intermediate-weighted 3D volumetric imaging of isotropic resolution. A set consisting of 25,920 (11,520 fat-suppressed PD and 14,400 non-fat-suppressed PD) images acquired for routine knee MR imaging was used for training the DLS. Subsequently, the algorithm was optimized on 16,416 images (7,296 fat-suppressed PD and 9,120 non-fat-suppressed PD) with input from expert musculoskeletal radiologists, and finally tested on a set of 88 MR imaging studies of the knee that included routine 3D fat-suppressed and non-fat-suppressed PD sequences.
Three readers reviewed the images in two sessions (session 1: the original study consisting of the non-fat-suppressed and fat-suppressed proton density (PD) 3D volumetric sequences, session 2: original non-fat-suppressed sequence and AFSMRI). We chose a fully balanced study design, where all readers read all images the same number of times, which allowed the determination of the interchangeability of the original and synthetic protocols. This study design does not require a validated standard of reference such as arthroscopy. The diagnostic performance of the readers for each session was compared.
Subject Population
This single-center study was approved by the Institutional Review Board and was performed in compliance with both the Declaration of Helsinki and Health Insurance Portability and Accountability Act (HIPPA) regulations. The requirement for informed consent was waived.
Inclusion criteria for the study were any patient referred to our department for assessment of internal derangement with routine knee MR imaging at 3T between May and September 2019, using a protocol that included two 3D volumetric acquisitions of isotropic resolution (PD, fat-suppressed PD). Exclusion criteria were patients without these sequences, those who had received intravenous contrast medium, or were referred for indications other than internal derangement which would necessitate a different protocol (such as for tumor imaging).
MRI Imaging Acquisition
All MR imaging studies were performed on a 3T system (Magnetom Skyra, Siemens Healthcare, Erlangen, Germany) using a 48 phased array radiofrequency channels and commercially available transmit/receive 15 phased array knee coil (QED, Mayfield Village, OH).
The study protocol consisted of two commercially available sagittal-acquired 3D volumetric pulse sequences of isotropic resolution (turbo spin echo SPACE (Sampling perfection with application-optimized contrasts using different flip angle evolution), a FS intermediate-weighted 3D sequence (sagittal, [TR/TE 1100/108ms, slice thickness 0.6mm]) and non-FS 3D sequence [sagittal, TR/TE 1000/28ms, slice thickness 0.5mm])(GOKnee3D; Siemens Healthcare, Erlangen, Germany), both with 1D GRAPPA (Generalized Autocalibrating Partial Parallel Acquisition sampling pattern)15, 19. Each 3D data set was reformatted into standard axial and coronal images sets of 0.5-mm slice thickness. The imaging parameters are summarized in Table 1.
Table 1.
MR Imaging Parameters
| Parameters | 3D FS PD GRAPPA |
3D PD GRAPPA |
|---|---|---|
| Orientation | Sagittal | Sagittal |
| Repetition time (msec) | 1100 | 1000 |
| Echo time (msec) | 108 | 28 |
| Acceleration factor | 2 | 2 |
| Echo train length | 42 | 60 |
| Receiver bandwidth (Hz/pixel) | 416 | 422 |
| Flip angle (degree) | T2 Variable | Constant |
| Acquisition matrix | 320 × 320 | 320 × 320 |
| Slice thickness (mm) | 0.6 | 3.0–5.0 |
| Intersection gap (mm) | 0 | 0 |
| Reconstructed voxel size (mm) | 0.6 × 0.6 × 0.6 | 0.5 × 0.5 × 5.0 |
| Voxel volume (mm3) | 0.21 | 0.12 |
| No.excitations | 1 | 2 |
| Phase encoding direction | Right to left and anterior to posterior | Right to left and anterior to posterior |
| Fat suppression | SPAIR | None |
MR indicates magnetic resonance; 2D, 2-dimensional; 3D, 3-dimensional; GRAPPA, Generalized Autocalibrating Partial Parallel Acquisition; FS, fat-suppressed.
Deep Learning Algorithm for AFSMRI
AFSMRI was created using a modified version of the semantic deep learning architecture termed the U-Net24. The deep learning network architecture for the U-Net is illustrated in Figure 1. The encoder, decoder, and the bridge sections of the U-Net consisted of three, one, and three convolutional blocks, respectively, with each block comprised of two convolutional layers with ReLU activation, followed by batch normalization. The encoder convolutional blocks were preceded by a max pooling layer (window size=2×2), while the decoder convolutional blocks were preceded by an unpooling layer, followed by concatenation with the layer at the same level in the encoder section, as shown in Figure 1. An image sharpening filter was applied to the output of the final convolutional layer of the network to produce a more realistic image and overcome the blurring caused by unpooling25.
Figure 1.
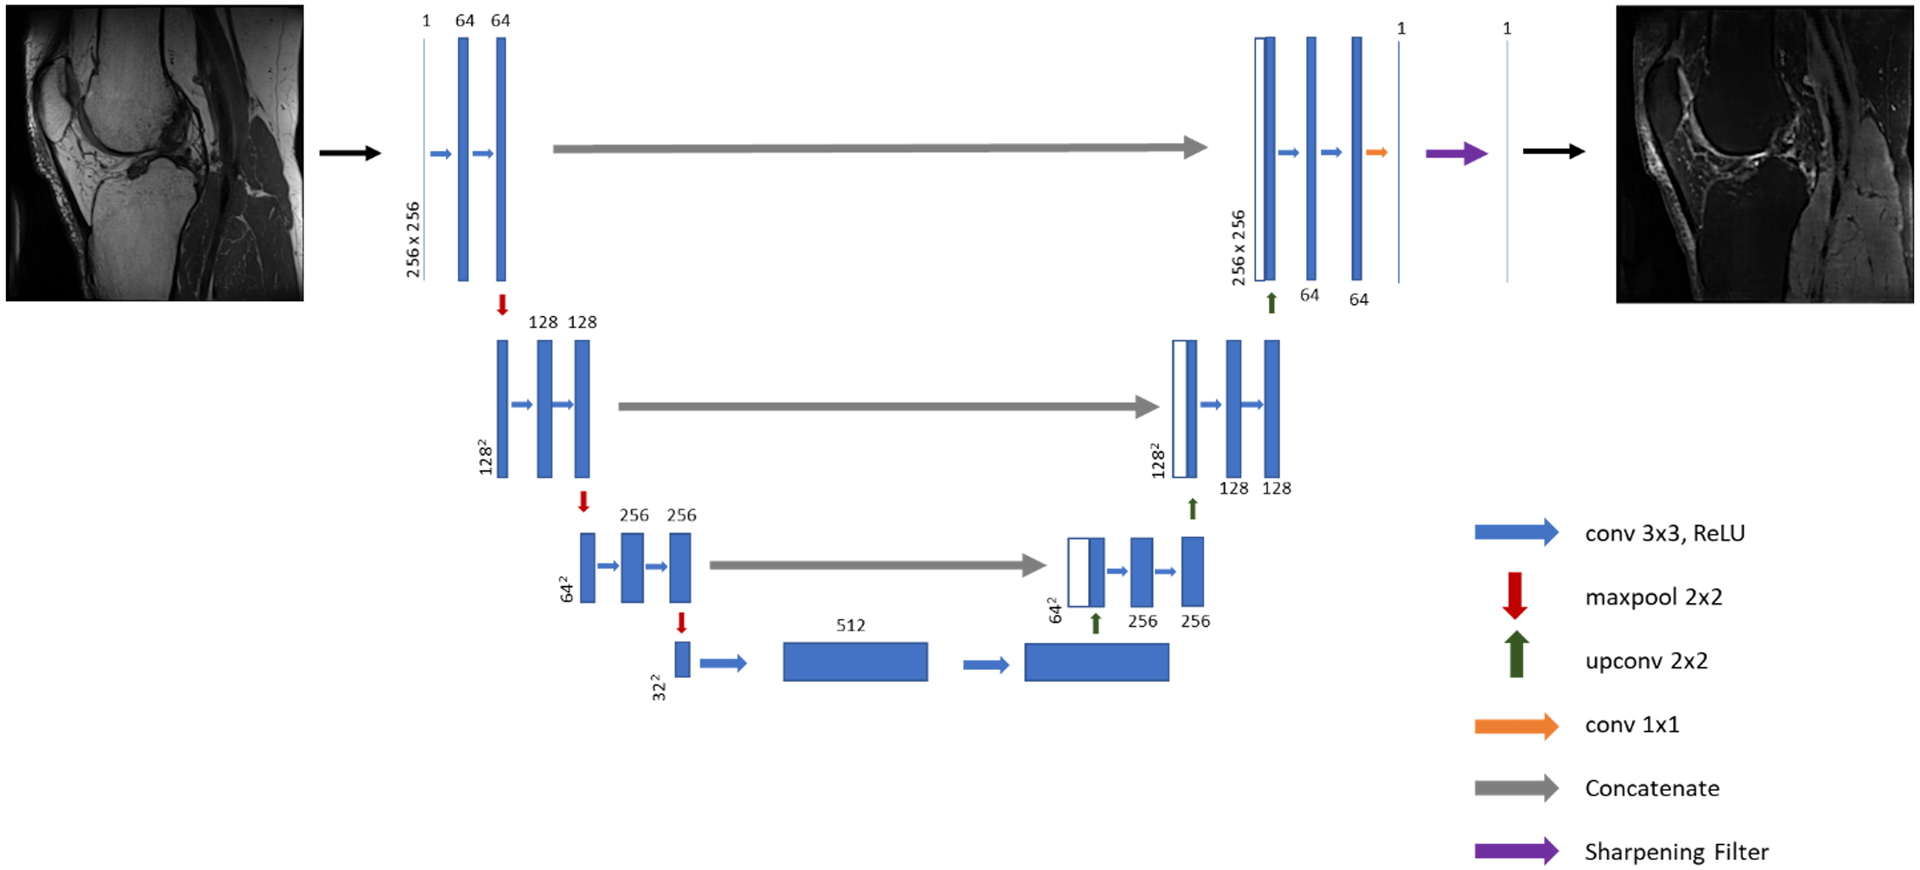
Illustration of the U-Net architecture implemented for synthesis of fat-suppressed imaging from non-fat-suppressed imaging.
Training, Validation and Test Sets
The total training dataset consisted of 98 knee MR studies, with images acquired according to the protocol above. The 98 studies were divided into two groups: A training data set (60 studies with 25,920 images, including 11,520 FS PD and 14,400 non-FS PD) upon which the algorithm was initially trained, and a validation dataset (38 studies with 16,416 images including 7,296 FS PD and 9,120 non-FS PD) upon which optimization of the deep learning hyperparameters was performed. The network was trained to produce synthetic images in all imaging orientations (sagittal, axial, and coronal), and the optimal hyperparameters for training the network were as follows:
Minibatch size = 30
Number of epochs = 20
Optimization function = Stochastic Gradient Descent (learning rate = 0.01, momentum=0.9)
Cost function: Mean Squared Error (MSE)
L2 regularization = 0.0001
Initial learn rate = 0.5
Then, the algorithm with optimal hyperparameters was retrained on all 98 studies.
The optimized AFSMRI algorithm was then tested on a test data set of 88 knee MR studies. These data were run on a Nvidia DGX system with four Volta GPUs and the deep learning code was implemented on MATLAB 2019b (Mathworks inc.).
Reader procedures for test set analysis
All anonymized MR imaging studies were retrospectively reviewed separately by three musculoskeletal radiologists (with 15, 6 and 1 years of post-residency experience, the latter two being musculoskeletal imaging fellows) in a random order to reduce bias. At the time of analysis, the readers had no knowledge of the electronic medical records, including clinical history, the results of physical examination, arthroscopic findings, diagnosis, previous reports, or sequence parameters (original versus synthetic protocol). All images were digitally assessed by using a commercially available RadiAnt Dicom Viewer (Version 5.0.1.21910, Poznan, Poland). The reviewers were free to view isotropic data sets in interactive multiplanar reconstruction mode, using their preferred window, magnification, and scrolling mode.
Image analysis was performed in two sessions. The readers first independently evaluated all the routine knee MR imaging sequences (PD and FSPD sequences, in sagittal plane as well as multiplanar reformats to standard coronal, axial and any desired plane of interest), and at a second session, they evaluated the synthetic AFSMRI sequence alongside the PD sequence (in all planes, similar to the conventional sequences) (Figure 2). The sessions were separated by at least two weeks in order to reduce a potential learning bias.
Figure 2.
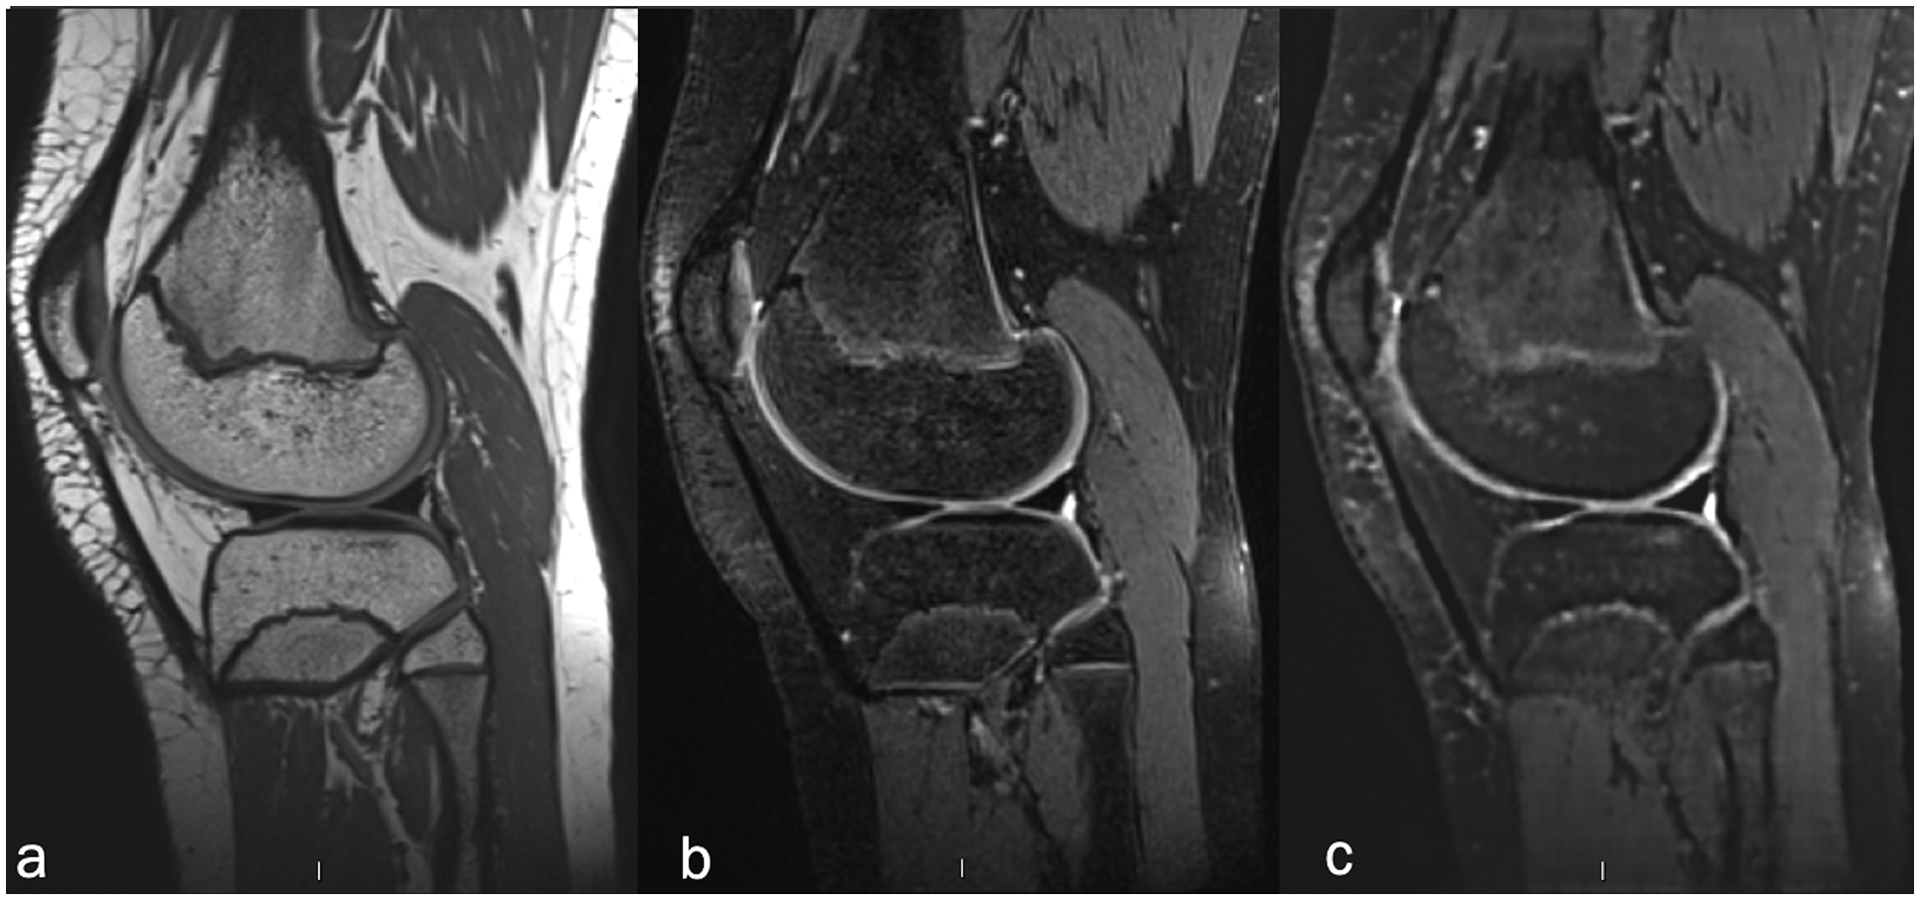
Sagittal 3D volumetric pulse sequences of isotropic resolution (a) non-fat-suppressed intermediate-weighted FSE (TR/TE 1000/28ms, slice thickness 0.5mm), (b) fat-suppressed intermediate-weighted FSE (TR/TE 1100/108ms, slice thickness 0.6mm), and (c) synthetic MR images (AFSMRI).
Overall subjective image quality was rated on a semiquantitative scale using a four-point score according to the evaluation of the following criteria: edge sharpness, amount of blurring artifacts, contrast between fluid and soft tissue, fluid and cartilage, delineation of small ligamentous structures, and amount of noise: (1) Diagnostic, no artifact (optimal image quality); (2) Diagnostic, 1–25% artifact (one or two criteria were not optimal); (3) Nondiagnostic, 26%−50% artifact (Diagnosis limited by the criteria listed); (4) Nondiagnostic, > 50% artifact (diagnosis substantially limited by the criteria listed).
Subsequently, image features were assessed. Readers recorded the presence or absence of meniscal (medial and lateral menisci), ligament (anterior and posterior cruciate ligaments, medial and lateral collateral ligaments) and tendon (quadriceps and patellar tendons) tears. The articular cartilage was evaluated according to the presence or absence of cartilage defects (partial thickness or full thickness), and location of abnormality within six compartments (medial femoral condyle, lateral femoral condyle, medial tibial plateau, lateral tibial plateau, trochlea, and patella). The presence or absence of bone marrow edema-like signal and fracture, and their location in the aforementioned six compartments was recorded. A tendon or ligament tear was defined as complete or partial discontinuity, or with indistinct margins26–28. A meniscal tear was defined as the presence of abnormal signal intensity within the meniscus that extended to the meniscal articular surface, or an abnormal morphologic contour of the meniscus29, 30. The cartilage defects were graded as (1) partial-thickness, comprising less or greater than 50% but less than 100% of the total thickness of the articular surface, and (2) full-thickness defect, extending to the subchondral bone31. The highest-grade chondral defect in each compartment was reported by the readers. Subchondral bone marrow edema-like signal was characterized by an area of flame-shaped increased signal on fluid-sensitive sequences.
Quantitative comparison of signal-to-noise ratio (SNR) and contrast-to-noise-ratios (CNR) on 3D AFSMRI and 3D FSPD sequences were made by one observer between bone marrow, cartilage, fluid, subcutaneous fat, and muscle. Signal intensity (SI) were measured on the sagittal plane in cancellous bone (distal femoral metaphysis), articular cartilage (trochlear cartilage or patella), joint fluid (intercondylar notch or suprapatellar bursa), subcutaneous fat (popliteal fossa), muscle (medial gastrocnemius at the level of the femorotibial joint). In order to minimize a potential error on the SNR estimate, round or oval ROIs (region of interest) were copied into identical sizes and locations on synthetic and conventional MR images, and the region of interest areas were approximately 2 mm2 for cartilage, 5 mm2 for joint fluid, and 10 mm2 for fat, and air. The mean pixel value was used as the signal intensity, and the standard deviation (SD) of background ROI placed just posterior to the popliteal fossa was used as the noise. The rater was careful to avoid regions that might contain motion artifacts (ghosting and ringing). The SNR was determined as the ratio of the mean signal intensity of tissue to the standard deviation of the signal in an ROI placed in background (SNR: SI / SD background). Subsequently, CNR was calculated by using the formula: CNR= SNRROI1 – SNR ROI32.
Statistical Analysis
Bland-Altman tests were run to evaluate the agreement between the measurements between the original and validation datasets33, 34. The interpretation of the routine MR imaging sequences was used as the reference standard to determine the diagnostic performance of AFSMRI (combined with the original PD sequence) for detecting knee abnormalities. Evaluation of score data was performed with median values. Comparison of scores between conventional and synthetic images was performed using a signed-rank Wilcoxon paired test and Cohen’s Kappa was used to calculate inter-method agreement. Fleiss’s Kappa was used to test inter-rater reliability agreement between the three readers. The 95 % confidence intervals (CIs) associated with the Kappa values were also calculated. Agreement was interpreted as poor agreement (< 0), slight agreement (0.01–0.20), fair agreement (0.21–0.40), moderate agreement (0.41–0.60), substantial agreement (0.61–0.80) or almost perfect agreement (0.81–1.00)35. The sensitivity, specificity, accuracy, positive and negative predictive values (PPV and NPV) for evaluating internal derangements of the knee were calculated on synthetic MRI, using the conventional images as the gold standard. Interchangeability of the original or synthetic (AFSMRI) protocols for diagnoses of structural abnormalities was assessed with likelihood ratio testing, using proportions of exact matches when all readers were reading images of the original and synthetic protocols in different combinations (p.e. AFSMRI-AFSMRI-AFSMRI, Original-Original-Original, AFSMRI-AFSMRI-Original, AFSMRI-Original-Original, etc.), and final testing for significant differences19, 36. A p value < 0.01 was considered statistically significant for the likelihood ratio testing, and p value <0.05 for all other statistical analyses. All statistical analyses were performed using Matlab software (R2019a, The Mathworks, Natick, MA, USA).
RESULTS
Following training of the AFSMRI algorithm on the initial training set (25,920 Images), optimization of the algorithm was performed on an additional 16,416 images and results from the application of the AFSMRI model on the validation set were excellent. The original and synthetic AFSMRI images were significantly (p<0.05) correlated, with R=0.8. An example of these is shown in Figure 3a. The Bland-Altman plot was used to test the agreement between the signal intensities in the original and synthetic images, as shown in Figure 3b, demonstrating excellent agreement between the signal intensity measurements from the two data sets.
Figure 3.
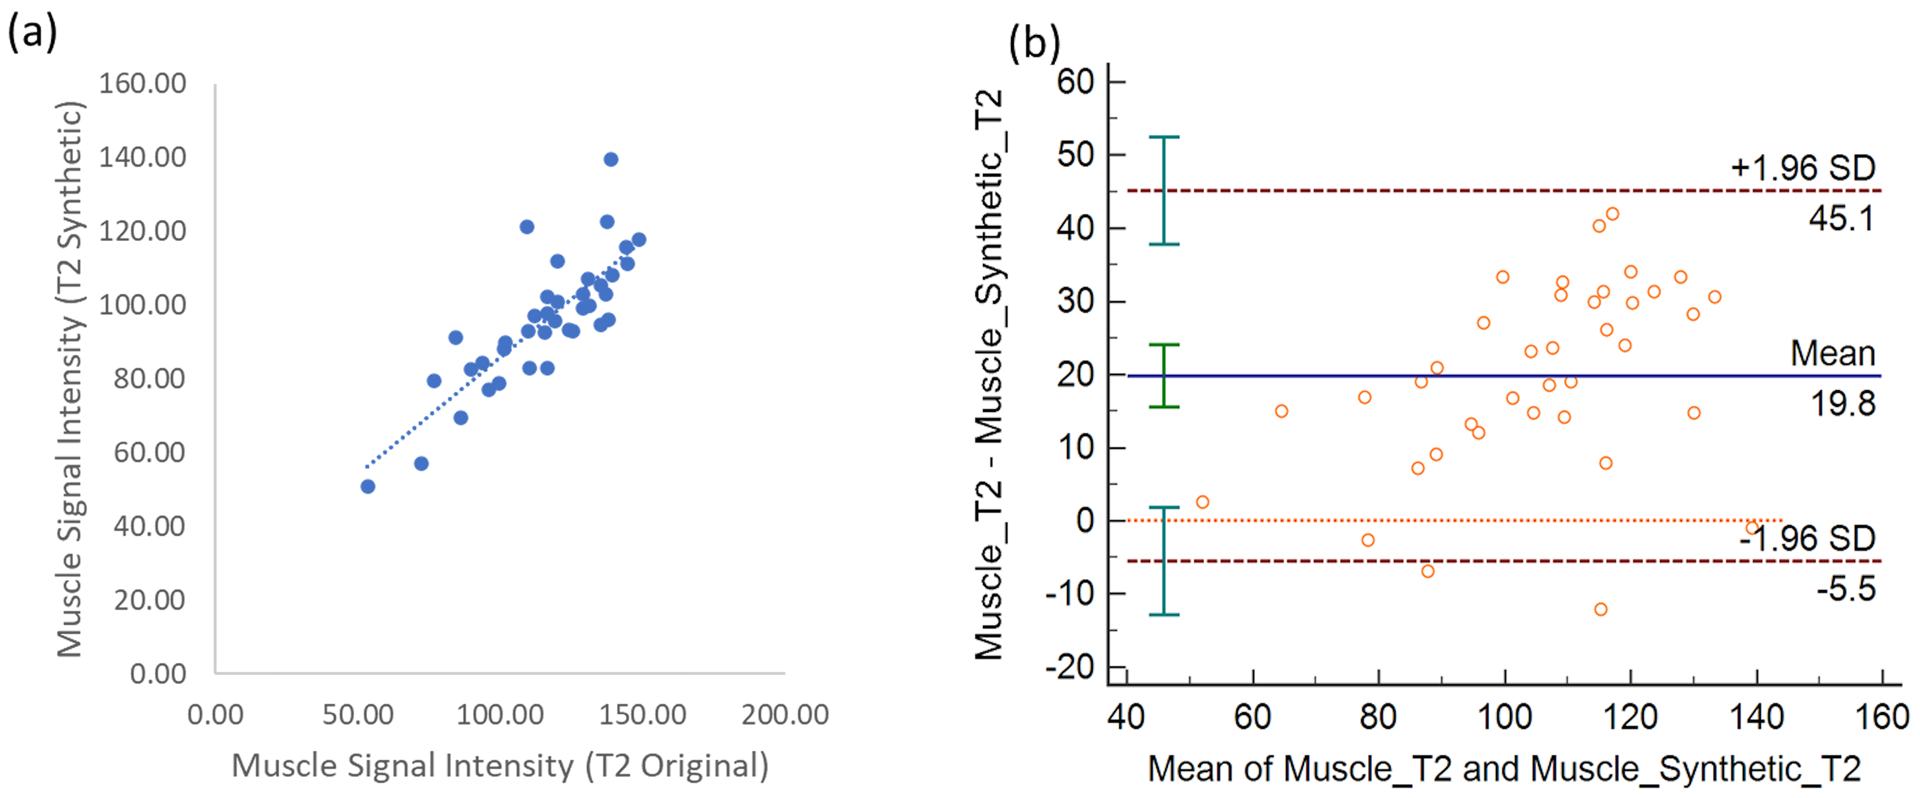
(a) Scatterplot between the muscle tissue signal intensity between the original FS PD-weighted and synthetic images (AFSMRI). The Pearson correlation was obtained at 0.8 (b) Bland Altman plot between the different muscle tissue signal intensities. Bland-Altman plots demonstrating the limits of agreement of the two highly correlated T2FS-signal intensities measurements between the original MR sequence and AFSMRI deep learning (MPDL). The mean is shown by the solid horizontal line center line (19.9 and the confidence intervals (±2SD) are shown by the dotted lines.
A total of 88 complete knee MR imaging studies (43 male, 45 female; age 39 ± 22 years, range 10–78) were included as the test set. On average, the total acquisition time for the conventional knee MR examination was 11min 20s (6 min 5s for 3D FSPD, and 5 min 15 s for 3D PD). The synthetic AFSMRI sequence created from the non-FS 3D PD sequence enabled an overall reduction of 54.5% in scanning time (total knee protocol scan time of 5 min 15 s).
For the evaluation of subjective image quality, the AFSMRI sequence was uniformly rated as diagnostic by three readers (98.9% [87/88], 96.6% [85/88], 100% [88/88]), with the majority fitting into the diagnostic with mild artifact (1–25% artifact) or no artifact categories, whereas 100% (88/88) of conventional sequences were rated as having diagnostic quality.
Tables 2A and 2B show the inter-method agreement, and the sensitivity and specificity of the synthetic protocol (including 3DPD and AFSMRI) for the assessment of structural abnormalities, compared to the original protocol. Intermethod agreement ranged from moderate to substantial for almost all evaluated structures (menisci, cruciate ligaments, collateral ligaments, and bone marrow abnormalities). No significant difference was observed between methods for almost all structural abnormalities by all readers (p>0.05), except for cartilage assessment by the least experienced reader (R3), and for tendons by one reader (R2). The differences observed between readers may in part reflect the different experience of the readers (R1 > R2 > R3 in years of experience), and relative familiarity with the 3D sequencing. Interobserver agreement ranged from moderate to substantial for almost all evaluated structures.
Table 2A.
Structural abnormalities: sensitivity, specificity, and accuracy of AFSMRI
| Sensitivity (%) | Specificity (%) | Accuracy (%) | |||||||
|---|---|---|---|---|---|---|---|---|---|
| Structure | Reader 1 | Reader 2 | Reader 3 | Reader 1 | Reader 2 | Reader 3 | Reader 1 | Reader 2 | Reader 3 |
| Menisci | 91(71/78) | 80(47/59) | 83(57/69) | 86(84/98) | 91(107/117) | 77(82/107) | 88 | 84 | 79 |
| Cruciate Ligaments | 92(12/13) | 91(10/11) | 54(14/26) | 98(160/163) | 96(158/165) | 91(137/150) | 98 | 95 | 86 |
| Collateral Ligaments | 80(16/20) | 76(13/17) | 32(12/38) | 100(156/156) | 93(148/159) | 86(118/138) | 98 | 91 | 74 |
| Tendons (quadriceps / patellar) | 90(9/10) | 9(1/11) | 18(4/18) | 100(166/166) | 100(165/165) | 95(146/154) | 99 | 94 | 85 |
| Cartilage (femur, tibia, and patella)† | 77(170/221) | 80(263/328) | 57(150/262) | 93(287/307) | 71(142/200) | 88(233/266) | 87 | 70 | 73 |
| Bone marrow abnormalities (edema and fracture) | 76(95/125) | 66(63/95) | 49(52/106) | 90(443/491) | 93(455/488) | 91(463/510) | 87 | 87 | 84 |
Data were dichotomized into defect (partial and full thickness) and no-defect (normal) groups.
Table 2B.
Structural abnormalities: Intermethod agreement between Original MRI and AFSMRI
| Intermethod Agreement | ||||||
|---|---|---|---|---|---|---|
| Reader 1 | Reader 2 | Reader 3 | ||||
| Structure | P value* | kappa values** | P value* | kappa values** | P value* | kappa values** |
| Menisci | 0.5 | 0.76(0.66–0.85) | 0.8 | 0.71(0.6–0.83) | 0.1 | 0.57(0.45–0.69) |
| Cruciate Ligaments | 0.7 | 0.84(0.69–0.99) | 0.2 | 0.69(0.48–0.9) | 0.9 | 0.44(0.24–0.64) |
| Collateral Ligaments | 0.5 | 0.87(0.75–0.99) | 0.2 | 0.58(0.38–0.78) | 0.4 | 0.18(−0.02–0.39) |
| Tendons (quadriceps / patellar) | 0.8 | 0.94(0.83–1) | 0.003 | 0.16(−0.34–0.66) | 0.1 | 0.16(−0.14–0.46) |
| Cartilage (femur, tibia, and patella)† | 0.4 | 0.35(0.17–0.51) | 0.6 | 0.25(0.1–0.4) | 0.02 | 0.28(0.16–0.4) |
| Bone marrow abnormalities (edema and fracture) | 0.6 | 0.62 (0.55–0.7) | 0.6 | 0.59(0.51–0.67) | 0.4 | 0.4(0.3–0.51) |
Wilcoxon Rank test;
Cohen’s kappa values, with 95% confidence intervals in parentheses;
Data were dichotomized into defect (partial and full thickness) and no-defect (normal) groups.
The sensitivity, specificity and accuracy of AFSMRI (in combination with the original 3DPD sequence) was similar to that of conventional imaging (p>0.05), for the detection of meniscus tears (accuracy 79–88% for all readers; Figures 4 and 5) and ligament tears (accuracy 80–98%) with accuracy higher for the cruciate ligaments (86–98%; Figure 6) than the collateral ligaments (74–98%). Overall diagnostic accuracy and specificity were high for the detection of tendon abnormalities by all readers (85–99% and 95–100%, respectively), although the sensitivity was variable (Figure 7).
Figure 4.
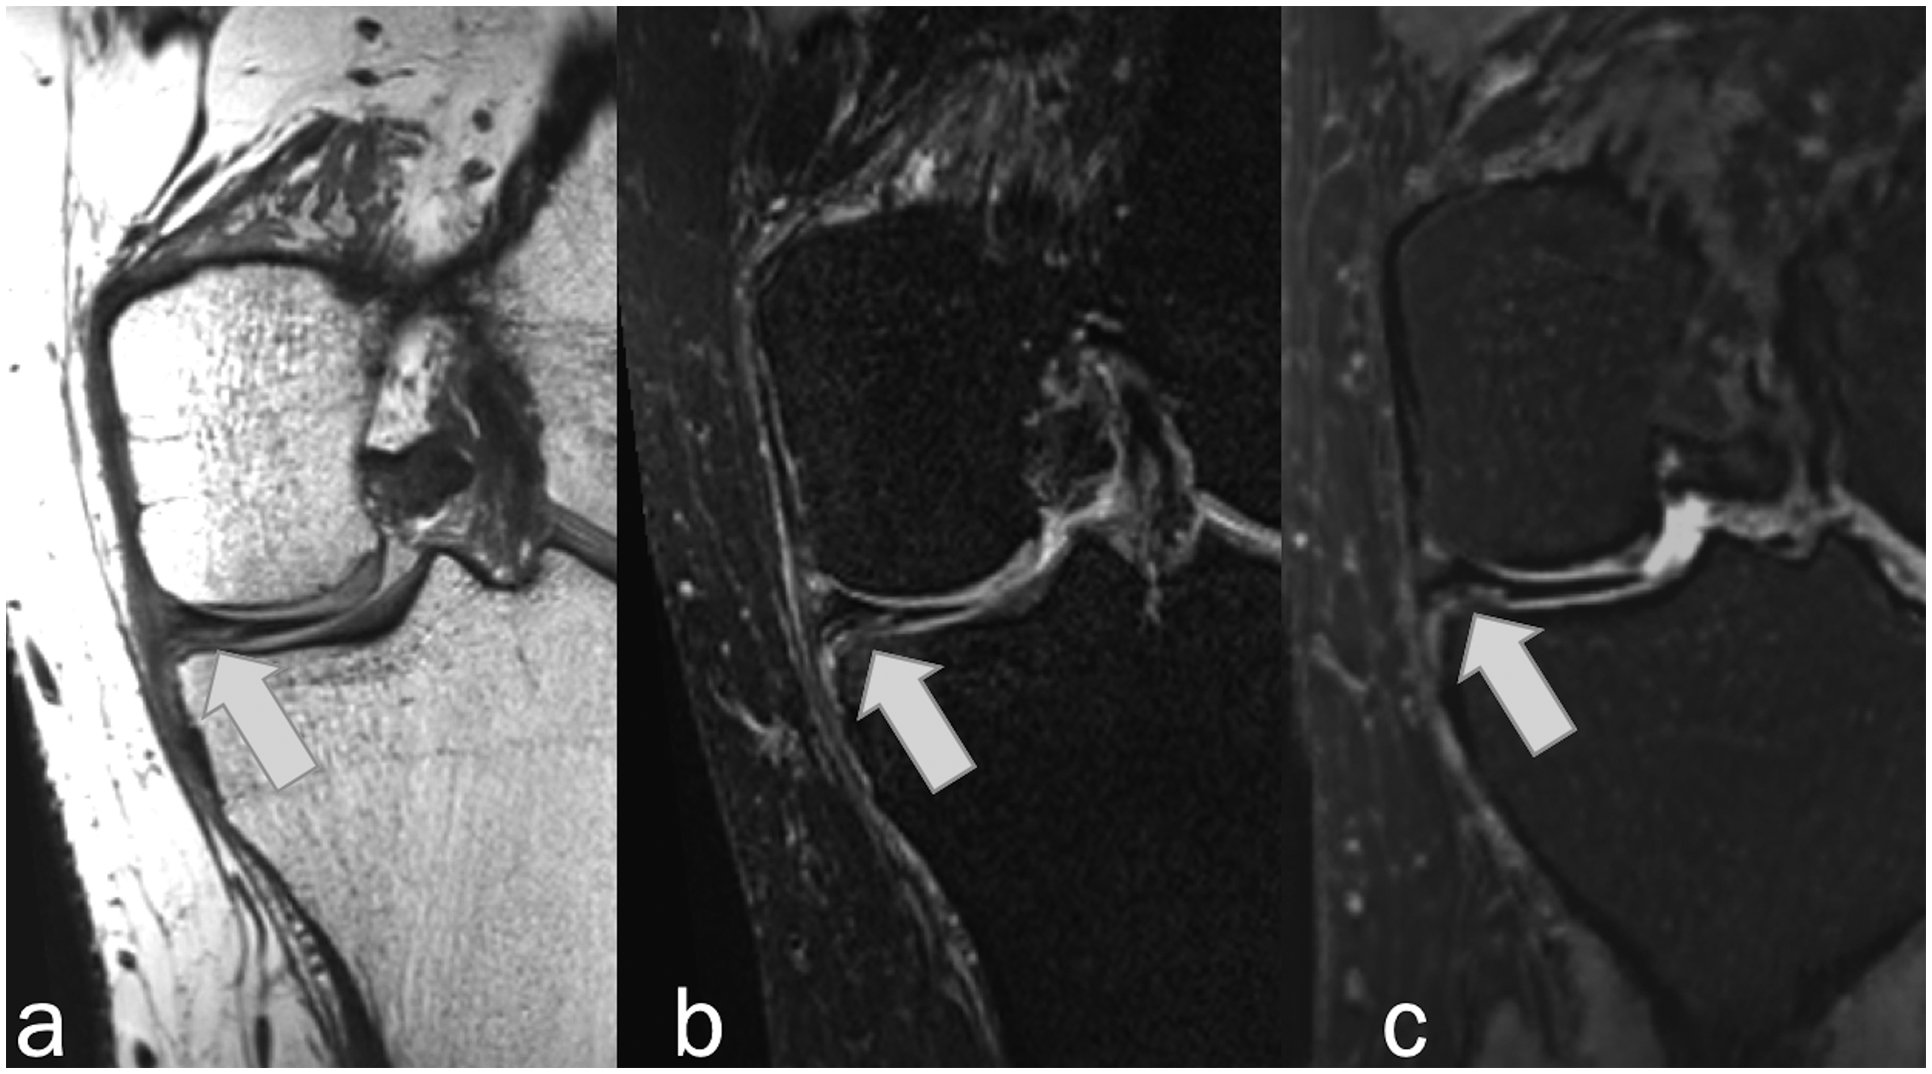
Coronal MR images in 28-year-old man showing horizontal tear of the medial meniscus (arrows) that was detected by all readers on Original and Synthetic protocols. (a) Non-fat-suppressed PD-weighted, (b) fat-suppressed PD-weighted, and (c) fat-suppressed synthetic MRI (AFSMRI).
Figure 5.
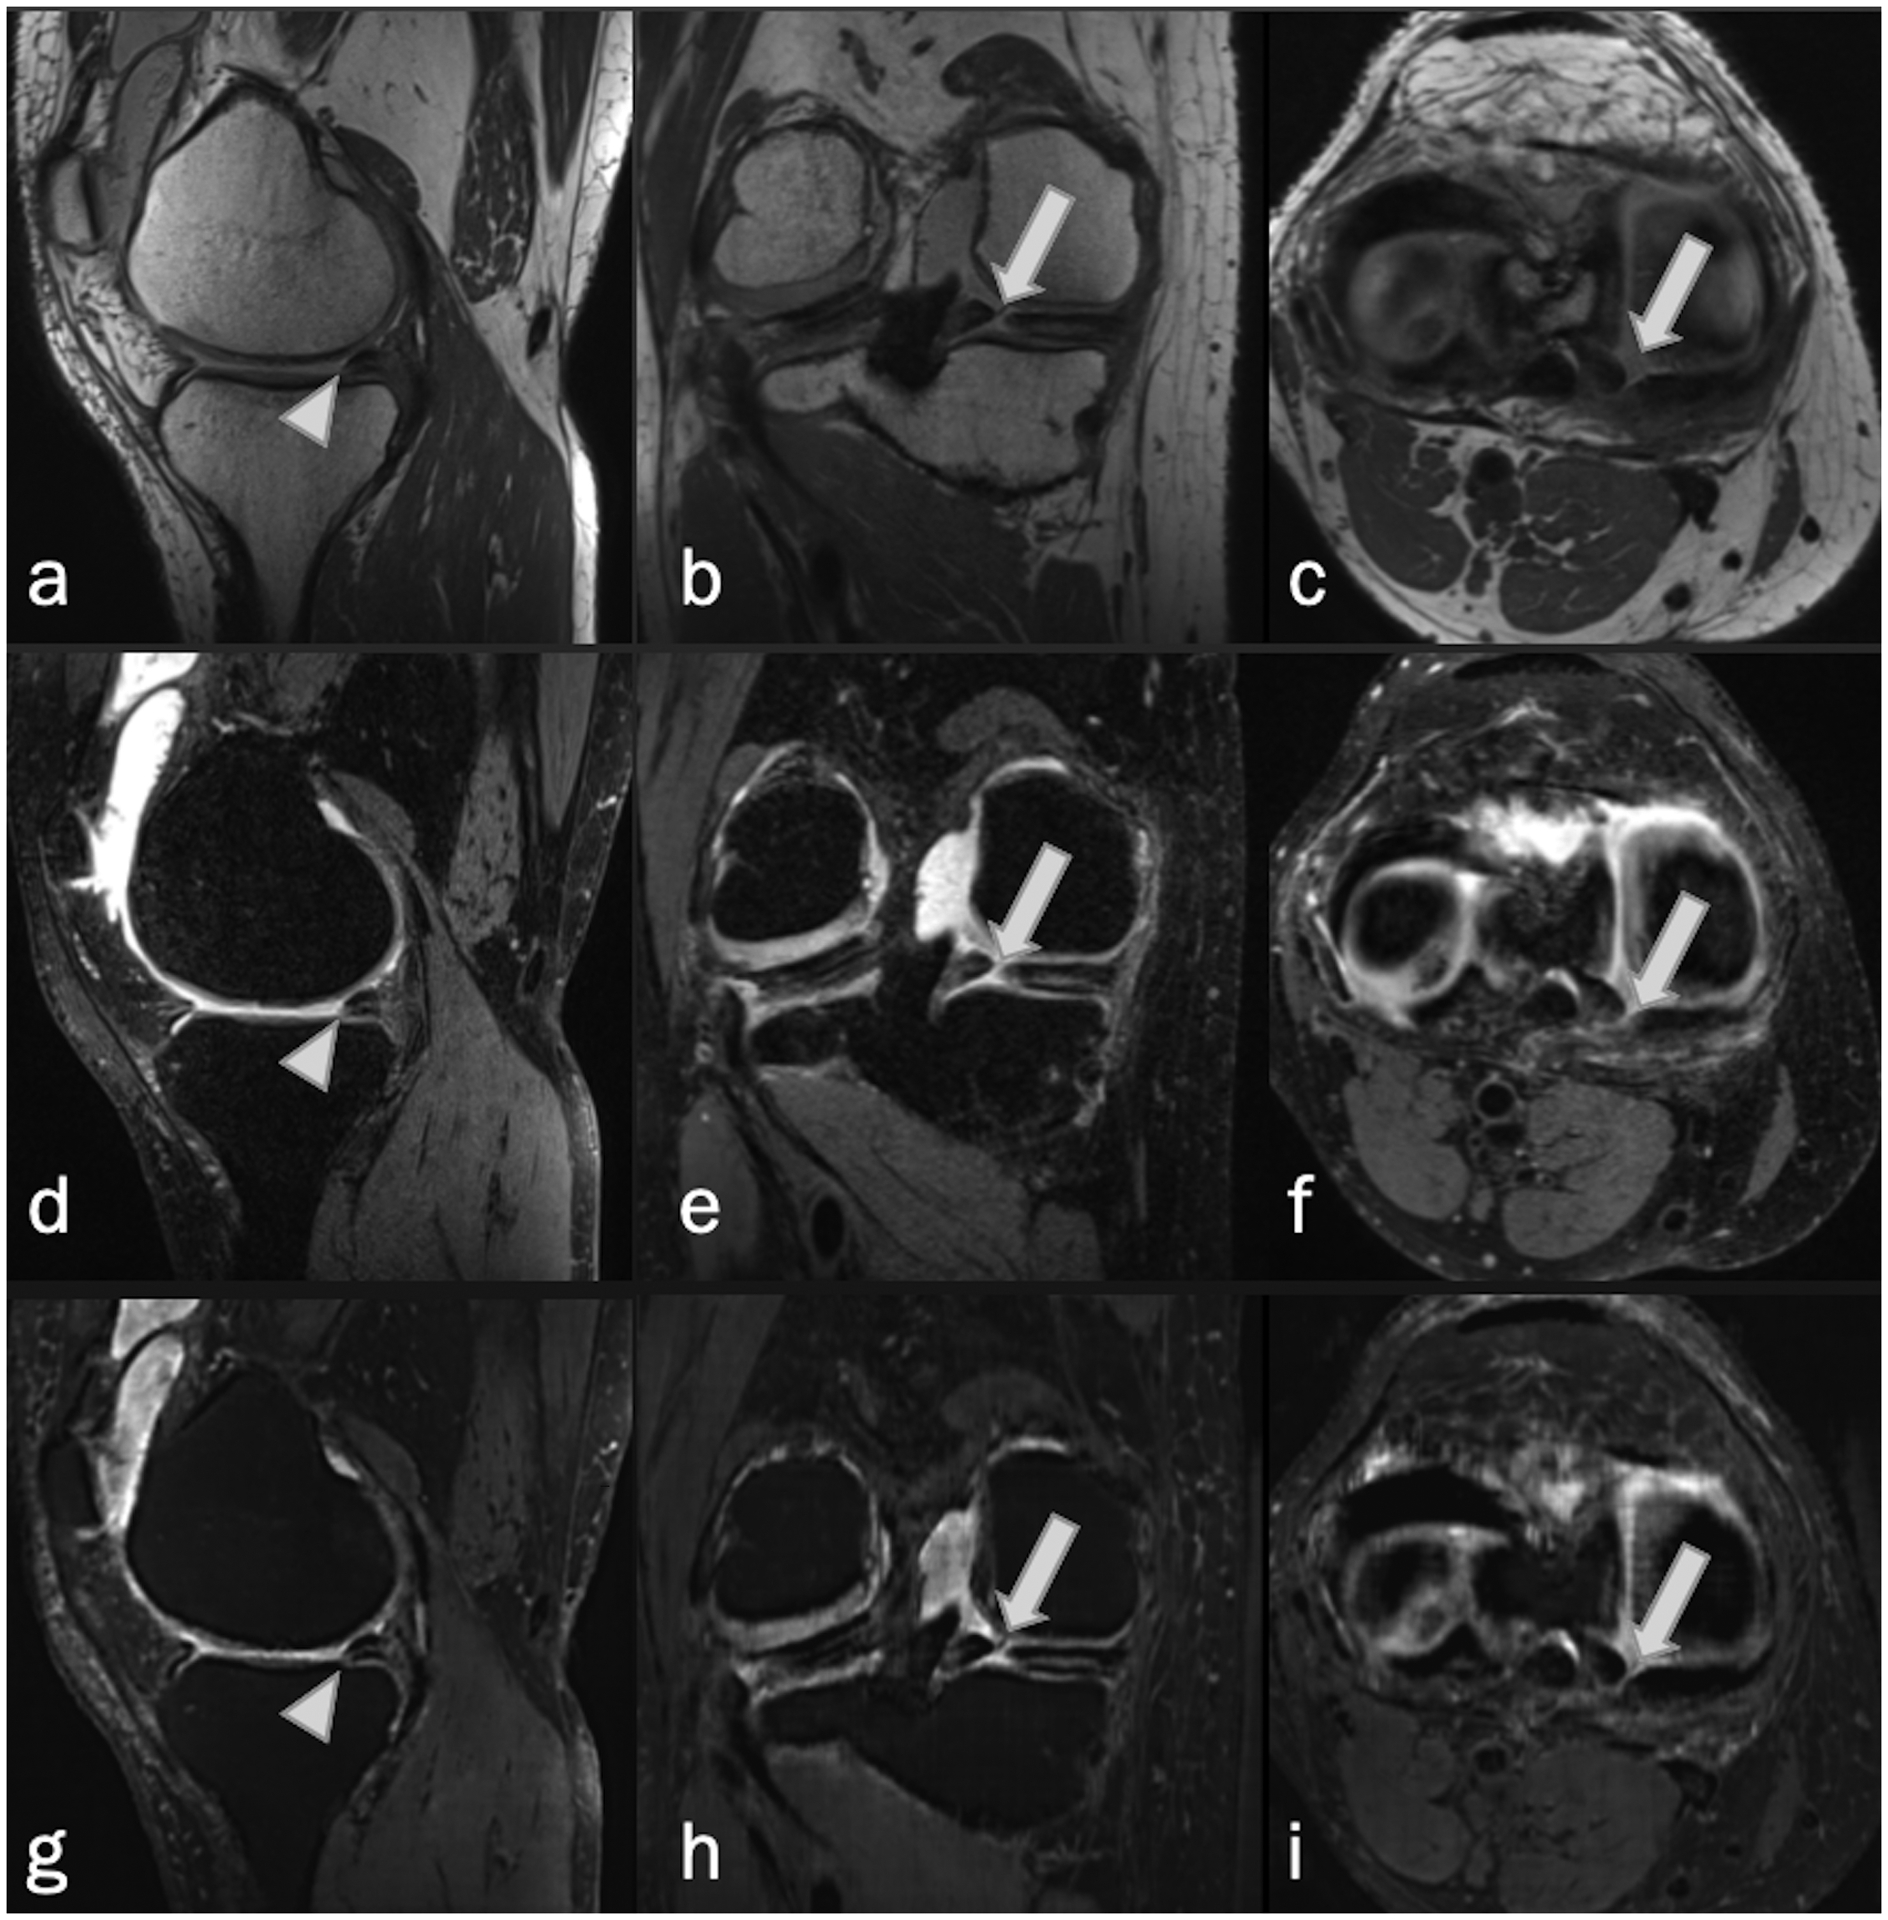
Complex tear of the medial meniscus in a 52-year-old woman. Sagittal, coronal and axial MRI, (a-c) non-fat-suppressed PD-weighted, (d-f) fat-suppressed PD-weighted, and (g-i) fat-suppressed synthetic MRI (AFSMRI) show a combination of complete radial (arrows), and horizontal (arrowheads) tears of the posterior horn.
Figure 6.

Sagittal MR images in a 38-year-old man with complete anterior cruciate ligament tear. (a) Non-fat-suppressed PD-weighted, (b) fat-suppressed PD-weighted, and (c) fat-suppressed synthetic MRI (AFSMRI) show complete disruption of the fibers of the ligament (arrows), detected by all readers with the Original and Synthetic protocols.
Figure 7.
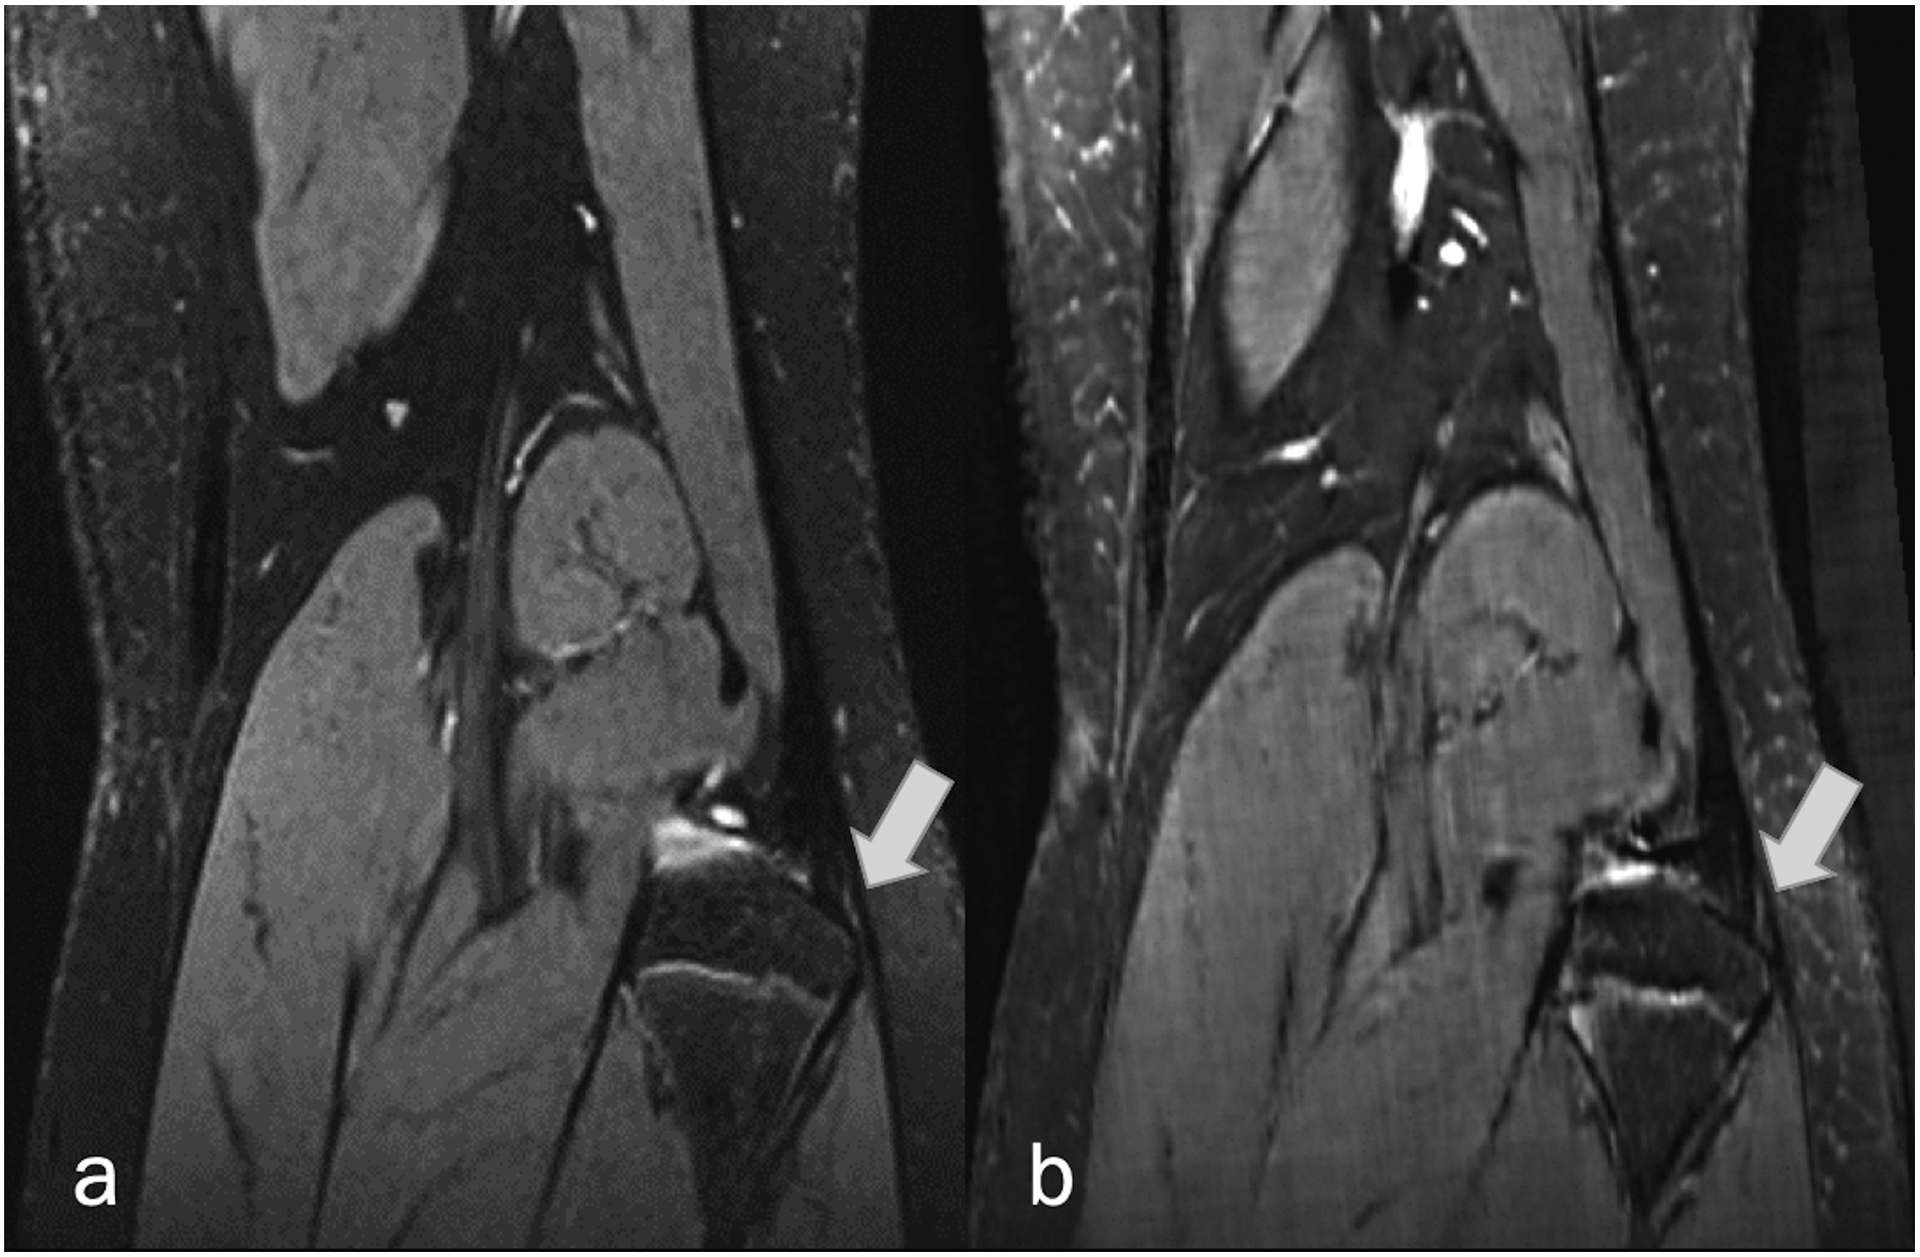
Coronal (a) fat-suppressed PD-weighted, and (b) fat-suppressed synthetic MRI (AFSMRI) show a subtle partial tear of the biceps femoris tendon insertion.
Regarding cartilage abnormalities, there was no significant difference between the two methods throughout all articular compartments, combining the detection of partial or full thickness defects, with overall accuracy of the synthetic method ranging from 70%−87% (Figure 8). While the detection rate of full thickness defects for the synthetic protocol was similar to that of the original protocol (Figures 9 and 10), partial thickness cartilage defects were underestimated by the synthetic protocol in the femorotibial compartments (21/352[6%] vs 47/352 [13.3%], and patellofemoral compartment (20/176 [11.3%] × 28/176 [16%]).
Figure 8.
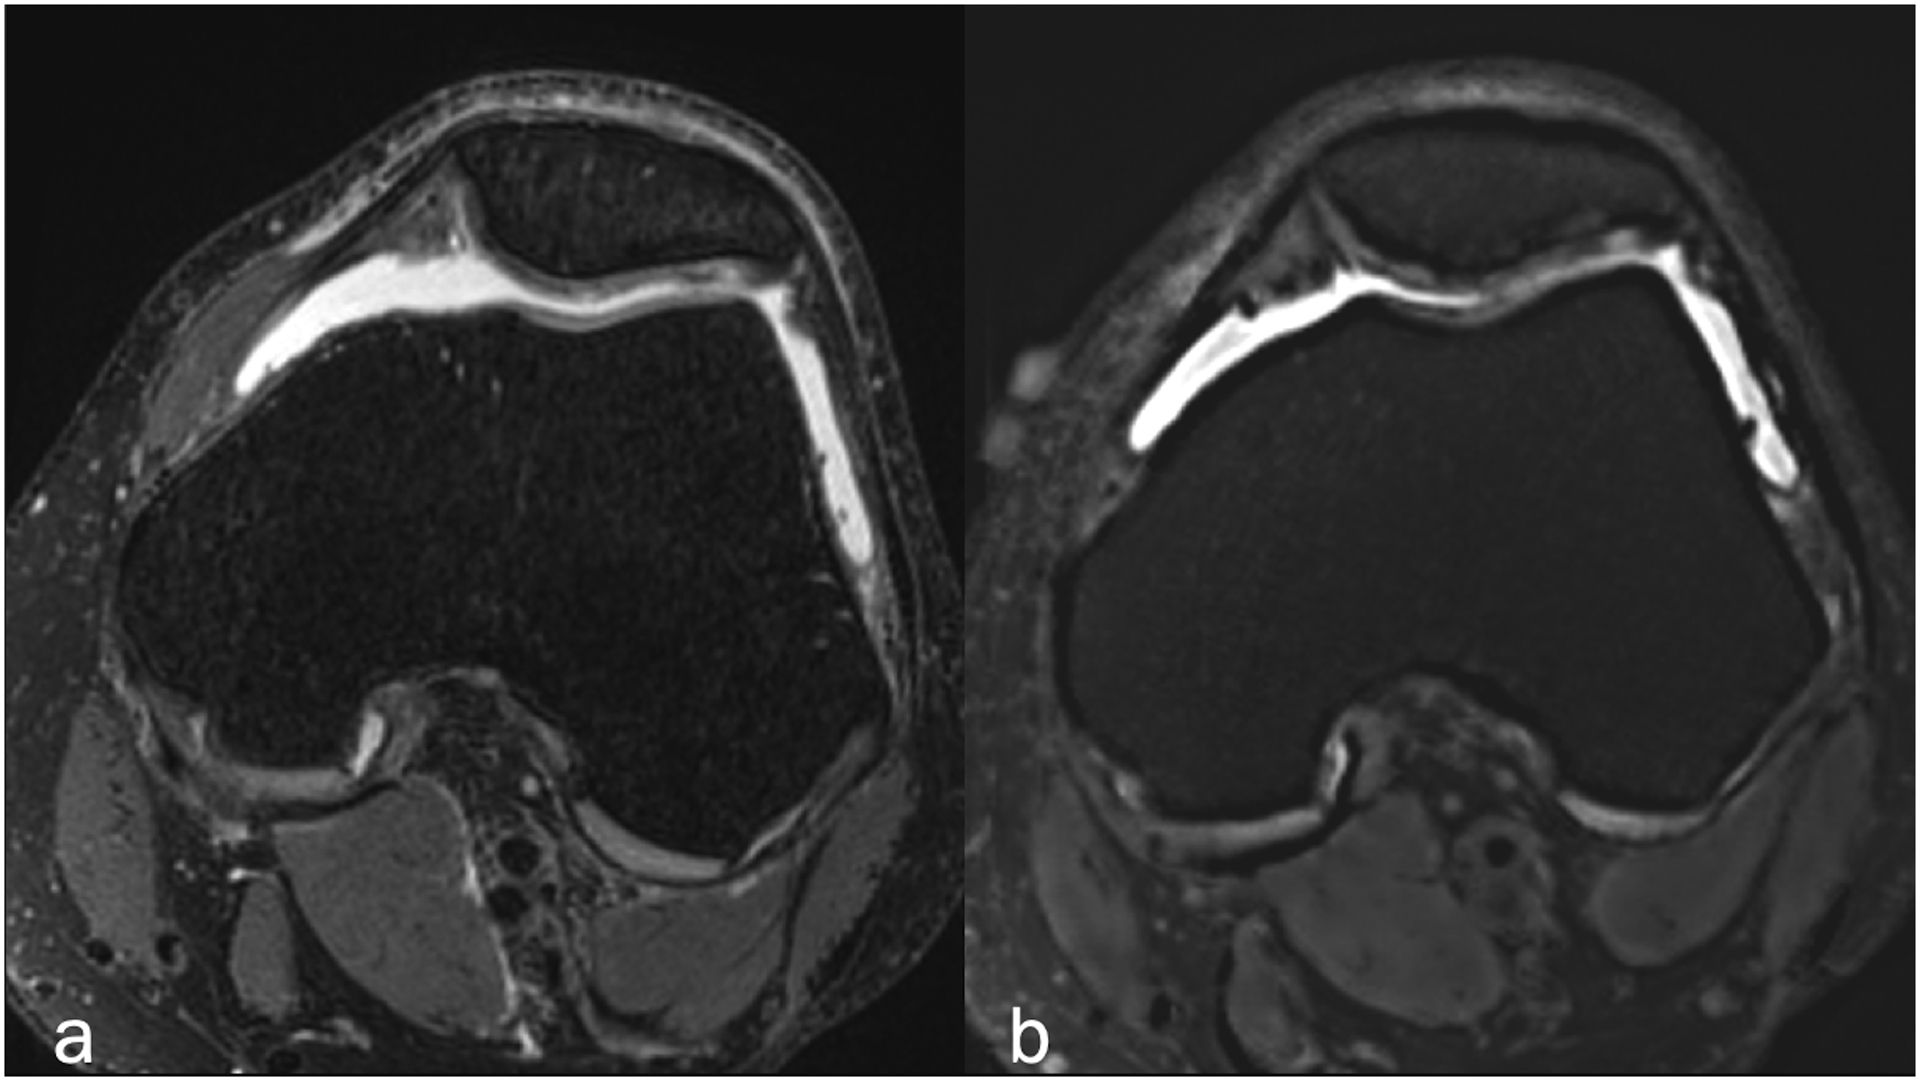
Axial (a) fat-suppressed PD-weighted, and (b) fat-suppressed synthetic MRI (AFSMRI) showing patellar cartilage with preserved thickness, normal contours and diffusely heterogeneous signal, which was comparable between the sequences. The trochlear cartilage is normal.
Figure 9.
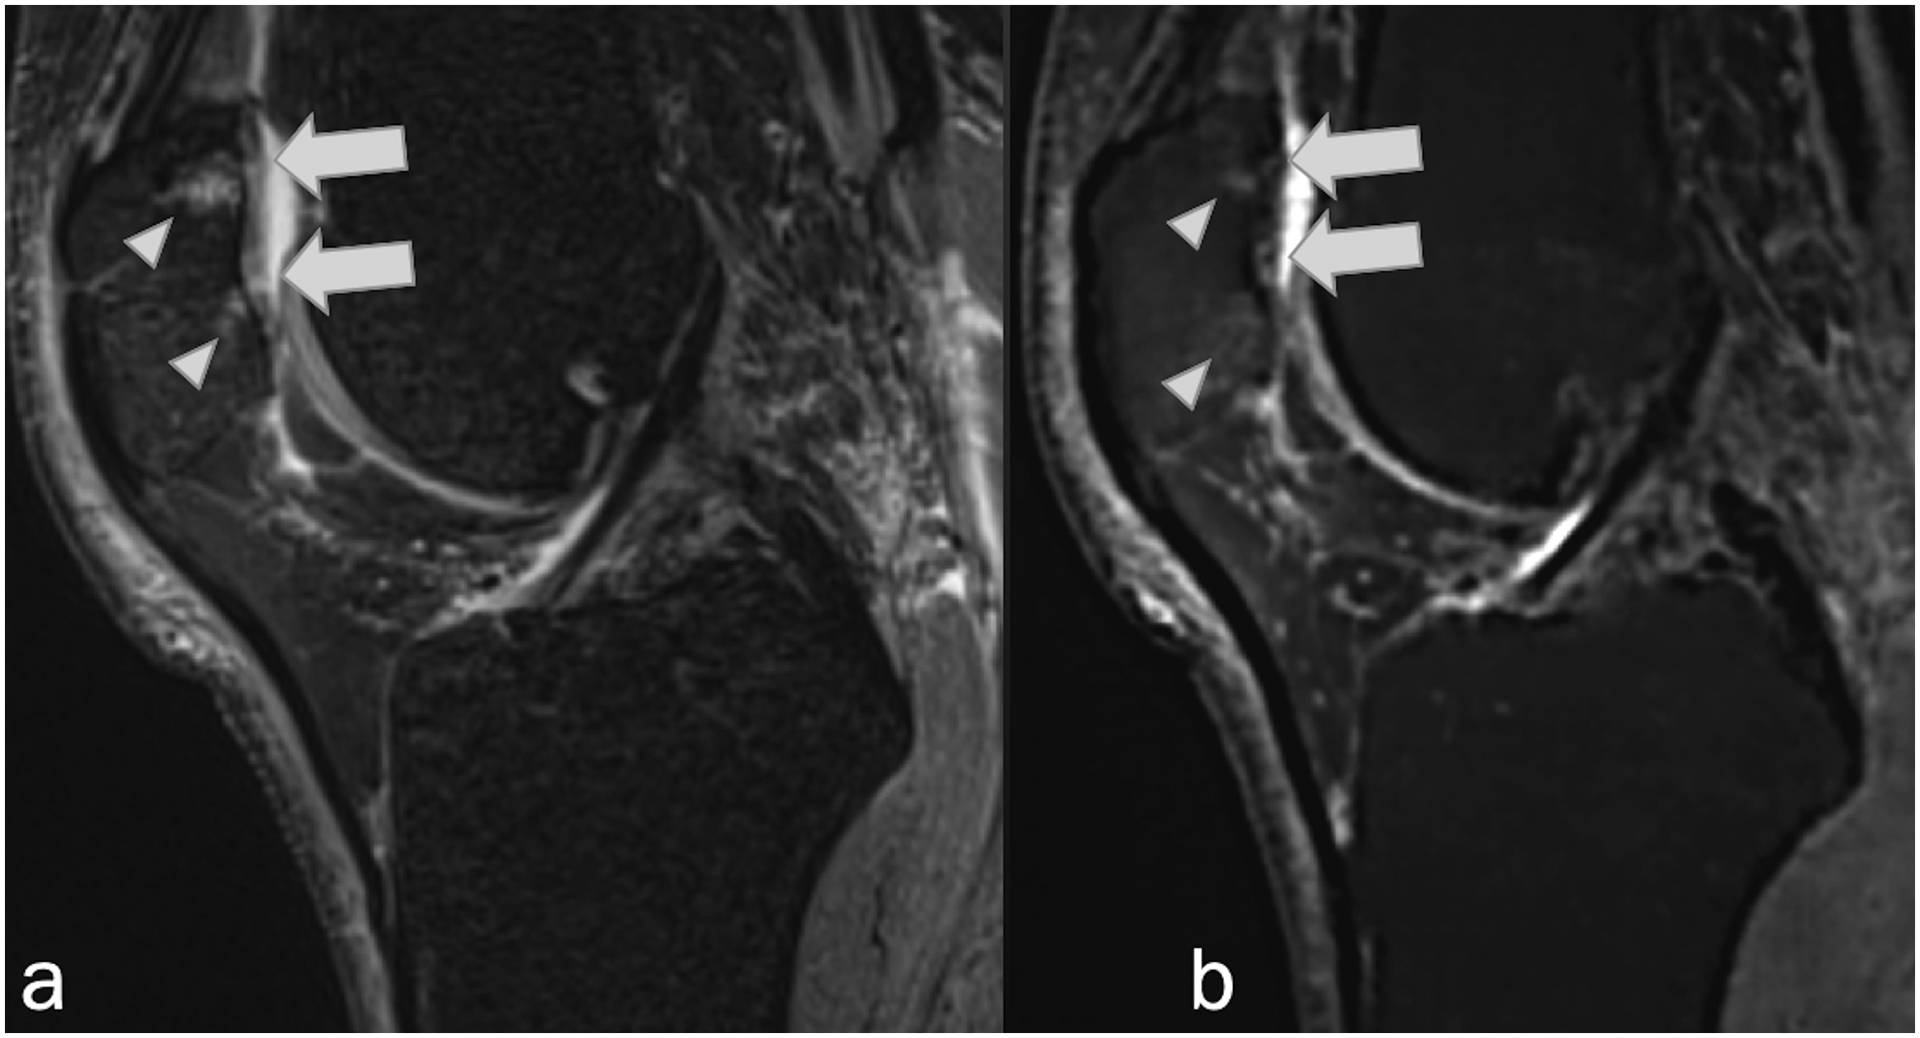
Sagittal (a) fat-suppressed PD-weighted, and (b) fat-suppressed synthetic MRI (AFSMRI) showing linear signal hyperintensities suggestive of deep chondral fissures (arrows), reaching the subchondral bone, associated with adjacent bone marrow edema (arrowheads).
Figure 10.
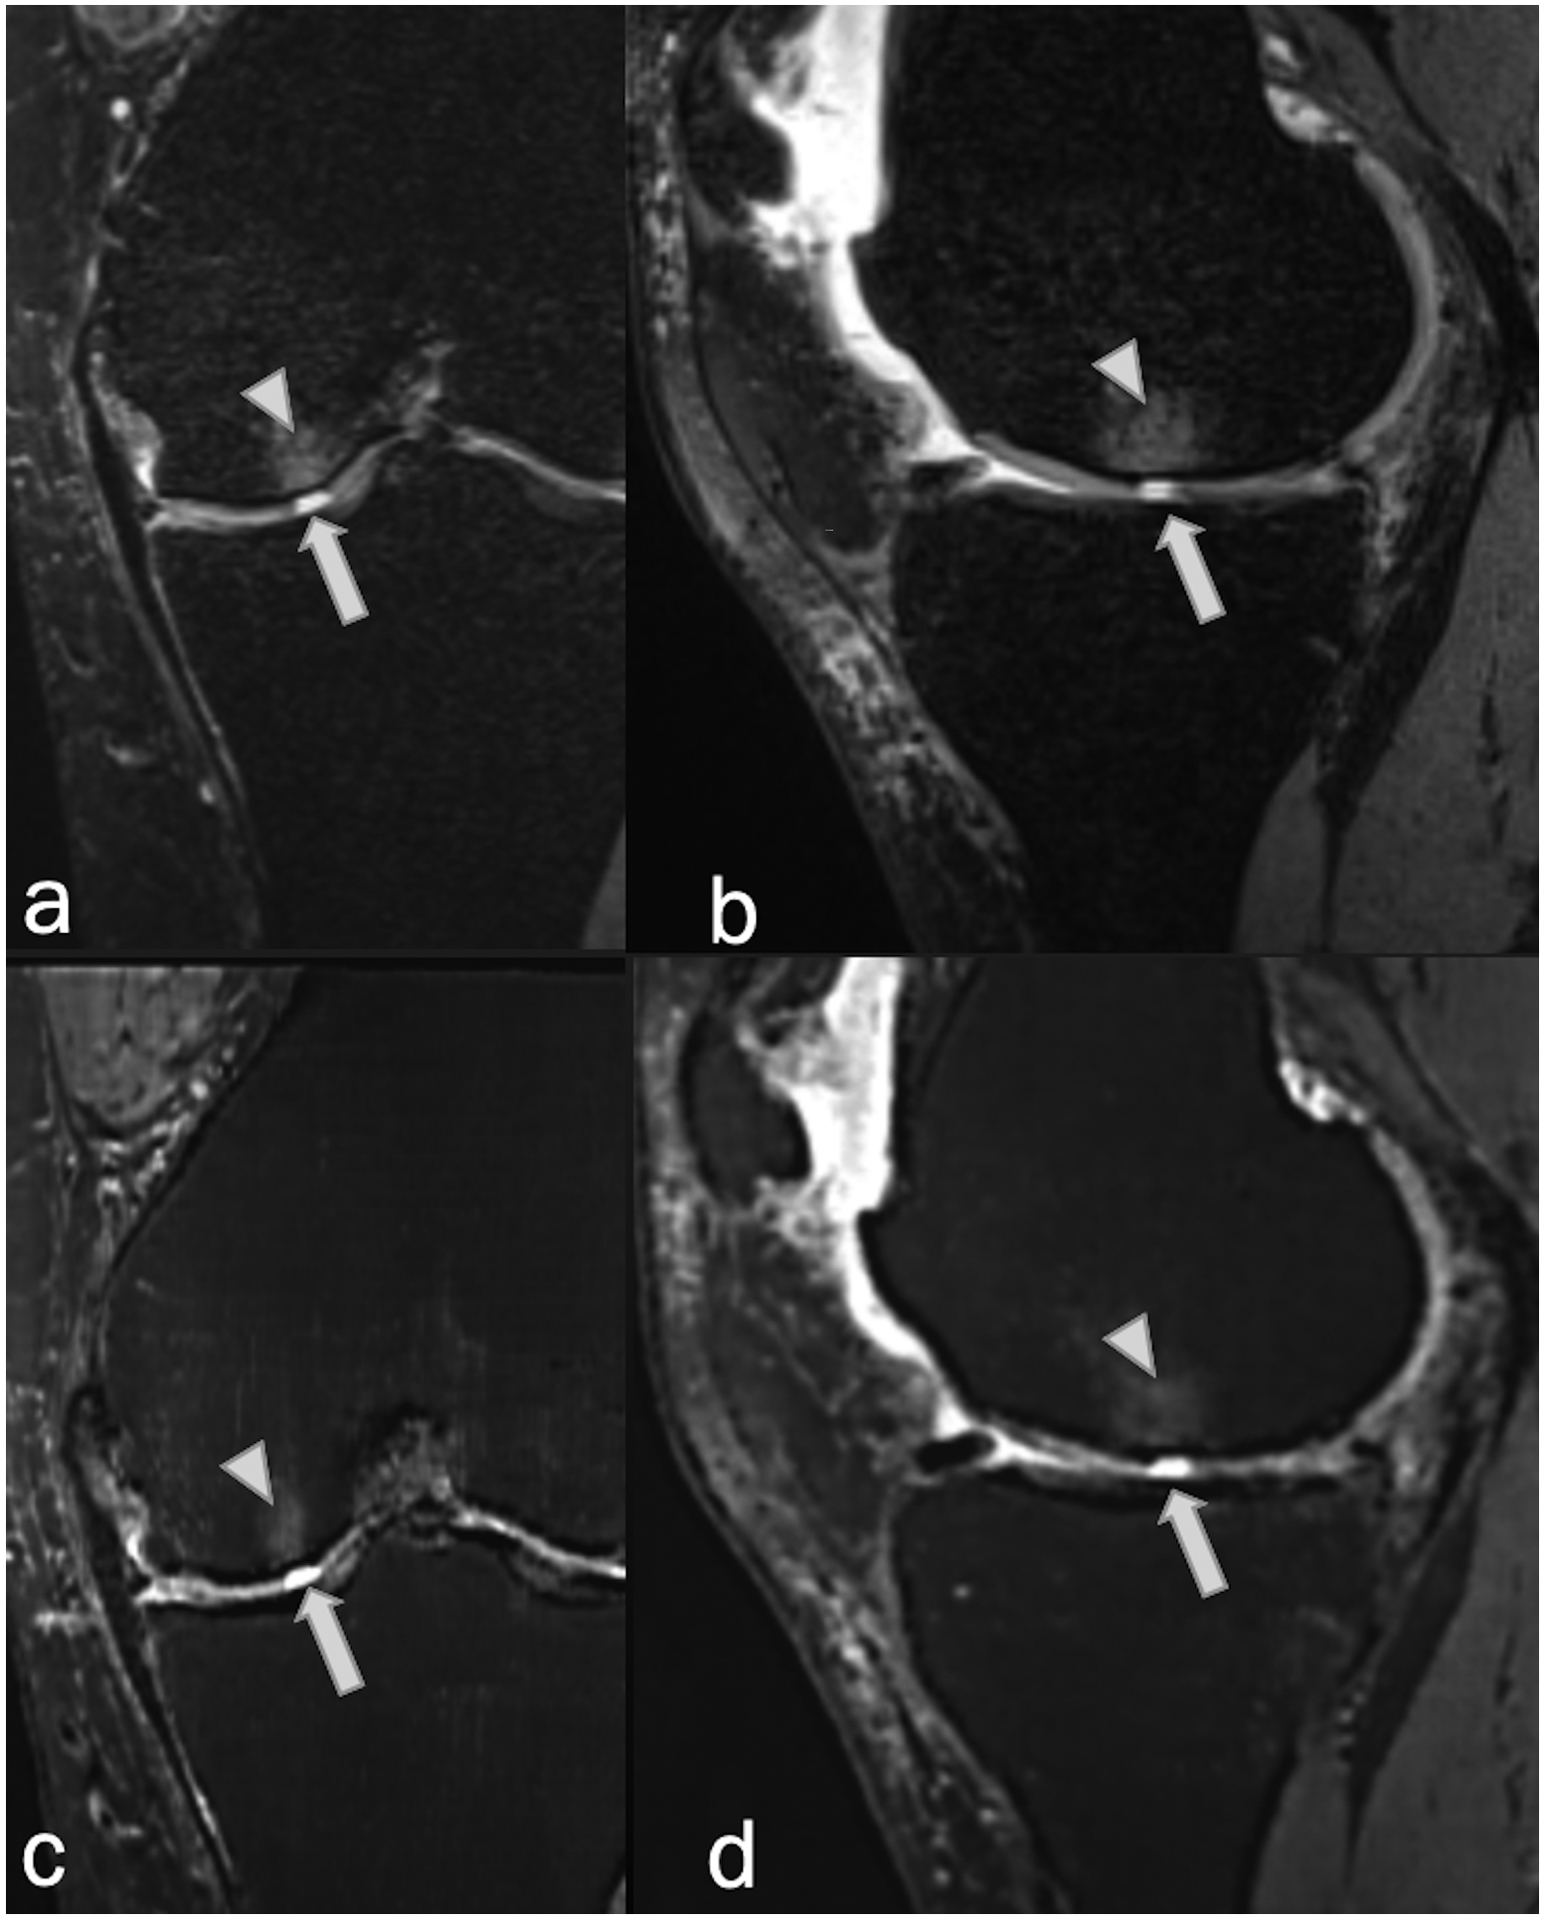
Coronal and sagittal (a,b) fat-suppressed PD-weighted, and (c,d) fat-suppressed synthetic MRI (AFSMRI) in a 52-year-woman reveal a focal, fluid signal-intensity abnormality extending through the articular cartilage (arrows) of the medial femoral condyle (full thickness cartilage defect), associated with subchondral bone marrow edema (arrowheads), detected by all readers with the Original and Synthetic protocols.
There was no significant difference in the detection of bone marrow abnormalities between the two methods (p>0.05), considering all bones together (femur, tibia, and patella) (Figures 11 and 12). Specifically, higher specificity (90%, 93%, and 91%) than sensitivity (76%, 66%, and 49%)) was observed.
Figure 11.
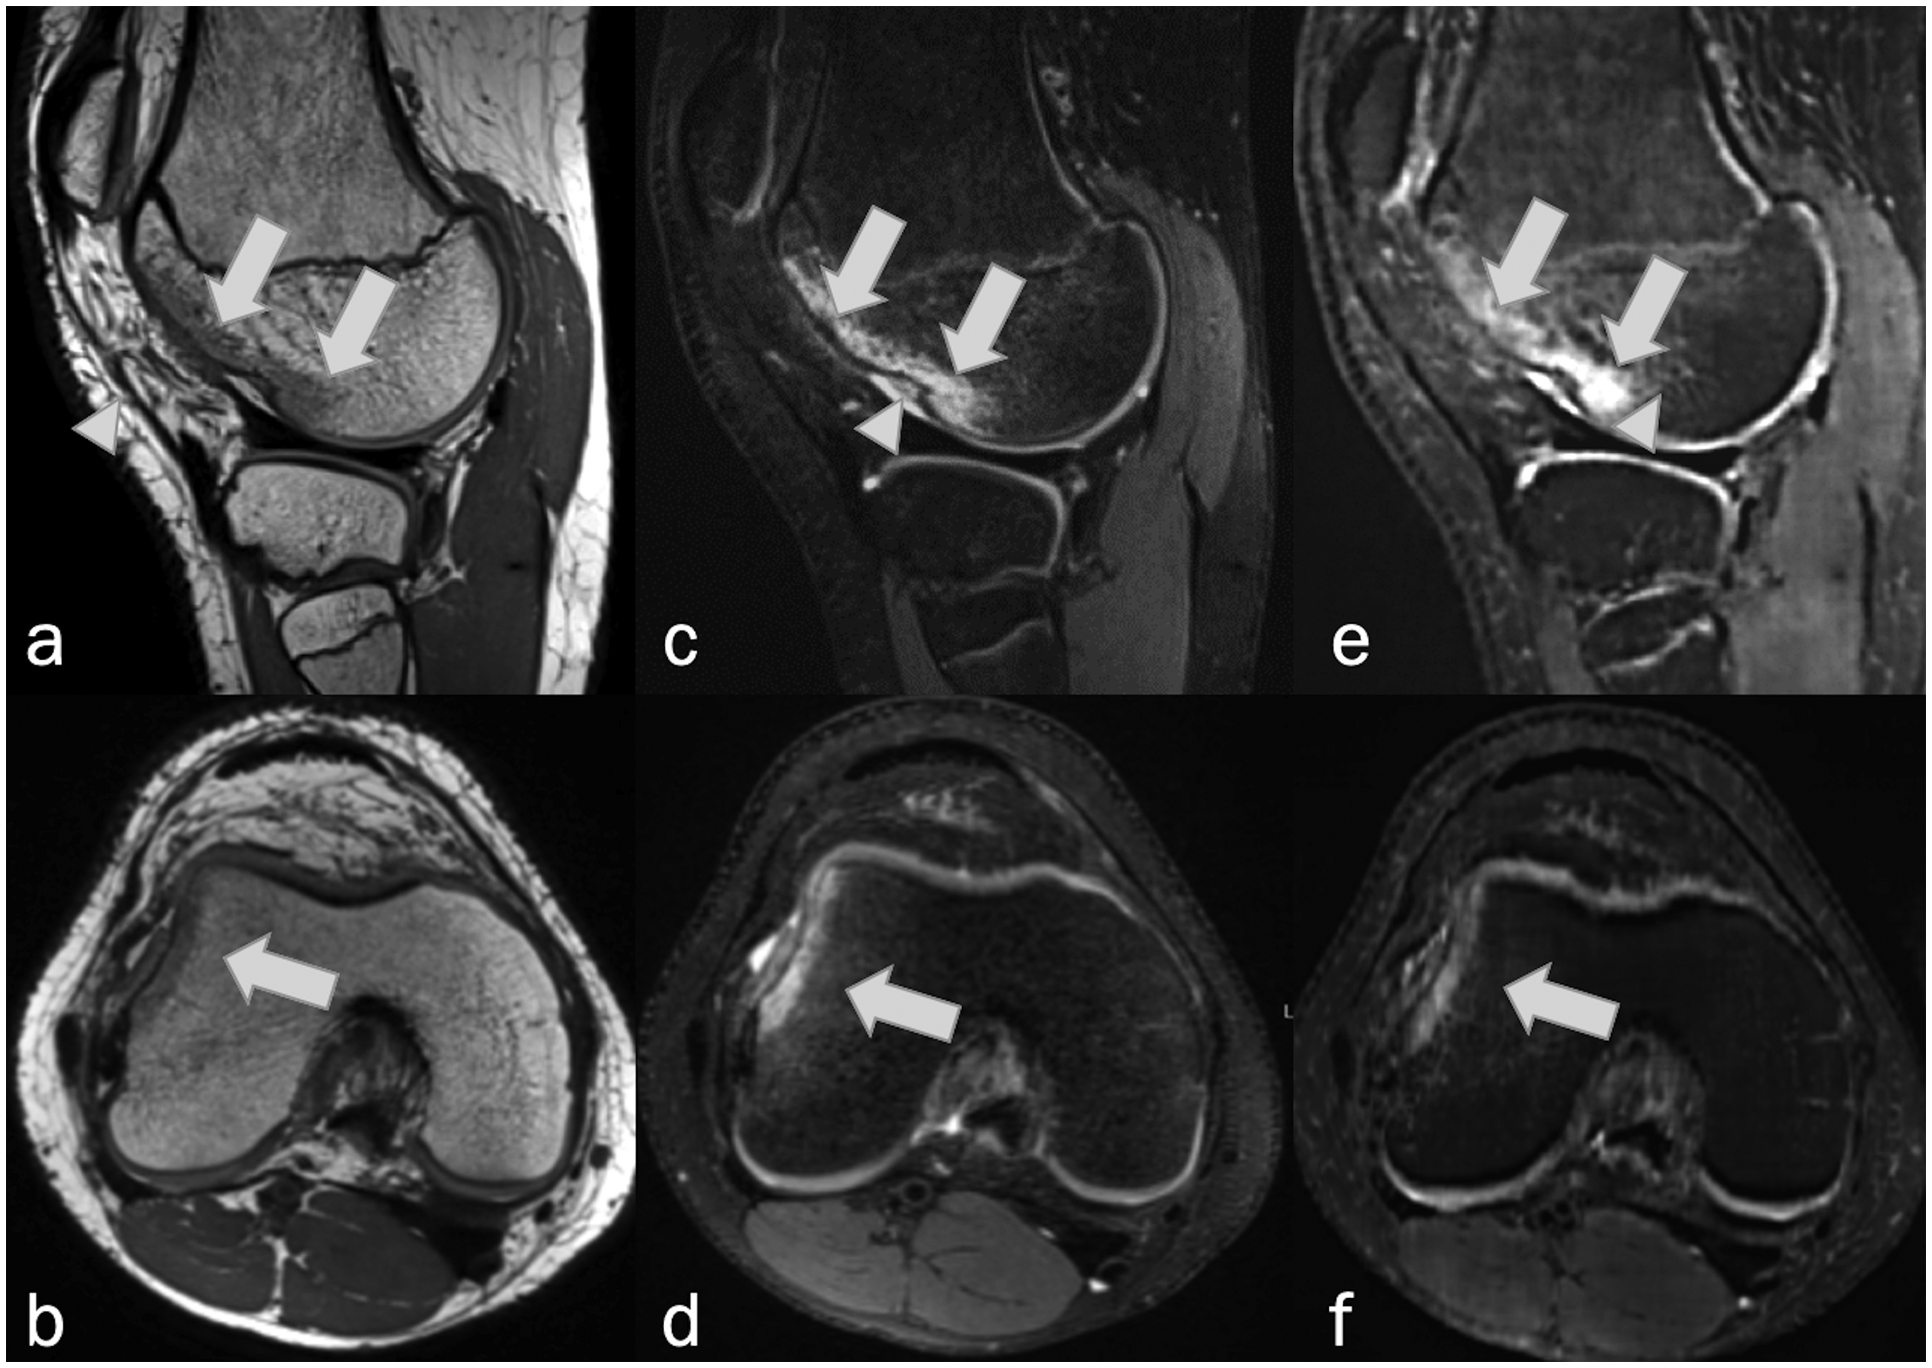
Sagittal and axial MRI, (a,b) non-fat-suppressed PD-weighted, (c,d) fat-suppressed PD-weighted, and (e,f) fat-suppressed synthetic MRI (AFSMRI) following transient lateral patellar dislocation in 16-year-old. Edema / bone bruise (arrows) and impaction fracture (arrowheads) on the lateral femoral condyle were detected by the three readers on the Original and Synthetic protocols.
Figure 12.

Sagittal MRI, (a) non-fat-suppressed PD-weighted, (b) fat-suppressed PD-weighted, and (c) fat-suppressed synthetic MRI (AFSMRI) in a 46-year-old man reveal a hypointense horizontal trabecular fracture (arrows) and adjacent hyperintense bone marrow edema (arrowheads) within the tibial medial plateau, consistent with insufficiency fracture.
The interreader reliability for the AFSMRI protocol ranged from moderate to substantial for determining the presence or absence of internal derangements involving the menisci, ligaments, cartilage, bone marrow edema and fractures (Fleiss’s kappa [95% confidence interval]: 0.69 [0.67–0.71], 0.67 [0.65–0.70], 0.55 [0.52–0.57], 0.49 [0.48–0.50], 0.45 [0.42–0.48], respectively). Table 3 shows the common exact match proportions for all readers reading images of the original and synthetic protocols in different combinations. Original and synthetic protocols were interchangeable for the diagnosis of all evaluated structures. There was no significant difference for the common exact match proportions for all combinations (p > 0.01).
TABLE 3.
Interchangeability Comparison
| Proportion of Exact Matches by Technique (Reader 1 / Reader 2 / Reader 3) | Menisci | Cruciate Ligaments | Collateral Ligaments | Tendons (quadriceps / patellar) | All Cartilage † | Bone marrow abnormalities (edema and fracture) |
|---|---|---|---|---|---|---|
| % AFSMRI / AFSMRI / AFSMRI | 77.3 | 90.3 | 81.3 | 90.3 | 68.8 | 77.4 |
| % AFSMRI / AFSMRI / Original | 70.5 | 86.4 | 76.7 | 86.9 | 62.9 | 74.2 |
| % AFSMRI / Original / Original | 69.3 | 87.5 | 80.1 | 89.2 | 68.4 | 77.1 |
| % Original / Original / Original | 71.0 | 89.2 | 79.0 | 89.8 | 68.6 | 82.1 |
| % Original / AFSMRI / AFSMRI | 72.7 | 89.8 | 80.7 | 89.8 | 67.4 | 76.1 |
| % Original / Original / AFSMRI | 68.2 | 89.8 | 81.8 | 89.8 | 71.2 | 78.1 |
| % Original / AFSMRI / Original | 69.9 | 86.9 | 75.6 | 86.9 | 63.4 | 76.5 |
| % AFSMRI / Original / AFSMRI | 70.5 | 89.2 | 82.4 | 89.8 | 72.9 | 76.6 |
AFSMRI: Synthetic protocol; Original: Original protocol
Data were dichotomized into defect (partial and full thickness) and no-defect (normal) groups.
There was a significant difference in SNRs of all evaluated structures between AFSMRI and original 3D FSPD images (p<0.05), being highest on synthetic images (SNRbone marrow: 32.1±11.9 versus 11.2±5.1, SNRmuscle: 106.1±37.9 versus 54.4±17.7, SNRcartilage: 197.6±77.2 versus 80.7±30.3, SNRfluid: 375.3±146.9 versus 142.7±49.5, respectively). Similarly, the conspicuity of all tissues assessed through CNR in the background of the fat pad (bone marrow, muscle, cartilage, and fluid), fluid (muscle and cartilage) or cartilage (bone marrow) was higher on AFSMRI than with original 3D FSPD images (p<0.05) (Table 4).
Table 4.
Signal-to-noise ratio (SNR) and Contrast-to-noise ratio (CNR)
| Parameters | AFSMRI | Conventional MRI | P value | |
|---|---|---|---|---|
| Signal-to-noise ratio | Bone marrow | 32.1±11.9(12.4–77.1) | 11.2±5.1(3.3–33.7) | P<0.05 |
| Muscle | 106.1±37.9(22.8–244.7) | 54.4±17.7(21.8–121.6) | ||
| Cartilage | 197.6±77.2(66.8–434.9) | 80.7±30.3(33.9–215.8) | ||
| Fluid | 375.3±146.9(98.9–752.9) | 142.7±49.5(12–266.1) | ||
| Contrast-to-noise ratio | Bone marrow to fat pad | −15.1±15.3(−62–33.5) | −6.8±7.7(−27–12) | P<0.05 |
| Muscle to fat pad | 58.7±28.8.3(−15.5–187.6) | 36.3±15.3(−1–90.4) | ||
| Cartilage to fat pad | 150.3±70.5(24.6–382.6) | 62.7±28.6(15.9–200.2) | ||
| Fluid to fat pad | 327.9±138.9(64.4–709.3) | 124.7±46.9(1.4–240.6) | ||
| Muscle to fluid | −269.1±129(−611.9–18.6) | −88.4±41(−185.9–35.8) | ||
| Cartilage to fluid | −177.6±124.8(−498.6–155.6) | −62±38.6(−140–52) | ||
| Bone marrow to cartilage | −165.6±71.9(−406.3–−26) | −69.5±29(−201.8–−26.3) | ||
Data presented as mean ± standard deviation (with range in parenthesis);
SNR was calculated as the mean signal intensity (SI) of regions of interest divided by the standard deviation SI of the background(air);
CNR was calculated by using the formula: CNR = SNR1 – SNR2.
DISCUSSION
While other methods of synthetic MRI have been described2, 13, 37, 38, to our knowledge, this is the first study to demonstrate the feasibility of creating synthetic fat-suppressed MR images from a non-fat-suppressed 3DPD acquisition using AI, to assess common knee abnormalities. Our data show that our proposed DLS achieved good diagnostic performance for detecting internal derangement of the knee, faster imaging, and higher contrast-to-noise ratios.
The development of AFSMRI could obviate the need for acquiring separate fat-suppressed fluid-sensitive sequences, thereby offering a novel technique for fast imaging of the knee, allowing a reduction of acquisition time of 54.5% (11min 20s to 5 min 15 s, original acquisition versus that with AFSMRI). Of note, the 54.5% reduction in acquisition time takes into account the original protocol used at our institution, which consists of two commercially available 3D volumetric pulse sequences of isotropic resolution (SPACE), a FS intermediate-weighted 3D sequence and non-FS 3D sequence, both with 1D GRAPPA, a protocol that is not necessarily used as a standard in other institutions. In this study, we chose to create AFSMRI from a 3D volumetric pulse sequence of isotropic resolution, acquired with a parallel imaging reconstruction technique, thus yielding very high signal and thin slice partitions39, 40, rather than creating AFSMRI from 2D sequences. In this way, we achieved a 5-minute high-resolution protocol, not obtainable by traditional 2D sequences, for the diagnosis of internal derangement of the knee.
Overall, the diagnostic performance of AFSMRI was comparable to that of the original images, with good diagnostic performance for the detection of meniscus and ligament tears, cartilage defects, bone marrow edema and fractures, with accuracies ranging between 87 and 100%, particularly considering the results of the most experienced reader. In addition, interobserver agreement generally ranged from moderate to substantial for almost all evaluated structural abnormalities.
The AI protocol offered a sensitivity and specificity of 91% and 86% for the detection of meniscus tears, with substantial agreement between readers, considering the original MR imaging sequences as the reference standard. These numbers are close to the reported pooled estimates of 89.9% sensitivity and 90.2% specificity on a recent systematic review and meta-analysis on diagnosis of all meniscal injuries using 3D MRI18, although a meta-analysis41 of 19 studies evaluating the performance of MRI against arthroscopy reported a sensitivity and specificity for meniscus tear detection of 89%/88% and 78%/95% for medial and lateral meniscus tears, respectively. Considering other uses of artificial intelligence for meniscus assessment, overall accuracies of 84–86% were observed for meniscus tear detection by a deep CNN42, and Bien et al.2, in their automated model of deep-learning-assisted MRI diagnosis of knee injuries, reported lower diagnostic performance for detecting meniscal tears compared with ligament tears (receiver operating characteristic curve [AUC] of 0.847 versus 0.937 respectively).
Compared with conventional images, our synthetic protocol showed high sensitivity, specificity, and accuracy (92%, 98%, 98%) for evaluating tears of the cruciate ligaments, with substantial concordance between readers, although tears of the ACL were more readily detected than the PCL (100% vs 80% sensitivity respectively). Our results are similar to that of a meta-analysis of 22 studies on the diagnostic performance of 3D MRI for detecting all cruciate ligament injuries of the knee, which reported pooled estimates of 91.4% and 96.1% of sensitivity and specificity, with lower sensitivities for PCL than ACL tears (pooled sensitivity of 82.4% × 91.2% and specificity of 97.8% × 95.2%, respectively)17.
Diagnostic performance was lower for the detection of tendon tears by the synthetic protocol than by the original images, and only slight inter-reader agreement was observed. We believe that the discrepancy between readers regarding tendon tear detection on synthetic images was due to the fact that the majority of the lesions were intrasubstance subtle partial tears, difficult to discriminate from tendinopathy, and that such disparity is probably without clinical significance. Accordingly, tendon tears were overall probably underestimated by the least experienced readers (R2 and R3).
The diagnostic performance of the synthetic protocol for the depiction of cartilage defects (sensitivity and specificity of 77% and 93%), is similar to that reported in a recent meta-analysis of 27 studies that included 3D MR imaging data, compared with arthroscopy or open surgery as the reference standard (74.8% and 93.3% respectively)16. Lower sensitivity for the detection of cartilage defects in the lateral compartment compared with medial and patellofemoral compartments (66% vs 75% vs 89%, respectively) was observed, although overall accuracy was not significantly different across compartments (89.4% vs 90% vs 86%). However, when evaluating the severity of cartilage defects (partial thickness vs full thickness defect), the data suggest that the synthetic images have suboptimal diagnostic performance for grading cartilage defects. Notwithstanding, MR imaging is effective in discriminating normal from abnormal articular cartilage, but is generally less sensitive for grading chondral lesions as shown in a meta-analysis of 8 studies43. When 3D sequences are used, a meta-analysis of 14 studies showed that the diagnostic performance of 3D MRI was greater for higher grades of cartilage defects than for partial thickness defects16.
Regarding bone marrow edema, the synthetic protocol showed diagnostic accuracies ranging between 82 and 86%, with lower sensitivity relative to the specificity measures (76% and 84% respectively). The same trend was observed by Kijowski et al.44 (for bone marrow edema in their evaluation of 3D FSE sequence), with lower sensitivity (85.3%) than specificity (95%).
This study has limitations. First, we compared synthetic MRI with the original MR imaging only, as we could not obtain arthroscopy simultaneously, which is considered the gold standard for ligamentous, meniscus and cartilage lesion evaluation. Nevertheless, we chose a study design that does not require a surgical standard of reference, which allowed us to comprise abnormalities that are not evaluated during surgery, such as bone marrow edema, collateral ligaments, and fractures without intra-articular extension. Likewise, assessing only surgically validated MR examinations would not have allowed us to include non-surgical patients, which accounts for most knee MRI examinations in the clinical routine. In addition, considering that the readers of our study were full-time, fellowship trained musculoskeletal radiologists and demonstrated overall moderate to substantial inter-reader agreement, and the large body of evidence of the high diagnostic accuracy of MR imaging in comparison with arthroscopy or open surgery41, 45, we believe that this fact may not have significantly affected the results. Second, while the readers were theoretically blinded to the synthetic and original sequences, the images themselves contained distinguishable intrinsic characteristics that could make each method identifiable to a trained radiologist. Also, evaluations were done in batches (all standard images reviewed, then AI images reviewed), which could be a source of bias. Third, the readers had different clinical experience (15, 6 and 1 year with MSK imaging) and different experiences with 3D imaging that may have accounted for some variability between the readers. Fourth, a relatively small number of pathologies of the lateral collateral ligament, PCL, and quadriceps and patellar tendons were included, which may limit the generalization of the results.
In conclusion, the creation of 3D AFSMRI is feasible, and offers a method for fast imaging, with similar detection rates for structural abnormalities of the knee, compared with original 3D MR sequences. Ongoing development of the AI methodology aims to improve the robustness of synthetic MRI for reducing reconstruction artifacts and improving the detection of articular cartilage and bone marrow abnormalities. Larger studies and correlation with arthroscopic surgery are needed to fully define diagnostic accuracies.
Acknowledgments
Jan Fritz: Institutional research support, Siemens AG Institutional research support, Johnson & Johnson Institutional research support, Zimmer Biomet Holdings, Inc Institutional research support, Microsoft Corporation Institutional research support, BTG International Ltd Scientific Advisor, Siemens AG Scientific Advisor, General Electric Company Scientific Advisor, BTG International Ltd Speaker, Siemens AG Patent agreement, Siemens AG
Shivani Ahlawat: Research Consultant, Pfizer Inc
Michael A. Jacobs: National Institutes of Health (NIH) grant numbers: 5P30CA006973 (Imaging Response Assessment Team-IRAT), U01CA140204, 1R01CA190299. The Tesla K40s used for this research was donated by the NVIDIA Corporation.
Abbreviations
- 3D
Three dimensional
- 2D
two dimensional
- ACL
Anterior cruciate ligament
- AFSMRI
Artificial intelligence-based MR images
- CNN
Convolutional Neural Networks
- CNR
Contrast-to-noise ratio
- DLS
Deep learning system
- FS
Fat-suppressed
- FSE
Fast spin echo
- GAN
Generative Adversarial Networks
- GRAPPA
Generalized Autocalibrating Partial Parallel Acquisition sampling pattern
- IW
Intermediate weighted
- LM
Lateral meniscus
- MM
Medial meniscus
- MSE
Mean Squared Error
- MRI
Magnetic resonance imaging
- PACS
Picture archiving and communication system
- PCL
Posterior cruciate ligament
- PD
Proton density
- ROI
Region of interest
- SD
Standard deviation
- SI
Signal intensity
- SNR
Signal-to-noise ratio
- SPACE
Sampling perfection with application-optimized contrasts using different flip angle evolution
- TE
Echo time
- TR
Repetition Time
- TSE
Turbo spin echo
- W
Weighted
Footnotes
Conflict of Interest:
Laura Fayad: GERRAF, Siemens Medical Systems prior to 2014
Vishwa S. Parekh: Nothing to disclose
Rodrigo de Castro Luna: Nothing to disclose
Charles C. Ko: Nothing to disclose
Dharmesh Tank: Nothing to disclose
References
- 1.Nacey NC, Geeslin MG, Miller GW, et al. Magnetic resonance imaging of the knee: An overview and update of conventional and state of the art imaging. J Magn Reson Imaging. 2017;45(5):1257–75. [DOI] [PubMed] [Google Scholar]
- 2.Bien N, Rajpurkar P, Ball RL, et al. Deep-learning-assisted diagnosis for knee magnetic resonance imaging: Development and retrospective validation of MRNet. PLoS Med. 2018;15(11):e1002699. [DOI] [PMC free article] [PubMed] [Google Scholar]
- 3.Zhou Z, Zhao G, Kijowski R, et al. Deep convolutional neural network for segmentation of knee joint anatomy. Magn Reson Med. 2018;80(6):2759–70. [DOI] [PMC free article] [PubMed] [Google Scholar]
- 4.Liu F, Guan B, Zhou Z, et al. Fully Automated Diagnosis of Anterior Cruciate Ligament Tears on Knee MR Images by Using Deep Learning. Radiol Artif Intell. 2019;1(3):180091. [DOI] [PMC free article] [PubMed] [Google Scholar]
- 5.Liu F, Zhou Z, Jang H, et al. Deep convolutional neural network and 3D deformable approach for tissue segmentation in musculoskeletal magnetic resonance imaging. Magn Reson Med. 2018;79(4):2379–91. [DOI] [PMC free article] [PubMed] [Google Scholar]
- 6.Liu F, Zhou Z, Samsonov A, et al. Deep Learning Approach for Evaluating Knee MR Images: Achieving High Diagnostic Performance for Cartilage Lesion Detection. Radiology. 2018;289(1):160–9. [DOI] [PMC free article] [PubMed] [Google Scholar]
- 7.Stajduhar I, Mamula M, Miletic D, et al. Semi-automated detection of anterior cruciate ligament injury from MRI. Comput Methods Programs Biomed. 2017;140:151–64. [DOI] [PubMed] [Google Scholar]
- 8.Roblot V, Giret Y, Bou Antoun M, et al. Artificial intelligence to diagnose meniscus tears on MRI. Diagn Interv Imaging. 2019;100(4):243–9. [DOI] [PubMed] [Google Scholar]
- 9.Germann C, Marbach G, Civardi F, et al. Deep Convolutional Neural Network-Based Diagnosis of Anterior Cruciate Ligament Tears: Performance Comparison of Homogenous Versus Heterogeneous Knee MRI Cohorts With Different Pulse Sequence Protocols and 1.5-T and 3-T Magnetic Field Strengths. Invest Radiol. 2020. [DOI] [PMC free article] [PubMed] [Google Scholar]
- 10.Ba MB, Breuer F, et al. Simultaneous Multislice (SMS) Imaging Techniques. Magnetic resonance in medicine. 2016;75(1). [DOI] [PMC free article] [PubMed] [Google Scholar]
- 11.Kijowski R, Blankenbaker DG, Munoz Del Rio A, et al. Evaluation of the articular cartilage of the knee joint: value of adding a T2 mapping sequence to a routine MR imaging protocol. Radiology. 2013;267(2):503–13. [DOI] [PubMed] [Google Scholar]
- 12.Warntjes JB, Dahlqvist O, Lundberg P. Novel method for rapid, simultaneous T1, T2*, and proton density quantification. Magn Reson Med. 2007;57(3):528–37. [DOI] [PubMed] [Google Scholar]
- 13.Yi J, Lee YH, Song HT, et al. Clinical Feasibility of Synthetic Magnetic Resonance Imaging in the Diagnosis of Internal Derangements of the Knee. Korean J Radiol. 2018;19(2):311–9. [DOI] [PMC free article] [PubMed] [Google Scholar]
- 14.Fritz J, Fritz B, Zhang J, et al. Simultaneous Multislice Accelerated Turbo Spin Echo Magnetic Resonance Imaging: Comparison and Combination With In-Plane Parallel Imaging Acceleration for High-Resolution Magnetic Resonance Imaging of the Knee. Invest Radiol. 2017;52(9):529–37. [DOI] [PubMed] [Google Scholar]
- 15.Fritz J, Fritz B, Thawait GG, et al. Three-Dimensional CAIPIRINHA SPACE TSE for 5-Minute High-Resolution MRI of the Knee. Invest Radiol. 2016;51(10):609–17. [DOI] [PubMed] [Google Scholar]
- 16.Shakoor D, Guermazi A, Kijowski R, et al. Diagnostic Performance of Three-dimensional MRI for Depicting Cartilage Defects in the Knee: A Meta-Analysis. Radiology. 2018;289(1):71–82. [DOI] [PubMed] [Google Scholar]
- 17.Shakoor D, Guermazi A, Kijowski R, et al. Cruciate ligament injuries of the knee: A meta-analysis of the diagnostic performance of 3D MRI. J Magn Reson Imaging. 2019;50(5):1545–60. [DOI] [PubMed] [Google Scholar]
- 18.Shakoor D, Kijowski R, Guermazi A, et al. Diagnosis of Knee Meniscal Injuries by Using Three-dimensional MRI: A Systematic Review and Meta-Analysis of Diagnostic Performance. Radiology. 2019;290(2):435–45. [DOI] [PubMed] [Google Scholar]
- 19.Del Grande F, Delcogliano M, Guglielmi R, et al. Fully Automated 10-Minute 3D CAIPIRINHA SPACE TSE MRI of the Knee in Adults: A Multicenter, Multireader, Multifield-Strength Validation Study. Invest Radiol. 2018;53(11):689–97. [DOI] [PubMed] [Google Scholar]
- 20.Kijowski R, Rosas H, Samsonov A, et al. Knee imaging: Rapid three-dimensional fast spin-echo using compressed sensing. J Magn Reson Imaging. 2017;45(6):1712–22. [DOI] [PMC free article] [PubMed] [Google Scholar]
- 21.Yi X, Walia E, Babyn P. Generative adversarial network in medical imaging: A review. Medical Image Analysis. 2019;58:101552. [DOI] [PubMed] [Google Scholar]
- 22.Zhu J, Park T, Isola P, et al. Unpaired Image-to-Image Translation Using Cycle-Consistent Adversarial Networks. 2017 IEEE International Conference on Computer Vision (ICCV), 22–29 Oct. 2017 2017. 2242–51. [Google Scholar]
- 23.Isola P, Zhu J-Y, Zhou T, et al. Image-to-Image Translation with Conditional Adversarial Networks. The IEEE Conference on Computer Vision and Pattern Recognition (CVPR). 2017:1125–34. [Google Scholar]
- 24.Ronneberger O, Fischer P, Brox T. U-Net: Convolutional Networks for Biomedical Image Segmentation. International Conference on Medical image computing and computer-assisted intervention. 2015;9351:234–41. [Google Scholar]
- 25.Dong C, Loy C, He K, et al. Learning a Deep Convolutional Network for Image Super-Resolution. Computer Vision – ECCV. 2014:184–99. [Google Scholar]
- 26.Robertson PL, Schweitzer ME, Bartolozzi AR, et al. Anterior cruciate ligament tears: evaluation of multiple signs with MR imaging. Radiology. 1994;193(3):829–34. [DOI] [PubMed] [Google Scholar]
- 27.Mink JH, Levy T, Crues JV 3rd. Tears of the anterior cruciate ligament and menisci of the knee: MR imaging evaluation. Radiology. 1988;167(3):769–74. [DOI] [PubMed] [Google Scholar]
- 28.Barnett MJ. MR diagnosis of internal derangements of the knee: effect of field strength on efficacy. AJR Am J Roentgenol. 1993;161(1):115–8. [DOI] [PubMed] [Google Scholar]
- 29.De Smet AA, Norris MA, Yandow DR, et al. MR diagnosis of meniscal tears of the knee: importance of high signal in the meniscus that extends to the surface. AJR Am J Roentgenol. 1993;161(1):101–7. [DOI] [PubMed] [Google Scholar]
- 30.Crues JV 3rd, Mink J, Levy TL, et al. Meniscal tears of the knee: accuracy of MR imaging. Radiology. 1987;164(2):445–8. [DOI] [PubMed] [Google Scholar]
- 31.Noyes FR, Stabler CL. A system for grading articular cartilage lesions at arthroscopy. Am J Sports Med. 1989;17(4):505–13. [DOI] [PubMed] [Google Scholar]
- 32.Wolff SD, Balaban RS. Assessing contrast on MR images. Radiology. 1997;202(1):25–9. [DOI] [PubMed] [Google Scholar]
- 33.Bland JM, Altman DG. Measuring agreement in method comparison studies. Stat Methods Med Res. 1999;8(2):135–60. [DOI] [PubMed] [Google Scholar]
- 34.Giavarina D Understanding Bland Altman analysis. Biochem Med (Zagreb). 2015;25(2):141–51. [DOI] [PMC free article] [PubMed] [Google Scholar]
- 35.Landis JR, Koch GG. The measurement of observer agreement for categorical data. Biometrics. 1977;33(1):159–74. [PubMed] [Google Scholar]
- 36.Obuchowski NA, Subhas N, Schoenhagen P. Testing for interchangeability of imaging tests. Acad Radiol. 2014;21(11):1483–9. [DOI] [PubMed] [Google Scholar]
- 37.Boudabbous S, Neroladaki A, Bagetakos I, et al. Feasibility of synthetic MRI in knee imaging in routine practice. Acta Radiol Open. 2018;7(5):2058460118769686. [DOI] [PMC free article] [PubMed] [Google Scholar]
- 38.Kumar NM, Fritz B, Stern SE, et al. Synthetic MRI of the Knee: Phantom Validation and Comparison with Conventional MRI. Radiology. 2018;289(2):465–77. [DOI] [PubMed] [Google Scholar]
- 39.Notohamiprodjo M, Kuschel B, Horng A, et al. 3D-MRI of the ankle with optimized 3D-SPACE. Invest Radiol. 2012;47(4):231–9. [DOI] [PubMed] [Google Scholar]
- 40.Fritz J, Raithel E, Thawait GK, et al. Six-Fold Acceleration of High-Spatial Resolution 3D SPACE MRI of the Knee Through Incoherent k-Space Undersampling and Iterative Reconstruction-First Experience. Invest Radiol. 2016;51(6):400–9. [DOI] [PubMed] [Google Scholar]
- 41.Phelan N, Rowland P, Galvin R, et al. A systematic review and meta-analysis of the diagnostic accuracy of MRI for suspected ACL and meniscal tears of the knee. Knee Surg Sports Traumatol Arthrosc. 2016;24(5):1525–39. [DOI] [PubMed] [Google Scholar]
- 42.Fritz B, Marbach G, Civardi F, et al. Deep convolutional neural network-based detection of meniscus tears: comparison with radiologists and surgery as standard of reference. Skeletal Radiol. 2020. [DOI] [PMC free article] [PubMed] [Google Scholar]
- 43.Zhang M, Min Z, Rana N, et al. Accuracy of magnetic resonance imaging in grading knee chondral defects. Arthroscopy. 2013;29(2):349–56. [DOI] [PubMed] [Google Scholar]
- 44.Kijowski R, Davis KW, Woods MA, et al. Knee joint: comprehensive assessment with 3D isotropic resolution fast spin-echo MR imaging--diagnostic performance compared with that of conventional MR imaging at 3.0 T. Radiology. 2009;252(2):486–95. [DOI] [PMC free article] [PubMed] [Google Scholar]
- 45.Li K, Du J, Huang LX, et al. The diagnostic accuracy of magnetic resonance imaging for anterior cruciate ligament injury in comparison to arthroscopy: a meta-analysis. Sci Rep; 2017. [DOI] [PMC free article] [PubMed] [Google Scholar]


