

Abstract
A common condition in preterm infants (<37 week gestational age) is apnea resulting from immaturity and instability of the respiratory system. As apneas are implicated in several acute and long-term complications, prediction of apneas may preempt their onset and subsequent complications. This study tests the hypothesis that infant movements are a predictive marker for apneic episodes and examines the relation between movement and respiration. Movement was detected using a wavelet algorithm applied to the photoplethysmographic signal. Respiratory activity was measured in 9 infants using respiratory inductance plethysmography; in an additional 8 infants, respiration and partial pressure of airway carbon dioxide (PCO2) were measured by a nasal cannula with side-stream capnometry. In the first cohort, the distribution of movements before and after the onset of 370 apneic events was compared. Results showed that apneic events were associated with longer movement duration occurring before apnea onsets compared to after. In the second cohort, respiration was analyzed in relation to movement, comparing standard deviation of inter-breath intervals before and after apneas. Poincaré maps of the respiratory activity quantified variability of airway PCO2 in phase space. Movement significantly increased the variability of inter-breath intervals and PCO2. Moreover, destabilization of respiration was dependent on the duration of movement. These findings support that bodily movements of the infants precede respiratory instability. Further research is warranted to explore the predictive value of movement for life-threatening events, useful for clinical management and risk stratification.
Keywords: Preterm infants, respiration, breathing, apnea, movement, respiratory stability, Poincaré map
1. Introduction
About 10% of infants are born preterm (< 37 weeks gestational age) and may face a number of complications including sepsis, intraventricular hemorrhage and respiratory problems, such as bronchopulmonary dysplasia. Immature respiratory control can lead to apneas of prematurity that then further cause intermittent hypoxia and bradycardia (Poets et al., 1993; Schindler et al., 2017). Severe apneic and intermittent hypoxic events have been associated with multiple morbidities (Di Fiore et al., 2019; Poets, 2020) such as retinopathy of prematurity (Di Fiore et al., 2010; Di Fiore et al., 2012), neurodevelopmental impairment (Janvier et al., 2004) and death (Poets et al., 2015).
Respiration is functionally linked to motor activity by both central and peripheral mechanisms; for review see (Shevtsova et al., 2019). Central mechanisms of interaction include direct signals between pontomedullary respiratory circuits and the locomotor regions in the mesencephalic areas and the spinal cord. Peripheral mechanisms of interaction include entrainment of respiratory rhythm to movement generated by afferent inputs. An important example of the vital linkage between movement and ventilation is exercise hyperpnea characterized by an increased frequency of breathing and tidal volume. Body movements stimulate these proprioceptors sending an excitatory neural signal to the respiratory center fine-tuning its activation (Amann et al., 2010). This increases the ventilation rate which aids in expelling CO2 produced during the increased metabolism thus maintaining relatively constant levels of arterial partial pressure of CO2 (PaCO2). In neonates, the eupneic PaCO2 threshold, ensuring normal breathing, is very close to the apneic PaCO2, likely leading to both periodic breathing and apneas (Khan et al., 2005). While these interactions are established, it is unclear which of these mechanisms dominate during spontaneous movements in preterm infants and, more importantly, how movement is related to respiratory instability and apnea.
Many studies on preterm infants have identified a link between apnea and the immaturity of chemoreceptors (Di Fiore et al., 2013; Gauda et al., 2013). However, bodily movements may also affect respiration through the activation of peripheral proprioceptors or through other coupling mechanisms. These connections have found relatively little attention to date and only few studies have quantified the incidences of movement in connection with an apnea. For example, (Curzi-Dascalova & Christova-Guéorguiéva, 1983) showed that 17% of respiratory pauses were preceded by gross body movements. Respiration during squirming movements showed a variable and slow respiratory rate leading to cessation of breathing and a decrease in minute volume (Abu-Osba et al., 1982). Mathew and colleagues found that motor activity preceded apneic episodes in 202 of recorded 352 events and movements tended to continue during these events (Mathew et al., 1991). Similar results were found by (Weintraub et al., 1994) where the number of occurrences of respiratory pauses (3–10s long) per hour was correlated with the number of body movements. Although these studies have examined the relative number of movements associated with apneas, they have not quantified the influence of movements around apneas, nor have they quantified the changes in respiration following the movements.
The stability of the preterm respiratory system has been categorized into at least four states ranging from very stable, with an average lifetime of 12 hours, to very unstable with an average lifetime of 10 s (Clark et al., 2016). From the perspective of nonlinear dynamics, the most stable rhythmic state could be considered a limit-cycle attractor with a characteristic frequency regulated by the central respiratory oscillator (Paydarfar & Buerkel, 1995; Paydarfar & Eldridge, 1987). However, the system is continuously perturbed off this attractor by intrinsic fluctuations in central neural excitation, spontaneous physiological events such as muscle twitches, and extrinsic events such as ambient sounds or postural adjustments by caregivers. Preterm newborns appear to be more vulnerable to these perturbations and may easily transition to less stable states. Such unstable states may include or cause apneic episodes. A movement can be considered as a disturbance to the respiratory control system and therefore its response could provide information about the stability of the respiratory system.
The hypothesis of this study is that respiratory stability and apneic events in preterm infants are associated with movement events. More specifically, we hypothesize that movements can reduce the stability of their breathing pattern. To test this hypothesis, the duration of movements was examined with reference to the onset of apneas in 9 infants. The results provided evidence of the association between the two. In a second cohort of 8 preterm infants, the stability of respiration was examined by quantifying the variability of inter-breath intervals and Poincaré maps obtained from the continuous respiratory signal. Both measures of variability increased following movement onset. Moreover, the degree of respiratory destabilization was dependent on the duration of movement. These findings provide new information on how movement and respiration are coupled in preterm infants.
2. Methods
2.1. Ethical approval
The study protocol was approved by the Institutional Review Board of the University of Massachusetts Medical School (approval number 13413) in conformity with the Declaration of Helsinki, except for registration in a database. The attending physician identified eligible infants and written informed consent was obtained from the infant’s mother or legal guardian.
2.2. Subjects
The prospective study was performed at the Neonatal Intensive Care Unit (NICU) at the University of Massachusetts Memorial Healthcare. Data were collected from a total of 17 preterm infants, separated into two cohorts. Cohort 1 comprised 9 infants (3 females and 6 males; 30 ± 1.9 weeks gestational age; 30.9 ± 1.5 weeks postmenstrual age), Cohort 2 comprised 8 infants (3 females and 5 males; 30.5 ± 2 weeks gestational age; 31.9 ± 1.8 weeks postmenstrual age). While the infants in Cohort 1 were recorded for longer durations, for the infants in Cohort 2 additional respiratory measurements was available via side-stream capnography. Infants were excluded if they had intraventricular hemorrhage higher than grade 2, hydrocephalus, a congenital anomaly that complicated the infant’s cardio-pulmonary status, or any pulmonary disease that required the infants to receive supplemental oxygen, CPAP therapy or mechanical ventilatory support during the study. All infants were spontaneously breathing room air. Table 1 lists subject characteristics and the duration of obtained measurements per infant.
Table 1:
Infant demographics and recording times
| Subject ID | GA (wks) | PMA (wks) | Birth Weight (g) | Study Weight (g) | Gender | Study duration (hrs) | Analyzable duration (hrs) |
|---|---|---|---|---|---|---|---|
| 1 | 27.29 | 29.43 | 1045 | 1220 | M | 45.62 | 39.60 |
| 2 | 30.57 | 30.71 | 1785 | 1755 | M | 43.84 | 36.38 |
| 3 | 30.14 | 30.71 | 1710 | 1710 | M | 43.71 | 37.86 |
| 4 | 29.43 | 30.14 | 925 | 843 | F | 46.78 | 41.03 |
| 5 | 31.29 | 32.29 | 1868 | 1674 | M | 49.75 | 36.91 |
| 6 | 28.86 | 30.14 | 1115 | 1140 | F | 48.61 | 39.91 |
| 7 | 28.57 | 30.14 | 1050 | 1110 | M | 20.34 | 17.29 |
| 8 | 30.29 | 30.57 | 1225 | 1230 | F | 70.32 | 53.43 |
| 9 | 33.86 | 34.29 | 1860 | 1900 | M | 47.27 | 36.74 |
| 10 | 29.71 | 33.29 | 1150 | 1680 | F | 7.24 | 4.69 |
| 11 | 32.86 | 33.57 | 1570 | 1442 | F | 3.37 | 1.64 |
| 12 | 29.29 | 30.29 | 1190 | 1040 | F | 6.58 | 5.01 |
| 13 | 27.71 | 28.86 | 1105 | 1030 | M | 7.11 | 5.73 |
| 14 | 32.57 | 33.43 | 2295 | 2009 | M | 7.41 | 6.18 |
| 15 | 32.14 | 33.29 | 1330 | 1350 | M | 5.97 | 4.98 |
| 16 | 31.14 | 32.00 | 1565 | 1377 | M | 6.81 | 4.70 |
| 17 | 28.43 | 30.43 | 1378 | 1360 | M | 3.71 | 3.32 |
GA. gestational age; PMA, postmenstrual age
2.3. Data acquisition
All infants were studied in their NICU incubator that provided a thermoregulated environment. A bedside monitor (IntelliVue MP70, Philips Medical Systems, Andover, MA) displayed electrocardiogram (ECG) and photoplethysmography (PPG) signals, blood oxygen saturation (SpO2%), heart rate (HR) and respiration rate. Breathing activity (pneumogram) was recorded using respiratory inductance plethysmography (Somnostar PT, Viasys Healthcare, Yorbalinda, CA) sensing movement of the upper abdomen. Inter-breath intervals (IBIs) were extracted from the pneumogram using automated peak-detection software (LabChart 7, ADI Instruments, Colorado Springs, CO). A pulse-oximeter probe attached to the infant’s hand or foot captured the PPG and the SpO2 signal. The PPG signal was used to estimate bodily movements based on the disruptions that the signal experienced during movements (Zuzarte et al., 2019). A wavelet-based algorithm developed previously identified the onset and offset of these disruptions, i.e., artifactual events in the PPG signal, that are distinct from the pulsatile signal related to perfusion. These events afforded the calculation of the durations that movement was present in a binary ‘on-off’ fashion. Data from all periods of feeding (bottle and gavage) and nursing assessments were excluded from analysis. Periods during kangaroo care when the infant was taken out of the incubator were also excluded until the baby was placed back in the incubator and settled down. Due to the long data acquisition duration, infant position was not controlled. Each nurse repositioned the infants between prone and supine following the routine care procedures.
Data were recorded using the Vuelogger™ Patient Monitoring System (Wyss Institute, Boston, MA), which retrieved physiological information from the bedside monitor and time-synced them with the pneumogram. The signals were sampled at the following rates: ECG: 500 Hz, pneumogram: 200 Hz, PPG: 125 Hz, movement duration: 25 Hz. The data were streamed to the Vuelogger’s hard disk at the bedside and then exported for analysis.
In addition to these data, infants in Cohort 2 wore nasal cannulas that measured respiratory activity with side-stream capnometry, which facilitated continuous measurement of partial pressure of carbon dioxide (PCO2) (M2741A, Philips Medical Systems, Andover, MA). As these measurements eliminated mechanical artifacts generated by movement and provided a more reliable continuous signal, it afforded to study the effects of movement on the stability of respiration.
2.4. Movement with respect to onset of apneas
The first cohort (infants #1–9) was studied to explore the movements and their durations before and after the onset of apneas. In accordance with clinical practice, apneas were defined as: 1) a cessation of breathing longer than 10 s, if accompanied by bradycardia (HR<100bpm) and oxygen desaturation (SpO2<88%), 2) a cessation of breathing longer than 20 s, regardless of bradycardia or desaturation, or 3) co-occurrence of a bradycardia and oxygen desaturation, independent from a cessation of breathing (Darnall et al., 1997; Delivoria-Papadopoulos & McGowan, 1998; Deulofeut et al., 2006). For apneas that were clustered in time, only the first apnea in the cluster was included in the analysis; apneas occurring within 60 s from the offset of its preceding apnea were excluded to avoid the immediate effects of any apnea on subsequent apneas.
Mean recording time for the infants in Cohort 1 was 46.2 ± 12.7 hours resulting in a total of 370 apneic events following the above criteria. Subjects from Cohort 2 were not included in this analysis since the mean recording duration was much shorter (6 ± 1.6 hours) and contained only relatively few apneic events. For each subject, the mean and standard deviation of the inter-breath intervals (IBI) in the 40s PRE-APNEA-ONSET and 40s POST-APNEA-ONSET segments were computed (Comparison 1). The movement durations in these paired segments were also compared. Furthermore, this comparison of movement duration was also applied to a subset of apneic events, defined as pathological apneic pauses that had either bradycardia or oxygen desaturation associated with it. Figure 1 shows a representative segment of the respiratory activity and heart rate together with the binary movement signal with reference to an apneic onset.
Figure 1:

Time series of respiratory activity (from pneumogram), heart rate, SpO2 and movement, before (PRE-APNEA-ONSET) and after (POST-APNEA-ONSET) the onset of apnea, defined as time=0 (Comparison 1). Bradycardia threshold is indicated by the green dashed line. Movement was estimated using a wavelet-based algorithm on the photoplethysmogram. Total movement durations in the PRE-APNEA-ONSET and POST-APNEA-ONSET conditions were computed from the binary movement time series.
Apneic events that generated an alarm on the bedside monitors alerted NICU nurses to manually stimulate and in some cases reposition the infant to terminate the apnea. Therefore, the segments following APNEA-OFFSET were not analyzed, since it was difficult to distinguish between spontaneous or nurse-induced movements.
2.5. Respiratory activity following movement onset and offset
While examining the occurrence of movement before and after an apnea documents their association, it does not allow conclusions about any causal effect of movement on respiratory activity. Therefore, in the second cohort of infants a more reliable signal of continuous respiratory activity was collected to study the effect of movement on respiration more directly. The PCO2 signal served as a continuous measurement of respiratory activity with its peak defining the end-tidal PCO2 (PetCO2). PetCO2 served as a non-invasive surrogate for the arterial partial pressure of CO2 (PaCO2) that can otherwise only be obtained invasively by sampling arterial blood gas. PCO2 was sampled through a nasal cannula that limited any direct mechanical transfer from movement to respiration (Iwasaki et al., 1989). Cohort 1 could not be considered for this analysis since their respiratory activity was recorded only with respiratory inductance plethysmography that is affected by a variety of non-respiratory movements through direct mechanical coupling. To evaluate the effect of movement on the stability of respiration, measures were obtained from the continuous respiratory time series at three different instances and compared. A schematic representation of three different comparisons is illustrated in Figure 2.
Comparison 2: Respiratory activity 40 s pre and 40 s post the onset of movements. For each subject, multiple paired segments of respiratory data were compared: PRE-MOVEMENT-ONSET vs. POST-MOVEMENT-ONSET. To avoid confounding, the 40-second-long segment before the onset had to be free of other movements to minimize after-effects of a previous movement activity on the analyzed segment.
Comparison 3: To focus on the effects after the offset of movement, respiratory activity from paired segments 40 s before movement offset (PRE-MOVEMENT-OFFSET) and 40 s after movement offset (POST-MOVEMENT-OFFSET) were selected. Only those paired segments that had no movement for at least 40 s after the offset of movement were included.
Comparison 4: A smaller subset of data from Cohort 2 was used to compare paired respiratory segments before and after movement bursts. The data selected before movement onset (PRE-MOVEMENT-ONSET) and after movement offset (POST-MOVEMENT-OFFSET) were 40 s long without any movement activity. The interval of the movement (DURING-MOVEMENT) typically comprised several movement bursts of varying duration that were at least 40 s long, but no longer than 180 s. This ensured that comparisons between PRE-MOVEMENT-ONSET and POST-MOVEMENT-OFFSET were temporally neither too close nor too far from each other. Paired segments were compared using the following dependent measures.
Figure 2:

Schematic representation of all segments compared
2.5.1. Variability of inter-breath intervals
For each infant, the inter-breath intervals (IBIs) were determined from the peaks of the PCO2 using an automated peak-detection algorithm (LabChart 7, ADI Instruments, Colorado Springs, CO). Mean and standard deviation of IBIs were used as a measure of respiratory stability in each of the 40 s segments.
2.5.2. Respiratory variability from Poincaré maps
Respiratory stability was also analyzed in phase space. Even though the phase space of the respiratory attractor is likely to be high-dimensional, its stability can be examined in a lower-dimensional projection. To this end, the experimentally measured time-series of PCO2 were mapped into a two-dimensional phase-space spanned by the measured PCO2 and its first time derivative dPCO2, obtained by numerical differentiation. Since differentiation is a high-pass operation that amplifies any high frequency components and noise in the signal, the derivative was subsequently low-pass filtered using a 4th-order zero-lag Butterworth filter. Figure 3A shows the PRE- and POST-MOVEMENT-ONSET segments (Comparison 2) of the estimated movement signal and the PCO2 signal and its time derivative dPCO2.
Figure 3:

A. Time series of movement, respiratory activity (PCO2) and its first derivative (dPCO2), from Comparison 2: before (PRE-MOVEMENT-ONSET: left) and after (POST-MOVEMENT-ONSET) the onset of movement. B. Phase portrait of the same time series of PCO2 with a Poincaré section in the expiratory phase (green line). Markers ‘o’ and ‘x’ represent the two points used to define the Poincaré section. The red points indicate the intersections of the trajectories with the Poincaré section. These locations are projected onto the time series in panel A (red points). C. Zoomed versions of the orbits in the rectangles in panel B. For this subject (#14), the reference point (p*) on the Poincaré section is denoted by the black point. The distance of each intersection pn from the reference point p* are denoted by dn.
The phase portraits obtained from these time series are shown in Figure 3B. The upper branch of the phase portrait denotes expiration and the lower branch denotes inspiration as the trajectory traverses in clockwise direction.
Poincaré sections from these two-dimensional phase portraits were obtained to assess changes in respiratory stability. A Poincaré section is a (n-1)-dimensional surface that is transverse to the flow of a n-dimensional dynamic system (Rasband, 2015; Strogatz, 2018). The Poincaré section and the topology of the Poincaré map have been previously used to quantify the stability of physiological data, such as cardiac signals (Glass & Mackey, 1988; Honerkamp, 1983), respiratory signals (Del Negro et al., 2002) and also rhythmic human movements (Dingwell & Kang, 2007; Hurmuzlu et al., 1994; Zhang & Sternad, 2019). Figure 3B illustrates the Poincaré section as a green line passing through the origin of the phase space during the expiration phase. The origin of the Poincaré section was determined for each subject separately as the mean of PCO2 and dPCO2 from the entire recording. The second point defining the section was selected as the 97.5th percentile of the distributions of the respiratory signal. Other phases in a given limit cycle are possible and should theoretically give the same results.
The points of intersection of the trajectories with the Poincaré section rendered the Poincaré map with coordinates p = [p1, p2, …, pn]. If the system is stable, the successive intersections show convergence to a single reference point on the limit-cycle attractor. For an unstable system, the discrete points diverge over successive cycles. While the Poincaré analysis theoretically assumes a reference point, this reference point is not known in the measured data. For analysis purposes, the coordinates for the reference point p* were obtained from the average of all p at the section of an entire recording session (Figure 3C). The deviations of each pi from p* were then obtained as d = [d1, d2, …, dn]. This distance along the Poincaré section is measured in arbitrary units (au).
The degree of stability for the respective segments was quantified as the mean and standard deviation of d, denoted by Mean-d and SD-d, respectively. For the empirical analysis two additional Poincaré sections were chosen: one during the inspiration phase and one at end of expiration (dPCO2 = 0, thus PCO2 = PetCO2). Figure 4 illustrates these three Poincaré sections. For the end-expiratory section, the mean and standard deviation of the PetCO2 were also obtained.
Figure 4:

Example phase space with three Poincaré sections: expiratory (green), end-expiratory (pink) and inspiratory (orange).
2.5.3. Change in respiratory variability as a function of movement duration
If movement disrupts the stability of the limit cycle, then this effect should scale with the amount or duration of movement. To test this hypothesis, the variability measure SD-d after the transition (movement onset or offset) was analyzed with respect to movement duration.
2.6. Statistical analyses
To test for differences in the dependent measures before and after the apnea and before and after the onsets and offsets of movement, a linear mixed-effects model (LME) was used. LME models allow modeling both fixed effects (before and after movement onset) and random effects (inter-subject variability), i.e., account for both within- and across-subject variance. Since there were repeated observations within each subject, subject ID was included as a random effect.
The following dependent measures were analyzed for Cohort 1: total movement duration, mean and standard deviation of IBI. The dependent measures in Cohort 2: mean and standard deviation of IBI; for each Poincaré section: Mean-d and SD-d; additionally, for the Poincaré section at the end of expiration: the mean and standard deviation of PetCO2. These measures are summarized in Table 2.
Table 2:
Measurements and comparisons
| Poincaré Section | Other measures | |||
|---|---|---|---|---|
| Expiratory | End-expiratory | Inspiratory | ||
| Comparison 2 | Mean-d | Mean-d | Mean-d | Mean-IBI |
| SD-d | SD-d | SD-d | SD-IBI | |
| Mean-PetCO2 | SD-d ∝ Mov_dur | |||
| SD-PetCO2 | ||||
| Comparison 3 | Mean-d | Mean-d | Mean-d | Mean-IBI |
| SD-d | SD-d | SD-d | SD-IBI | |
| Mean-PetCO2 | SD-d ∝ Mov_dur | |||
| SD-PetCO2 | ||||
| Comparison 4 | SD-d | SD-d | SD-d | |
| SD-PetCO2 | ||||
SD, standard deviation; d, distance from reference point; PetCO2, end-tidal CO2; Mov_dur, movement duration in the movement segments.
For all dependent variables, separate linear mixed-effects models were implemented. For Cohort 1, one fixed effect was tested; Comparison 1: PRE-APNEA-ONSET and POST-APNEA-ONSET. For Cohort 2, three different sets of analyses were conducted; Comparison 2: PRE-MOVEMENT-ONSET and POST-MOVEMENT-ONSET; Comparison 3: PRE-MOVEMENT-OFFSET and POST-MOVEMENT-OFFSET; and Comparison 4: PRE-MOVEMENT-ONSET, DURING-MOVEMENT and POST-MOVEMENT-OFFSET. A random slope was included in the model to allow each subject to have a different slope for the compared segments.
The relation between respiratory variability of the Poincaré map (SD-d) with movement duration was analyzed using the same linear mixed-effects model. SD-d post-transition was taken as the dependent variable with movement duration as the independent variable and SD-d pre-transition as a covariate.
All statistical analyses were conducted using RStudio statistical software version 1.2.5019 (RStudio, Inc., Boston, MA). The model was implemented using ‘lmer’ function from the lme4 package (Bates et al., 2015). The average difference of the measures between the compared segments, 95% confidence intervals and p-values were estimated from the fitted model using the lmerTest package (Kuznetsova et al., 2017). For the three segments of Comparison 4, multiple pairwise Tukey tests were performed with Bonferroni correction using the ’glht’ function from the ‘multcomp’ package (Hothorn et al., 2008). Results were considered statistically significant when p < 0.05.
3. Results
3.1. Comparison 1: Movements before and after apneic onset
In Cohort 1 (infants #1–9), a total of 370 apneic events were identified. Table 3 lists the number of these apneic events for each subject along with the baseline SpO2 and heart rate values. In addition, the table also lists the infants’ feeding schedule and whether they were given caffeine.
Table 3:
Number of apneic events with the baseline oxygenation and heart rate values. Mean oxygenation and heart rate for pathological apneic events before after apnea onset are also shown.
| Subject ID | Feeding schedule | Caffeine | All apneic events | Pathological apneic events | ||||||
|---|---|---|---|---|---|---|---|---|---|---|
| SpO2 (%) | HR (bpm) | SpO2 (%) | HR (bpm) | |||||||
| Baseline values | Count | Count | Pre-apnea-onset | Post-apnea-onset | Pre-apnea-onset | Post-apnea-onset | ||||
| 1 | Q3 | y | 95.3 ± 2.5 | 156.4 ± 8.2 | 96 | 41 | 92.2 ± 4.2 | 77.8 ± 5.5 | 139.7 ± 12.4 | 89.0 ± 16.6 |
| 2 | Q4 | n/a | 99.3 ± 1.5 | 133.3 ± 13.3 | 66 | 41 | 97.7 ± 3.5 | 94.8 ± 5.1 | 110.3 ± 19.3 | 72.5 ± 12.6 |
| 3 | Q4 | n/a | 99.1 ± 1.2 | 133.4 ± 11.9 | 69 | 39 | 97.4 ± 8.0 | 92.0 ± 11.4 | 114.2 ± 19.7 | 76.1 ± 15.9 |
| 4 | Q3 | y | 99.5 ± 0.6 | 166.1 ± 6.7 | 6 | 6 | 99.2 ± 1.0 | 98.3 ± 1.2 | 147.2 ± 34.0 | 50.4 ± 12.0 |
| 5 | Q4 | y | 97.1 ± 9.8 | 140.8 ± 10.7 | 41 | 18 | 91.2 ± 18.1 | 79.4 ± 18.2 | 124.0 ± 16.9 | 115.9 ± 27.3 |
| 6 | Q3 | n/a | 91.8 ± 4.2 | 134.4 ± 3.2 | 14 | 8 | 87.1 ± 5.6 | 85.4 ± 5.8 | 124.7 ± 3.6 | 75.5 ± 16.2 |
| 7 | Q3 | y | 98.6 ± 1.2 | 155.3 ± 6.0 | 21 | 20 | 97.3 ± 2.4 | 89.7 ± 4.5 | 143.3 ± 14.4 | 68.9 ± 13.7 |
| 8 | Q3 | n/a | 97.0 ± 1.5 | 145.6 ± 6.1 | 49 | 38 | 96.4 ± 1.7 | 90.2 ± 8.2 | 130.2 ± 15.7 | 47.4 ± 24.6 |
| 9 | Q4 | n/a | 90.5 ± 15.8 | 157.3 ± 15.6 | 8 | 8 | 88.1 ± 15.3 | 77.1 ± 11.3 | 130.4 ± 19.6 | 77.1 ± 5.4 |
| Mean | 96.5 ± 4.3 | 147.0 ± 9.1 | 94.1 ± 6.6 | 87.2 ± 7.9 | 129.3 ± 17.3 | 74.7 ± 16.0 | ||||
| Total | 370 | 219 | ||||||||
Values are means ± SD; Feeding schedule: Q3, feeds every 3 hr; Q4, feeds every 4 hr; Caffeine: y, infant was on caffeine during study; n/a, information about caffeine unknown.
The onset of each apnea served as reference for comparing the inter-breath intervals and movement before and after the apnea. As expected, the mean IBI in the POST-APNEA segments was longer by 2.3 s (95% CI: 1.2 – 3.2; POST: 3.8 ± 1.6 s; PRE: 1.5 ± 0.4 s; P = 0.003). The standard deviation of IBI was also higher in the POST-APNEA segments by 3.7 s (95% CI: 2.5 – 4.8; POST: 5.0 ± 1.9 s; PRE: 1.3 ± 0.5 s; P = 0.0003). Of the 370 apneic events, 250 had more movement in the PRE-APNEA-ONSET segments when compared to the POST-APNEA-ONSET segments. Applying the mixed-model analysis, total movement duration in the PRE-APNEA-ONSET segments (15.5 ± 4.1 s) was significantly longer than in the POST-APNEA-ONSET segments (10.8 ± 4.3 s; F(1, 6.73) = 16.9; P = 0.005; 95% CI: 3.19 – 8.61). Of the 370 apneic events, 219 were pathological apneas since they were associated with bradycardia and/or oxygen desaturations. Of these pathological apneic events, the total movement duration in the PRE-APNEA-ONSET segments (14.8 ± 4.1 s) was still significantly longer than in the POST-APNEA-ONSET segments (11.1 ± 4.9 s; F(1,7.16) = 6.8; P = 0.033; 95% CI: 1.26 – 8.13). Figure 5 summarizes the results showing that 7 of the 9 subjects showed this increase. Hence, it can be concluded that when longer movements occurred, apneas, including pathological apneas, were more likely to appear.
Figure 5:

Changes in mean and standard deviation of inter-breath intervals (IBIs) and movement duration from PRE-APNEA-ONSET to POST-APNEA-ONSET segments (Comparison 1) in Cohort 1 (subject # 1–9). Movement duration in PRE-APNEA-ONSET to POST-APNEA-ONSET segments were also calculated for a subset of apneas that were classified as pathological. Each colored marker represents a single subject.
3.2. Comparison 2: Respiratory measures upon onset of movement
Using the onset of movements for reference, respiratory variables before and after the movement onset were compared in Cohort 2. The mean inter-breath intervals (IBI) increased upon movement onset by 0.28 s (F(1, 6.6) = 10.3; P = 0.0161; 95% CI: 0.11 – 0.45). The standard deviation of the IBIs also showed a significant increase following the onset of movement by 0.33 s (F(1, 5.4) = 24.3; P = 0.0035; 95% CI: 0.21 – 0.46). Figure 6 summarizes this increase in mean and variability showing that each of the 9 individuals displayed this trend.
Figure 6:

Differences in mean and standard deviation of inter-breath intervals in Comparison 2: PRE-MOVEMENT-ONSET vs POST-MOVEMENT-ONSET segments in Cohort 2 (subject # 10–17). Each colored marker represents a single subject.
To further probe into the potential effect of movement as perturbation to the respiratory rhythm, the continuous PCO2 signals were compared before and after movement onset. The 2D phase portrait was reconstructed for each segment and Poincaré sections were applied. To identify potential differences in respiration before and after movement onset, the Poincaré section was applied at the expiration phase, at the end of expiration, and the inspiration phase. For the expiratory Poincaré section, the onset of movement significantly increased the Mean-d (F(1, 5.3) = 7.01; P = 0.0428) and its variability SD-d (F(1, 6.3) = 16.65; P = 0.0059) (Figure 7A). Note that subject 10 had a lower PetCO2 value due to the use of a non-standard nasal cannula and was an outlier in this and subsequent analyses. The subject was not excluded from analysis, but excluding the subject would have yielded stronger significance. This indicates that upon movement onset, the intersections with the Poincaré section were further away from the reference point and also more variable, suggesting less stability in the respiratory activity. The same comparison at the end of expiration showed that while the Mean-PetCO2 did not change, SD-PetCO2 increased significantly after movement onset by 1.07 mmHg (F(1, 5.3) = 51.88; P = 0.0006; 95% CI: 0.8 – 1.34) (Figure 7B). Additional results from the end-expiratory and the inspiratory Poincaré sections have been summarized in Table 4.
Figure 7:

Differences in respiratory stability in Comparison 2: PRE-MOVEMENT-ONSET vs POST-MOVEMENT-ONSET segments in Cohort 2 (subject # 10–17). Each colored marker represents a single subject. A. Mean (Mean-d) and standard deviation (SD-d) of the distance from reference point using Poincaré sections taken at the expiratory Poincaré section B. Mean and standard deviation of end-tidal CO2 obtained at the end-expiration Poincaré section. Note: Subject denoted by red had lower PetCO2 values due to the use of a non-standard nasal canula for sampling of CO2. The subject was not excluded from analysis; excluding the subject would have yielded stronger significance.
Table 4:
Summary statistics of respiratory measures at the Poincaré sections at the onset of movement. Comparison 2: PRE-MOVEMENT-ONSET vs POST-MOVEMENT-ONSET segments
| Poincaré Section | Measures | PRE | POST | Diff (95% CI) | p |
|---|---|---|---|---|---|
| Expiratory | Mean-d (au) | 19.1 ± 5.6 | 20.4 ± 4.9 | 1.2 (0.4, 2.1) | 0.0428 |
| SD-d (au) | 9.3 ± 2.3 | 11.2 ± 2.9 | 1.7 (0.9, 2.5) | 0.0059 | |
| End-expiratory | Mean-d (au) | 5.8 ± 1.1 | 6.2 ± 1.1 | 0.5 (0.3, 0.7) | 0.0120 |
| SD-d (au) | 3.2 ± 0.6 | 3.6 ± 0.5 | 0.4 (0.3, 0.6) | 0.0040 | |
| Mean-PetCO2 (mmHg) | 35.5 ± 5.2 | 35.1 ± 4.6 | −0.2 (−1.0, 0.5) | 0.5934 | |
| SD-PetCO2 (mmHg) | 5.0 ± 1.1 | 6.1 ± 1.0 | 1.1 (0.8, 1.3) | 0.0006 | |
| Mean-IBI (s) | 1.7 ± 0.8 | 2.0 ± 1.0 | 0.3 (0.1, 0.5) | 0.0161 | |
| SD-IBI (s) | 0.8 ± 0.7 | 1.1 ± 0.7 | 0.3 (0.2, 0.5) | 0.0035 | |
| Inspiratory | Mean-d (au) | 23.0 ± 3.7 | 24.3 ± 3.6 | 1.4 (0.6, 2.3) | 0.0296 |
| SD-d (au) | 10.7 ± 2.5 | 12.4 ± 2.7 | 1.5 (1.0, 2.0) | 0.0026 |
Values are means ± SD; Mean-d, mean distance from reference point; SD-d, standard deviation of distance from reference point; PetCO2, end-tidal CO2; IBI, inter-breath interval; Diff., average difference between POST and PRE segments; CI, confidence interval for average difference; p, overall effect as estimated by a linear mixed model. Values in bold are significant at p<0.05.
3.3. Comparison 3: Respiratory measures upon offset of movement
The preceding analyses of changes in the respiratory measures used the onset of movement as reference. The after-effects of movement on respiratory activity were also analyzed by using movement offset as the demarcation. The first set of analyses on the inter-breath intervals showed that the mean inter-breath intervals (IBI) did not show any significant change after movement offset (F(1, 6.83) = 4.04; P = 0.0852). However, the standard deviation of the IBI decreased significantly following the offset of movement (F(1, 5.93) = 18.62; P = 0.0051) by 0.3s (95% CI: 0.17 – 0.43; Figure 8).
Figure 8:

Differences in mean and standard deviation of inter-breath intervals in Comparison 3: PRE-MOVEMENT-OFFSET vs POST-MOVEMENT-OFFSET segments in Cohort 2 (subject # 10–17). Each colored marker represents a single subject.
Respiratory measures obtained from the Poincaré section were also compared before and after movement offset. In the expiratory Poincaré section, there was no difference in Mean-d across segments (F(1, 6.2) = 3.15; P = 0.1245), however SD-d was significantly lower in the segment after the movement offset (F(1, 6.5) = 12.28; P = 0.0112; Figure 9A). Similar results were obtained in the end-expiratory and inspiratory Poincaré sections (Table 5). This indicates that after movement offset, the intersections of the phase space with the Poincaré section were less variable, suggesting higher stability in the respiratory activity. In the end-expiratory Poincaré section, there was no difference in Mean-PetCO2 across segments (F(1, 6.5) = 2.42; P = 0.1668). However, SD-PetCO2 was significantly lower in the segment after the movement offset (F(1, 6.19) = 30.18; P = 0.0014; Figure 9B).
Figure 9:

Differences in respiratory stability for Comparison 3 (PRE-MOVEMENT-OFFSET and POST-MOVEMENT-OFFSET segments) in Cohort 2 (subject # 10–17). Each colored marker represents a single subject. A. Mean (Mean-d) and standard deviation (SD-d) of the distance from reference point at the expiratory Poincaré sections. B. Mean and standard deviation of end-tidal CO2 obtained at the end-expiratory Poincaré section.
Table 5:
Summary statistics of respiratory measures at the Poincaré sections at the offset of movement. Comparison 3: PRE-MOVEMENT-OFFSET vs POST-MOVEMENT-OFFSET segments
| Poincaré Section | Measures | PRE | POST | Diff (95% CI) | p |
|---|---|---|---|---|---|
| Expiratory | Mean-d (au) | 20.9 ± 3.9 | 19.3 ± 5.4 | −1.1 (−2.3, 0.1) | 0.1245 |
| SD-d (au) | 11.1 ± 2.7 | 9.4 ± 2.2 | −1.7 (−2.6, − 0.8) | 0.0112 | |
| End-expiratory | Mean-d (au) | 6.3 ± 0.9 | 5.9 ± 1.0 | −0.3 (−0.5, − 0.1) | 0.0440 |
| SD-d (au) | 3.7 ± 0.5 | 3.2 ± 0.6 | −0.5 (−0.7, − 0.3) | 0.0031 | |
| Mean-PetCO2 (mmHg) | 35.1 ± 4.6 | 36.0 ± 5.5 | 0.7 (−0.2, 1.6) | 0.1668 | |
| SD-PetCO2 (mmHg) | 6.0 ± 1.1 | 5.0 ± 1.3 | −1.1 (−1.4, − 0.7) | 0.0014 | |
| Mean-IBI (s) | 2.0 ± 1.3 | 1.8 ± 0.9 | 0.1 (−0.1, 0.3) | 0.0852 | |
| SD-IBI (s) | 1.2 ± 0.9 | 0.9 ± 0.8 | 0.2 (0.03, 0.4) | 0.0051 | |
| Inspiratory | Mean-d (au) | 24.5 ± 2.9 | 23.9 ± 3.3 | −0.6 (−1.4, 0.2) | 0.2573 |
| SD-d (au) | 12.5 ± 2.8 | 10.9 ± 2.5 | −1.5 (−2.3, − 0.8) | 0.0081 |
Values are means ± SD; Mean-d, mean distance from reference point; SD-d, standard deviation of distance from reference point; PetCO2, end-tidal CO2; IBI, inter-breath interval; Diff., average difference between POST and PRE segments; CI, confidence interval for average difference; p, overall effect as estimated by a linear mixed model. Values in bold are significant at p<0.05.
3.4. Respiratory variability as a function of movement duration
Given the significant changes in respiratory variability induced by movement, we also evaluated if longer durations of movements had a larger effect. To quantify this effect, movement duration after onset was included in the linear mixed-effects model. The POST-MOVEMENT-ONSET variability (SD-d) increased significantly with increasing movement duration in all three sections. The slopes of the regressions were: expiratory Poincaré section: β = 0.12; 95% CI: 0.07 – 0.16; P = 0.0028, end-expiratory section: β = 0.03; 95% CI: 0.01 – 0.04; P = 0.0062, and the inspiratory section: β = 0.12; 95% CI: 0.05 – 0.14; P = 0.0045. This indicates that for every 1 s increase in movement duration, variability increased by 0.12 au in the inspiratory and expiratory Poincaré sections. Respiratory variability was also analyzed as a function of movement duration with movement offset as demarcation. The linear mixed-effects model showed that overall movement duration before its offset had a significant effect on the POST-MOVEMENT-OFFSET respiratory variability measure (SD-d) in all three Poincaré sections: expiratory (β = −0.08; 95% CI: −0.13 – −0.02; P = 0.038), end-expiratory (β = −0.02; 95% CI: −0.03 – −0.005; P = 0.0391), and inspiratory Poincaré section (β = −0.08; 95% CI: −0.14 – −0.02; P = 0.0413).
3.5. Comparison 4: Respiratory variability before, during and after the movement
A final analysis focused on comparing respiratory activity in segments before the onset, during and after the offset of movement. In the expiratory Poincaré section a significant difference in SD-d was seen across the three segments (F(2. 4.94) = 7.19; P = 0.0344; Figure 10A). Post-hoc Tukey tests revealed that SD-d values increased after movement onset by 2.66 au (z = 4.31; P < 0.0001; 95% CI: 1.24 – 4.08). SD-d decreased again after movement had terminated by 2.89 au (z = −3.48; P = 0.0015; 95% CI: 0.98 – 4.8). Importantly, there was no difference between the PRE-ONSET and POST-OFFSET segments (z = 0.49; P = 1). Similar results for SD-d were obtained from the end-expiratory and inspiratory Poincaré sections.
Figure 10:
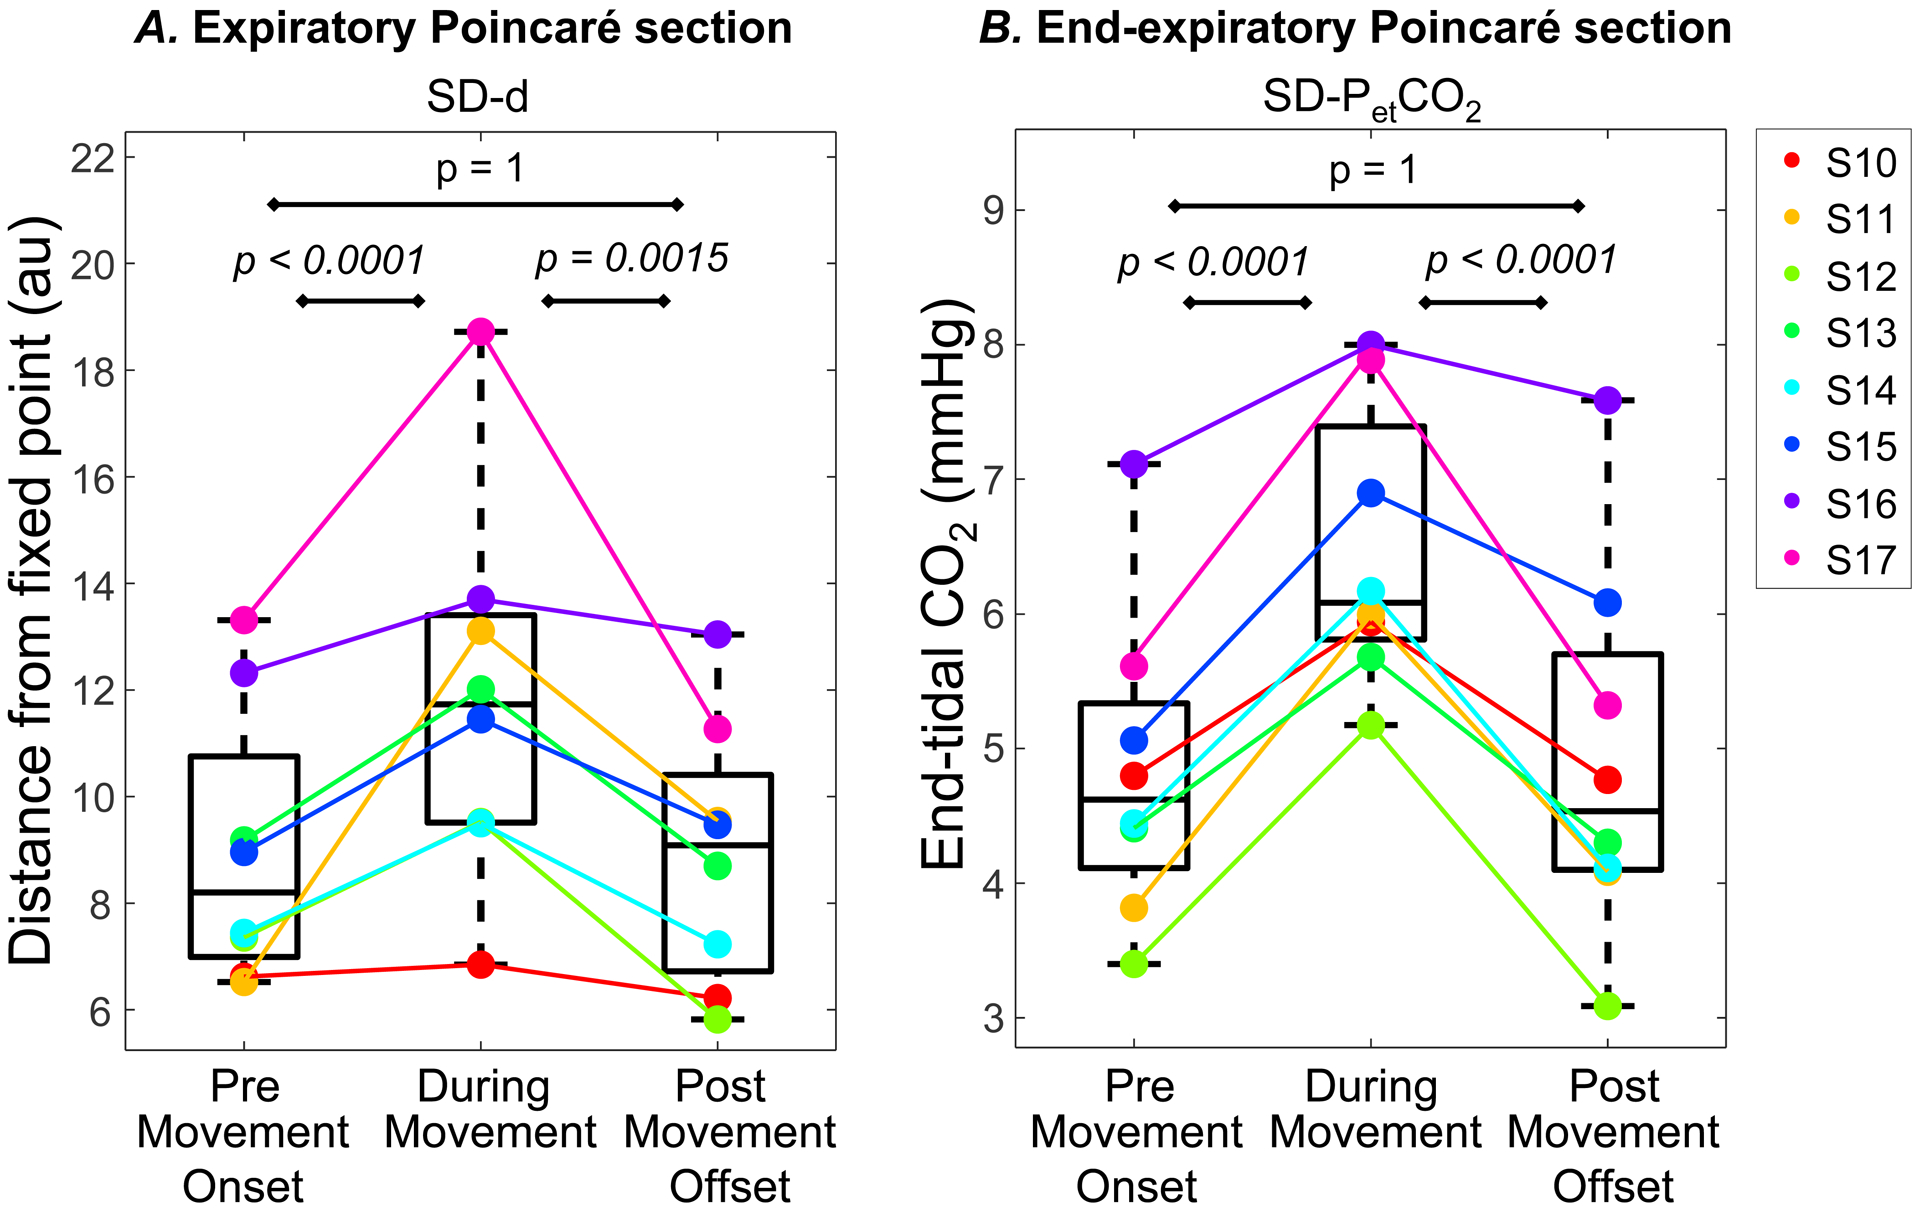
Variability measures for Comparison 4 (PRE-MOVEMENT-ONSET, DURING-MOVEMENT and POST-MOVEMENT-OFFSET segments) in Cohort 2 (subject #10–17). Each colored marker represents a single subject. A. Standard deviation (SD-d) of the distance from reference point at the expiratory Poincaré sections. B. Standard deviation of end-tidal CO2 obtained at the end-expiratory Poincaré section.
Addtionally, SD-PetCO2 from the end-expiratory Poincaré section showed a significant difference was seen across the three segments (F(2. 4.7) = 19.3; P = 0.0053). Post-hoc Tukey tests revealed that SD-PetCO2 values increased after movement onset by 1.60 mmHg (z = 7.23; P < 0.0001; 95% CI: 1.09 – 2.12). SD-PetCO2 decreased again after movement had terminated by 1.58 mmHg (z = −5.44; P = 0.0015; 95% CI: 0.91 – 2.26). Again, there was no difference between the PRE-ONSET and POST-OFFSET segments (z = 0.09; P = 1; Figure 10B). These findings indicate that respiratory variability measures increased with the onset of movement but returned to pre-movement onset values following the offset of movement.
4. Discussion
4.1. Sensory influences to the control of breathing
Respiratory rhythms are generated and regulated by neural circuitry distributed throughout the pons and medulla. This respiratory control network generates automatic breathing under normal conditions, but it may fail in preterm infants (Martin & Wilson, 2012). Central and peripheral chemosensitivity is a major chemical driver of respiratory neural output. Feedforward central commands from the supra-pontine regions to the locomotor and respiratory rhythm generators are also a driver of the intensity and patterns of inspiratory and expiratory activities in response to changing metabolic conditions (Eldridge et al., 1981). Feedback from peripheral sensory inputs such as mechanoreceptors in the lungs and airways as well as from proprioceptors in muscles and joints are also known to influence respiratory activity (Shevtsova et al., 2019). These feedback input signals are generated or modified by movements related to both respiration and limb movements. Therefore, this study aimed to analyze the effect of gross body movements on respiratory rhythm.
4.2. Onset of apnea relative to movement
The association of movement with respiratory pauses in preterm infants has previously been reported, noting a relative increase in the number of apneas associated with bouts of movement (Abu-Osba et al., 1982; Curzi-Dascalova & Christova-Guéorguiéva, 1983; Weintraub et al., 1994). Mathew and colleagues analyzed the timing of the onsets of movements and of apneas in 10 preterm infants and found that 202 of 352 apneic events were preceded by motor activity that continued through the onset of apnea (Mathew et al., 1991). About 41% of the 202 apneic episodes were preceeded by movements that started 5s or less time before the apnea. In 21% of the 202 episodes, movement began between 5–15s before the onset of apneas. For the remaining 38% of apneas movement activity started 15s and longer before the apnea.
To compare our data with Mathew et al.’s results, we replicated their method for Cohort 1. First, all apneic episodes from infants #1–9 were identified. As in Mathew et al., we limited the analysis to only those apneas that had movement activity preceeding the apneic onset and continuing with it. We then computed the time intervals between the onsets of apneas and the movement that preceeded and continued during the apneic event, at least until the apnea began. These time intervals were classified into bins of 0–5s, 5–15s, 15–30s and >30s. We found that 158 of the 370 apneic events were concomitant with movement activity. 60 (38%) of those 158 events began within 5 s of movement onset. 37 (23%) of the 158 events occurred between 5–15 s of movement onset (Figure 11).
Figure 11:

Time interval between onset of movements and onset of apneas.
Although our results replicated those by Mathew and colleagues, their analysis provided a limited picture of the impact of movement on breathing because it excluded apneas that were not concomitant with movement. Also, while the analysis considered the temporal relation between the onsets of movements and the concomitant apneas, it omitted the effects of any preceding movement segments. These criteria constitute a selection bias and might have skewed their results. Our analysis considered all 370 apneic events, irrespective of their temporal association with movement. The findings of our study revealed longer movement durations before apneic events, including pathological apneas, and therefore suggests that movement and apneas are not only closely associated, but also causally related. To further scrutinize this association, subsequent analyses investigated the changes in respiratory activity around an isolated movement activity.
4.3. Changes in respiratory features following onset and offset of movement
The timing of breaths often exhibits wide variations that are of clinical importance when associated with prolonged apneas and hypoxia. Our findings suggest that movement causes both prolongation and increased variability of inter-breath intervals, suggesting a destabilizing effect of movement on respiratory rhythm. Experimental and computational studies support the idea that nonlinear input-output properties at many levels of organization could destabilize breathing in preterm infants (Khoo, 2000). Possible factors are an increased loop gain of chemical feedback (Carley & Shannon, 1988), unstable interactions with the neural systems underlying sleep and arousal (Lehtonen & Martin, 2004) and intrinsic properties of the immature central respiratory oscillator (Del Negro et al., 2002; Frey et al., 1998; Paydarfar & Buerkel, 1995). Changes in the variability of respiration induced by movement likely reflect its maturity and functional integrity (Khoo, 2000), related to both central interactions with the brainstem respiratory network and feedback effects from mechanoreceptors, for example Type III and IV afferent inputs from limb muscles activated during movement (Amann et al., 2010).
Linear signal processing methods only provide limited information since they ignore any non-stationarities and other dynamics of the time series. Nonlinear methods that allow analysis of the dynamic characteristics of the respiratory drive are likely to uncover more information. Studies in deafferented neonatal and adult animals support that the neural respiratory rhythm is generated by a nonlinear limit cycle oscillator, subject to noisy perturbations arising within or impinging upon the oscillator (Paydarfar & Buerkel, 1995). In infants, the dynamics of breathing during quiet sleep can best be described as a noise-driven nonlinear system with a two-dimensional periodic orbit (Small et al., 1999). Several previous studies have applied nonlinear methods such as calculating the Lyapunov exponent, correlation dynamics and Poincaré maps to study the dynamics of the respiratory system (Donaldson, 1992; Ruan et al., 2009; Small et al., 1999). We applied Poincaré sections that quantified the variability of the signal in a reconstructed phase space to assess the role of movements for the neuro-respiratory controller.
Upon the onset of movement, the Poincaré section revealed a significant increase in both deviation and variability around the reference point. This marked change was similarly present in the expiratory, end-expiratory and inspiratory Poincaré sections. After the end of the movement, the variability indices returned to the pre-movement values, thus indicating the presence of a stable attractor at baseline. Furthermore, the increase in variability depended on the duration of the movement. This change in variability suggests that a negative feedback loop was responsive to movement perturbations and scaled with movement duration to stabilize the system. Previous research demonstrated that preterm infants have an elevated loop gain due to the immaturity of the controller compared to healthy controls (Carley & Shannon, 1988; Edwards et al., 2018; Terrill et al., 2015). It is possible that a higher gain in the feedback loop may cause higher variability that can in some cases lead to apneas. This elevated loop gain along with increasing variability and decreasing levels of carbon dioxide introduces nonlinearities in the feedback, making nonlinear methods more appropriate for the analysis of the respiratory system (Khoo, 2000).
Besides the feedback mechanism, there is also evidence of feedforward control of respiration during movement. This is based on observations of increases in respiratory activity in decorticate cats when feedback mechanisms were eliminated (Eldridge et al., 1985; Eldridge et al., 1981). In adults the feedforward central mechanism plays an important role in the increase in ventilation during exercise and is known as exercise hyperpnea. These descending central commands are responsible for a parallel drive from the hypothalamic (Eldridge et al., 1981), the mesencephalic (Gariépy et al., 2012), or the pontomedullary (Romaniuk et al., 1994) locomotor region to the respiratory and locomotion controllers. Although these commands increase ventilation in adults during movement, our results show a drop in the respiratory rate following the onset of an isolated movement activity (Figure 5B). We speculate that in preterm infants this effect could be a result of the underdeveloped neural substrates from the supra-pontine regions to the respiratory controller. White matter development and myelination in these regions is not complete during the preterm period (Dubois et al., 2014). An alternative source of central inhibition of breathing by movement could be the neural circuits that are associated with the oxygen conserving response (Panneton, 2013). Of note, inhibition of breathing in exercising adults and in infants can conserve cerebral and cardiac O2 by elevating flow to these organs while reducing blood perfusion in the viscera and muscles (Lindholm et al., 1999; Lobban, 1995). The same neural circuits that mediate the dive reflex have also been hypothesized to cause sudden infant death syndrome as they can trigger apneas and bradycardias (Lobban, 1991; Matturri et al., 2005). The dive reflex is typically elicited by trigeminal stimulation; however, we speculate that movement might activate a component of the underlying central neural circuitry causing an inhibition in breathing.
Another factor that could cause respiratory instability is a smaller CO2-reserve, defined as the difference between the eupneic and apneic arterial PCO2 threshold (PaCO2) (Katayama et al., 2007). The CO2-reserve is known to be around 1.3 mmHg in preterm infants which is small relative to adults (Khan et al., 2005). Therefore, the relative proximity of the eupneic and apneic threshold could easily lead to unstable breathing. When this is combined with higher nonlinear feedback gains, it is conceivable that apneas are elicited. Even though our study did not have access to the arterial blood gases, the end-tidal partial pressure of carbon dioxide (PetCO2) obtained from the peak of the exhaled PCO2 waveform is well correlated with the arterial partial pressure of carbon dioxide, PaCO2 (Wu et al., 2003). Results showed that at the end of expiration, there was a significant increase in the variability of PetCO2, including PCO2 following the onset of movement. A higher feedback gain combined with an increased occurrence of hypoventilation or hyperventilation (increased IBI) could cause a higher variability in PCO2. Persistent fluctuations of PaCO2 may cause central apneas in preterm infants given their narrow CO2-reserve if PaCO2 falls below the apneic threshold. After the end of movement, variability of the distance from the reference point (SD-d) and PetCO2 variability were significantly lower than during movement. Yet, they were higher than the pre-movement values, although this difference was not significant, potentially suggesting that there is a delay to return to the baseline values. However, we were unable to quantify this delay with the metrics from the available non-invasive data.
In summary, our findings indicate that after a period of rest, an onset of movement induced a significant increase in variability of IBIs, PetCO2 and the dynamic measures of the respiratory controller. The system returned to a baseline level of variability after the end of the movement. However, it is important to note that movement is not the sole source of respiratory variability, since there are bouts of increased variability without a preceding movement.
4.4. Questions for future research
This study explored the relation between spontaneous movement activity and ventilatory instability. Infant movement was measured using a wavelet-based algorithm that quantified the movement-induced distortions in the PPG signal (Zuzarte et al., 2019). While the algorithm obtained a reliable estimation of movement duration, it was unable to capture any qualitative features, such as how forceful or how slow movements were, or which limb was moving. Note though that small limb movements even when remote from the sensor were measured. Classification of certain types of activity, specifically sighs which could change breathing patterns, was also not available. Any movement detected by the wavelet PPG algorithm was included in all analyses.
Aside from bodily movements, there are also other factors that could have induced unstable breathing and apnea. Examples are fluctuations in peripheral chemoreceptor sensitivity, obstruction of upper airways, and transitions between different sleep stages, including interaction of all these during arousal. Differences between stages of sleep and transitions from sleep to wakefulness could have a disruptive effect on breathing. However, this study did not use a full polysomnography to assess sources of variability arising from different sleep states. Although video recording was available, the video camera was oriented to optimize viewing of the limbs and trunk of the infant. The face was not a part of the video’s field of view and therefore did not allow reliable behavioral scoring of sleep and wake states.
Another factor for respiratory instability are interindividual differences in ventilatory response to arousal during sleep-wake transitions (Horner et al., 2001). A greater ventilatory response in some subjects could lower PaCO2 below the apneic threshold and thereby cause periodic breathing by an increase the frequency of occurrence of central apneas (Xie et al., 1994). More information about whether an apnea was terminated by a caregiver or self-resolved by the infant without any external stimulation would benefit in studying the role of movement on periodic breathing and recurrent apneas.
Incidences of apneas in preterm infants also decline by gestational age, as the infants mature and gain in body weight. In the NICU, preterm infants are often administered methylxanthines, such as caffeine that reduce the frequency of apnea. Incidences of apneas also vary relative to position of the infant and towards the end of feeds. Our previous work continuously quantified infant movement in the NICU and revealed that the distribution of movement duration in preterm infants change as they get older (Zuzarte et al., 2020).
Hence, given these additional considerations, caution should be exercised when directly extrapolating these findings to apneas of prematurity in the clinical practice. Future longitudinal studies with a larger number of preterm infants could help corroborate the present findings as well as study apneas as a result of the combined effect of post-menstrual age. body weight, sleep state, caffeine, feeds, infant position and spontaneous movement.
Finally, the finding that spontaneous bodily movement precedes apneic episodes suggests that movement features could predict subsequent apneic events in individual infants using a statistical machine learning framework, which was previously supported in a preliminary study (Williamson et al., 2013). We speculate that movement-induced respiratory variability is an important physiological feature that precedes apneic episodes, and inclusion of measures related to respiratory variability will enhance the accuracy of predictive algorithms.
5. Conclusion
Spontaneous movements in preterm infants can influence the activity of the respiratory center. Our findings suggest that the degree of perturbation from movement to respiration can indicate the maturity of the neuro-respiratory system. These findings could be used for a novel index of maturation, where the interaction between movement and respiration could be analyzed over several weeks of prematurity. Furthermore, movement could be used as a window for risk-stratification and as a predictive measure of apneas and bradycardias.
New Findings.
-
What is the central question of this study?
The respiratory centers in the brainstem that control respiration receive inputs from various sources, including proprioceptors in muscles and joints and suprapontine centers that all affect limb movements. What is the effect of spontaneous movement on respiration in preterm infants?
-
What is the main finding and its importance?
Apneic events tend to be preceeded by movements. These activity bursts can cause respiratory instability that lead to an apenic event. These findings show promise that infant movements might serve as potential predictors of life-threatening apneic episodes, but more research is required.
Acknowledgements
The authors thank Courtney Temple and Alan Gee for their help in data collection, the NICU staff for subject recruitment, and the infants and families for participating in this study.
Funding
This study received funding from the NIH grants R01-GM104987, R01-HD081346, R21-HD089731, and U01-HL133536; NSF SCH grant #1664815; Simons Foundation grant SFARI-602705, and the Wyss Institute at Harvard University.
Footnotes
Data Availability
All data points are plotted within the figures of the manuscript. Any additional data that support the findings of this study are available from the corresponding author upon request.
Competing interests
The authors declare that they have no competing interests.
References
- Abu-Osba YK, Brouillette RT, Wilson SL, & Thach BT (1982). Breathing pattern and transcutaneous oxygen tension during motor activity in preterm infants. The American Review of Respiratory Disease, 125(4), 382–387. 10.1164/arrd.1982.125.4.382 [DOI] [PubMed] [Google Scholar]
- Amann M, Blain GM, Proctor LT, Sebranek JJ, Pegelow DF, & Dempsey JA (2010). Group III and IV muscle afferents contribute to ventilatory and cardiovascular response to rhythmic exercise in humans. Journal of Applied Physiology, 109(4), 966–976. 10.1152/japplphysiol.00462.2010 [DOI] [PMC free article] [PubMed] [Google Scholar]
- Bates D, Mächler M, Bolker B, & Walker S (2015). Fitting Linear Mixed-Effects Models Using lme4. Journal of Statistical Software, 67(1), 1–48. 10.18637/jss.v067.i01 [DOI] [Google Scholar]
- Carley DW, & Shannon DC (1988). Relative stability of human respiration during progressive hypoxia. Journal of Applied Physiology, 65(3), 1389–1399. 10.1152/jappl.1988.65.3.1389 [DOI] [PubMed] [Google Scholar]
- Clark MT, Delos JB, Lake DE, Lee H, Fairchild KD, Kattwinkel J, & Moorman JR (2016). Stochastic modeling of central apnea events in preterm infants. Physiological measurement, 37(4), 463–484. 10.1088/0967-3334/37/4/463 [DOI] [PMC free article] [PubMed] [Google Scholar]
- Curzi-Dascalova L, & Christova-Guéorguiéva E (1983). Respiratory pauses in normal prematurely born infants. A comparison with full-term newborns. Biology of the Neonate, 44(6), 325–332. 10.1159/000241747 [DOI] [PubMed] [Google Scholar]
- Darnall RA, Kattwinkel J, Nattie C, & Robinson M (1997). Margin of safety for discharge after apnea in preterm infants. Pediatrics, 100(5), 795–801. 10.1542/peds.100.5.795 [DOI] [PubMed] [Google Scholar]
- Del Negro CA, Wilson CG, Butera RJ, Rigatto H, & Smith JC (2002). Periodicity, Mixed-Mode Oscillations, and Quasiperiodicityin a Rhythm-Generating Neural Network. Biophysical Journal, 82(1), 206–214. 10.1016/S0006-3495(02)75387-3 [DOI] [PMC free article] [PubMed] [Google Scholar]
- Delivoria-Papadopoulos M, & McGowan J (1998). Fetal and Neonatal Physiology.
- Deulofeut R, Critz A, Adams-Chapman I, & Sola A (2006). Avoiding hyperoxia in infants < or = 1250 g is associated with improved short- and long-term outcomes. Journal of Perinatology: Official Journal of the California Perinatal Association, 26(11), 700–705. 10.1038/sj.jp.7211608 [DOI] [PubMed] [Google Scholar]
- Di Fiore JM, Bloom JN, Orge F, Schutt A, Schluchter M, Cheruvu VK, Walsh M, Finer N, & Martin RJ (2010). A higher incidence of intermittent hypoxemic episodes is associated with severe retinopathy of prematurity. The Journal of pediatrics, 157(1), 69–73. 10.1016/j.jpeds.2010.01.046 [DOI] [PMC free article] [PubMed] [Google Scholar]
- Di Fiore JM, Kaffashi F, Loparo K, Sattar A, Schluchter M, Foglyano R, Martin RJ, & Wilson CG (2012). The relationship between patterns of intermittent hypoxia and retinopathy of prematurity in preterm infants. Pediatric research, 72(6), 606–612. 10.1038/pr.2012.132 [DOI] [PMC free article] [PubMed] [Google Scholar]
- Di Fiore JM, MacFarlane PM, & Martin RJ (2019). Intermittent hypoxemia in preterm infants. Clinics in perinatology, 46(3), 553–565. 10.1016/j.clp.2019.05.006 [DOI] [PMC free article] [PubMed] [Google Scholar]
- Di Fiore JM, Martin RJ, & Gauda EB (2013). Apnea of prematurity--perfect storm. Respiratory Physiology & Neurobiology, 189(2), 213–222. 10.1016/j.resp.2013.05.026 [DOI] [PubMed] [Google Scholar]
- Dingwell JB, & Kang HG (2007). Differences between local and orbital dynamic stability during human walking. Journal of Biomechanical Engineering, 129(4), 586–593. 10.1115/1.2746383 [DOI] [PubMed] [Google Scholar]
- Donaldson GC (1992). The chaotic behaviour of resting human respiration. Respiration Physiology, 88(3), 313–321. 10.1016/0034-5687(92)90005-h [DOI] [PubMed] [Google Scholar]
- Dubois J, Dehaene-Lambertz G, Kulikova S, Poupon C, Hüppi PS, & Hertz-Pannier L (2014). The early development of brain white matter: a review of imaging studies in fetuses, newborns and infants. Neuroscience, 276, 48–71. 10.1016/j.neuroscience.2013.12.044 [DOI] [PubMed] [Google Scholar]
- Edwards BA, Nava-Guerra L, Kemp JS, Carroll JL, Khoo MC, Sands SA, Terrill PI, Landry SA, & Amin RS (2018). Assessing ventilatory instability using the response to spontaneous sighs during sleep in preterm infants. Sleep, 41(11). 10.1093/sleep/zsy161 [DOI] [PMC free article] [PubMed] [Google Scholar]
- Eldridge FL, Millhorn DE, Killey JP, & Waldrop TG (1985). Stimulation by central command of locomotion, respiration and circulation during exercise. Respiration Physiology, 59(3), 313–337. 10.1016/0034-5687(85)90136-7 [DOI] [PubMed] [Google Scholar]
- Eldridge FL, Millhorn DE, & Waldrop TG (1981). Exercise hyperpnea and locomotion: parallel activation from the hypothalamus. Science (New York, N.Y.), 211(4484), 844–846. 10.1126/science.7466362 [DOI] [PubMed] [Google Scholar]
- Frey U, Silverman M, Barabási AL, & Suki B (1998). Irregularities and power law distributions in the breathing pattern in preterm and term infants. Journal of Applied Physiology, 85(3), 789–797. 10.1152/jappl.1998.85.3.789 [DOI] [PubMed] [Google Scholar]
- Gariépy J-F, Missaghi K, Chevallier S, Chartré S, Robert M, Auclair F, Lund JP, & Dubuc R (2012). Specific neural substrate linking respiration to locomotion. Proceedings of the National Academy of Sciences, 109(2), E84–E92. 10.1073/pnas.1113002109 [DOI] [PMC free article] [PubMed] [Google Scholar]
- Gauda EB, Shirahata M, Mason A, Pichard LE, Kostuk EW, & Chavez-Valdez R (2013). Inflammation in the carotid body during development and its contribution to apnea of prematurity. Respiratory Physiology & Neurobiology, 185(1), 120–131. 10.1016/j.resp.2012.08.005 [DOI] [PubMed] [Google Scholar]
- Glass L, & Mackey MC (1988). From Clocks to Chaos: The Rhythms of Life. Princeton University Press. [Google Scholar]
- Honerkamp J (1983). The heart as a system of coupled nonlinear oscillators. Journal of Mathematical Biology, 18(1), 69–88. 10.1007/BF00275911 [DOI] [PubMed] [Google Scholar]
- Horner RL, Rivera MP, Kozar LF, & Phillipson EA (2001). The ventilatory response to arousal from sleep is not fully explained by differences in CO(2) levels between sleep and wakefulness. The Journal of physiology, 534(Pt 3), 881–890. 10.1111/j.1469-7793.2001.00881.x [DOI] [PMC free article] [PubMed] [Google Scholar]
- Hothorn T, Bretz F, & Westfall P (2008). Simultaneous inference in general parametric models. Biometrical Journal. Biometrische Zeitschrift, 50(3), 346–363. 10.1002/bimj.200810425 [DOI] [PubMed] [Google Scholar]
- Hurmuzlu Y, Basdogan C, & Carollo JJ (1994). Presenting joint kinematics of human locomotion using phase plane portraits and Poincaré maps. Journal of Biomechanics, 27(12), 1495–1499. 10.1016/0021-9290(94)90199-6 [DOI] [PubMed] [Google Scholar]
- Iwasaki J, Vann WF, Dilley DC, & Anderson JA (1989). An investigation of capnography and pulse oximetry as monitors of pediatric patients sedated for dental treatment. Pediatric Dentistry, 11(2), 111–117. [PubMed] [Google Scholar]
- Janvier A, Khairy M, Kokkotis A, Cormier C, Messmer D, & Barrington KJ (2004). Apnea is associated with neurodevelopmental impairment in very low birth weight infants. Journal of perinatology, 24(12), 763–768. 10.1038/sj.jp.7211182 [DOI] [PubMed] [Google Scholar]
- Katayama K, Smith CA, Henderson KS, & Dempsey JA (2007). Chronic intermittent hypoxia increases the CO2 reserve in sleeping dogs. Journal of Applied Physiology (Bethesda, Md.: 1985), 103(6), 1942–1949. 10.1152/japplphysiol.00735.2007 [DOI] [PubMed] [Google Scholar]
- Khan A, Qurashi M, Kwiatkowski K, Cates D, & Rigatto H (2005). Measurement of the CO2 apneic threshold in newborn infants: possible relevance for periodic breathing and apnea. Journal of Applied Physiology (Bethesda, Md.: 1985), 98(4), 1171–1176. 10.1152/japplphysiol.00574.2003 [DOI] [PubMed] [Google Scholar]
- Khoo MC (2000). Determinants of ventilatory instability and variability. Respiration Physiology, 122(2–3), 167–182. 10.1016/s0034-5687(00)00157-2 [DOI] [PubMed] [Google Scholar]
- Kuznetsova A, Brockhoff PB, & Christensen RHB (2017). lmerTest Package: Tests in Linear Mixed Effects Models. Journal of Statistical Software, 82(1), 1–26. 10.18637/jss.v082.i13 [DOI] [Google Scholar]
- Lehtonen L, & Martin RJ (2004). Ontogeny of sleep and awake states in relation to breathing in preterm infants. Seminars in neonatology: SN, 9(3), 229–238. 10.1016/j.siny.2003.09.002 [DOI] [PubMed] [Google Scholar]
- Lindholm P, Sundblad P, & Linnarsson D (1999). Oxygen-conserving effects of apnea in exercising men. Journal of Applied Physiology (Bethesda, Md.: 1985), 87(6), 2122–2127. 10.1152/jappl.1999.87.6.2122 [DOI] [PubMed] [Google Scholar]
- Lobban CDR (1991). The human dive reflex as a primary cause of SIDS: A review of the literature. Medical Journal of Australia, 155(8), 561–563. 10.5694/j.1326-5377.1991.tb93898.x [DOI] [PubMed] [Google Scholar]
- Lobban CDR (1995). The oxygen-conserving dive reflex re-examined as the principal contributory factor in sudden infant death. Medical Hypotheses, 44(4), 273–277. 10.1016/0306-9877(95)90179-5 [DOI] [PubMed] [Google Scholar]
- Martin RJ, & Wilson CG (2012). Apnea of prematurity. Comprehensive Physiology, 2(4), 2923–2931. 10.1002/cphy.c100021 [DOI] [PubMed] [Google Scholar]
- Mathew OP, Thoppil CK, & Belan M (1991). Motor activity and apnea in preterm infants. Is there a causal relationship? The American Review of Respiratory Disease, 144(4), 842–844. 10.1164/ajrccm/144.4.842 [DOI] [PubMed] [Google Scholar]
- Matturri L, Ottaviani G, & Lavezzi AM (2005). Sudden infant death triggered by dive reflex. Journal of Clinical Pathology, 58(1), 77–80. 10.1136/jcp.2004.020867 [DOI] [PMC free article] [PubMed] [Google Scholar]
- Panneton WM (2013). The Mammalian Diving Response: An Enigmatic Reflex to Preserve Life? Physiology, 28(5), 284–297. 10.1152/physiol.00020.2013 [DOI] [PMC free article] [PubMed] [Google Scholar]
- Paydarfar D, & Buerkel DM (1995). Dysrhythmias of the respiratory oscillator. Chaos (Woodbury, N.Y.), 5(1), 18–29. 10.1063/1.166067 [DOI] [PubMed] [Google Scholar]
- Paydarfar D, & Eldridge FL (1987). Phase resetting and dysrhythmic responses of the respiratory oscillator. The American Journal of Physiology, 252(1 Pt 2), R55–62. 10.1152/ajpregu.1987.252.1.R55 [DOI] [PubMed] [Google Scholar]
- Poets CF (2020). Intermittent hypoxia and long-term neurological outcome: How are they related? Seminars in Fetal and Neonatal Medicine, [DOI] [PubMed] [Google Scholar]
- Poets CF, Roberts RS, Schmidt B, Whyte RK, Asztalos EV, Bader D, Bairam A, Moddemann D, Peliowski A, Rabi Y, Solimano A, Nelson H, & Canadian Oxygen Trial I (2015). Association Between Intermittent Hypoxemia or Bradycardia and Late Death or Disability in Extremely Preterm Infants. Jama, 314(6), 595–603. 10.1001/jama.2015.8841 [DOI] [PubMed] [Google Scholar]
- Poets CF, Stebbens VA, Samuels MP, & Southall DP (1993). The Relationship between Bradycardia, Apnea, and Hypoxemia in Preterm Infants. Pediatric research, 34(2), 144–147. 10.1203/00006450-199308000-00007 [DOI] [PubMed] [Google Scholar]
- Rasband SN (2015). Chaotic dynamics of nonlinear systems. Courier Dover Publications. [Google Scholar]
- Romaniuk JR, Kasicki S, Kazennikov O, & Selionov VA (1994). Respiratory response to stimulation of spinal or medullary locomotor structures in decerebrate cats. Acta Neurobiologiae Experimentalis, 54(1), 11–17. [PubMed] [Google Scholar]
- Ruan D, Fessler JA, Balter JM, & Keall PJ (2009). Real-time profiling of respiratory motion: baseline drift, frequency variation and fundamental pattern change. Physics in Medicine and Biology, 54(15), 4777–4792. 10.1088/0031-9155/54/15/009 [DOI] [PubMed] [Google Scholar]
- Schindler T, Koller-Smith L, Lui K, Bajuk B, & Bolisetty S (2017). Causes of death in very preterm infants cared for in neonatal intensive care units: a population-based retrospective cohort study. BMC Pediatrics, 17. 10.1186/s12887-017-0810-3 [DOI] [PMC free article] [PubMed] [Google Scholar]
- Shevtsova NA, Marchenko V, & Bezdudnaya T (2019). Modulation of Respiratory System by Limb Muscle Afferents in Intact and Injured Spinal Cord. Frontiers in neuroscience, 13. 10.3389/fnins.2019.00289 [DOI] [PMC free article] [PubMed] [Google Scholar]
- Small M, Judd K, Lowe M, & Stick S (1999). Is breathing in infants chaotic? Dimension estimates for respiratory patterns during quiet sleep. Journal of Applied Physiology (Bethesda, Md.: 1985), 86(1), 359–376. 10.1152/jappl.1999.86.1.359 [DOI] [PubMed] [Google Scholar]
- Strogatz SH (2018). Nonlinear dynamics and chaos: with applications to physics, biology, chemistry, and engineering. CRC Press. [Google Scholar]
- Terrill PI, Edwards BA, Nemati S, Butler JP, Owens RL, Eckert DJ, White DP, Malhotra A, Wellman A, & Sands SA (2015). Quantifying the ventilatory control contribution to sleep apnoea using polysomnography. The European Respiratory Journal, 45(2), 408–418. 10.1183/09031936.00062914 [DOI] [PMC free article] [PubMed] [Google Scholar]
- Weintraub Z, Alvaro R, Mills S, Cates D, & Rigatto H (1994). Short apneas and their relationship to body movements and sighs in preterm infants. Biology of the Neonate, 66(4), 188–194. 10.1159/000244107 [DOI] [PubMed] [Google Scholar]
- Williamson JR, Bliss DW, Browne DW, Indic P, Bloch-Salisbury E, & Paydarfar D (2013). Individualized apnea prediction in preterm infants using cardio-respiratory and movement signals. 2013 IEEE International Conference on Body Sensor Networks, 1–6. 10.1109/BSN.2013.6575523 [DOI] [Google Scholar]
- Wu C-H, Chou H-C, Hsieh W-S, Chen W-K, Huang P-Y, & Tsao P-N (2003). Good estimation of arterial carbon dioxide by end-tidal carbon dioxide monitoring in the neonatal intensive care unit. Pediatric Pulmonology, 35(4), 292–295. 10.1002/ppul.10260 [DOI] [PubMed] [Google Scholar]
- Xie A, Wong B, Phillipson EA, Slutsky AS, & Bradley TD (1994). Interaction of hyperventilation and arousal in the pathogenesis of idiopathic central sleep apnea. American Journal of Respiratory and Critical Care Medicine, 150(2), 489–495. 10.1164/ajrccm.150.2.8049835 [DOI] [PubMed] [Google Scholar]
- Zhang Z, & Sternad D (2019). The primacy of rhythm: how discrete actions merge into a stable rhythmic pattern. Journal of Neurophysiology, 121(2), 574–587. 10.1152/jn.00587.2018 [DOI] [PMC free article] [PubMed] [Google Scholar]
- Zuzarte I, Gee AH, Sternad D, & Paydarfar D (2020). Automated movement detection reveals features of maturation in preterm infants. 2020 42nd Annual International Conference of the IEEE Engineering in Medicine & Biology Society (EMBC), 600–603. 10.1109/EMBC44109.2020.9176091 [DOI] [PubMed] [Google Scholar]
- Zuzarte I, Indic P, Sternad D, & Paydarfar D (2019). Quantifying Movement in Preterm Infants Using Photoplethysmography. Annals of biomedical engineering, 47(2), 646–658. 10.1007/s10439-018-02135-7 [DOI] [PMC free article] [PubMed] [Google Scholar]