

Abstract
Objective
This study evaluated associations between Fibroblast Growth Factor (FGF)-21, an adipokine associated with metabolic stress, and adverse longitudinal changes in body composition and physical functioning in patients with rheumatoid arthritis (RA).
Methods
At baseline and follow-up, RA patients, aged 18-70, completed whole-body Dual Energy Absorptiometry and peripheral quantitative CT to quantify lean mass, fat mass, and muscle density. Dynamometry assessed muscle strength at the hand and knee, and physical functioning was measured with the Health Assessment Questionnaire (HAQ) and the Short Physical Performance Battery (SPPB). FGF-21 and inflammatory cytokines were measured at baseline. Linear and logistic regression analyses assessed associations between FGF-21 levels and body composition and physical functioning over time.
Results
113 RA patients were enrolled, and 84 (74%) returned for follow-up at a median of 2.68 years. At baseline, FGF-21 was associated with age, smoking, methotrexate use, adiposity, and inflammatory cytokines: TNF-RI, YKL-40, VEGF, and resistin. The highest FGF-21 quartile was associated with worse SPPB and HAQ. Higher baseline FGF-21 levels (per 1 SD) were associated with worsening in muscle density and area z-scores [β=−0.056 (−0.12, 0.008), p=0.08; β=−0.049 (−0.10, 0.006), p=0.08] and a greater probability of a clinically meaningful worsening of HAQ [OR=2.37 (1.21, 4.64), p=0.01]. The fourth FGF-21 quartile was associated with worsening of SPPB [β=−0.57 (−1.04, −0.091), p=0.02].
Conclusion
FGF-21 levels are associated with obesity and inflammatory cytokines, and with worsening in physical functioning in RA. These data support the hypothesis that FGF-21 can identify patients at risk of functional decline.
Keywords: Rheumatoid arthritis, Body composition, Fibroblast growth factor 21, Disease activity, Biomarkers, Physical Functioning
Introduction
Rheumatoid arthritis (RA) can lead to changes in body composition, including muscle loss and excess adiposity (1, 2) which are in turn associated with physical disability (3–5). Given this link between body composition and long-term outcomes in RA, it is of interest to identify biomarkers that could help identify patients most at risk for developing progressive deficits in skeletal muscle and the ensuing loss of physical functioning.
Fibroblast growth factor-21 (FGF-21) is an adipokine in the FGF family that acts as an endocrine hormone and metabolic regulator. Although the exact targets of FGF-21 are still not well understood, there is evidence that FGF-21 plays an important role in the body’s metabolic stress response, which encompasses an array of physiologic responses to a diverse number of conditions that change the body’s metabolic demands, including fasting, malnutrition, obesity, amino acid deprivation, mitochondrial diseases, and exercise, among many others (6, 7). Indeed, FGF-21 levels are elevated in many of these physiologic states, including starvation, obesity, metabolic syndrome, insulin resistance, and exercise (8–15), and is also associated with age and is elevated in patients with end-stage renal disease, heart disease, fatty liver disease, and cachexia (16–18). Furthermore, FGF-21 is constitutively produced by skeletal muscle in times of stress, and high circulating FGF-21 levels have been associated with muscle stress conditions and mitochondrial disease (19). Given this link between FGF-21 and metabolic changes as well as muscle stress, FGF-21 could be a potential marker of inflammatory processes that lead to functional deficits in RA patients.
However, few studies have evaluated FGF-21 levels in patients with RA. One study found elevated FGF-21 levels in seropositive RA patients, but no correlations with measures of disease severity (20). Other studies have demonstrated that in mouse models of RA, exogenous FGF-21 may have a therapeutic effect (21, 22). However, evidence is limited, and the role of FGF-21 in RA is not clear. In order to address this knowledge gap, we conducted an analysis of a cohort of RA patients with comprehensive clinical data collected at two time points over 2-3 years of follow-up. We hypothesized that levels of FGF-21 at baseline would be associated with worsening muscle deficits (as measured through muscle density/area and muscle strength) and physical functioning outcomes over time.
Materials and Methods
Study Setting
The data collection methods for this study have been previously described (23). Briefly, RA subjects aged 18-70 years, with established disease and meeting 2010 American College of Rheumatology classification criteria, were recruited from the University of Pennsylvania and Philadelphia VA Medical Center Rheumatology practices (24). Subjects with Juvenile Idiopathic Arthritis (or another inflammatory arthritis), active cancer, a history of chronic diseases known to affect bone health, pregnancy, or who were unable to perform the muscle density or body composition assessments were excluded. The original pilot study was expanded to include a follow-up visit occurring 2-3 years later for most participants; 84 patients completed the study. The data collection procedures described below were conducted at both the initial visit and the follow-up visit. The protocols were approved by the Institutional Review Board at University of Pennsylvania and the Philadelphia Veterans Affairs Medical Center (approval number 01427 from the Corporal Michael J. Crescenz VA Medical Center Institutional Review Board) and informed consent was obtained from all participants.
Assessment of Anthropometries, Race, and Medical History
Weight and height were measured in light clothing and with shoes removed using a digital scale (Scaltronix, White Plains, NY) and stadiometer (Holtain Ltd., Crymych, UK), respectively. Body Mass Index (BMI) was calculated (weight/height2, kg/m2). Participants self-reported race (according to National Institute of Health categories), smoking status and comorbidities (cardiac disease and diabetes). Comorbidities were confirmed in the medical record.
Whole-body Dual-Energy Absorptiometry (DXA)
Subjects underwent whole-body DXA assessment using a Hologic densitometer (Delphi/Discovery Systems, Hologic, Inc., Bedford, MA) to measure appendicular lean mass, total fat mass, and visceral adipose tissue area (VAT). Similar to the adjustment of weight for height to estimate BMI, body composition estimates were adjusted for height2 to generate appendicular lean mass index (ALMI, kg/m2) and fat mass index (FMI, kg/m2). Measurement of VAT by DXA has been previously validated (25).
Peripheral Quantitative Computed Tomography (pQCT)
Muscle density and muscle area measurements in the left lower leg were obtained by pQCT (Stratec XCT2000 12-detector unit, Orthometrix, Inc.) with a voxel size of 0.4 mm, slice thickness of 2.3 mm, and scan speed of 25 mm/sec. All scans were analyzed with Stratec software version 6.00. Calf muscle and subcutaneous fat CSA (mm2) were assessed 66% proximal to the distal physis using threshold 40 mg/cm3 for fat/lean separation and 711 mg/cm3 for lean/bone separation. The pQCT measure of muscle density (mg/cm3) was used as a composite index of intra and extra-myocellular fat content, as previously described (26, 27). Edge-detection and threshold techniques were used to separate tissues (fat, muscle, and bone) based on attenuation characteristics that are directly related to tissue composition and density (28, 29). Images were filtered prior to being analyzed using contour mode 3 (−101 mg/cm3) to find skin, and peel mode 2 (40 mg/cm3) to separate adipose and muscle/bone, respectively. Images were filtered subsequently with a combination 3×3, and double 5×5 kernel image filter that clearly defined the edge of the muscle using contour mode 31 (40 mg/cm3). All bone was identified using a threshold of 150 mg/cm3 and mathematically removed to generate results for muscle density. In our laboratory, the coefficient of variation (CV) for short-term precision has ranged from 0.5 to 1.6% for pQCT outcomes.
Dynamometric Measurement of Muscle Strength
Muscle strength was assessed in several ways using Biodex Multi-Joint System 3 Pro Dynamometer (Biodex Medical Systems, Inc, Shirley, NY). Peak isokinetic torque (ft-lbs) was measured in triplicate at the knee and lower leg (ankle). For lower leg (ankle) biodex, we report strength as peak isometric torque (ft-lbs) in dorsiflexion (with the foot placed in 20 degrees of plantarflexion) as previously described (30). Peak isometric torque in flexion and extension at the knee was also reported (ft-lbs). Hand-grip strength (kg) was measured using a hand-grip dynamometer (Takei Scientific Instruments Co., Ltd., Japan). A clinically important decrease in hand grip strength has been previously defined as 6.5 kg, and a clinically meaningful change in leg extensor power in older adults has been defined as 9-10% (31, 32).
Assessments of Physical Function and Disability
Disability was assessed using the Health Assessment Questionnaire (HAQ), a widely used tool in RA. Briefly, eight categories are assessed including dressing and grooming, arising, eating, walking, hygiene, reach, and grip (33). The survey also includes questions about work status, symptoms, and overall health status. Physical function was assessed using the Short Physical Performance Battery (SPPB), a simple test to measure lower extremity function using tasks that mimic daily activities. It examines static balance, gait speed, and timed chair-raises (34). SPPB testing was initiated later and was therefore measured in a smaller sample of participants (N=69). Clinically important changes in HAQ and SPPB have been previously defined (35, 36). Based on these prior data, this study defined an important worsening of HAQ as an increase of ≥0.2 and an important worsening of SPPB as a decrease of ≥1.
Disease Measures, Inflammatory Markers, and Medical History
Medication use was determined by self-report and confirmed in the medical record. Erythrocyte Sedimentation Rate (ESR) was performed using the Westergren method. C-Reactive Protein (CRP) levels were measured using a Fixed Point Immuno Rate Assay. Creatinine was measured in the clinical laboratory and estimated glomerular filtration rate (eGFR) was determined using the Modification of Diet in Renal Disease equation. Disease activity was quantified using the DAS28 (CRP) and the M-DAS28 (37). The M-DAS28 is a composite measure that includes the CRP, swollen joint count and evaluator global score and has been validated to correlate strongly with synovitis on magnetic resonance imaging (MRI) and radiographic damage progression. It was included to avoid bias related to incorporation of the patient global score in the DAS28 (CRP), which is closely correlated with physical functioning scores (HAQ). Commercially-available Enzyme Linked Immunosorbent Assays (ELISA) from R&D Systems were used to measure FGF-21 (CV=2.4-3.4%) and Adiponectin (CV=3-5%). A V-Plex Plus Proinflammatory Panel 1 kit from Meso Scale Discovery was used to measure TNF, Interleukin (IL)-1, IL-6, and interferon gamma (IFN). The Vectra DA Multibiomarker Disease Activity (MBDA) test was used to measure levels of 12 serum markers: vascular cell adhesion molecule I (VCAM-I), epidermal growth factor (EGF), vascular endothelial growth factor (VEGF), IL-6, TNF receptor type I (TNF-RI), matrix metalloproteinase 1 (MMP-1), MMP-3, bone glycoprotein 39 (YKL-40), leptin, resistin, serum amyloid A (SAA), and CRP (Crescendo Bioscience, San Francisco, CA); the MBDA score, a validated test of RA activity, was also analyzed (38, 39). IL-6 was measured in both the Meso Scale Discovery kit and the Vectra MBDA test. The primary analysis used the value from the Vectra MBDA test (results were similar for both). Cytokine assays were run on serum samples stored at −80C that had never been previously thawed. X-rays of the hands and feet were performed, and van der Heidje-Sharp (vdHS) scores were determined by a trained radiologist (ET).
Statistical Analysis
Measures of muscle density and muscle area were converted to age, sex, and race-specific Z-Scores based on distributions among a reference population as has been previously described (2, 5, 40, 41). Z-Scores represent the number of standard deviations above or below the predicted value for a healthy control of the same age, sex, and race. Body composition (ALMI and FMI) measures were converted to Z-Scores relative to a national reference population [National Health and Nutrition Examination Survey].
FGF-21 levels at baseline were first log-adjusted to normalize the distribution, and then a standardized FGF-21 value was constructed from the log-adjusted values, with mean and standard deviation set to 0 and 1, respectively. The minimum measurable FGF-21 value was 31.3 pg/mL, so all measurements at this level and below were converted to 15.65 pg/mL for analysis (n=10). A similar procedure for standardization was used for other cytokines, adipokines, and inflammatory markers with a skewed distribution (specifically, IL-1, IL-6, IFN, TNF, ESR, CRP, Leptin, EGF, VEGF, SAA, MMP-1, MMP-3, TNF-RI, and YKL-40).
Associations between FGF-21 levels and demographics, disease characteristics, and other serum markers were first assessed using individual linear regression analyses at baseline. All variables found to be moderately associated with FGF-21 levels (p<0.20) were tested together in a multivariable model. A stepwise deletion process was then used to eliminate covariates with p>0.10. The final model included standard demographics (age, gender) and all variables with p<0.10 in the multivariable model after stepwise deletion. Table 2 lists all covariates tested and the variables included in the multivariable model.
Table 2.
Associations between FGF-21 levels and participant demographics and disease characteristics at baseline
| Univariate Model | Multivariable Model (N=111) | |||
|---|---|---|---|---|
| β (95% CI) | p | β (95% CI) | p | |
| Age (per 1 yr) | 0.019 (0.004, 0.034) | 0.01 | 0.014 (0.0005, 0.028) | 0.04 |
| Female | 0.002 (−0.37, 0.38) | 0.99 | 0.13 (−0.21, 0.46) | 0.46 |
| Black or African American | −0.053 (−0.45, 0.34) | 0.79 | -- | -- |
| BMI (per 1 kg/m2) | 0.043 (0.019, 0.066) | 0.001 | -- | -- |
| ALMI Z-Score (per 1 unit) | 0.15 (−0.026, 0.33) | 0.09 | -- | -- |
| FMI Z-Score (per 1 unit) | 0.25 (0.10, 0.40) | 0.001 | -- | -- |
| Visceral Fat Area (per 1 cm) | 0.006 (0.004, 0.009) | <0.001 | 0.006 (0.004, 0.008) | <0.001 |
| Diabetes | −0.029 (−0.62, 0.56) | 0.92 | -- | -- |
| Cardiac Disease | 0.59 (0.23, 0.95) | 0.001 | -- | -- |
| EGFR (per 1 unit) | −0.008 (−0.015, −0.0006) | 0.03 | -- | -- |
| Current Smoker | 0.45 (0.011, 0.88) | 0.05 | 0.37 (−0.021, 0.75) | 0.06 |
| M-DAS (CRP) | 0.087 (−0.068, 0.24) | 0.27 | -- | -- |
| DAS-28 (CRP) | 0.083 (−0.073, 0.24) | 0.29 | -- | -- |
| MBDA Score | 0.005 (−0.008, 0.018) | 0.46 | -- | -- |
| vdHS Score | −0.0007 (−0.005, 0.003) | 0.72 | -- | -- |
| RA Duration (per 1 yr) | 0.013 (−0.004, 0.029) | 0.14 | -- | -- |
| Current Methotrexate | −0.35 (−0.74, 0.037) | 0.08 | −0.45 (−0.80, −0.10) | 0.01 |
| Current Biologic | 0.016 (−0.36, 0.39) | 0.93 | -- | -- |
| Current Prednisone | 0.052 (−0.32, 0.43) | 0.79 | -- | -- |
Legend: FMI Z-score, waist circumference, and visceral fat area are all highly collinear, and therefore only visceral fat area was included because it was the most correlated with FGF-21. All other variables that were moderately associated (p<0.2) with FGF-21 were initially tested in the multivariable model. Variables remaining moderately significant (p<0.10) in the multivariate model were included in the final model, along with basic demographic characteristics (age, gender).
Associations between selected outcome measures at baseline (muscle density and area z-scores, strength outcomes, and physical functioning assessments) and FGF-21 levels at baseline were assessed using two linear regression models: one only adjusting for age and gender, and one also incorporating adjustments for important identified covariates. In each of these models, FGF-21 was tested as both a continuous and as a categorial variable (quartiles): comparing the highest quartile to all other quartiles. Models using muscle strength measures as outcomes included an adjustment for height.
To assess associations between FGF-21 and other known cytokines, adipokines, and inflammatory markers, linear regression analyses were performed at baseline between FGF-21 and each individual marker. These models were then tested including an adjustment for the previously identified covariates.
Linear regression analyses were conducted evaluating associations between baseline FGF-21 and per-year rates of change of each outcome measure over follow-up. Regression coefficients presented in tables represent the difference in the rate of change in outcome per year associated with a 1 SD higher FGF-21 level at baseline. To assess the clinical importance of these relationships, logistic regression models estimating the risk of clinically meaningful worsening in function, strength and imaging outcomes were also performed. In the primary analysis, we considered death as a worsening in these outcomes, however, we also performed sensitivity analyses where participants who died were excluded from the analysis.
Analyses were performed with STATA 15.1 (StataCorp, LP, College Station, TX). Since a Bonferroni correction for multiple comparisons was considered overly conservative in the context of related outcomes, we rather evaluated for consistency across analyses.
Results
Basic Characteristics and Description of Cohort
A total of 113 patients with RA were enrolled in the study and 84 patients (74%) returned for follow-up assessment, at a median time of 2.68 years (IQR: 2.30, 3.56). The baseline characteristics of the study cohort are shown in Table 1. Supplementary Table 1 compares characteristics of patients who completed the study to those who were lost to follow-up or died; patients who completed the study were on average younger, had higher FMI Z-scores, and had lower FGF-21 values than those who did not complete the study.
Table 1.
Basic characteristics of study participants, by FGF-21 Quartile at Baseline
| 1st Quartile | 2nd Quartile | 3rd Quartile | 4th Quartile | p | |
|---|---|---|---|---|---|
| N | 29 | 28 | 28 | 28 | |
| Age (yrs) | 49.7 (15.7) | 60.4 (8.5) | 54.8 (13.1) | 59.1 (8.9) | 0.004 |
| Female, N (%) | 17 (59%) | 13 (46%) | 11 (39%) | 18 (64%) | 0.23 |
| Black or African American, N (%) | 11 (38%) | 10 (36%) | 7 (25%) | 10 (36%) | 0.73 |
| Body Mass Index, (kg/m2) | 24.8 (5.0) | 28.2 (5.8) | 30.2 (7.6) | 32.1 (9.2) | 0.001 |
| ALMI Z-Score | −0.69 (0.94) | −0.23 (0.78) | 0.09 (0.74) | −0.10 (1.52) | 0.04 |
| FMI Z-Score | −0.71 (1.02) | −0.28 (1.29) | 0.07 (1.12) | 0.29 (1.20) | 0.01 |
| Visceral Fat Area (cm2) | 86.8 (49.0) | 129.4 (57.6) | 141.1 (61.7) | 180.3 (90.6) | <0.001 |
| Diabetes, N (%) | 2 (7%) | 5 (18%) | 3 (11%) | 3 (11%) | 0.63 |
| Cardiac Disease, N (%) | 8 (28%) | 15 (54%) | 14 (50%) | 22 (79%) | 0.002 |
| Prior MI, N (%) | 0 (0%) | 2 (7%) | 3 (11%) | 3 (12%) | 0.34 |
| Prior CABG, N (%) | 0 (0%) | 0 (0%) | 1 (4%) | 1 (4%) | 0.56 |
| Prior DVT, N (%) | 2 (7%) | 0 (0%) | 2 (7%) | 2 (7%) | 0.55 |
| Hypertension, N (%) | 8 (28%) | 12 (43%) | 14 (50%) | 22 (79%) | 0.001 |
| Peripheral Vascular Disease, N (%) | 0 (0%) | 0 (0%) | 2 (7%) | 1 (4%) | 0.27 |
| Prior Stroke, N (%) | 1 (3%) | 1 (4%) | 1 (4%) | 2 (7%) | 0.89 |
| Prior TIA, N (%) | 0 (0%) | 1 (4%) | 1 (4%) | 2 (7%) | 0.55 |
| EGFR (mL/min/1.73m2) | 102.2 (25.5) | 96.7 (26.6) | 97.4 (19.6) | 88.9 (28.7) | 0.27 |
| Current Smoker, N (%) | 4 (14%) | 4 (14%) | 10 (36%) | 8 (29%) | 0.13 |
| RA Disease Characteristics | |||||
| M-DAS (CRP) | 2.24 (1.08) | 2.35 (1.42) | 2.16 (1.19) | 2.60 (1.13) | 0.55 |
| DAS28 (CRP) | 3.09 (1.20) | 2.95 (1.31) | 2.99 (1.19) | 3.48 (1.07) | 0.33 |
| HAQ Score | 0.72 (0.61) | 0.64 (0.63) | 0.66 (0.59) | 1.12 (0.62) | 0.01 |
| SPPB | 12 (10, 12) | 11 (10, 12) | 11.5 (9, 12) | 9 (8, 11) | 0.02 |
| vdHS Score | 13.5 (3, 41) | 32 (6, 77) | 6 (2, 40) | 16.5 (6, 73) | 0.29 |
| Disease Duration, yrs | 5.9 (2.5, 15.1) | 11.0 (5.3, 21.0) | 7.1 (3.5, 16.1) | 5.2 (0.9, 26.0) | 0.57 |
| Current Methotrexate, N (%) | 23 (79%) | 18 (64%) | 18 (64%) | 16 (57%) | 0.34 |
| Current Biologic Therapy, N (%) | 18 (62%) | 13 (46%) | 11 (39%) | 16 (57%) | 0.31 |
| Current Prednisone, N (%) | 15 (52%) | 11 (39%) | 9 (32%) | 16 (57%) | 0.22 |
Abbreviations: ALMI= Appendicular Lean Mass Index; FMI= Fat Mass Index; RA= Rheumatoid Arthritis; DAS28(CRP)= Disease Activity Score of 28 joints including C-Reactive Protein; M-DAS= modified disease activity score; HAQ= Health Assessment Questionnaire; SPPB= Short Physical Performance Battery; vdHS= van der Heidje-Sharpe.
Legend: Results displayed as Mean(SD) or Median (IQR) for skewed data. Mean and SD of all Z-Scores in controls are 0 +/− 1, by definition. P values represent results of ANOVA, chi-squared, or Kruskal-Wallis tests.
Factors Associated with FGF-21 Levels at Baseline
Table 2 displays associations between FGF-21 levels and participant characteristics at baseline. In univariate models, older age, active smoking, cardiac disease, longer RA duration, greater BMI, and multiple measures of body fat (including FMI-Z, waist circumference, and visceral fat area) were all associated with greater FGF-21 levels. Higher EGFR and current methotrexate use were associated with lower FGF-21 levels. In multivariate models, only age, visceral fat area, methotrexate use, and current smoking remained moderately associated (p<0.1). None of the measures of RA disease activity or severity (specifically, M-DAS, DAS28(CRP), and vdHS score) were significantly associated with FGF-21 levels.
Associations between FGF-21 and several cytokines, adipokines, and inflammatory measures were also assessed at baseline. Figure 1 shows results of linear regression analyses; each coefficient on the graph shows the effect of a one-standard-deviation increase of each measure on standardized FGF-21 levels. Several markers, including TNF-RI, YKL-40, VEGF, and resistin were significantly and positively associated with FGF-21, both before and after adjusting for age, sex, visceral fat area, smoking status, and methotrexate use. Supplementary Table 3 contains numerical results for these analyses.
Figure 1.
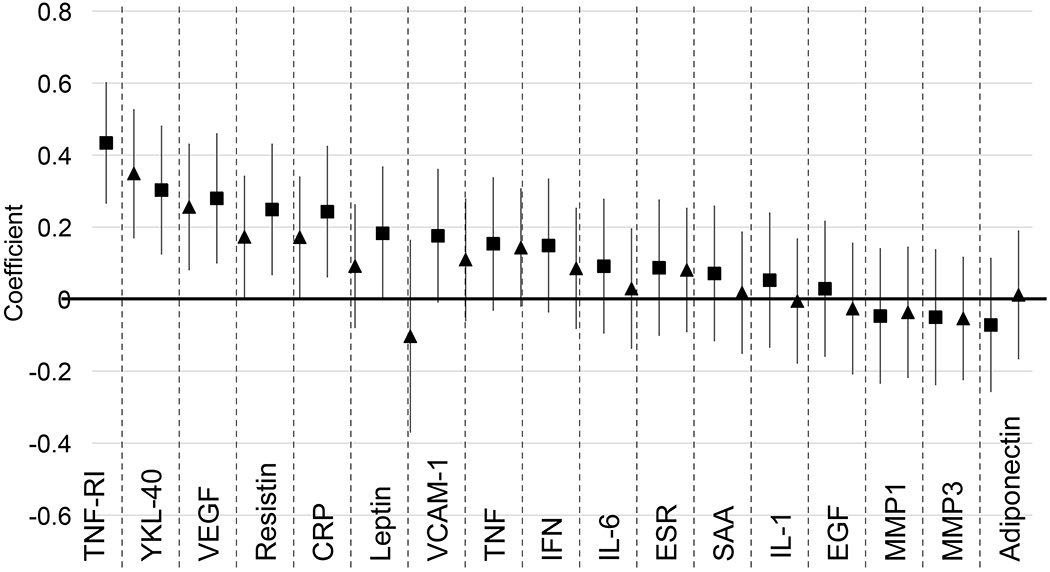
Association between Cytokines and Inflammatory Markers and FGF-21 Levels. Graph shows regression coefficients from models regressing FGF-21 levels on each factor. Bars show 95% CI. FGF-21 and all factor levels were converted to standardized scores to allow for direct comparisons. Right-hand coefficients (triangle) for each marker are adjusted for age, gender, visceral fat area, current smoking, and methotrexate use (all at baseline). N=106 (unadjusted model) and 104 (adjusted) for TNF-RI, YKL-40, VEGF, Resistin, CRP, Leptin, VCAM-1, IL-6, SAA, EGF, MMP1, and MMP3. N=111 (unadjusted model) and 109 (adjusted) for ESR. N=113 (unadjusted model) and 111 (adjusted) for TNF, IFN, IL-1, and Adiponectin.
Associations Between Baseline FGF-21 Levels and Muscle and Functional Outcomes
At baseline, after adjusting for age, gender, visceral fat area, current smoking, and methotrexate use, FGF-21 levels were not associated with skeletal muscle outcomes (specifically muscle density Z-score, muscle area Z-score, peak isometric torque in flexion and extension at the knee and hand grip strength). Over time, while there were modest associations noted between FGF-21 and the rates of decline of muscle density z-score [β=−0.056 (−0.12, 0. 008), p=0.08] and muscle area z-score [β=−0.049 (−0.10, 0.006), p=0.08], baseline FGF-21 levels were also largely not associated with changes in skeletal muscle outcomes (Table 3).
Table 3.
Associations Between FGF-21 Values and Muscle and Strength Parameters
| Effect on Outcome at Baseline | Effect on Rate of Change of Outcome | |||||
|---|---|---|---|---|---|---|
| β (95% CI) | P | N | β (95% CI) | P | N | |
| Muscle Density Z-Score | ||||||
| FGF-21 (Continuous) | −0.024 (−0.27, 0.22) | 0.84 | 105 | −0.056 (−0.12, 0.008) | 0.08 | 76 |
| FGF-21 in Top Quartile | 0.022 (−0.52, 0.56) | 0.94 | 105 | −0.074 (−0.20, 0.056) | 0.26 | 76 |
| Muscle Area Z-Score | ||||||
| FGF-21 (Continuous) | −0.019 (−0.32, 0.28) | 0.90 | 101 | −0.049 (−0.10, 0.006) | 0.08 | 70 |
| FGF-21 in Top Quartile | 0.072 (−0.59, 0.73) | 0.83 | 101 | −0.034 (−0.15, 0.081) | 0.55 | 70 |
| Peak Isometric Torque, Extension at Knee (ft-lbs) | ||||||
| FGF-21 (Continuous) | −1.40 (−7.61, 4.81) | 0.66 | 107 | −1.05 (−3.02, 0.92) | 0.29 | 72 |
| FGF-21 in Top Quartile | −4.93 (−18.57, 8.71) | 0.48 | 107 | −2.70 (−6.84, 1.43) | 0.20 | 72 |
| Peak Isometric Torque, Flexion at Knee (ft-lbs) | ||||||
| FGF-21 (Continuous) | −1.19 (−4.54, 2.15) | 0.48 | 107 | −1.64 (−3.54, 0.26) | 0.09 | 72 |
| FGF-21 in Top Quartile | −2.18 (−9.54, 5.19) | 0.56 | 107 | −0.13 (−4.24, 3.99) | 0.95 | 72 |
| Grip Strenqth (kq) | ||||||
| FGF-21 (Continuous) | −0.031 (−1.99, 1.93) | 0.98 | 108 | 0.10 (−0.62, 0.83) | 0.77 | 81 |
| FGF-21 in Top Quartile | −1.77 (−6.03, 2.50) | 0.41 | 108 | −1.39 (−2.79, 0.014) | 0.05 | 81 |
Legend: All models include adjustments for age, gender, visceral fat area, current smoking, and methotrexate use (all at baseline). Models involving strength outcomes (extension at knee, flexion at knee, and grip) also include an adjustment for height at baseline, β coefficients represent differences associated with a 1 SD higher FGF-21 level at baseline.
Adjusting for age, gender, visceral fat area, current smoking, and methotrexate use, a top-quartile FGF-21 value at baseline was associated with both HAQ score [β=0.34 (0.039, 0.63) p=0.03] and SPPB [β=−1.68 (−2.94, −0.41) p=0.01]. The highest quartile of FGF-21 was also associated with a significantly faster rate of decline in SPPB over time [β=−0.57 (−1.04, −0.091) p=0.02] (Table 4).
Table 4.
Associations Between FGF-21 Values and Functional Outcomes
| Effect on Outcome at Baseline | Effect on Rate of Change of Outcome | |||||
|---|---|---|---|---|---|---|
| β (95% CI) | P | N | β (95% CI) | P | N | |
| HAQ | ||||||
| FGF-21 (Continuous) | 0.068 (−0.073, 0.21) | 0.34 | 111 | 0.025 (−0.015, 0.064) | 0.22 | 83 |
| FGF-21 in Top Quartile | 0.34 (0.039, 0.63) | 0.03 | 111 | 0.034 (−0.045, 0.11) | 0.29 | 83 |
| SPPB | ||||||
| FGF-21 (Continuous) | −0.47 (−1.04, 0.10) | 0.11 | 68 | −0.14 (−0.37, 0.088) | 0.22 | 49 |
| FGF-21 in Top Quartile | −1.68 (−2.94, −0.41) | 0.01 | 68 | −0.57 (−1.04, −0.091) | 0.02 | 49 |
Legend: Models include adjustments for age, gender, visceral fat area, current smoking, and methotrexate use (all at baseline). β coefficients represent differences associated with a 1 SD higher FGF-21 level at baseline.
A higher FGF-21 level at baseline (per 1 SD) was associated with greater odds of a clinically meaningful worsening of HAQ score [OR=2.37 (1.21, 4.64) p=0.01], and tended towards an association with a greater risk of significant worsening of muscle density z-score [OR=1.76 (0.89, 3.47) p=0.10] and muscle area z-score [OR=1.85 (0.88, 3.89) p=0.11]. No association was seen with extension strength [OR=1.35 (0.77, 2.38) p=0.30], flexion strength [OR=1.37 (0.76, 2.49) p=0.30], grip strength [OR=1.42 (0.71, 2.85) p=0.32], and with risk of worsening of SPPB [OR=1.09 (0.42, 2.79) p=0.86]. All of these models included adjustments for age, sex, visceral fat area, smoking status, and methotrexate use. Figure 2 displays predicted probabilities of worsening in these outcomes by SD of FGF-21 level based on these models. Supplementary Table 4 displays results for the sensitivity analysis excluding patients who died; results are similar. Greater FGF-21 levels (per 1 SD) were also associated with a greater risk of death before follow-up [OR=3.14 (1.22, 8.07), p = 0.02] (unadjusted to avoid overfitting).
Figure 2.

- HAQ: increased by 0.2 (N=89)
- SPPB: decreased by 1 (N=51)
- Extension and flexion strength: decreased by 10% (N=78, 78)
- Grip strength: decreased by 6.5 kg (N=86)
- Muscle density and muscle area z-score: decreased by 0.5 (N=82, 76)
Discussion
To our knowledge, this is the first study evaluating longitudinal associations between FGF-21 and RA disease characteristics, obesity, skeletal muscle deficits, and physical functioning. We observed associations between FGF-21 and greater age, smoking, visceral adiposity, and elevations in inflammatory mediators including TNF-RI, YKL-40, VEGF, and resistin. This study also demonstrated associations between FGF-21 and poor physical functioning as well as deteriorations in functioning over several years. Overall, these observations support the hypothesis that FGF-21 is a potential marker of adverse inflammatory processes that could predict future functional declines in this population.
The baseline patient characteristics associated with FGF-21 levels are consistent with prior results derived from the general population. We observed that FGF-21 levels were highly associated with all measures of body fat in this study. In other populations, FGF-21 has been observed to be elevated in the contexts of obesity, metabolic syndrome, Type II Diabetes, hypertension, and atherosclerosis (10–15, 42). FGF-21’s associations with smoking, increased age, cardiac disease, and kidney disease have also been reported previously (42–45). Previous studies have reported associations with gender, but this was not observed in our study (43).
The observation that methotrexate use is associated with lower FGF-21 levels is novel. This could indicate that methotrexate works to ameliorate the inflammatory processes that lead to increases in serum FGF-21. Alternatively, metabolic obesity is a risk factor for elevations in liver enzymes among patients on methotrexate (46), which could have resulted in drug discontinuation in patients with high FGF-21 levels due to obesity. Further study will be needed to determine if methotrexate might have direct beneficial metabolic effects in RA.
At baseline, FGF-21 was not found to be associated with muscle density, muscle area, or with muscle strength. However, significant associations were found with measures of physical functioning, and elevated FGF-21 levels were associated with faster rates of decline in functioning. Additionally, while not all the longitudinal comparisons between FGF-21 and changes in muscle parameters were statistically significant in this small study, there was nevertheless remarkable consistency in the direction of the effects. These longitudinal models support the hypothesis that FGF-21 levels in RA patients are reflective of a metabolically-adverse profile that is associated with deteriorations in strength and physical functioning (47–50)
Notably, FGF-21 at baseline was not found to be associated with any standard composite measures of RA disease activity or severity (including M-DAS, DAS 28, vdHS score, and the Vectra MBDA score). This result indicates that the processes leading to elevated to FGF-21, and therefore the associations identified in this study, are not necessarily related to RA activity, at least as has been historically measured in clinic. However, FGF-21 was associated with several individual serum proteins (TNF-RI, YKL-40, VEGF, and resistin) included in the multi-biomarker disease activity (MBDA) assay, even after adjusting for age, gender, visceral fat area, methotrexate use, and smoking status (38, 39). The associations with these markers could suggest links between FGF-21 and various components of the RA disease process and may provide further evidence of an association with inflammatory stress not accounted for in many clinical measures of RA disease activity (including the MBDA composite score itself).
Although we believe this is the largest longitudinal study to-date evaluating the role of FGF-21 in RA, the small sample size limited the power to detect modest associations. While the results suggest that FGF-21 levels are associated with deteriorating physical function, larger studies will be needed to more accurately assess its prognostic value and identify levels at which FGF-21 represents a clinically significant risk of decline. Additionally, many patients died or were lost to follow-up, and patients who did complete the study were more likely to be younger, have a more normal FMI Z-score, and have a lower M-DAS. Therefore, given that the sickest patients may be more likely to be lost to follow-up, some of the patients with the highest FGF-21 and the biggest declines in functioning might have been lost, thereby underestimating the associations with FGF-21. Indeed, patients who either died or were lost to follow-up had significantly higher baseline FGF-21 than those who completed the study, driven by a very high FGF-21 average among patients who died. While this is an interesting result, the small sample size (only seven patients died) limited statistical power to evaluate for associations with cause-specific mortality. Finally, while this study adjusted for a wide variety of potential confounders, unobserved confounders may still be present.
Strengths of this study include the comprehensive array of disease measures and muscle quality, strength, and physical functioning assessments collected for each patient. These measurements allowed us to assess the effects of FGF-21 beyond its effect on typical measures of RA disease activity. Additionally, the longitudinal nature of the study allowed us to assess temporal relationships important for understanding the potential prognostic value of FGF-21.
In conclusion, factors associated with higher FGF-21 levels in RA include increased age, smoking, obesity, and methotrexate use, and associations with deteriorating physical functioning support the hypothesis that serum FGF-21 serves as a biomarker of adverse metabolic processes that can predict greater functional declines. This study builds upon existing research by demonstrating temporal relationships between FGF-21 and long-term functional changes in RA patients.
Supplementary Material
Acknowledgements
Dr. Baker would like to acknowledge the support of a Veterans Affairs Clinical Science Research & Development Career Development Award and Merit Award (IK2 CX000955; I01 CX001703). The contents of this work do not represent the views of the Department of the Veterans Affairs or the United States Government.
Sources of Support: This work (Dr. Baker) was supported by a Veterans Affairs Clinical Science Research and Development Career Development Award and VA Merit Award (IK2 CX000955, I01 CX001703), and by the University of Pennsylvania Clinical and Translational Research Center (UL1 RR024134). Research reported in this publication was supported by the National Center for Advancing Translational Sciences of the National Institutes of Health under award number UL1TR001878. The contents of this work do not represent the views of the Department of the Veterans Affairs or the United States Government.
Footnotes
Conflicts of Interest: The authors have no conflicts to disclose.
References
- 1.Walsmith J, Roubenoff R. Cachexia in rheumatoid arthritis. Int J Cardiol 2002;85:89–99. [DOI] [PubMed] [Google Scholar]
- 2.Baker JF, Von Feldt J, Mostoufi-Moab S, Noaiseh G, Taratuta E, Kim W, et al. Deficits in muscle mass, muscle density, and modified associations with fat in rheumatoid arthritis. Arthritis Care Res (Hoboken) 2014;66:1612–8. [DOI] [PMC free article] [PubMed] [Google Scholar]
- 3.Khoja SS, Moore CG, Goodpaster BH, Delitto A, Piva SR. Skeletal muscle fat and its association with physical function in rheumatoid arthritis. Arthritis Care Res (Hoboken) 2018;70:333–42. [DOI] [PMC free article] [PubMed] [Google Scholar]
- 4.Kramer HR, Fontaine KR, Bathon JM, Giles JT. Muscle density in rheumatoid arthritis: Associations with disease features and functional outcomes. Arthritis Rheum 2012;64:2438–50. [DOI] [PMC free article] [PubMed] [Google Scholar]
- 5.Baker JF, Giles JT, Weber D, Leonard MB, Zemel BS, Long J, et al. Assessment of muscle mass relative to fat mass and associations with physical functioning in rheumatoid arthritis. Rheumatology (Oxford) 2017;56:981–8. [DOI] [PMC free article] [PubMed] [Google Scholar]
- 6.Kliewer SA, Mangelsdorf DJ. A dozen years of discovery: Insights into the physiology and pharmacology of FGF21. Cell Metab 2019;29:246–53. [DOI] [PMC free article] [PubMed] [Google Scholar]
- 7.Kim KH, Lee M. FGF21 as a stress hormone: The roles of FGF21 in stress adaptation and the treatment of metabolic diseases. Diabetes Metab J. 2014;38:245–52. [DOI] [PMC free article] [PubMed] [Google Scholar]
- 8.Lewis JE, Ebling FJP, Samms RJ, Tsintzas K. Going back to the biology of FGF21: New insights. Trends Endocrinol Metab 2019;30:491–504. [DOI] [PubMed] [Google Scholar]
- 9.Gómez-Sámano MÁ, Grajales-Gómez M, Zuarth-Vázquez JM, Navarro-Flores MF, Martínez-Saavedra M, Juárez-León ÓA, et al. Fibroblast growth factor 21 and its novel association with oxidative stress. Redox Biol 2017;11:335–41. [DOI] [PMC free article] [PubMed] [Google Scholar]
- 10.Wang Y, Ye J, Cao Y, Zhang R, Liu Y, Zhang S, et al. Increased serum/plasma fibroblast growth factor 21 in type 2 diabetes mellitus: a systematic review and meta-analysis. Postgrad Med J 2019;95:134–9. [DOI] [PubMed] [Google Scholar]
- 11.Fisher FM, Chui PC, Antonellis PJ, Bina HA, Kharitonenkov A, Flier JS, et al. Obesity is a fibroblast growth factor 21 (FGF21)-resistant state. Diabetes 2010;59:2781–9. [DOI] [PMC free article] [PubMed] [Google Scholar]
- 12.Giralt M, Gavaldà-Navarro A, Villarroya F. Fibroblast growth factor-21, energy balance and obesity. Mol Cell Endocrinol 2015;418:66–73. [DOI] [PubMed] [Google Scholar]
- 13.Esfahani M, Baranchi M, Goodarzi MT. The implication of hepatokines in metabolic syndrome. Diabetes Metab Syndr 2019;13:2477–80. [DOI] [PubMed] [Google Scholar]
- 14.Woo YC, Lee CH, Fong CHY, Xu A, Tso AWK, Cheung BMY, et al. Serum fibroblast growth factor 21 is a superior biomarker to other adipokines in predicting incident diabetes. Clin Endocrinol (Oxf) 2017;86:37–43. [DOI] [PubMed] [Google Scholar]
- 15.Dushay J, Chui PC, Gopalakrishnan GS, Varela-Rey M, Crawley M, Fisher FM, et al. Increased fibroblast growth factor 21 in obesity and nonalcoholic fatty liver disease. Gastroenterology 2010;139:456–63. [DOI] [PMC free article] [PubMed] [Google Scholar]
- 16.Tezze C, Romanello V, Sandri M. FGF21 as modulator of metabolism in health and disease. Front Physiol 2019;10:419. [DOI] [PMC free article] [PubMed] [Google Scholar]
- 17.Franz K, Ost M, Otten L, Herpich C, Coleman V, Endres A, et al. Higher serum levels of fibroblast growth factor 21 in old patients with cachexia. Nutrition 2019;63-64:81–6. [DOI] [PubMed] [Google Scholar]
- 18.Praktiknjo M, Djayadi N, Mohr R, Schierwagen R, Bischoff J, Dold L, et al. Fibroblast growth factor 21 is independently associated with severe hepatic steatosis in non-obese HIV-infected patients. Liver Int 2019;39:1514–20. [DOI] [PubMed] [Google Scholar]
- 19.Ost M, Coleman V, Voigt A, van Schothorst EM, Keipert S, van der Stelt I, et al. Muscle mitochondrial stress adaptation operates independently of endogenous FGF21 action. Mol Metab 2016;5:79–90. [DOI] [PMC free article] [PubMed] [Google Scholar]
- 20.Hulejová H, Andrés Cerezo L, Kuklová M, Pecha O, Vondráček T, Pavelka K, et al. Novel adipokine fibroblast growth factor 21 is increased in rheumatoid arthritis. Physiol Res 2012;61:489–94. [DOI] [PubMed] [Google Scholar]
- 21.Yu D, Ye X, Che R, Wu Q, Qi J, Song L, et al. FGF21 exerts comparable pharmacological efficacy with Adalimumab in ameliorating collagen-induced rheumatoid arthritis by regulating systematic inflammatory response. Biomed Pharmacother 2017;89:751–60. [DOI] [PubMed] [Google Scholar]
- 22.Yu Y, Li S, Liu Y, Tian G, Yuan Q, Bai F, et al. Fibroblast growth factor 21 (FGF21) ameliorates collagen-induced arthritis through modulating oxidative stress and suppressing nuclear factor-kappa B pathway. Int Immunopharmacol 2015;25:74–82. [DOI] [PubMed] [Google Scholar]
- 23.Baker JF, Mostoufi-Moab S, Long J, Taratuta E, Leonard MB, Zemel B. Low muscle density is associated with deteriorations in muscle strength and physical functioning in rheumatoid arthritis. Arthritis Care Res (Hoboken) 2019. December 19 (E-pub ahead of print). [DOI] [PMC free article] [PubMed] [Google Scholar]
- 24.Aletaha D, Neogi T, Silman AJ, Funovits J, Felson DT, Bingham CO, et al. 2010 Rheumatoid Arthritis classification criteria: an American College of Rheumatology/European League Against Rheumatism collaborative initiative. Arthritis Rheum 2010;62:2569–81. [DOI] [PubMed] [Google Scholar]
- 25.Rothney MP, Xia Y, Wacker WK, Martin F, Beaumont M, Rezzi S, et al. Precision of a new tool to measure visceral adipose tissue (VAT) using dual-energy X-Ray absorptiometry (DXA). Obesity (Silver Spring) 2013;21:134. [DOI] [PubMed] [Google Scholar]
- 26.Farr JN, Funk JL, Chen Z, Lisse JR, Blew RM, Lee VR, et al. Skeletal muscle fat content is inversely associated with bone strength in young girls. J Bone Miner Res 2011;26:2217–25. [DOI] [PMC free article] [PubMed] [Google Scholar]
- 27.Lang T, Cauley JA, Tylavsky F, Bauer D, Cummings S, Harris TB. Computed tomographic measurements of thigh muscle cross-sectional area and attenuation coefficient predict hip fracture: The health, aging, and body composition study. J Bone Miner Res 2010;25:513–9. [DOI] [PMC free article] [PubMed] [Google Scholar]
- 28.Goodpaster BH, Kelley DE, Thaete FL, He J, Ross R. Skeletal muscle attenuation determined by computed tomography is associated with skeletal muscle lipid content. J Appl Physiol 2000;89:104–10. [DOI] [PubMed] [Google Scholar]
- 29.Kelley DE, Slasky BS, Janosky J. Skeletal muscle density: Effects of obesity and non-insulin-dependent diabetes mellitus. Am J Clin Nutr 1991;54:509–15. [DOI] [PubMed] [Google Scholar]
- 30.Wetzsteon RJ, Kalkwarf HJ, Shults J, Zemel BS, Foster BJ, Griffin L, et al. Volumetric bone mineral density and bone structure in childhood chronic kidney disease. J Bone Miner Res 2011;26:2235–44. [DOI] [PMC free article] [PubMed] [Google Scholar]
- 31.Kim JK, Park MG, Shin SJ. What is the minimum clinically important difference in grip strength? Clin Orthop Relat Res 2014;472:2536–41. [DOI] [PMC free article] [PubMed] [Google Scholar]
- 32.Kirn DR, Reid KF, Hau C, Phillips EM, Fielding RA. What is a clinically meaningful improvement in leg-extensor power for mobility-limited older adults? J Gerontol A Biol Sci Med Sci 2016;71:632–6. [DOI] [PMC free article] [PubMed] [Google Scholar]
- 33.Wolfe F, Michaud K, Pincus T. Development and validation of the health assessment questionnaire II: A revised version of the health assessment questionnaire. Arthritis Rheum 2004;50:3296–305. [DOI] [PubMed] [Google Scholar]
- 34.Corsonello A, Lattanzio F, Pedone C, Garasto S, Laino I, Bustacchini S, et al. Prognostic significance of the short physical performance battery in older patients discharged from acute care hospitals. Rejuvenation Res 2012;15:41–8. [DOI] [PMC free article] [PubMed] [Google Scholar]
- 35.Perera S, Mody SH, Woodman RC, Studenski SA. Meaningful change and responsiveness in common physical performance measures in older adults. J Am Geriatr Soc 2006;54:743–9. [DOI] [PubMed] [Google Scholar]
- 36.Pope JE, Khanna D, Norrie D, Ouimet JM. The minimally important difference for the health assessment questionnaire in rheumatoid arthritis clinical practice is smaller than in randomized controlled trials. J Rheumatol 2009;36:254–9. [DOI] [PubMed] [Google Scholar]
- 37.Baker JF, Conaghan PG, Smolen JS, Aletaha D, Shults J, Emery P, et al. Development and validation of modified disease activity scores in rheumatoid arthritis: Superior correlation with magnetic resonance imaging-detected synovitis and radiographic progression. Arthritis & Rheumatology (Hoboken, N.J.) 2014;66:794–802. [DOI] [PubMed] [Google Scholar]
- 38.Oderda GM, Lawless GD, Wright GC, Nussbaum SR, Elder R, Kim K, et al. The potential impact of monitoring disease activity biomarkers on rheumatoid arthritis outcomes and costs. Per Med 2018;15:291–301. [DOI] [PubMed] [Google Scholar]
- 39.Johnson TM, Register KA, Schmidt CM, O’Dell JR, Mikuls TR, Michaud K, et al. Correlation of the multi-biomarker disease activity score with rheumatoid arthritis disease activity measures: A systematic review and meta-analysis. Arthritis Care Res (Hoboken) 2019;71:1459–72. [DOI] [PMC free article] [PubMed] [Google Scholar]
- 40.Weber D, Long J, Leonard MB, Zemel B, Baker JF. Development of novel methods to define deficits in appendicular lean mass relative to fat mass. PLoS ONE 2016;11:e0164385. [DOI] [PMC free article] [PubMed] [Google Scholar]
- 41.Kelly TL, Wilson KE, Heymsfield SB. Dual energy X-Ray absorptiometry body composition reference values from NHANES. PLoS ONE 2009;4:e7038. [DOI] [PMC free article] [PubMed] [Google Scholar]
- 42.Chow WS, Xu A, Woo YC, Tso AWK, Cheung SCW, Fong CHY, et al. Serum fibroblast growth factor-21 levels are associated with carotid atherosclerosis independent of established cardiovascular risk factors. Arterioscler Thromb Vasc Biol 2013;33:2454–9. [DOI] [PubMed] [Google Scholar]
- 43.Kralisch S, Tonjes A, Krause K, Richter J, Lossner U, Kovacs P, et al. Fibroblast growth factor-21 serum concentrations are associated with metabolic and hepatic markers in humans. J Endocrinol 2013;216:135–43. [DOI] [PubMed] [Google Scholar]
- 44.Nakanishi K, Nishida M, Harada M, Ohama T, Kawada N, Murakami M, et al. Klotho-related molecules upregulated by smoking habit in apparently healthy men: A cross-sectional study. Sci Rep 2015;5:14230. [DOI] [PMC free article] [PubMed] [Google Scholar]
- 45.Suassuna PGA, de Paula RB, Sanders-Pinheiro H, Moe OW, Hu M. Fibroblast growth factor 21 in chronic kidney disease. J Nephrol 2019;32:365–77. [DOI] [PMC free article] [PubMed] [Google Scholar]
- 46.Mori S, Arima N, Ito M, Fujiyama S, Kamo Y, Ueki Y. Non-alcoholic steatohepatitis-like pattern in liver biopsy of rheumatoid arthritis patients with persistent transaminitis during low-dose methotrexate treatment. PLoS ONE 2018;13:e0203084. [DOI] [PMC free article] [PubMed] [Google Scholar]
- 47.George MD, Baker JF. The obesity epidemic and consequences for rheumatoid arthritis care. Curr Rheumatol Rep 2016;18:6. [DOI] [PMC free article] [PubMed] [Google Scholar]
- 48.Baker JF, Stokes A, Mikuls TR, George M, England BR, Sayles H, et al. Current and early life weight and associations with mortality in rheumatoid arthritis. Clin Exp Rheumatol 2019;37:768–73. [PubMed] [Google Scholar]
- 49.Wolfe F, Michaud K. Effect of body mass index on mortality and clinical status in rheumatoid arthritis. Arthritis Care Res (Hoboken) 2012;64:1471–9. [DOI] [PubMed] [Google Scholar]
- 50.Baker JF, George M, Baker DG, Toedter G, Von Feldt JM, Leonard MB. Associations between body mass, radiographic joint damage, adipokines and risk factors for bone loss in rheumatoid arthritis. Rheumatology (Oxford) 2011;50:2100–7. [DOI] [PubMed] [Google Scholar]
Associated Data
This section collects any data citations, data availability statements, or supplementary materials included in this article.