

Abstract
Background
Assessing the extent of lung involvement is important for the triage and care of COVID‐19 pneumonia. We sought to determine the utility of point‐of‐care ultrasound (POCUS) for characterizing lung involvement and, thereby, clinical risk determination in COVID‐19 pneumonia.
Methods
This multicenter, prospective, observational study included patients with COVID‐19 who received 12‐zone lung ultrasound and chest computed tomography (CT) scanning in the emergency department (ED). We defined lung disease severity using the lung ultrasound score (LUS) and chest CT severity score (CTSS). We assessed the association between the LUS and poor outcome (ICU admission or 30‐day all‐cause mortality). We also assessed the association between the LUS and hospital length of stay. We examined the ability of the LUS to differentiate between disease severity groups. Lastly, we estimated the correlation between the LUS and CTSS and the interrater agreement for the LUS. We handled missing data by multiple imputation with chained equations and predictive mean matching.
Results
We included 114 patients treated between March 19, 2020, and May 4, 2020. An LUS ≥12 was associated with a poor outcome within 30 days (hazard ratio [HR], 5.59; 95% confidence interval [CI], 1.26–24.80; P = 0.02). Admission duration was shorter in patients with an LUS <12 (adjusted HR, 2.24; 95% CI, 1.47–3.40; P < 0.001). Mean LUS differed between disease severity groups: no admission, 6.3 (standard deviation [SD], 4.4); hospital/ward, 13.1 (SD, 6.4); and ICU, 18.0 (SD, 5.0). The LUS was able to discriminate between ED discharge and hospital admission excellently, with an area under the curve of 0.83 (95% CI, 0.75–0.91). Interrater agreement for the LUS was strong: κ = 0.88 (95% CI, 0.77–0.95). Correlation between the LUS and CTSS was strong: κ = 0.60 (95% CI, 0.48–0.71).
Conclusions
We showed that baseline lung ultrasound ‐ is associated with poor outcomes, admission duration, and disease severity. The LUS also correlates well with CTSS. Point‐of‐care lung ultrasound may aid the risk stratification and triage of patients with COVID‐19 at the ED.
Keywords: COVID‐19, 30‐day mortality, ICU admission, lung ultrasound, pneumonia, point‐of‐care ultrasound, poor outcome
1. INTRODUCTION
1.1. Background
The main cause of morbidity and mortality in COVID‐19 is viral pneumonia, which can progress to acute respiratory distress syndrome. Proper evaluation of pulmonary involvement is critical for appropriate triage, risk stratification, and efficient allocation of medical resources. This is especially important since new, more contagious genetic variants are emerging on multiple continents—some with the ability to generate more reinfections—which could put additional stress on already overwhelmed acute care pathways. 1 Mounting evidence suggests that imaging studies such as computed tomography (CT) are helpful in the diagnosis of COVID‐19 pneumonia. Findings on CT may precede clinical symptoms, and the degree of pulmonary involvement can help predict patient outcome. 2 , 3 , 4 , 5 , 6 , 7 , 8 However, CT is expensive and cumbersome. CT scans can be difficult to perform on unstable patients, operation of CT equipment requires extra personnel, and unavailability and high costs can be an issue, even in high‐income countries. In addition, the risk of COVID‐19 transmission necessitates stringent desinfection protocols, and cleaning of the radiology suite may lead to increased delays between uses.
Point‐of‐care ultrasound (POCUS) of the lung might circumvent these issues. Lung ultrasound has diagnostic accuracy comparable to CT—and superior to chest radiography—in multiple aetiologies of respiratory failure, from pneumonia to acute respiratory distress syndrome. 9 , 10 , 11 , 12 , 13 , 14 , 15 Recent studies show that lung ultrasound also has better diagnostic accuracy than chest radiography in diagnosing COVID‐19 pneumonia. 18 , 19 Chest radiography is a poor diagnostic test in COVID‐19 as it may miss up to 40% of confirmed cases. 20 Meanwhile, diagnostic accuracy of lung ultrasound approaches that of CT for COVID‐19 pneumonia. 21 , 22 Lung ultrasound can safely exclude clinically relevant COVID‐19 pneumonia and may aid COVID‐19 diagnosis in high‐prevalence situations. 23 The advantages of lung ultrasound over CT include being fast to operate, simple to clean, low investment and operating costs, portable, and easily repeatable. With proper personal protective equipment, lung ultrasound can be safely performed at the bedside within 10 minutes. Because of its usefulness in diagnosis and follow‐up, lung ultrasound has become common practice, and even standard practice, in acute and critical care. 16 , 17
1.2. Goals of this investigation
The literature comparing the degree of pulmonary involvement between lung ultrasound and CT, along with literature detailing a lung ultrasound's ability to stratify patients and predict outcomes, is limited to only single‐center and/or retrospective studies. 16 , 17 , 24 , 25 In a recent meta‐analysis, the World Health Organization (WHO) recommended that the value of lung ultrasound regarding both clinical outcomes and duration of hospital stay should be investigated further because of inconclusive evidence. 26
1.3. Importance
To address this knowledge gap, we prospectively assessed the value of lung ultrasound during initial emergency department (ED) presentation in COVID‐19 risk stratification and prognostication. In addition, we also evaluated the correlation between lung ultrasound and CT results in quantifying lung involvement in patients with COVID‐19.
2. METHODS
2.1. Study design
We performed a multicenter prospective, observational study. The study was registered with The Netherlands Trial Register and approved by the local medical ethical committees.
2.2. Setting
We conducted the study in the following 3 large university hospitals in The Netherlands: the Radboud University Medical Center in Nijmegen, the Vrije Universiteit Medical Center in Amsterdam, and the Academic Medical Center in Amsterdam. They have 1065, 733, and 1002 beds, respectively. Each hospital has ≈30,000 ED visits per year.
2.3. Participants
Patients were recruited between March 19, 2020, and May 4, 2020. Inclusion criteria were presentation at the ED for acute internal medicine, presence of a certified sonographer, confirmed COVID‐19, and lung ultrasound and chest CT performed within 24 hours of presentation. Exclusion criteria were either no verbal consent and/or uninterpretable CT or lung ultrasound (Figure 1).
FIGURE 1.
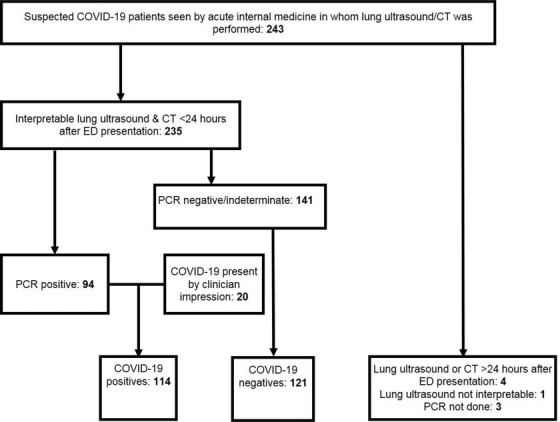
Study population flowchart. CT, computed tomography; ED, emergency department; PCR, polymerase chain reaction
Per hospital procedure, all patients received a standard medical work‐up (history, physical examination, common observations, and routine laboratory tests) and a SARS‐CoV‐2 polymerase chain reaction (PCR) test. Clinical criteria for ward admission were oxygen saturation <94% (need for conventional supplemental oxygen) and/or respiratory rate >20/minute. ICU admission criteria were either deterioration despite conventional respiratory support or need for mechanical ventilation.
2.4. Lung ultrasound
Lung ultrasound was performed or supervised by acute internal medicine physicians who are both certified in POCUS and had an Entrustable Professional Activity level of at least 4. The Entrustable Professional Activity concept has competency‐based education targets to guarantee that all learners have a sufficient level of proficiency when they reach the required Entrustable Professional Activity level. Increasing levels of entrustment range from level 1 (not trusted to perform POCUS even under direct supervision) to level 4 (entrusted to use POCUS independently) and level 5 (engagement in POCUS education and research). 27 We predominantly used handheld systems, with settings amenable to the detection of B‐line artefacts. 28 The scanning physician was blinded for the PCR and CT results, but not for the clinical picture.
The Bottom Line.
While correlated with the presence of pneumonia, the association of lung ultrasonography with the clinical outcomes of COVID‐19 has not been studied. In this study of 114 patients with COVID‐19 from 3 large university hospitals in The Netherlands, the extent of lung ultrasonography (quantified by the Lung Ultrasound Scale) was associated with important clinical outcomes, including ICU admission and 30‐day mortality. Lung ultrasonography may provide an important tool for assessing the prognosis of patients with COVID‐19.
The lung ultrasound protocol consisted of a structured assessment of 6 zones of each hemithorax (Figure 2). Each zone was scored according to the same lung ultrasound score (LUS) classification system used in intensive care, acute respiratory distress syndrome, and recent COVID‐19 literature. 15 , 16 , 21 , 24 , 29 , 30 This system scores zones from 0 (well aerated) to 3 (consolidated) (Figure S1). The total LUS sums the scores from all 12 zones, creating a final score range from 0 (all regions are well aerated) to 36 (all regions are consolidated).
FIGURE 2.

Lung ultrasound protocol and zones of assessment. A 12‐zone scanning approach was used in which the lungs were scanned in a lawn‐mower fashion. This figure shows the 6 scan zones on the right hemithorax. (A) Anterior: Z1 anterior upper zone, Z2 anterior lower zone; (B) lateral: Z3 lateral axilla zone, Z4 lateral lower zone; (C) posterior: Z5 posterior upper zone, Z6 posterior lower zone. Red line illustrates the “lawn mower” scanning technique. Each rib space is evaluated to minimize the risk of missing abnormalities. AAL, anterior axillary line; PAL, posterior axillary line
2.5. Computed tomography
Local radiologists assessed the chest CTs using the COVID‐19 Reporting and Data System (CO‐RADS). 2 , 31 , 32 , 33 The CO‐RADS uses a scale from 1 (very low) to 5 (very high) to indicate the likelihood of COVID‐19 pneumonia. To quantify pulmonary involvement, every CT is graded according to the CT severity score (CTSS), when COVID‐19 pneumonia is suspected (ie, CO‐RADS 3 and higher). 34 The CTSS is a visual assessment of the percentage of disease involvement in each lobe (Table S1). The total CTSS is the sum of the individual lobar scores and can range from 0 (no involvement) to 25 (maximum involvement). The radiologists were blinded for lung ultrasound and PCR results, but not for clinical information.
2.6. COVID‐19 diagnosis
The diagnosis of COVID‐19 was established by a positive PCR test result (from a nasopharyngeal, oropharyngeal, sputum, or broncho‐alveolar lavage sample) or by a clinician impression after alternative diagnoses was excluded. In patients with high clinical suspicion but negative PCR, a multidisciplinary team of hospital clinicians determined the presence of COVID‐19 on the basis of clinical, laboratory, microbiological, and/or CT data and only after excluding alternative diagnoses. Use of clinician impression as a reference is in line with WHO recommendations because of the suboptimal sensitivity of the PCR test. 26 The multidisciplinary team is composed of specialists in infectious disease, respiratory disease, and microbiology and discusses all admitted (suspected) COVID‐19 cases in a daily plenary meeting. The team did not use lung ultrasound in the determination of COVID‐19 presence.
2.7. Outcomes
The primary outcome was poor COVID‐19 outcome, defined as the composite endpoint of 30‐day all‐cause mortality or ICU admission. Secondary outcomes included hospital length of stay (days) and disease severity groups (ED discharge, hospital ward admission, ICU admission).
2.8. Statistical analysis
We used Kaplan‐Meier curves and Cox proportional hazards regression to assess the relationship between the LUS and time to poor outcome (a composite endpoint of 30‐day all‐cause mortality or ICU admission) and admission duration. We dichotomized the LUS using the median. We tested the proportional hazards assumption by checking that the Kaplan‐Meier curves do not cross and the log minus log curves run parallel. We assessed linearity for continuous variables by dividing them in tertiles and checking whether β coefficients systematically increase or decrease with increasing categories.
We reported hazard ratios (HRs; adjusted for any confounders if applicable) as effect size for the dichotomized LUS used in the Kaplan‐Meier curves as well as for each per‐point increase in the LUS separately. We considered the following variables as potential confounders for a relation between the LUS and outcome: duration of symptoms, age, sex, and comorbidities (chronic obstructive pulmonary disease, cardiovascular disease, hypertension, and diabetes mellitus). 2 We examined confounders separately to keep within the rule of 5–10 events per variable. We used a 10% change in the LUS β coefficient as confounder threshold. 35 We estimated a multivariate model, when allowed by the events‐per‐variable rule, in which we adjusted for all confounders identified.
We compared differences between the following 3 disease severity grades: (1) mild, no admission/ED discharge; (2) moderate, hospital/ward admission; and (3) severe, ICU admission. We also compared means and proportions between these groups by 1‐way analysis of variance (ANOVA), chi‐square test, Fisher exact test, or Kruskal‐Wallis test as appropriate. We used the Tukey honestly significant difference (HSD) post hoc test to compare pairs of severity grades.
We determined the ability of the LUS to discriminate between disease severity by comparing receiver operating characteristic (ROC) curves. We determined the optimal cutoff with the Youden index. We also reported sensitivity, specificity, positive likelihood ratio, negative likelihood ratio, and diagnostic odds ratio. 36 , 37 , 38 A diagnostic odds ratio of >10 is considered good. 39
We also used a “gray zone” approach. 40 This method allows the binary constraint of a “black or white” decision to be avoided, which is often inappropriate for clinical or screening practice. Instead, our approach constructs a 3‐zone division for quantitative tests and purposefully includes a gray zone of inconclusive test results. In this case, we used a negative likelihood ratio of 0.1 and 0.2 and a positive likelihood ratio of 10 and 5 for the cutoffs of the gray zone. At these likelihood ratios, the approximate posttest change in probability is ∼45% (large change) or ∼30% (moderate change). 41
We employed multiple imputation by chained equations with predictive mean matching to account for any missing data, assuming a missing‐at‐random pattern. We pooled effect estimates from the imputation data sets using Rubin's rules. We generated m = 10 imputed data sets, because of ≈5%–10% missing data. 42 We used all patient characteristics, laboratory values, and radiological information mentioned in Table 1 and Table S2 with ≤30% missing data for imputation. We compared descriptives (eg, means and standard deviations [SDs]) of the imputation model with the original data to make sure all imputed values were plausible. We conducted a sensitivity analysis by also performing a complete case analysis. 35
TABLE 1.
Clinical characteristics of patients with COVID‐19 undergoing lung ultrasonography
| All patients, 114 | No admission, 24 | Ward admission, 78 | ICU admission, 12 | P value | Missing data, % | |
|---|---|---|---|---|---|---|
| Patient characteristics | ||||||
| Age, median (IQR) | 63 (51,5‐74) | 57.5 (37‐72) | 67 (53‐75) | 61.5 (50,75‐67) | 0.07 | 0 |
| Male, n (%) | 67 (57.9) | 16 (66.7) | 41 (52.6) | 9 (75) | 0.24 | 0 |
| 30‐day mortality, n (%) | 7 (6.1) | 0 (0) | 5 (6.4) | 2 (16.7) | 0.14 | 0 |
| 90‐day mortality, n (%) | 11 (9.6) | 0 (0) | 7 (9) | 4 (33.3) | 0.008 | 0 |
| Symptom days, median (IQR) | 7 (4‐10) | 7 (5‐10) | 7 (3‐10) | 6.5 (5.25‐8.5) | 0.81 | 0 |
| Length of stay, median (IQR) | 4 (1‐8) | 0 (0‐0) | 5 (2‐7) | 33 (14.25‐65.75) | <0.001 | 0 |
| Symptoms, n (%) | ||||||
| Fever | 83 (71.9) | 21 (87.5) | 52 (66.7) | 9 (75) | 0.14 | 0 |
| Cough | 92 (79.8) | 21 (87.5) | 61 (78.2) | 9 (75) | 0.58 | 0 |
| Dyspnea | 75 (65.8) | 13 (54.2) | 52 (66.7) | 10 (83.3) | 0.23 | 0 |
| Abdominal symptoms | 45 (39.5) | 10 (41.7) | 30 (38.5) | 5 (41.7) | 0.96 | 0 |
| Comorbidities, n (%) | ||||||
| Cardiovascular disease | 22 (19.3) | 6 (25) | 15 (19.2) | 1 (8.3) | 0.53 | 0 |
| Chronic obstructive pulmonary disease | 14 (12.3) | 3 (12.5) | 10 (12.8) | 1 (8.3) | 1.00 | 0 |
| Hypertension | 36 (31.6) | 7 (29.2) | 24 (30.8) | 5 (41.7) | 0.70 | 0 |
| Diabetes mellitus | 25 (21.9) | 7 (29.2) | 15 (19.2) | 3 (25) | 0.53 | 0 |
| Obesity | 35 (30.7) | 7 (29.2) | 23 (29.5) | 5 (41.7) | 0.94 | 0 |
| Malignancy | 13 (11.4) | 4 (16.7) | 7 (9) | 2 (16.7) | 0.33 | 0 |
| Vital signs | ||||||
| MEWS, median (IQR) | 2 (1‐4) | 2 (0‐2.75) | 2.5 (1‐3.25) | 5.5 (4‐6.75) | <0.001 | 0 |
| Systolic blood pressure, mean (SD) | 133 (19) | 136 (22) | 132 (18) | 132 (22) | 0.74 | 0.88 |
| Heart rate, mean (SD) | 88 (16) | 91 (15) | 86 (14) | 98 (25) | 0.042 | 0 |
| Respiratory rate, mean (SD) | 21 (7) | 18 (5) | 21 (6) | 30 (10) | <0.001 | 3.5 |
| Temperature, mean (SD) | 37.7 (1.1) | 37.6 (0.7) | 37.8 (1.2) | 37.5 (1.4) | 0.64 | 0.88 |
| Oxygen saturation, median (IQR) | 96 (94‐98) | 97.5 (96‐99) | 95.5 (94‐97) | 92.5 (88.5‐96) | 0.002 | 0 |
| Liters of oxygen, median (IQR) | 0 (0‐3) | 0 (0‐0) | 0 (0‐3) | 4.5 (0.75‐5) | <0.001 | 17.51 |
| Laboratory results | ||||||
| Hemoglobin, mmol/L, mean (SD) | 8.1 (1.1) | 8.3 (1.3) | 8.1 (1.0) | 8.5 (1.6) | 0.44 | 0.88 |
| Neutrophils, ×109/L, mean (SD) | 4.7 (2.7) | 3.4 (1.9) | 5.0 (2.7) | 6.1 (3.4) | 0.010 | 7.02 |
| Lymphocytes, ×109/L, mean (SD) | 0.97 (0.58) | 0.98 (0.59) | 0.95 (0.49) | 1.1 (0.99) | 0.80 | 7.02 |
| Lactate dehydrogenase, U/L, mean (SD) | 313 (104) | 232 (60) | 316 (90) | 460 (106) | <0.001 | 9.65 |
| CRP, mg/L, median (IQR) | 60 (29‐118) | 26.4 (8.25‐53.5) | 60 (32‐126) | 102.5 (65.025‐160.5) | <0.001 | 0.88 |
| Creatinine, μmol/L, median (IQR) | 80 (60‐100) | 77 (66.75‐102.5) | 81 (58‐100) | 80.5 (64‐126) | 0.78 | 2.63 |
| d‐dimer, mg/L, median (IQR) | 1.02 (0.745‐1.82) | 0.56 (0.4625‐0.8575) | 1.09 (1.01‐4.6) | 1.01 (0.8075‐1.47) | 0.03 | 81.58 |
| Hs troponin T, ng/L, median (IQR) | 0.015 (0.007‐0.027) | 0.015 (0.004‐0.0225) | 0.016 (0.0065‐0.2550) | 0.045 (0.01050‐4.11200) | 0.24 | 58.77 |
| Imaging scores | ||||||
| LUS, mean (SD) | 12.2 (6.8) | 6.3 (4.4) | 13.1 (6.4) | 18.0 (5.0) | <0.001 | 6.14 |
| CT severity score, mean (SD) | 9.3 (5.0) | 4.8 (2.9) | 9.9 (4.8) | 13.3 (3.8) | <0.001 | 4.39 |
CRP, C‐reactive protein; CT, computed tomography; Hs, high‐sensitivity IQR, interquartile range; LUS, lung ultrasound score; MEWS, modified early warning score; SD, standard deviation.
We quantified the correlation between the LUS and CTSS with the Pearson correlation coefficient. We assessed interobserver agreement for the LUS by means of the intraclass correlation coefficient (ICC) with a 2‐way random effects model. A total of 3 sonographers with different levels of experience (Entrustable Professional Activity levels 3, 4, and 5) measured the LUS in a random sample of 20 patients. We used a 2‐sided significance level of 5% for all analyses. We performed all analyses as well as the multiple imputation in SPSS version 26.0.
3. RESULTS
A total of 114 patients were included in the study, and data were collected between March 19, 2020, and May 4, 2020 (Figure 1). After initial intake at the ED, 24 patients were discharged home, 79 were admitted to the ward, and 12 required ICU admission (see Table 1 for patient demographics and clinical characteristics according to disease severity group.) A median of 12 lung ultrasound zones were recorded for each patient. Of the patients, 7 (6.1%) had missing zones, but all patients included had at least 6 zones scanned. CTSS data were missing for 5 patients (4.4%).
3.1. Associations between the LUS and patient outcomes
There were 17 poor outcome events (14.9%) within 30 days. Time to poor outcome was shorter in the group with an LUS ≥12 compared with the group with an LUS <12. None of the potential confounders altered the association between the LUS and poor outcome. We found an HR of 5.59 (95% confidence interval [CI], 1.26–24.80; P = 0.023) in the imputed data set, with a comparable result in the complete case analysis (Table 2, Figure 3).
TABLE 2.
Associations between lung ultrasound and poor outcomes in patients with COVID‐19
| Model | HR (95% CI) | P value |
|---|---|---|
| Lung ultrasound score, dichotomized at median: 12 a | ||
| °Complete case | 5.49 (1.24–24.34) | 0.03 |
| °Imputed | 5.59 (1.26–24.80) | 0.02 |
| Lung ultrasound score, continuous b | ||
| °Complete case | 1.11 (1.03–1.21) | 0.01 |
| °Imputed | 1.12 (1.04–1.21) | 0.004 |
We report crude (unadjusted) HRs as no confounders were identified. Poor outcome is defined as the composite endpoint of 30‐day all‐cause mortality or ICU admission. CI, confidence interval; HR, hazard ratio.
Lung ultrasound score <12 is the reference category.
HR for poor outcome per point increase in Lung ultrasound score.
FIGURE 3.
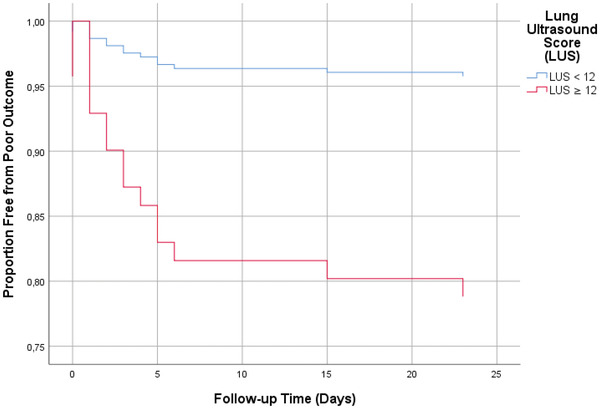
Kaplan‐Meier curve for the association between the lung ultrasound score (LUS) and poor COVID‐19 outcomes. Kaplan‐Meier curves are based on complete case analysis. Poor outcome was defined as ICU admission or death at 30 days. The LUS was dichotomized at the median of 12
Hospital length of stay was longer among patients with an LUS ≥12 (Table 3, Figure 4). We found a crude HR of 1.98 (95% CI, 1.34–2.93; P = 0.001). Correcting for confounders led to an increase in the adjusted HR of 2.24 (95% CI, 1.47–3.40; P < 0.001). Analyses on the imputed data set and the complete analysis yielded similar results.
TABLE 3.
Associations between lung ultrasound and COVID‐19 time to hospital discharge
| Model | HR (95% CI) | P value |
|---|---|---|
| Lung ultrasound score, dichotomized at median: 12 a | ||
| °Complete case (crude) | 2.02 (1.35–3.00) | 0.001 |
| °Complete case (adjusted) | 2.46 (1.58–3.85) | <0.001 |
| °Imputed (crude) | 1.98 (1.34–2.93) | 0.001 |
| °Imputed (adjusted) | 2.24 (1.47–3.40) | <0.001 |
| Lung ultrasound score, continuous | ||
| °Complete case (crude) | 1.06 (1.04–1.09) | <0.001 |
| °Complete case (adjusted) | 1.07 (1.04–1.11) | <0.001 |
| °Imputed (crude) | 1.05 (1.02–1.09) | <0.001 |
| °Imputed (adjusted) | 1.06 (1.03–1.10) | <0.001 |
We report crude and adjusted HR. Only duration of symptoms was a significant confounder. CI, confidence interval; HR, hazard ratio.
Lung ultrasound score ≥12 is the reference category.
FIGURE 4.
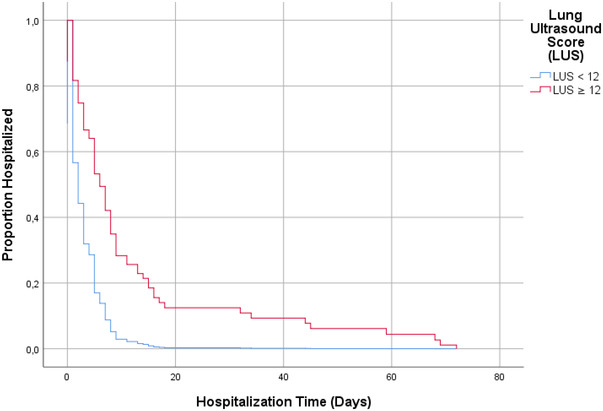
Kaplan‐Meier curve for association between the lung ultrasound score (LUS) and time to discharge. Kaplan‐Meier curves are based on complete case analysis. The LUS was dichotomized at the median of 12
3.2. Differences between disease severity groups
There was a statistically significant difference in mean LUS between the disease severity grades (mild, no admission; moderate, ward admission; and severe, ICU admission) as determined by 1‐way ANOVA (P < 0.001) (see end of Table 1). The mean LUS data were 6.3 (SD, 4.4), 13.1 (SD, 6.4), and 18.0 (SD, 5.0), respectively. Tukey HSD post hoc tests for pairwise comparisons revealed significant differences in mean LUS for all pairs of groups.
3.3. Discriminative ability
The AUC of the ROC curve that depicts the ability of the LUS to discriminate between hospital admission (ward and ICU combined) and no admission was 0.83 (95% CI, 0.75–0.91), which was almost identical to the CTSS (Figure 5, Figure S1). The optimal cutoff was 12, with a sensitivity of 70.2%, a specificity of 91.3%, and a diagnostic odds ratio of 24.8.
FIGURE 5.
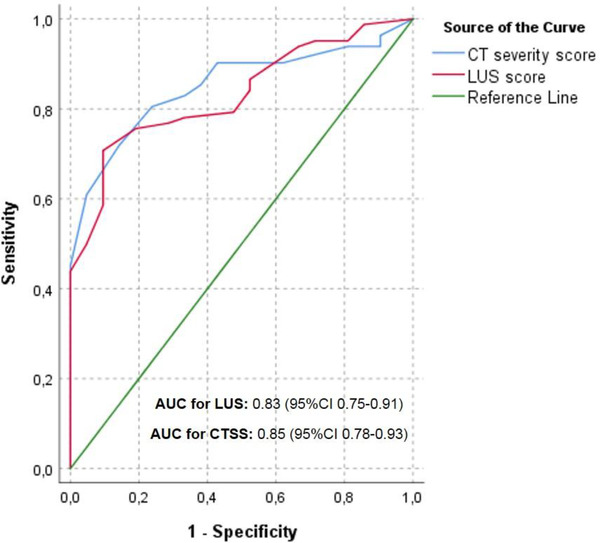
Receiver operating characteristic curves for associations between the LUS, CTSS, and in‐hospital admission. AUC, area under the curve; CTSS, CT severity score; LUS, lung ultrasound score
Gray zone analysis with a high LR cutoff (ie, negative likelihood ratio of 0.1 and positive likelihood ratio of 10) showed that patients with an LUS ≤1 (ie, LUS showing almost no signs of pulmonary involvement) could be discharged from the ED. We found that patients with an LUS ≥15 almost certainly required admission (Figure 6A). The gray zone (inconclusive test zone) contained 55.3% of patients. If we reduce the cutoff to a negative likelihood ratio of 0.2 and a positive likelihood ratio of 5, the number of patients within the gray zone decreases to 30.7% (Figure 6B). Patients with an LUS ≥11 had a posttest increase in admission probability of 30%. A total of 5 patients were admitted for reasons not related to the COVID‐19 diagnosis, including only 1 patient without any abnormalities on the LUS and 4 patients without any CT abnormalities. In fact, all patients with an LUS <3 did not require any supplemental oxygen.
FIGURE 6.
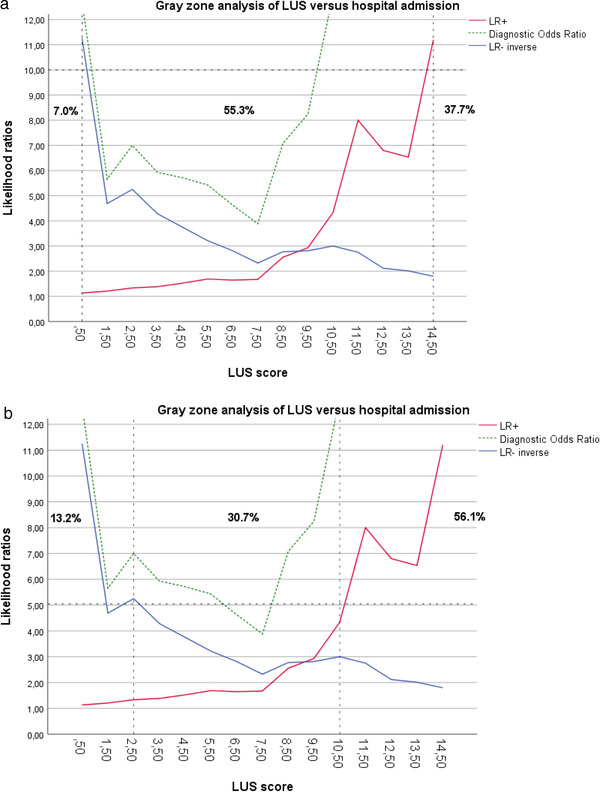
(A) Gray zone analysis: LUS versus hospital admission— likelihood ratio cutoff = 10. (B) Gray zone analysis: LUS versus hospital admission— likelihood ratio cutoff = 5. LR+, positive likelihood ratio; LR‐, negative likelihood ratio; LUS, lung ultrasound score
3.4. Correlation between the LUS and CTSS
We found a strong positive association between the LUS and CTSS, with a Pearson correlation coefficient of 0.60 (95% CI, 0.48–0.71). The interrater agreement for the LUS was excellent, with an ICC of 0.88 (95% CI, 0.77–0.95).
3.5. Limitations/bias
Our study has several limitations. First, although we included consecutive patients when a certified sonographer was present, we could not include every patient who tested positive for COVID‐19. However, we tried to enroll every eligible patient when a certified sonographer was present, therefore minimizing any possible selection bias. We therefore feel that these omissions have not influenced our results. We look forward to seeing these results corroborated in different settings. Second, the wide CIs of the HRs in the poor outcome analysis are an indication of the imprecision of the estimate. This is most likely attributed to the relatively small sample size. Our results should, therefore, be confirmed in a larger study. Third, we also included patients who were diagnosed on the basis of a multidisciplinary team decision. However, the results do not differ between the PCR‐positive and the combined PCR/multidisciplinary team–positive groups. Fourth, we tried to minimize incorporation bias by blinding the radiologists and scanning physicians to each other's results. However, they were aware of the patients’ clinical parameters. Although this may have caused an upward adjustment of the LUS and CTSS in patients who were sicker and vice versa in patients who were less sick, we would have expected this to apply to CT and the LUS to the same degree. Moreover, blinding them entirely from the patient's clinical information was not desirable as this does not reflect daily practice.
4. DISCUSSION
To our knowledge, this is the first multicenter study to prospectively compare the correlation between the LUS and CTSS in COVID‐19 and assess the ability of the LUS to discriminate COVID‐19 pneumonia disease severity and its association with prognosis.
Our results show that COVID‐19 pulmonary involvement quantified by the semiquantitative LUS is strongly correlated with the pulmonary involvement assessed by CT. An increasing LUS is also positively associated with disease severity. This is consistent with other findings on viral pneumonias and acute respiratory distress syndrome 15 , 30 as well as recent retrospective data in COVID‐19. 16 , 24 , 43 The WHO and Fleischner Society agree that imaging studies should be considered in the triage and management of patients, especially in resource‐constrained environments (eg, no immediate PCR results) and in patients with at least moderate disease. 26 , 44 Although CT is considered the gold standard to assess the degree of pulmonary involvement, our findings indicate that lung ultrasound could be a viable alternative to CT in the initial assessment of lung involvement in COVID‐19. Initially, it was believed that lung ultrasound would be less reliable than CT because of its perceived inability to detect central lesions. 44 However, the peripheral distribution of COVID‐19 makes lung ultrasound ideal for the detection of these abnormalities. 21 , 45 , 46 In fact, lung ultrasound also serves as a reliable test in viral pneumonias that produce more central abnormalities, such as influenza. 47 , 48 , 49 Incorporating lung ultrasound into routine COVID‐19 diagnostics offers the potential of reducing stress on conventional radiological resources, decreasing the need of transporting patients who are ill and unstable to CT and lowering the amount of healthcare personnel exposed to patients who are potentially contagious. 24 , 50
Furthermore, the LUS is able to discriminate well between patients who require admission and those who do not. Interestingly, the LUS could do so just as well as the CTSS. Furthermore, the gray zone analysis indicates that the LUS changes the posttest probability of admission moderately (∼30%) in more than two‐thirds of patients and largely (∼45%) in almost half of the patients, which is also comparable with the CTSS. 2 Previous studies found that chest imaging features can predate clinical symptoms or deterioration. 4 , 5 It has even been suggested that imaging findings might have additional value to clinical prognostic factors in selecting patients with COVID‐19 with high risks of poor outcomes irrespective of clinical presentation or disease course. 51 , 52 Our findings show that baseline lung ultrasound is indeed a predictor of poor outcome at 30 days and prolonged admission. These results are in line with the literature on CT with COVID‐19 that shows that pulmonary involvement on CT might be associated independently with outcome. 2 , 4 , 5 , 53 Sensitivity analysis shows no significant differences between the imputed and complete case data. Two recent retrospective single‐center studies from Israel and the United Kingdom show a similar association between lung ultrasound and poor outcomes in COVID‐19. 17 , 24 Our results add to the accumulating evidence that a semiquantitative LUS, as a proxy for lung involvement, is predictive of a poor outcome in a range of other pathologies, such as acute respiratory distress syndrome and heart failure. 15 , 54 It is still unclear, however, how lung ultrasound should be incorporated with other biomarkers and clinical information. Patients with a higher LUS tend to be more ill, with increases in C‐reactive protein, neutrophils, lactate dehydrogenase, and modified early warning score (MEWS) (Table 1). Combining lung ultrasound (and other POCUS modalities) with additional known prognostic factors for poor outcomes may enhance existing risk scores, as has been the case with CT findings. 51 , 52
Time at the frontlines is of the essence; clinicians require tools that enable them to make quick and accurate diagnostic and management decisions. Reliability and speed are even more critical as waves of patients with COVID‐19 keep overwhelming EDs and clogging up acute (and regular) care pathways. Integrating POCUS into clinical decision making has shown to speed up diagnosis and improve patient triage and time to treatment at the ED significantly. 12 , 55 Lung ultrasound in COVID‐19 may be of particular additional value to the physical examination and sound clinical judgment in patients who do not present with overt symptoms (eg, silent hypoxia or desaturation only with exercise) but might still benefit from a higher level of monitoring based on a high LUS. One could also speculate that serial point‐of‐care lung ultrasound might be used to monitor pulmonary involvement, track the disease course, guide management, and determine response to treatment without any radiation exposure. The LUS might also be a welcome addition to laboratory markers given the speed with which the results of POCUS are available. Lung ultrasound results can be obtained within 5–10 minutes, which is much faster than traditional laboratory or imaging results. Fortunately, POCUS is simple to learn for (para)medical personnel. 56 , 57 Furthermore, as an affordable and easy‐to‐use tool, POCUS could reduce obstacles to proper care, which is of particular importance given the ethnoracial, cultural, and socioeconomic disparities COVID‐19 has laid bare worldwide. 58 , 59 Moreover, POCUS can be used in different care settings (eg, ED, family practice, care homes, rural medicine), further lowering barriers to adequate care during this pandemic. 60 , 61 Future research should focus on the value of serial LUS in monitoring and response to treatment, implementation of POCUS in different settings (eg, nursing homes, outpatient facilities, community health centers, and general practitioner triage), and the development and validation of predictive models intergrating the LUS with other prognostic factors.
In summary, we demonstrate that the LUS correlates well with the CTSS. Moreover, COVID‐19 pulmonary involvement measured by lung ultrasound is significantly associated with poor outcome, disease severity, and admission duration. Lung ultrasound may, therefore, help the triage, risk stratification, and management of patients with COVID‐19 at the ED.
CONFLICT OF INTEREST
The authors declare no conflict of interest.
AUTHOR CONTRIBUTIONS
Arthur W. E. Lieveld and Frank H. Bosch were involved in developing the research plan and study design. Arthur W. E. Lieveld, Bram Kok, Kaoutar Azijli, and Frederick H. Schuit collected the data and entered the data in the database. Arthur W. E. Lieveld, Bram Kok, Peter M. van de Ven, and Prabath W.B. Nanayakkara analyzed the data. Arthur W. E. Lieveld and Bram Kok drafted the paper. Prabath W.B. Nanayakkara takes final responsibility. All authors critically appraised the paper, revised where appropriate, and approved the final version of the manuscript.
Supporting information
Supporting Information
Biography
Arthur W.E. Lieveld, MD, MSc, is a Fellow in Acute Medicine at the Amsterdam University Medical Center and a point‐of‐care ultrasound PhD Candidate at the Amsterdam Public Research Institute, in Amsterdam, The Netherlands.

Lieveld AWE, Kok B, Azijli K, et al. Assessing COVID‐19 pneumonia—Clinical extension and risk with point‐of‐care ultrasound: A multicenter, prospective, observational study. JACEP Open. 2021;2:e12429. 10.1002/emp2.12429
Arthur W. E. Lieveld and B. Kok contributed equally to this study.
Registration: This study is registered with trialregister.nl, Trial NL8497.
Funding and support: By JACEP Open policy, all authors are required to disclose any and all commercial, financial, and other relationships in any way related to the subject of this article as per ICMJE conflict of interest guidelines (see www.icmje.org). The authors have stated that no such relationships exist.
Supervising Editor: Henry E. Wang, MD, MS.
REFERENCES
- 1. Kupferschmidt K. New coronavirus variants could cause more reinfections, require updated vaccines. Science AAAS. 2021. 10.1126/science.abg6028 [DOI] [Google Scholar]
- 2. Lieveld AWE, Azijli K, Teunissen BP, et al. Chest CT in COVID‐19 at the ED: validation of the COVID‐19 Reporting and Data System (CO‐RADS) and CT severity score. Chest. 2020;159(3):1126‐1135. [DOI] [PMC free article] [PubMed] [Google Scholar]
- 3. Pan F, Ye T, Sun P, et al. Time course of lung changes at chest CT during recovery from coronavirus disease 2019 (COVID‐19). Radiology. 2020;295:715‐721.Radiological Society of North America. [DOI] [PMC free article] [PubMed] [Google Scholar]
- 4. Li K, Wu J, Wu F, et al. The clinical and chest CT Features associated with severe and critical COVID‐19 pneumonia. Investig Radiol. 2020;55:327‐331. [DOI] [PMC free article] [PubMed] [Google Scholar]
- 5. Li K, Fang Y, Li W, et al. CT image visual quantitative evaluation and clinical classification of coronavirus disease (COVID‐19). Eur Radiol. 2020:1‐10. [DOI] [PMC free article] [PubMed] [Google Scholar]
- 6. Wong HYF, Lam HYS, Fong AH‐T, et al. Frequency and distribution of chest radiographic findings in COVID‐19 positive patients. Radiology. 2019;296(2):E72‐E78. [DOI] [PMC free article] [PubMed] [Google Scholar]
- 7. Xiong Y, Sun D, Liu Y, et al. Clinical and high‐resolution CT features of the COVID‐19 infection: comparison of the initial and follow‐up changes. Investig Radiol. 2020;55:332‐339. [DOI] [PMC free article] [PubMed] [Google Scholar]
- 8. Liu Z, Jin C, Wu CC, et al. Association between initial chest CT or clinical features and clinical course in patients with coronavirus disease 2019 pneumonia. Korean J Radiol. 2020;21:736‐745. [DOI] [PMC free article] [PubMed] [Google Scholar]
- 9. Ye X, Xiao H, Chen B, Zhang S. Accuracy of lung ultrasonography versus chest radiography for the diagnosis of adult community‐acquired pneumonia: review of the literature and meta‐analysis. PLoS ONE. 2015;10:e0130066. [DOI] [PMC free article] [PubMed] [Google Scholar]
- 10. Orso D, Guglielmo N, Copetti R. Lung ultrasound in diagnosing pneumonia in the emergency department: a systematic review and meta‐analysis. Eur J Emerg Med. 2018;25:312‐321. [DOI] [PubMed] [Google Scholar]
- 11. Staub LJ, Mazzali Biscaro RR, Kaszubowski E, Maurici R. Lung ultrasound for the emergency diagnosis of pneumonia, acute heart failure, and exacerbations of chronic obstructive pulmonary disease/asthma in adults: a systematic review and meta‐analysis. J Emerg Med. 2019;56:53‐69. [DOI] [PubMed] [Google Scholar]
- 12. Laursen CB, Sloth E, Lassen AT, et al. Point‐of‐care ultrasonography in patients admitted with respiratory symptoms: a single‐blind, randomised controlled trial. Lancet Respir Med. 2014;2:638‐646. [DOI] [PubMed] [Google Scholar]
- 13. Pivetta E, Goffi A, Nazerian P, et al, on behalf of the Study Group on Lung Ultrasound from the Molinette and Careggi Hospitals . Lung ultrasound integrated with clinical assessment for the diagnosis of acute decompensated heart failure in the emergency department: a randomized controlled trial. Eur J Heart Fail. 2019;21:754‐766. [DOI] [PubMed] [Google Scholar]
- 14. Lichtenstein DA. BLUE‐protocol and FALLS‐protocol. Chest. 2015;147:1659‐1670. [DOI] [PubMed] [Google Scholar]
- 15. Mojoli F, Bouhemad B, Mongodi S, Lichtenstein D. Lung ultrasound for critically ill patients. Am J Respir Crit Care Med. 2019;199:701‐714. [DOI] [PubMed] [Google Scholar]
- 16. Zieleskiewicz L, Markarian T, Lopez A, et al, on behalf of the AZUREA Network . Comparative study of lung ultrasound and chest computed tomography scan in the assessment of severity of confirmed COVID‐19 pneumonia. Intensive Care Med. 2020;46:1707‐1713. [DOI] [PMC free article] [PubMed] [Google Scholar]
- 17. Knight T, Edwards L, Rajasekaran A, Clare S, Lasserson D. Point‐of‐care lung ultrasound in the assessment of suspected COVID‐19: a retrospective service evaluation with a severity score. Acute Med. 2020;19:192‐200. [PubMed] [Google Scholar]
- 18. Gibbons RC, Mendez K, Magee M, et al. 6 lung ultrasound versus chest x‐ray for the diagnosis of COVID‐19 pneumonia. Ann Emerg Med. 2020;76:S3. [DOI] [PMC free article] [PubMed] [Google Scholar]
- 19. Volpicelli G, Cardinale L, Fraccalini T, et al. Descriptive analysis of a comparison between lung ultrasound and chest radiography in patients suspected of COVID‐19. Ultrasound J. 2021;13:11. [DOI] [PMC free article] [PubMed] [Google Scholar]
- 20. McDermott C, Daly J, Carley S. Combatting COVID‐19: is ultrasound an important piece in the diagnostic puzzle? Emerg Med J. 2020;37:644‐649. [DOI] [PubMed] [Google Scholar]
- 21. Lieveld A, Kok B, Schuit F, et al. Diagnosing COVID‐19 pneumonia in a pandemic setting: lung ultrasound versus CT (LUVCT) A multi‐centre, prospective, observational study. ERJ Open. 2020;22. [DOI] [PMC free article] [PubMed] [Google Scholar]
- 22. Yale TC, Marti de Gracia M, DiezTascon A, et al. Correlation between chest computed tomography and lung ultrasonography in patients with coronavirus disease 2019 (COVID‐19). Radiol Imaging. 2020;46(11):2918‐2926. [DOI] [PMC free article] [PubMed] [Google Scholar]
- 23. Emanuele P, Alberto G, Maria T, et al. Lung ultrasound for the diagnosis of SARS‐CoV‐2 pneumonia in the emergency department. Ann Emerg Med. 2020;77(4):385‐394.Elsevier. [DOI] [PMC free article] [PubMed] [Google Scholar]
- 24. Lichter Y, Topilsky Y, Taieb P, et al. Lung ultrasound predicts clinical course and outcomes in COVID‐19 patients. Intensive Care Med. 2020;46(10):1873‐1883. [DOI] [PMC free article] [PubMed] [Google Scholar]
- 25. Brahier T, Meuwly J‐Y, Pantet O, et al. Lung ultrasonography for risk stratification in patients with COVID‐19: a prospective observational cohort study. Clin Infect Dis. 2020:ciaa1408. [DOI] [PMC free article] [PubMed] [Google Scholar]
- 26.World Health Organization. Use of chest imaging in COVID‐19. https://www.who.int/publications-detail-redirect/use-of-chest-imaging-in-covid-19. Published 2020. [PubMed]
- 27. Olgers TJ, Azizi N, Blans MJ, Bosch FH, Gans ROB. Point‐of‐care ultrasound (PoCUS) for the internist in acute medicine: a uniform curriculum. Neth J Med. 2019;77:9. [PubMed] [Google Scholar]
- 28. Wong A, Kirkpatrick C, Longmead A, Venables H, Parker P. COVID‐19 Lung Ultrasound Guideline – British Medical Ultrasound Society. https://www.bmus.org/static/uploads/resources/COVID19__Lung_Ultrasound_BMUS.pdf. Accessed November 30, 2020.
- 29. Bouhemad B, Brisson H, Le‐Guen M, Arbelot C, Lu Q, Rouby J‐J. Bedside ultrasound assessment of positive end‐expiratory pressure–induced lung recruitment. Am J Respir Crit Care Med. 2011;183:341‐347. [DOI] [PubMed] [Google Scholar]
- 30. Pisani L, Vercesi V, van Tongeren PSI, et al. The diagnostic accuracy for ARDS of global versus regional lung ultrasound scores—a post hoc analysis of an observational study in invasively ventilated ICU patients. Intensive Care Med Exp. 2019;7:44. [DOI] [PMC free article] [PubMed] [Google Scholar]
- 31. Simpson S, Kay FU, Abbara S, et al. Radiol Cardiothorac Imaging. 2020;2(2):e200152. 10.1148/ryct.2020200152 [DOI] [PMC free article] [PubMed] [Google Scholar]
- 32. Prokop M, van Everdingen W, van Rees Vellinga T, et al, For the “COVID‐19 standardized reporting” Working Group of the Dutch Radiological Society . CO‐RADS—a categorical CT assessment scheme for patients with suspected COVID‐19: definition and evaluation. Radiology. 2020;296(2):E97‐E104. [DOI] [PMC free article] [PubMed] [Google Scholar]
- 33. Zimmerman M, Handreiking Standaardverslag CT‐thorax COVID inclusief CO‐RADS en CT‐score. https://www.radiologen.nl/secties/netwerk-covid-19/documenten/handreiking-standaardverslag-ct-thorax-covid-inclusief-co-rads. Published 2020. Accessed July 8, 2020.
- 34. Chang Y‐C, Yu C‐J, Chang S‐C, et al. Pulmonary sequelae in convalescent patients after severe acute respiratory syndrome: evaluation with thin‐section CT. Radiology. 2005;236:1067‐1075. [DOI] [PubMed] [Google Scholar]
- 35. Twisk JWR. Inleiding in De Toegepaste Biostatistiek. Houten, The Netherlands: Bohn Stafleu van Loghum. 2016. [Google Scholar]
- 36. Blackman NJ‐M. Systematic reviews of evaluations of diagnostic and screening tests. BMJ. 2001;323:1188. [PMC free article] [PubMed] [Google Scholar]
- 37. Fischer JE, Bachmann LM, Jaeschke R. A readers’ guide to the interpretation of diagnostic test properties: clinical example of sepsis. Intensive Care Med. 2003;29:1043‐1051. [DOI] [PubMed] [Google Scholar]
- 38. Glas AS, Lijmer JG, Prins MH, Bonsel GJ, Bossuyt PMM. The diagnostic odds ratio: a single indicator of test performance. J Clin Epidemiol. 2003;56:1129‐1135. [DOI] [PubMed] [Google Scholar]
- 39. Blackman NJ‐M, Odds ratio not prevalence independent. https://www.bmj.com/rapid-response/2011/10/28/odds-ratio-not-prevalence-independent. Published 2020. Accessed October 15, 2020.
- 40. Coste J, Pouchot J. A grey zone for quantitative diagnostic and screening tests. Int J Epidemiol. 2003;32:304‐313. [DOI] [PubMed] [Google Scholar]
- 41. McGee S. Simplifying likelihood ratios. J Gen Intern Med. 2002;17:647‐650. [DOI] [PMC free article] [PubMed] [Google Scholar]
- 42. van Buuren S. Flexible Imputation of Missing Data. 2nd ed. Boca Raton: CRC Press, Taylor and Francis Group; 2018. [Google Scholar]
- 43. Deng Q, Zhang Y, Wang H, et al. Semiquantitative lung ultrasound scores in the evaluation and follow‐up of critically ill patients with COVID‐19: a single‐center study. Acad Radiol. 2020;27:1363‐1372. [DOI] [PMC free article] [PubMed] [Google Scholar]
- 44. Rubin GD, Haramati LB, Kanne JP, et al. The role of chest imaging in patient management during the covid‐19 pandemic: a multinational consensus statement from the Fleischner Society. Radiology. 2020;158(1):106‐111. [DOI] [PMC free article] [PubMed] [Google Scholar]
- 45. Salehi S, Abedi A, Balakrishnan S, Gholamrezanezhad A. Coronavirus disease 2019 (COVID‐19): a systematic review of imaging findings in 919 patients. Am J Roentgenol. 2020;215(1):87‐93. [DOI] [PubMed] [Google Scholar]
- 46. Peng Q‐Y, Wang X‐T, Zhang L‐N, Chinese Critical Care Ultrasound Study Group (CCUSG) . Findings of lung ultrasonography of novel corona virus pneumonia during the 2019–2020 epidemic. Intensive Care Med. 2020;46(5):849‐850. [DOI] [PMC free article] [PubMed] [Google Scholar]
- 47. Bai HX, Hsieh B, Xiong Z, et al. Performance of radiologists in differentiating COVID‐19 from non‐COVID‐19 viral pneumonia at chest CT. Radiology. 2020;296:E46‐E54. [DOI] [PMC free article] [PubMed] [Google Scholar]
- 48. Testa A, Soldati G, Copetti R, Giannuzzi R, Portale G, Gentiloni‐Silveri N. Early recognition of the 2009 pandemic influenza A (H1N1) pneumonia by chest ultrasound. Crit Care. 2012;16:R30. [DOI] [PMC free article] [PubMed] [Google Scholar]
- 49. Wang H, Wei R, Rao G, Zhu J, Song B. Characteristic CT findings distinguishing 2019 novel coronavirus disease (COVID‐19) from influenza pneumonia. Eur Radiol. 2020;30:4910‐4917. [DOI] [PMC free article] [PubMed] [Google Scholar]
- 50. Mongodi S, Orlando A, Arisi E. Lung ultrasound in patients with acute respiratory failure reduces conventional imaging and health care provider exposure to COVID‐19. Ultrasound Med Biol. 2020;46:2090‐2093. [DOI] [PMC free article] [PubMed] [Google Scholar]
- 51. Ji L, Cao C, Gao Y, et al. Prognostic value of bedside lung ultrasound score in patients with COVID‐19. Crit Care. 2020;24:700. [DOI] [PMC free article] [PubMed] [Google Scholar]
- 52. Wu Q, Wang S, Li L, et al. Radiomics analysis of computed tomography helps predict poor prognostic outcome in COVID‐19. Theranostic. 2020;10:7231‐7244. [DOI] [PMC free article] [PubMed] [Google Scholar]
- 53. Francone M, Iafrate F, Masci GM, et al. Chest CT score in COVID‐19 patients: correlation with disease severity and short‐term prognosis. Eur Radiol. 2020;30(12):6808‐6817. [DOI] [PMC free article] [PubMed] [Google Scholar]
- 54. Volpicelli G, Elbarbary M, Blaivas M, et al, International Liaison Committee on Lung Ultrasound (ILC‐LUS) for the International Consensus Conference on Lung Ultrasound (ICC‐LUS) . International evidence‐based recommendations for point‐of‐care lung ultrasound. Intensive Care Med. 2012;38:577‐591. [DOI] [PubMed] [Google Scholar]
- 55. Smallwood N, Dachsel M. Point‐of‐care ultrasound (POCUS): unnecessary gadgetry or evidence‐based medicine?. Clin Med. 2018;18:219‐224. [DOI] [PMC free article] [PubMed] [Google Scholar]
- 56. Tulleken AM, Gelissen H, Lust E, et al. UltraNurse: teaching point‐of‐care ultrasound to intensive care nurses. Intensive Care Med. 2019;45:727‐729. [DOI] [PubMed] [Google Scholar]
- 57. Arbelot C, Dexheimer Neto FL, Gao Y, et al. Lung ultrasound in emergency and critically ill patients: number of supervised exams to reach basic competence. Anesthesiology. 2020;132:899‐907. [DOI] [PubMed] [Google Scholar]
- 58. Kavanagh MM, Erondu NA, Tomori O, et al. Access to lifesaving medical resources for African countries: cOVID‐19 testing and response, ethics, and politics. Lancet. 2020;395:1735‐1738.Elsevier. [DOI] [PMC free article] [PubMed] [Google Scholar]
- 59. Centers for Disease; Control and Prevention. Coronavirus Disease 2019 (COVID‐19). Atlanta, GA: Centers for Disease Control and Prevention; 2020. [Google Scholar]
- 60. Soldati G, Smargiassi A, Inchingolo R, et al. Is there a role for lung ultrasound during the COVID‐19 pandemic? Clinical letters. J Ultrasound Med. 2020;39(7):1459‐1462. [DOI] [PMC free article] [PubMed] [Google Scholar]
- 61. Sofia S, Boccatonda A, Montanari M, et al. Thoracic ultrasound and SARS‐COVID‐19: a pictorial essay. J Ultrasound. 2020;23(2):217‐221. [DOI] [PMC free article] [PubMed] [Google Scholar]
Associated Data
This section collects any data citations, data availability statements, or supplementary materials included in this article.
Supplementary Materials
Supporting Information