

Abstract
Background
Feed efficiency (FE) is an important trait for livestock and humans. While the livestock industry focuses on increasing FE, in the current obesogenic society it is more of interest to decrease FE. Hence, understanding mechanisms involved in the regulation of FE and particularly how it can be decreased would help tremendously in counteracting the obesity pandemic. However, it is difficult to accurately measure or calculate FE in humans. In this study, we aimed to address this challenge by developing a hierarchical dynamic model based on humanized mouse data.
Methods
We analyzed existing experimental data derived from 105 APOE*3‐Leiden.CETP (E3L.CETP) mice fed a high‐fat high‐cholesterol (HFHC) diet for 1 (N = 20), 2 (N = 19), 3 (N = 20), and 6 (N = 46) month. We developed an ordinary differential equation (ODE) based model to estimate the FE based on the longitudinal data of body weight and food intake. Since the liver plays an important role in maintaining metabolic homeostasis, we evaluated associations between FE and hepatic gene expression levels. Depending on the feeding duration, we observed different relationships between FE and hepatic gene expression levels.
Results
After 1‐month feeding of HFHC diet, we observed that FE was associated with vitamin A metabolism, arachidonic acid metabolism, and the PPAR signaling pathway. After 3‐ and 6‐month feeding of HFHC diet, we observed that FE was associated most strongly with expression levels of Spink1 and H19, genes involved in cell proliferation and glucose metabolism, respectively.
Conclusions
In conclusion, our analysis suggests that various biological processes such as vitamin A metabolism, hepatic response to inflammation, and cell proliferation associate with FE at different stages of diet‐induced obesity.
Keywords: feed efficiency, liver, metabolic syndrome, RNA‐Seq, transgenic mice
Feed efficiency changes over time and varies between animals.

1. BACKGROUND
Obesity in humans is a global health problem and is primarily caused by excessive caloric intake that accompanies a sedentary lifestyle, a so‐called positive energy balance. However, despite the fact that most people in the developed world live in an obesogenic environment, some become obese and others do not. Understanding the mechanism underlying inter‐individual variations in progressing weight gain will provide us with novel therapeutic targets to counteract the obesity pandemic.
In livestock, the propensity toward weight gain has been quantified in the form of feed efficiency (FE), which is defined as the ratio of calories consumed divided by body weight gain over a specific time interval. As an important economic trait, FE is used for selecting the most feed‐efficient animals in order to reduce food consumption for the same amount of meat or dairy production. Since the liver plays a central role in partitioning and metabolizing nutrients, genome‐wide transcriptomic analyses have been performed in pigs and cows to investigate metabolic processes that are related to FE. It has been shown that vitamin A metabolism, lipid metabolism, and hepatic response to inflammation are associated with FE in these animals (Alexandre et al., 2015; Horodyska et al., 2019; Mukiibi et al., 2018; Ramayo‐Caldas et al., 2018; Zhao et al., 2016). Whether these processes are also related to the propensity toward weight gain in humans is not known.
To be able to calculate FE accurately, food intake has to be monitored continuously and housing conditions should be kept constant. Obviously, this is difficult in humans. In this study, we therefore used a humanized mouse model, the APOE*3‐Leiden.CETP (E3L.CETP) mouse (Westerterp et al., 2006) as a proxy to study FE and its regulation in humans. The E3L.CETP mouse is a promising translational model for studying diet‐induced obesity and metabolic syndrome (Hoek et al., 2014). It has a humanized lipoprotein metabolism and can develop metabolic syndrome within several months upon feeding a high‐fat high‐cholesterol (HFHC) diet (Paalvast et al., 2017; Rozendaal et al., 2018). Interestingly, despite an identical genetic background and housing condition, HFHC diet feeding E3L.CETP mice showed heterogeneous body weight gain after a similar amount of food consumption and well‐controlled housing conditions (Nasias et al., 2019; Tarasco et al., 2018).
Here we used existing experimental data derived from 105 E3L.CETP mice fed a HFHC diet for 1 (N = 20), 2 (N = 19), 3 (N = 20) and 6 (N = 46) month (Paalvast et al., 2017). To gain insight in FE regulation, we analyzed hepatic transcriptomes of 43 E3L.CETP mice (1 month N = 9; 2 months N = 10; 3 months N = 8; 6 months N = 16). Since FE is the outcome of a complex balance between calorie intake, energy expenditure, and calorie excretion, FE changes over time (Rozendaal et al., 2019). In order to estimate the FE at the time point corresponding to the transcriptomic analyses, we developed an ordinary differential equation (ODE) model based on the longitudinal data of food intake and body weight. We then assessed the associations between FE and gene expression levels in the liver.
2. METHODS
2.1. Animals, diet, and housing
2.1.1. Paalvast study
In a first study, male E3L.CETP mice (C57BL/6 J background; N = 105, at the age of 4 months) were housed individually in a light ((lights on at 7:00 AM,lights off at 7:00 PM) and temperature (21°C) controlled facility, and were fed a synthetic HFHC diet (D12492, Research Diets) containing 60% fat and 0.25% cholesterol. The energy density of the HFHC diet was 5.21 kcal/g, with fat, carbohydrate, and protein providing 60%, 20%, and 20% energy. Among the 105 E3L.CETP mice, 20, 19, 20, and 46 mice were fed ad libitum for 1, 2, 3, and 6 months, respectively. Details of the experimental setup were previously described (Paalvast et al., 2017).
2.1.2. Rozendaal study
In a second study, male E3L.CETP mice (N = 8, at the age of 11 weeks) were co‐housed in a light and temperature‐controlled facility, and fed the same synthetic HFHC diet (D12492, Research Diets). These E3L.CETP mice were fed ad libitum for 3 months. Experimental details were previously described in (Rozendaal et al., 2018;14:e1006145.).
Both studies were approved by the Ethics Committees for Animal Experiment of the University of Groningen and Leiden University. All methods were carried out in accordance with relevant guidelines and regulations. All mice were obtained from TNO, Innovation for Life, The Hague, The Netherlands. Anesthetic and euthanasia methods were not applicable in this study. All methods were carried out in accordance with ARRIVE guidelines.
2.2. Computational model
Our computational model is composed of a system of coupled, nonlinear ordinary differential equations (ODEs).
This model contains two state variables, namely cumulative food consumption (F) and body weight (W). Meanwhile, there are three system parameters, including FI (food intake, g/day), FEmax (maximum feed efficiency), and Wmax (maximum body weight, g).
In order to address heterogeneity across mice, we allowed individual mice to have their own FI and incorporated the ODE model in a hierarchical model. We estimated the model parameters by applying Markov Chain Monte Carlo implemented in the program, Stan.
2.2.1. Prior distributions for system parameters
Based on a previous study consisting of the same animal model and diet (Tarasco et al., 2018), we used a normal distribution with a mean 2.5 g/day and a standard deviation 0.1 g/day as the prior distribution to describe the mean daily food intake of E3L.CETP mice. Based on that study, we used an exponential distribution with the rate parameter 0.02 as the prior distribution for the maximum body weight. Since the maximum feed efficiency must be between 0 and 1, we used a non‐informative Beta(2,8) as the prior distribution. For the remaining parameters, we applied the non‐informative prior distributions.
2.2.2. Initial values
In this study, day 0 refers to the day when the mice received the HFHC diet. Hence, cumulative food consumption at day 0 (F(t = 0)) was set as 0. Body weight measurements at day 0 were used as initial values.
2.2.3. Implementation details
The mathematical model and multi‐level model were implemented in Stan (2.19.1) (Carpenter et al., 2017). The ordinary differential equations were solved by running the function integrate_ode_bdf implemented in Stan. We fitted the model by running Hamiltonian Markov Chain Monte Carlo in the program Stan (version 2.19.1) (Carpenter et al., 2017). We ran four Markov chains with 2000 iterations in each chain. Results were presented with the posterior mean with a 95% credible interval. The code can be found at https://github.com/XiangZhangSC/mice_to_human
2.3. Model validation
To validate our dynamic model, we applied it to a study with the same mice fed the same diet performed in a different laboratory. We simulated 8 E3L.CETP mice were described in a previously published study (Rozendaal et al., 2018). For each mouse, we ran 1000 simulations. In each simulation, we used body weight at day 0 as the initial value of body weight, and we set the initial value of food consumption as 0. The simulated body weight values were represented by the mean together with a 95% credible interval. The actual body weight measurements for each animal were imposed in the same plot.
2.4. RNA sequencing analysis
In total, 43 HFHC‐feeding E3L.CETP mice (1‐month group: N = 9, 2‐month group: N = 10, 3‐month group: N = 8, 6‐month group: N = 16) were randomly selected from each feeding group. Their liver tissues were prepared for RNA sequencing analysis. RNA of the liver tissue was isolated by using a commercially available kit (RNeasy, Qiagen). Quality control of RNA samples was performed by capillary electrophoresis using LabChip GX (Perkin Elmer). Libraries were constructed by using the 3’QuantSeq sample preparation kits (Lexogen). The obtained cDNA fragment libraries were sequenced on an Illumina HiSeq2500. The obtained reads were aligned to the mouse reference genome (ensembl release 82) by running (hisat). The gene level quantification was performed by running HTSeq‐count (Anders et al., 2015). More details were described in a previous study (Paalvast et al., 2017).
2.5. Hepatic triglycerides
Liver lipids were extracted using the Bligh and Dyer procedure (Bligh & Dyer, 1959) and redissolved in 2% Triton‐X100. Triglycerides were measured using a commercially available kit (Roche).
2.6. Endogenous glucose production
Endogenous glucose production was determined as described (Paalvast et al., 2017). In brief, food was removed at 9 AM and the experiment started at 1 PM. At 1 PM, animals received 0.1 mg/g [6,6]‐D2‐glucose intraperitoneally at a concentration of 30 mg/mL. Immediately before, and 10, 20, 30, 40, 50, 60, 75, and 90 min after the intraperitoneal injection, blood glucose was measured with an Accu‐Check glucose meter, and a small amount of blood was collected on a filter paper. Glucose was then extracted from the dried blood with a water/ethanol mixture. After the solution was evaporated under nitrogen flow at 60°C, the residue was derivatized to glucose penta‐acetate by adding 100 µL pyridine and 200 µL acetic anhydride to the extracted glucose and heating at 60°C for 30 min. After evaporation under nitrogen flow, the residue was then dissolved in 200 µL ethyl acetate for analysis by GC–MS. GC–MS was performed with a Zebron ZB‐1701 30 m × 250 µm × 0.25 µm (Phenomenex) column under positive chemical ionization with ammonia ions monitored at m/z 408–412 (m0–m4). After corrections for natural abundances, the kinetics of the enrichment of glucose with D2‐glucose were then used to estimate endogenous glucose production.
2.7. Statistical analysis
To gain insights in biological processes that are related to feed efficiency, we evaluated associations between feed efficiency and hepatic gene expression levels. We focused on the 43 E3L.CETP mice that had RNA sequencing data (Paalvast et al., 2017). The response variable y is a matrix with 22897 rows and 43 columns. Each row of y represents a gene and each column of y represents a mouse. Every entry in this matrix represents the frequency that a gene i was observed in the mouse j. We focused on genes that have nonzero count in at least 40 samples. In total, we assessed associations of feed efficiency with 11390 genes. Since there were four cohorts of mice, we performed the association analysis within each group. The predictor variable x is a matrix has 1000 columns, and 9, 10, 8, or 16 rows depending on the mouse cohort. Every row of x represents a mouse and every column of x represents a simulation. Since the gene expression data were derived from the liver on the day that the animal was sacrificed, we calculated the feed efficiency on the same day by solving the ODE system. Since feed efficiency is unobserved, we calculated the feed efficiency 1000 times for every mouse in order to take into account the uncertainty. In the next step, we ran negative binomial regression analyses between liver gene expression and feed efficiency adjusting for the batch effects (different day and chemical reactant for RNA isolation) by running the function glm.fit implemented in the R package edgeR (McCarthy et al., 2012; Robinson et al., 2010). Within each iteration, we first calculated the P value based on the likelihood ratio test implemented in the glmLRT function and then corrected for the multiple testing by calculating the false discovery rate (FDR). If a gene had FDR below 0.05, that gene was considered as differentially expressed. Within each iteration, we also performed KEGG (Kyoto Encyclopedia of Genes and Genomes) pathway analysis by running the kegga function in the edgeR package (Robinson et al., 2010). The hypergeometric test was used to calculate the P values. Regarding the issue of multiple testing, we calculated the FDR for each pathway. After 1000 iterations, we counted how many times an association between a gene (or a pathway) and the feed efficiency had a false discovery rate below 0.05.
We assessed the relationship between feed efficiency and hepatic triglycerides as well as hepatic glucose production rate by performing Spearman correlation analysis. We focused on the E3L.CETP mice that were fed by HFHC diet for 1 month. There were 10 1‐month feeding E3L.CETP mice having measurements of hepatic triglycerides. There were 14 6‐month feeding E3L.CETP mice having measurements of hepatic glucose production rate. We performed the Spearman correlation analysis 1000 times and counted how many times the corresponding P value is below 0.05.
3. RESULTS
3.1. Dynamic model predicted body weight changes in E3L.CETP mice fed a HFHC diet
Based on our ODE‐based dynamic model, E3L.CETP mice fed by the HFHC diet had a food intake of 16.5 [15.9, 17.0] kcal/day (posterior mean and 95% credible interval), with maximum feed efficiency of 23.3% [21.6%, 25.1%] and a maximum body weight of 55.6 [54.6, 56.6] g. To validate our ODE model, we predicted the body weight changes in eight HFHC diet feeding E3L.CETP mice were included in a previous study (Rozendaal et al., 2018). based on their initial body weight and cumulative food consumption. We found that in all eight E3L.CETP mice, the actual experimental data were within the 95% credible interval of our predictions (Figure 1).
FIGURE 1.

Body weight predictions for E3L.CETP mice in the Rozendaal study. Each panel represents a mouse. The solid line refers to the mean of predictions. The shade area represents the 95% credible interval of predictions. The blue dots represent the experimental data
3.2. Associations between feed efficiency and gene expression levels in the liver
In order to identify candidate genes and pathways that associated with FE, RNA sequencing was performed on liver tissue derived from 43 E3L.CETP mice. Since these 43 mice were sacrificed on different days and since FE changes over time, we first calculated the FE of these 43 animals (1000 times each) on the day when they were sacrificed based on our dynamic model (Figure 2). The average FE in 1‐month, 2‐month, 3‐month, and 6‐month feeding E3L.CETP mice were 7.11% [6.84%, 7.39%], 4.46% [4.29%, 4.64%], 2.96% [2.75%, 3.16%], and 0.65% [0.53%, 0.79%], respectively.
FIGURE 2.
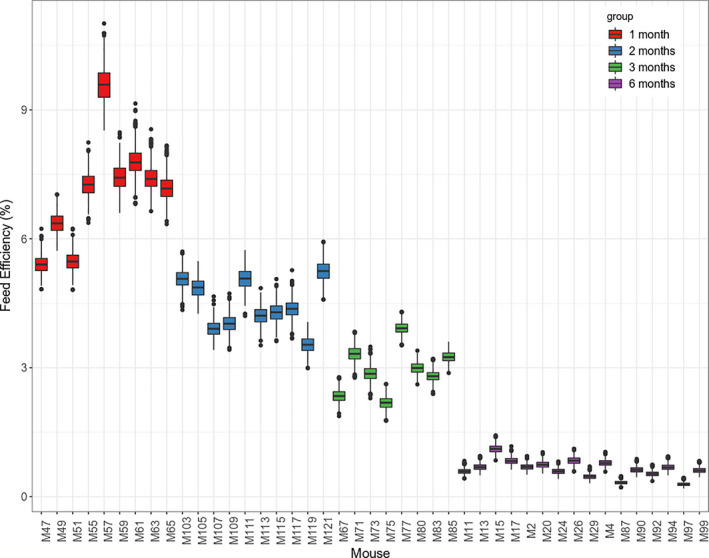
Feed efficiency on the day when the animals were sacrificed. Feed efficiency was calculated based on the dynamic model and the calculation was repeated for 1000 times. Each box represents the results of 1000 simulated feed efficiency values
We observed that higher FE was associated with down‐regulated retinol metabolism pathway in the 1‐month feeding mice group (861 out of 1000 simulations), followed by arachidonic acid metabolism (613 simulations) and PPAR signaling pathway (576 simulations) (Figure 3). In the retinol metabolism pathway, we observed that higher FE was associated with lower expression levels of Cyp2b9 (median logFC = −1.42, median FDR = 0.00312), Cyp2c38 (median logFC = −0.834, median FDR = 0.00529), Rdh16 (median logFC = −0.482, median FDR = 0.00731), Cyp4a10 (median logFC = −0.706, median FDR = 0.0242), and Aldh1a1 (median logFC = −0.441, median FDR = 0.0487). Cyp2b9, Cyp2c38, and Cyp4a10 also participate in arachidonic acid metabolism. Regarding the PPAR signaling pathway, we observed that higher FE was associated with lower expression levels of Plin4 (median logFC = −0.475, median FDR = 0.00698), Scd1 (median logFC = −0.578, median FDR = 0.0192), and Cyp4a10 (median logFC = −0.706, median FDR = 0.0242).
FIGURE 3.
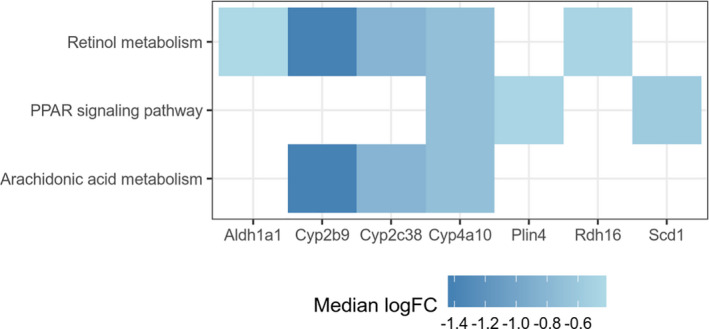
Pathways enriched with down‐regulated genes in the 1‐month feeding group (N = 9). The hypergeometric test was used to calculate the P values. The median log fold change was calculated based on 1000 simulations
We did not observe any genes or pathways that were associated with FE in the 2‐month feeding groups. In the 3‐month feeding group, we observed that FE was inversely associated with expression levels of Spink1 (968 simulations, median logFC = −0.856, median FDR = 0.00015). In the 6‐month feeding group, we observed that increasing feed efficiency was associated with increasing expression levels of Ccbl2 (993 simulations, median logFC = 0.294, median FDR = 0.0154) and H19 (972 simulations, median logFC = 1.83, median FDR = 0.0136). In contrast, increasing feed efficiency was associated with decreasing expression levels of Cyp3a11 (999 simulations, median logFC = −0.337, median FDR = 0.00935) (Figure 4).
FIGURE 4.

Volcano plots identifying genes that were associated with feed efficiency. Genes with False Discovery Rate below 0.05 (likelihood ratio test) for at least 950 times in 1000 simulations in 1 month (N = 9), 2 month (N = 10), 3 month (N = 8), and 6 month (N = 16) group are presented as dots, respectively
3.3. Relationship between feed efficiency and hepatic triglycerides
In the 1‐month feeding group, we observed that there was a significant inverse correlation between FE and hepatic triglycerides (Spearman correlation −0.676, 95% credible interval [−0.806, −0.564]) in 726 of 1000 simulations (Figure 5). We did not find a significant correlation between feed efficiency and hepatic triglycerides in 2‐month, 3‐month, and 6‐month feeding group (Figure 5).
FIGURE 5.

Relationship between feed efficiency and hepatic triglycerides in E3L.CETP mice fed by high‐fat high‐cholesterol diet for 1 month (N = 10), 2 months (N = 10), 3 months (N = 9), and 6 months (N = 21). The short vertical lines represent the 95% credible interval for the feed efficiency
3.4. Relationship between feed efficiency and hepatic glucose production
In this study, hepatic glucose production was measured in 14 mice from the 6‐month feeding group. We observed that increasing FE was significantly associated with enhanced hepatic glucose production rate (Spearman correlation coefficient 0.550 [0.508, 0.604]) in 854 of 1000 simulations (Figure 6).
FIGURE 6.
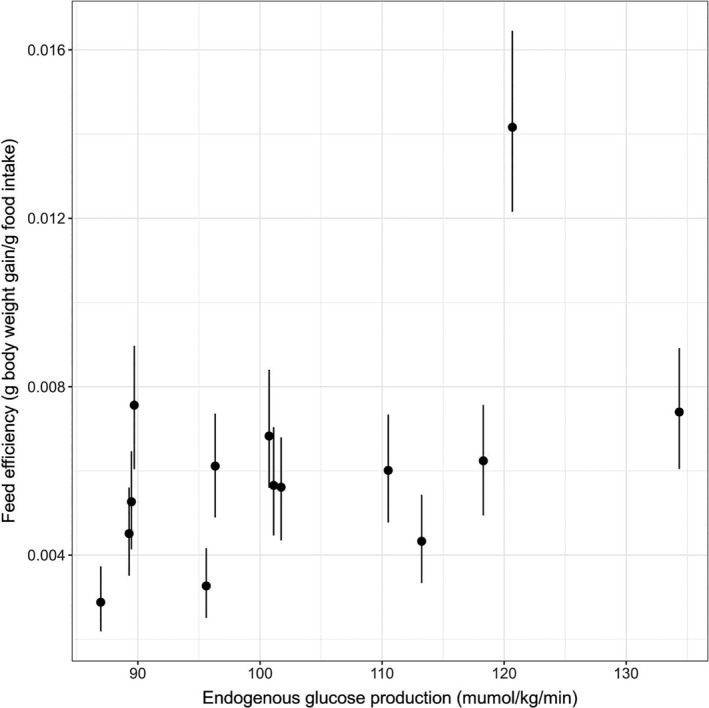
Relationship between feed efficiency and hepatic glucose production in 14 E3L.CETP mice fed by high‐fat high‐cholesterol diet for 6 months. The short vertical lines represent the 95% credible interval for the feed efficiency
4. DISCUSSION
Feed efficiency (FE), a ratio monitoring body weight gain per unit of food consumed, is an important economic trait in the livestock industry, in particular, to efficiently increase lean mass by increasing FE. In contrast to maximizing FE in livestock, reducing FE provides an interesting approach to counteract the human obesity pandemic developed over the last decades. As far as we know, biological processes that regulate FE have been sparsely investigated in human studies, most probably due to the difficulty of accurately measuring food intake over prolonged time intervals under constant environmental conditions. Also in this study, we did not study humans but employed a humanized mouse model mimicking the development of metabolic syndrome. In such an animal model it is relatively simple to measure food intake and body weight gain over a prolonged time interval. Our analysis showed that FE in E3L.CETP mice decreased with increasing age. To be able to identify genes associated with FE, it was necessary to develop a computational model calculating FE at time points when gene expression was determined. To this end, we developed an ODE‐based model based on the longitudinal data of food intake and body weight, published in a study on 105 E3L.CETP mice fed a HFHC diet for various periods of time (Paalvast et al., 2017). To validate the model, we had access to the experimental data with the same mice and the same diet in a completely different laboratory setting (Rozendaal et al., 2018). Our ODE‐based model successfully predicted body weight changes in the validation cohort.
Since the liver is generally considered to be the metabolic coordinator of whole body energy metabolism, we studied the relationship between hepatic gene expression and FE.
After feeding HFHC diet for 1 month, we observed that the average FE of E3L.CETP mice was 7% and increasing FE was associated with down‐regulated retinol metabolism. The liver is the most important organ for the storage and metabolism of retinol (vitamin A). It was shown that hepatic vitamin A metabolism regulated FE in pigs (Zhao et al., 2016). We observed that at the 1‐month time point FE was associated with five genes involved in vitamin A metabolism including Cyp2b9, Cyp2c38, Rdh16, Cyp4a10, and Aldh1a1. Interestingly, in a recent study which also used the E3L.CETP mouse model, it was shown that hepatic expression levels of Cyp2b9, Cyp2c38, Rdh16, and Cyp4a10 in the mice that developed metabolic syndrome phenotypes with high‐fat diet were different from the ones that did not (Nasias et al., 2019). We found that a 1% increase in FE was associated with a 26% decrease in Aldh1a1 expression levels. In fact, Aldh1a1 is a key enzyme in the synthesis of 9‐cis retinoic acid, the potent agonist of both the retinoic acid receptor (RAR) and retinoid X receptor (RXR) (Ziouzenkova & Plutzky, 2008). Deficiency of Aldh1a1 inhibited 9‐cis retinoic acid synthesis, leading to significantly attenuated hepatic glucose production as well as hepatic triacylglycerol synthesis (Kiefer et al., 2012). Since retinoic acid is also a ligand for the PPAR (Peroxisome Proliferator‐Activated Receptor), inhibited vitamin A metabolism is anticipated to reduce the activity of PPAR signaling pathway (Shaw et al., 2003). Indeed, we found that a 1% increase in FE was associated with downregulation of PPAR signaling pathway genes such as Plin4, Scd1, and Cyp4a10 by 28%, 33%, and 39%, respectively. We noticed that both Plin4 and Scd1 play important roles in regulating hepatic lipid accumulation (Chen et al., 2013; Li et al., 2009). We also found that a 1% increase in FE corresponded to a 74% increase in Enho expression levels. Enho (energy homeostasis associated) encodes adropin which governs energy homeostasis. Overexpression of hepatic Enho was showed to correlate with decreasing hepatic steatosis (Kumar et al., 2008). This is consistent with our observation that E3L.CETP mice with high FE had low hepatic triglyceride levels.
In the mice fed HFHC diet for 1 month, we also observed that increasing FE was associated with downregulated arachidonic acid metabolism. Arachidonic acid metabolism plays an important role in triggering and resolving inflammation. We noticed that a 1% increase in FE corresponded to downregulation of Themis by 57% and upregulation of Serpina1e by 52%. Themis (thymocyte‐expressed molecule involved in selection) plays an important role in T‐cell development and its deficiency reduced the number of CD8+ T cells (important drivers of hepatic inflammation) (Breuer et al., 2020; Lesourne et al., 2009). HFHC diet consumption can cause liver injury (Soltis et al., 2017), stimulating alpha 1‐antitrypsin (encoded by Serpina1e) production in response to the inflammation (Janciauskiene et al., 2004). Since fueling the immune response is an energetically expensive process, downregulation of arachidonic acid metabolism and inflammation‐related genes may preserve more energy for growth. Interestingly, a study showed that the hepatic immune response to inflammation indeed affected the FE in cows (Paradis et al., 2015).
Compared to the 1‐month feeding group, the average FE in E3L.CETP mice after 3‐month feeding of HFHC diet decreased to about 3% and its relationship with hepatic gene expression completely changed. We found that a 0.5% increase in FE was associated with a 45% decrease in expression level of Spink1 (serine protease inhibitor Kazal‐1). Spink1 promotes cell proliferation and was found upregulated in hepatocellular carcinoma (Marshall et al., 2013). Our observation suggested that the 3‐month feeding E3L.CETP mice may achieve a higher feed efficiency by suppressing hepatocyte proliferation.
After feeding 6 months of HFHC diet, the average FE in E3L.CETP mice was low (0.7%) and the relationship between FE and hepatic gene expression changed again. We found that a 0.1% increase in FE was associated with a 128% increase in expression levels of H19 and a 11% increase in Ccbl2, as well as a 10% decrease in Cyp3a11. Here we focused on H19 because the effect sizes of Ccbl2 and Cyp3a11 were small. H19 encodes a long noncoding RNA (lncRNA) which was found elevated in diet‐induced diabetic mice (Zhang et al., 2018). More interestingly, overexpression of hepatic H19 was shown to promote hepatic glucose production (Zhang et al., 2018). Our additional analysis showed that 6‐month feeding E3L.CETP mice with high FE tended to have high hepatic glucose production rates. Nevertheless, the feed efficiency difference in the 6‐month was subtle, future studies are required to validate our observations.
Clearly, a limitation of this study is that the genes and pathways identified here were statistically associated with FE. We identified genes that were associated with the feed efficiency mostly in the 1‐month feeding group due to the fact that the feed efficiency showed the greatest variation in this group compared to other feeding groups. In future studies, it would be preferable to determine the association with FE and gene expression in animals divergent in FE. When animals mature FE declines and indeed at 6‐month FE was very low making relations with gene expression less informative. The causal relationship between FE and these genes or pathways is to be investigated in a future study. In this study, we focused on metabolizable energy and did not consider the minor fecal energy losses. Another limitation is that we focused on the relationship between FE and liver physiology. Certainly, it will be important to investigate its relationship with other metabolic organs such as adipose tissues and skeletal muscle, since FE is a complex trait encompassing overall whole‐body metabolism.
5. CONCLUSION
We developed a simple ODE‐based model to estimate FE. We applied the model to a cohort of E3L.CETP mice using published data. As expected, FE varied with aging and differed between animals. Our gene expression analysis suggests that various biological processes such as vitamin A metabolism, hepatic response to inflammation and cell proliferation may regulate FE at different stages of diet‐induced obesity.
CONFLICT OF INTERESTS
The authors declare no competing interests.
AUTHORS' CONTRIBUTIONS
XZ developed the ODE model, performed the association analyses, and wrote the manuscript. YP and YW performed the animal experiments. PCNR and AKG supervised the project and edited the manuscript. All authors have read and approved the manuscript.
ACKNOWLEDGMENT
Not applicable
Funding information
This study was supported by EU grants (FP7‐HEALTH‐305707, FP7‐603091‐2) and the Netherlands CardioVascular Research Initiative (CVON2011‐2016; Genius). The funding bodies play no role in the design of the study and collection, analysis, and interpretation of data and in writing the manuscript.
REFERENCES
- Alexandre, P. A. , Kogelman, L. J. A. , Santana, M. H. A. , Passarelli, D. , Pulz, L. H. , Fantinato‐Neto, P. , Silva, P. L. , Leme, P. R. , Strefezzi, R. F. , Coutinho, L. L. , Ferraz, J. B. S. , Eler, J. P. , Kadarmideen, H. N. , & Fukumasu, H. (2015). Liver transcriptomic networks reveal main biological processes associated with feed efficiency in beef cattle. BMC Genomics, 16, 1073. 10.1186/s12864-015-2292-8. [DOI] [PMC free article] [PubMed] [Google Scholar]
- Anders, S. , Pyl, P. T. , & Huber, W. (2015). HTSeq–a Python framework to work with high‐throughput sequencing data. Bioinformatics, 31, 166–169. 10.1093/bioinformatics/btu638. [DOI] [PMC free article] [PubMed] [Google Scholar]
- Bligh, E. G. , & Dyer, W. J. (1959). A rapid method of total lipid extraction and purification. Canadian Journal of Biochemistry and Physiology, 37, 911–917. 10.1139/o59-099. [DOI] [PubMed] [Google Scholar]
- Breuer, D. A. , Pacheco, M. C. , Washington, M. K. , Montgomery, S. A. , Hasty, A. H. , & Kennedy, A. J. (2020). CD8 + T cells regulate liver injury in obesity‐related nonalcoholic fatty liver disease. American journal of physiology. Gastrointestinal and liver physiology, 318, G211–G224. 10.1152/ajpgi.00040.2019. [DOI] [PMC free article] [PubMed] [Google Scholar]
- Carpenter, B. , Gelman, A. , Hoffman, M. D. , Lee, D. , Goodrich, B. , Betancourt, M. , Brubaker, M. A. , Guo, J. , Li, P. , & Riddell, A. (2017). Stan: a probabilistic programming language. Journal of Statistical Software, 76, 10.18637/jss.v076.i01. [DOI] [PMC free article] [PubMed] [Google Scholar]
- Chen, W. , Chang, B. , Wu, X. , Li, L. , Sleeman, M. , & Chan, L. (2013). Inactivation of Plin4 downregulates Plin5 and reduces cardiac lipid accumulation in mice. American Journal of Physiology. Endocrinology and Metabolism, 304, E770–E779. 10.1152/ajpendo.00523.2012. [DOI] [PMC free article] [PubMed] [Google Scholar]
- Horodyska, J. , Hamill, R. M. , Reyer, H. , Trakooljul, N. , Lawlor, P. G. , McCormack, U. M. , & Wimmers, K. (2019). RNA‐Seq of liver from pigs divergent in feed efficiency highlights shifts in macronutrient metabolism, hepatic growth and immune response. Frontiers in Genetics, 10, 117. 10.3389/fgene.2019.00117. [DOI] [PMC free article] [PubMed] [Google Scholar]
- Janciauskiene, S. , Larsson, S. , Larsson, P. , Virtala, R. , Jansson, L. , & Stevens, T. (2004). Inhibition of lipopolysaccharide‐mediated human monocyte activation, in vitro, by α 1‐antitrypsin. Biochemical and Biophysical Research Communications, 321, 592–600. 10.1016/j.bbrc.2004.06.123. [DOI] [PubMed] [Google Scholar]
- Kiefer, F. W. , Orasanu, G. , Nallamshetty, S. , Brown, J. D. , Wang, H. , Luger, P. , Qi, N. R. , Burant, C. F. , Duester, G. , & Plutzky, J. (2012). Retinaldehyde dehydrogenase 1 coordinates hepatic gluconeogenesis and lipid metabolism. Endocrinology, 153, 3089–3099. 10.1210/en.2011-2104. [DOI] [PMC free article] [PubMed] [Google Scholar]
- Kumar, K. G. , Trevaskis, J. L. , Lam, D. D. , Sutton, G. M. , Koza, R. A. , Chouljenko, V. N. , Kousoulas, K. G. , Rogers, P. M. , Kesterson, R. A. , Thearle, M. , Ferrante, A. W. , Mynatt, R. L. , Burris, T. P. , Dong, J. Z. , Halem, H. A. , Culler, M. D. , Heisler, L. K. , Stephens, J. M. , & Butler, A. A. (2008). Identification of adropin as a secreted factor linking dietary macronutrient intake with energy homeostasis and lipid metabolism. Cell Metabolism, 8, 468–481. 10.1016/j.cmet.2008.10.011. [DOI] [PMC free article] [PubMed] [Google Scholar]
- Lesourne, R. , Uehara, S. , Lee, J. , Song, K.‐D. , Li, L. , Pinkhasov, J. , Zhang, Y. , Weng, N. , Wildt, K. F. , Wang, L. , Bosselut, R. , & Love, P. E. (2009). Themis, a T cell–specific protein important for late thymocyte development. Nature Immunology, 10, 840–847. 10.1038/ni.1768. [DOI] [PMC free article] [PubMed] [Google Scholar]
- Li, Z. Z. , Berk, M. , McIntyre, T. M. , & Feldstein, A. E. (2009). Hepatic lipid partitioning and liver damage in nonalcoholic fatty liver disease: role of stearoyl‐CoA desaturase. Journal of Biological Chemistry, 284, 5637–5644. 10.1074/jbc.M807616200. [DOI] [PMC free article] [PubMed] [Google Scholar]
- Marshall, A. , Lukk, M. , Kutter, C. , Davies, S. , Alexander, G. , & Odom, D. T. (2013). Global gene expression profiling reveals SPINK1 as a potential hepatocellular carcinoma marker. PLoS One, 8, e59459. 10.1371/journal.pone.0059459. [DOI] [PMC free article] [PubMed] [Google Scholar]
- McCarthy, D. J. , Chen, Y. , & Smyth, G. K. (2012). Differential expression analysis of multifactor RNA‐Seq experiments with respect to biological variation. Nucleic Acids Research, 40, 4288–4297. 10.1093/nar/gks042. [DOI] [PMC free article] [PubMed] [Google Scholar]
- Mukiibi, R. , Vinsky, M. , Keogh, K. A. , Fitzsimmons, C. , Stothard, P. , Waters, S. M. , & Li, C. (2018). Transcriptome analyses reveal reduced hepatic lipid synthesis and accumulation in more feed efficient beef cattle. Scientific Reports, 8, 7303. 10.1038/s41598-018-25605-3. [DOI] [PMC free article] [PubMed] [Google Scholar]
- Nasias, D. , Evangelakos, I. , Nidris, V. , Vassou, D. , Tarasco, E. , Lutz, T. A. , & Kardassis, D. (2019). Significant changes in hepatic transcriptome and circulating miRNAs are associated with diet‐induced metabolic syndrome in apoE3L.CETP mice. Journal of Cellular Physiology, 234, 20485–20500. 10.1002/jcp.28649. [DOI] [PubMed] [Google Scholar]
- Paalvast, Y. , Gerding, A. , Wang, Y. , Bloks, V. W. , van Dijk, T. H. , Havinga, R. , Willems van Dijk, K. , Rensen, P. C. N. , Bakker, B. M. , Kuivenhoven, J. A. , & Groen, A. K. (2017). Male apoE*3‐Leiden.CETP mice on high‐fat high‐cholesterol diet exhibit a biphasic dyslipidemic response, mimicking the changes in plasma lipids observed through life in men. Physiological Reports, 5, 1–18. 10.14814/phy2.13376. [DOI] [PMC free article] [PubMed] [Google Scholar]
- Paradis, F. , Yue, S. , Grant, J. R. , Stothard, P. , Basarab, J. A. , & Fitzsimmons, C. (2015). Transcriptomic analysis by RNA sequencing reveals that hepatic interferon‐induced genes may be associated with feed efficiency in beef heifers. Journal of Animal Science, 93, 3331–3341. 10.2527/jas.2015-8975. [DOI] [PubMed] [Google Scholar]
- Ramayo‐Caldas, Y. , Ballester, M. , Sánchez, J. P. , González‐Rodríguez, O. , Revilla, M. , Reyer, H. , Wimmers, K. , Torrallardona, D. , & Quintanilla, R. (2018). Integrative approach using liver and duodenum RNA‐Seq data identifies candidate genes and pathways associated with feed efficiency in pigs. Scientific Reports, 8, 558. 10.1038/s41598-017-19072-5. [DOI] [PMC free article] [PubMed] [Google Scholar]
- Robinson, M. D. , McCarthy, D. J. , & Smyth, G. K. (2010). edgeR: a Bioconductor package for differential expression analysis of digital gene expression data. Bioinformatics, 26, 139–140. 10.1093/bioinformatics/btp616. [DOI] [PMC free article] [PubMed] [Google Scholar]
- Rozendaal, Y. J. W. , Wang, Y. , Hilbers, P. A. J. , & van Riel, N. A. W. (2019). Computational modelling of energy balance in individuals with Metabolic Syndrome. BMC Systems Biology, 13, 24. 10.1186/s12918-019-0705-z. [DOI] [PMC free article] [PubMed] [Google Scholar]
- Rozendaal, Y. J. W. , Wang, Y. , Paalvast, Y. , Tambyrajah, L. L. , Li, Z. , Willems van Dijk, K. , Rensen, P. C. N. , Kuivenhoven, J. A. , Groen, A. K. , Hilbers, P. A. J. , & van Riel, N. A. W. (2018). In vivo and in silico dynamics of the development of metabolic syndrome. PLoS Computational Biology, 14, e1006145 10.1371/journal.pcbi.1006145. [DOI] [PMC free article] [PubMed] [Google Scholar]
- Shaw, N. , Elholm, M. , & Noy, N. (2003). Retinoic acid is a high affinity selective ligand for the peroxisome proliferator‐activated receptor beta/delta. Journal of Biological Chemistry, 278, 41589–41592. 10.1074/jbc.C300368200. [DOI] [PubMed] [Google Scholar]
- Soltis, A. R. , Kennedy, N. J. , Xin, X. , Zhou, F. , Ficarro, S. B. , Yap, Y. S. , Matthews, B. J. , Lauffenburger, D. A. , White, F. M. , Marto, J. A. , Davis, R. J. , & Fraenkel, E. (2017). Hepatic dysfunction caused by consumption of a high‐fat diet. Cell Reports, 21, 3317–3328. 10.1016/j.celrep.2017.11.059. [DOI] [PMC free article] [PubMed] [Google Scholar]
- Tarasco, E. , Pellegrini, G. , Whiting, L. , & Lutz, T. A. (2018). Phenotypical heterogeneity in responder and nonresponder male ApoE*3Leiden.CETP mice. American Journal of Physiology. Gastrointestinal and Liver Physiology, 315, G602–G617. 10.1152/ajpgi.00081.2018. [DOI] [PubMed] [Google Scholar]
- van den Hoek, A. M. , van der Hoorn, J. W. A. , Maas, A. C. , van den Hoogen, R. M. , van Nieuwkoop, A. , Droog, S. , Offerman, E. H. , Pieterman, E. J. , Havekes, L. M. , & Princen, H. M. G. (2014). APOE*3Leiden.CETP transgenic mice as model for pharmaceutical treatment of the metabolic syndrome. Diabetes, Obesity & Metabolism, 16, 537–544. 10.1111/dom.12252. [DOI] [PubMed] [Google Scholar]
- Westerterp, M. , van der Hoogt, C. C. , de Haan, W. , Offerman, E. H. , Dallinga‐Thie, G. M. , Jukema, J. W. , Havekes L. M., & Rensen P. C. N. (2006). Cholesteryl ester transfer protein decreases high‐density lipoprotein and severely aggravates atherosclerosis in APOE*3‐Leiden mice. Arteriosclerosis, Thrombosis, and Vascular Biology, 26, 2552–2559. 10.1161/01.ATV.0000243925.65265.3c. [DOI] [PubMed] [Google Scholar]
- Zhang, N. , Geng, T. , Wang, Z. , Zhang, R. , Cao, T. , Camporez, J. P. , Cai, S. , Liu, Y. , Dandolo, L. , Shulman, G. I. , Carmichael, G. G. , Taylor, H. S. , & Huang, Y. (2018). Elevated hepatic expression of H19 long noncoding RNA contributes to diabetic hyperglycemia. JCI Insight, 3, 10.1172/jci.insight.120304. [DOI] [PMC free article] [PubMed] [Google Scholar]
- Zhao, Y. , Hou, Y. , Liu, F. , Liu, A. , Jing, L. , Zhao, C. , Luan, Y. , Miao, Y. , Zhao, S. , & Li, X. (2016). Transcriptome analysis reveals that vitamin A metabolism in the liver affects feed efficiency in Pigs. G3 (Bethesda), 6, 3615–3624. 10.1534/g3.116.032839. [DOI] [PMC free article] [PubMed] [Google Scholar]
- Ziouzenkova, O. , & Plutzky, J. (2008). Retinoid metabolism and nuclear receptor responses: New insights into coordinated regulation of the PPAR‐RXR complex. FEBS Letters, 582, 32–38. 10.1016/j.febslet.2007.11.081. [DOI] [PubMed] [Google Scholar]