

Abstract
The ability of S. aureus to infect bone and osteoblasts is correlated with its incredible virulence armamentarium that can mediate the invasion/internalization process, cytotoxicity, membrane damage, and intracellular persistence. We comparatively analyzed the interaction, persistence, and modulation of expression of selected genes and cell viability in an ex vivo model using human MG‐63 osteoblasts of two previously studied and well‐characterized S. aureus clinical strains belonging to the ST239‐SCCmecIII‐t037 and ST228‐SCCmecI‐t041 clones at 3 h and 24 h post‐infection (p.i). S. aureus ATCC12598 ST30‐t076 was used as a control strain. Using imaging flow cytometry (IFC), we found that these strains invaded and persisted in MG‐63 osteoblasts to different extents. The invasion was evaluated at 3 h p.i and persistence at 24 h p.i., in particular: ATCC12598 internalized in 70% and persisted in 50% of MG‐63 cells; ST239‐SCCmecIII internalized in 50% and persisted in 45% of MG‐63 cells; and ST228‐SCCmecI internalized in 30% and persisted in 20% of MG‐63 cells. During the infection period, ST239‐III exerted significant cytotoxic activity resulting from overexpression of hla and psmA and increased expression of the genes involved in adhesion, probably due to the release and re‐entry of bacteria inside MG‐63 cells at 24 h p.i. The lower invasiveness of ST228‐I was also associated with non‐cytotoxic activity inside osteoblasts. This clone was unable to activate sufficient cellular reaction and succumbed inside MG‐63 cells. Our findings support the idea of considering new strategies, based on a translational approach—eukaryotic host–pathogen interaction (EHPI)—and to be applied on a large scale, to predict S. aureus /osteoblast interaction and treat bone infections. Such strategies rely on the study of the genetic and biochemical basis of both pathogen and host.
Keywords: crosstalk mechanism, MRSA, osteoblast, ST228, ST239, virulence toxin
Using imaging flow cytometry analysis, we found that strains differently invaded osteoblasts after 3 h and 24 h: ST239‐SCCmecIII in 50% and 45% and ST228‐SCCmecI in 30% and 20%, respectively. ST239‐III exerted a significant cytotoxic activity due to the overexpression of hla and psmA and the increased expression of the genes involved in adhesion, probably due to the release and re‐entry of bacteria inside MG‐63 at 24 h p.i. The lower invasiveness of ST228‐I was also correlated with the non‐cytotoxic activity inside osteoblasts.
![]()
1. INTRODUCTION
The human pathogen Staphylococcus aureus can adapt to the host/environment, infect any organ, and damage tissues, causing severe infections, and can resist antibiotics, in particular beta‐lactams and methicillin (Tong et al., 2015). It is one of the main pathogens responsible for recurrent osteomyelitis (OM), accounting for 50% to 70% of cases, and prosthetic joint infections (PJIs) (Mruk & Record, 2012; Wu et al., 2019). PJIs can have a dramatic impact on a patient's quality of life, often requiring surgical intervention and prosthesis removal, as well as prolonged antibiotics treatment (Moore et al., 2017; Purrello et al., 2016; Stefani et al., 2012). These infections are often due to healthcare‐associated methicillin‐resistant S. aureus (HA‐MRSA) belonging to clonal complex 5 (Muñoz‐Gallego et al., 2017; Peng et al., 2019; Pérez‐Montarelo et al., 2018) and associated with the staphylococcal chromosomal cassette (SCCmec) I and III (Hussain et al., 2009). Among them, ST239‐III is probably the oldest pandemic MRSA clone, first discovered in 1970, isolated in most countries worldwide, and the most widespread in Europe (Campanile et al., 2015; Monecke et al., 2018; Szymanek‐Majchrzak et al., 2018). ST228‐SCCmecI is one of the most widespread clones in Italy, associated with nosocomial infections (Bongiorno et al., 2018; Campanile et al., 2012).
Assessing the interaction between S. aureus isolates and osteoblasts during PJIs and OM includes three crucial events: adhesion, invasion, and post‐invasion, where S. aureus controls the expression of adhesion and virulence determinants with its large armamentarium of regulatory genes.
Many studies have been carried out in this field. Different authors have shown the role of many regulators involved in the invasion and adaptation to host tissue. The role of sigB in persistence and stress response, together with its link to sarA and, consequently, to its action on the agr locus was studied in osteoblasts, in an in vivo model, using two different strains of S. aureus; in particular, the authors used the wild‐type and the defective strain for agr, sigB, and sarA (Tuchscherr et al., 2015). The global regulatory system—agr locus—cell density‐dependent, controls virulence factor expression. Through its effector molecule RNAIII, the agr locus controls the post‐transcriptional regulation of proteins involved in cell–surface interaction and virulence cytotoxic factors (Painter et al., 2014).
Two other genes belonging to the SARA protein family are involved in the regulation of virulence genes: sarS (SarH1), whose expression is repressed by sarA and agr, is a repressor of hla and etb and is a positive regulator of spa and rot, the “repressor of toxin,” which is a repressor of enterotoxin B (seb) and alpha‐toxin (hla) and is repressed by the agr effector RNAIII and SarA (Jenul & Horswill, 2018).
In the process of adhesion, cell surface proteins (adhesins) of the Microbial Surface Component Recognizing Adhesive Matrix Molecules (MSCRAMM) play an important role in the pathogenesis of osteoarticular infections (OM and PJIs). Among these, an important role is played by: the fibronectin‐binding proteins A and B (FnbA/B); the fibrinogen‐binding protein clumping factors A and B (ClfA/B); the bone sialoprotein binding protein (Bbp); the collagen adhesin (CNA) (Otsuka et al., 2006; Pérez‐Montarelo et al., 2018); and SdrE, a serine–aspartate (SD) protein that anchors the cell wall interacting with complement factor H and facilitates colonization through adherence to the cell surface or extracellular matrix (ECM) components (Herr & Thorman, 2017).
S. aureus can invade endothelial cells and osteoblasts using the cell surface integrin α5β1, binding Fn on the surface of human cells. In particular, as already demonstrated, FnBPA and FnBPB are involved not only in adhesion but also in internalization (Shinji et al., 2011). Pore‐forming proteins, such as Panton–Valentine leukocidin (PVL) and α‐ and δ‐hemolysin (Hla and Hld), together with phenol‐soluble modulins (PSMs), were able to induce local complications such as bone deformation, systemic complications as severe sepsis in rabbit osteomyelitis, or neutrophil and osteoblast cytotoxicity in an ex vivo model (Davido et al., 2016). The hla gene was frequently present in strains associated with osteoarticular bacteremia (Pérez‐Montarelo et al., 2018). PSMs are small peptides with amphipathic properties that destabilize the lipid bilayer of the host cell; this activity is related to receptor‐independent cytotoxicity to osteoblasts and specialized cells such as the neutrophils. PSMs are also implicated in biofilm formation, in bacterial interference, and in cell‐cycle disruptions (Davido et al., 2016).
During the infection process, S. aureus can use alternative carbon sources and, in particular, glucose‐6‐phosphate (G6P); the uptake of these alternative carbon sources occurs through the hexose phosphate antiporter UhpT (Yang et al., 2016).
After observing that interaction, internalization, and persistence during an ex vivo osteoblast infection are a strain‐dependent process, we selected two strains belonging to different genetic backgrounds showing a preliminary difference in their ability to internalize as a model of infection to study how differently they adapt their strategies to react to changing environmental conditions and how they adjust their virulence factor expression at different times of infection inside the MG‐63 cell line.
2. MATERIALS AND METHODS
2.1. Strains included in the study
The study sample consisted of 2 invasive MRSA isolates, 2SA ST239‐SCCmecIII‐t036 and 10SA ST228‐SCCmecI‐t041, already molecularly characterized using internationally recognized standard genotyping methods to determine MRSA clones. These strains were selected from a large collection of 15 MRSA strains phenotypically and molecularly (SCCmec‐spa type) characterized as previously reported (Bongiorno et al., 2018; Campanile et al., 2015) and tested for their ability to internalize and persist in MG‐63 human osteoblasts (Bongiorno et al., 2020).
The invasive ATCC12598 isolate (Cowan ST30‐t076) (ATCC® Standards Development Organization, LGC Standards S.r.l.) was used, as previously described, as a control strain for invasion and persistence assays and the statistical analysis of the results obtained at imaging flow cytometry (IFC), as previously reported (Bongiorno et al., 2020).
2.2. agr, toxin, and MSCRAMM characterization
The genomic DNA used as a template for PCR amplification was extracted with QIAamp® DNA Mini Kit (cat. No. 51306, Qiagen) following the manufacturer's instructions with some modifications. Briefly, a bacterial suspension was centrifuged and the pellet was resuspended in 200 μl of physiological saline solution 0.9% and subjected to freezing and thawing twice. After centrifugation, the bacterial pellet was resuspended in 180 µl of enzyme solution: 20 mg/ml lysozyme (cat. No. 10837059001, Sigma‐Aldrich, Merck KGaA) and 100 μg/ml lysostaphin (cat. No. L7386‐15MG, Sigma‐Aldrich, Merck KGaA) in Tris‐EDTA (TE) buffer, pH 8.0 (cat. No. AM9849, Ambion, Invitrogen). Apart from these differences, the indications provided by the manufacturer were followed.
The toxin and MSCRAMM genes included in the study and listed in Table A1 were tested as previously described (Stefani et al., 2009). The agr locus was typed using a multiplex PCR assay (Gilot et al., 2002). The cna gene was PCR‐tested using the following primers in 5ʹ‐3ʹ: F‐GGAAAACGACCAACTGAAATCAAAG, R‐TCTGGCGTATATTTATTCGTCACAATC. PCR was performed at 57°C, the product size was 239 bp, and the MW2 strain was used as an internal control.
PCR amplification was carried out in a Veriti Thermal Cycler (Applied Biosystems, Thermo Fisher) in a total volume of 25 µl containing 2× Multiplex PCR Master Mix (cat. No. BR0200804, biotechrabbit GmbH) and 10 ng template DNA.
2.3. δ‐Hemolysin production
δ‐Hemolysis production was evaluated by cross‐streaking perpendicularly our sample to S. aureus RN4220, using 5% sheep blood agar Columbia base with 6 mg/L vancomycin, as previously described. The S. aureus reference strains Mu3 (hVISA) and MU50 (VISA) were used as controls for strong hemolysis activity, and NRS149 (VSSA) was used as a control for absent hemolysis activity (Cafiso, Bertuccio, Spina, Purrello, Blandino, et al., 2012).
2.4. Eukaryotic cell culture preparation
Infection experiments were performed on the human osteosarcoma cell line MG‐63 (ATCC® CRL‐1427™, Standards Development Organization, LGC Standards S.r.l.), as previously described (Bongiorno et al., 2020).
A single 6‐well plate was used for the imaging flow cytometry (IFC), a single 6‐well plate was used for RNA extraction, and a 96‐well plate was used for the evaluation of eukaryotic cell metabolism. All experiments were performed twice in triplicate.
2.5. Evaluation of the frequency of internalization and intracellular persistence by IFC
The frequency of internalization was evaluated in a cell culture model of infection in MG‐63 osteoblasts at a multiplicity of infection (MOI) of 100:1, as previously reported (Bongiorno et al., 2020). In this work, we evaluated, by IFC, bacterial internalization at 3 h p.i., and persistence at 24 h p.i, as previously reported (Bongiorno et al., 2020). Briefly, bacterial isolates were grown in Brain Heart Infusion Broth (BHI) (cat. No. CM1135, Oxoid Limited, Thermo Fisher Scientific Inc) at 37°C overnight. The bacterial concentration was evaluated by optical density (OD) at 600 nm. Bacterial suspensions were prepared using MEM supplemented with 10% fetal bovine serum (FBS) (cat. No. 16000044, GIBCOTM, Thermo Fisher Scientific). MG‐63 cultures were infected for 2 h and 24 h in antibiotic‐free conditions; extracellular bacterial lysis was carried out for 1 h at 37°C with 100 mg/ml lysostaphin (cat. No. L7386‐15MG, Sigma‐Aldrich, Merck KGaA). Infected cells were first washed with 1X phosphate‐buffered saline (PBS) (cat. No. P5493, Sigma‐Aldrich, Merck), followed by an incubation step of 3–5 min at 37°C with 0.05% trypsin‐EDTA solution (cat. No. T4049, Sigma‐Aldrich, Merck). The cellular suspension was reversibly permeabilized with saponin 0.1% (cat. No. 558255, Sigma‐Aldrich, Merck) in PBS. Saponin interacts with membrane cholesterol, selectively removing it and leaving holes in the membrane. This transient permeabilization does not require cell fixing. After 15 min in saponin, bacterial cells were labeled with 0.08 μg/ml BODIPY™ FL‐Vancomycin (VBFL) (cat. No. V34850, Invitrogen™), the membrane‐impermeable green fluorochrome vancomycin analog that specifically binds the cell‐wall peptidoglycan of Gram‐positive bacteria and does not penetrate intact cells. The suspensions were then washed three times with PBS to remove the transient permeabilization and checked under the microscope to ensure that the cells had maintained their cell integrity and that their cell wall was intact. The labeled cellular suspension was analyzed using a FlowSight® Imaging Flow Cytometer (Amnis® FlowSight® Millipore, Merck).
We acquired 10,000 events per sample, and as quality control, we used the stained and unstained bacterial suspension to exclude autofluorescence; a negative control of infected, but not permeabilized, cells was also acquired to guarantee the exclusively intracellular localization of green spots. Acquisition analysis was performed using the powerful INSPIRE® and IDEAS® software (Amnis, EMD Millipore).
2.6. Eukaryotic cellular metabolic assay
To evaluate the metabolic status of MG‐63 cells following infection with S. aureus for 3 h p.i. and 24 h p.i., we used the MTT ([3‐(4,5‐dimethylthiazol‐2‐yl)‐2,5‐diphenyltetrazolium bromide]) assay (Fresta et al., 2018; Pedotti et al., 2017). The formazan crystals obtained at the end of the procedure were dissolved by dimethyl sulfoxide, and the multiplate reader Synergy™ H1 (BioTek) was used to determine the colorimetric differences, detected as absorbance at 569 nm, between samples. The values obtained for the infected cells were expressed as percent variation from the metabolic status detected in not infected (control) cells (as 100%).
2.7. qRT‐PCR expression study
We have investigated the expression level of transcription of some selected genes involved in the bacteria/osteoblast interaction. The primers used for real‐time PCR, reported in Table 1, were designed by the Flexi® Vector Primer Design Tool. Real‐time PCR experiments on the total RNA extracted from infected cell cultures were carried out at 3 h p.i. and 24 h p.i.
TABLE 1.
Regulators, MSCRAMMs, toxins, and other genes used to evaluate gene expression in real‐time PCR
| Gene expression evaluated in real‐time PCR | |||||
|---|---|---|---|---|---|
| Category | Gene | Product size bp | Function | Primer Sequence 5’‐3’ | GenBank Acc. number |
| Regulators | sigB | 103 | RNA polymerase sigma factor, in response to changes in environmental conditions. |
ATGTACGTTTATTGAAGGATTG AGAACGGCAATTAAGAAATTA |
AY197753.1 |
| sarA | 151 | Transcription regulator, regulating the expression of virulence factors |
ACATGGCAATTACAAAAATCAATGAT CATCAGCGAAAACAAAGAGAAAGA |
U46541.1 | |
| sarS | 187 | Transcription regulator, regulating the expression of virulence factors |
TCAACAAGAAAACACACTTCCAT ACGTTCTGCAATTTTCTCTCGT |
NC_7793 | |
| agrA | 145 | Accessory gene regulator‐mediated quorum sensing plays a major role in staphylococcal pathogenesis |
Aactgcacatacacgcttaca aaatctcacagactcattgcc |
BX571856.1 | |
| rot | 168 | Repressor of toxins regulatory protein |
CGGGATTGTTGGGATGTTTG TCGCTTTCAATCTCGCTGAA |
CP_026073 | |
| MSCRAMMs | bbp | 172 | Adhesin binding to bone sialoprotein |
GATGCTAATGAACCTGGTATCAAAGAT CAGGTTACACGCCAACGGTTA |
BX571856.1 |
| fnbA | 75 | Adhesin binding to fibronectin and elastin |
ACAAGTTGAAGTGGCACAGCC CCGCTACATCTGCTGATCTTGTC |
KP096552.1 | |
| fnbB | 87 | Adhesin binding to fibronectin and elastin |
TTCCTGTAGTTTCCTTATCAGCAACTT GCTTGCACAGTTGTTGGTG |
BA000033.2 | |
| sdrE | 211 | surface protein serine‐aspartate repeat protein E |
GGCGACGGTACTGTTAAACC CTCCGTCTTTCAAACCACCG |
NC_007793 | |
| Toxins | psmα | 198 | Phenol‐soluble modulin α |
TCATCGCTGGCATCATTAAAGTTA ATAGATATGAACATCTTATTTGAAGGGG |
JQ066321.1 |
| hla | 202 | α‐hemolysin |
caactgataaaaaagtaggctggaaagtgat ctctattatcttcagggttttcaccaga |
BA000033.2 | |
| hld | 187 | Delta‐hemolysin |
TGGTTATTAAGTTGGGATGGCT GGAAGGAGTGATTTCAATGGCA |
NC_007793 | |
| Others | UhpT | 195 | hexose phosphate antiporter |
GTCGTCGTGCAATTGTAGCT CGTTTGCTACACTGATGGCA |
NC_007793 |
| gyrB | 160 | DNA gyrase subunit B |
GTGAAGGTATGACAGCAATTATATCTATCAA ATATGAAAATCCACAAGTCGCACG |
BX571856.1 | |
RNA extraction was performed using the RNeasy Mini Kit (cat. No. 74104, Qiagen, Milan) following the manufacturer's instructions, with some modifications. Briefly, bacteria internalized in MG‐63 at 3 h p.i. and 24 h p.i. were collected in 500 μl of RNAprotect Bacteria buffer (cat. No. 76506, Qiagen). This first reaction series was carried out at a controlled temperature of about 4°C, vortexed, and incubated for 5 min at room temperature. After centrifugation, the pellet was resuspended in 100 μl of TE buffer containing: 20 µl QIAGEN Proteinase K (cat. No. 9131, Qiagen), 150 mg/ml lysozyme (cat. No. 10837059001, Sigma‐Aldrich, Merck KGaA), and 20 mg/ml lysostaphin (cat. No. L7386‐15MG, Sigma‐Aldrich, Merck KGaA). Apart from these differences, the indications provided by the manufacturer were followed.
RNA quality was tested by Qubit® 3.0 Fluorometer (cat. No. Q33216, Life Technologies, Thermo Fisher Scientific Monza) using the Qubit RNA HS Assay Kit (250 pg/µl and 100 ng/µl). The RNA was normalized at 100 ng to obtain the cDNA using the QuantiTect Reverse Transcription Kit (cat. No. 205311, Qiagen), and the amplifications were performed using the QuantiTect SYBR Green PCR Kit (cat. No. 204145, Qiagen) at a final cDNA concentration of 25 ng/µl and 2uM primers per PCR. Each sample amplification consisted of a total reaction volume of 10 μl (5 μl PCR Master Mix +1 μl specific primers +4 μl of cDNA (25 ng/µl). Reactions were run in triplicate under the following conditions: PCR initial activation step for 15 min at 95°C; denaturation for 15 s at 94°C; annealing for 30 s at 60°C; and extension for 30 s at 72°C, the acquisition of fluorescence was done for 50 cycles. The negative control consisted of a reaction in the absence of cDNA (5 μl PCR Master Mix +1 μl specific primers +4 μl of TE buffer) indicated as NTC (no template control).
qPCRs were performed in a LightCycler® 480 Real‐Time PCR System (Roche, Monza, Italy). PCR efficiencies, melting curve analysis, and expression rate were calculated using the LightCycler® 480 software (Roche, Monza, Italy). gyrB primers were used as the internal control.
The relative RNA expression level for each sample was calculated using the 2−ΔΔCT method (threshold cycle (CT) value of the gene of interest vs. CT value of the housekeeping gene) (Fresta et al., 2020). For accurate gene expression measurements with qRT‐PCR, the results were normalized to the housekeeping gene gyrB (Cafiso et al., 2014; Cafiso, Bertuccio, Spina, Purrello, Campanile, et al., 2012; Chen et al., 2012).
2.8. Statistical model
The statistical analysis and related graphs were obtained using GraphPad Prism 6 (GraphPad Software Inc.).
The statistical significance of cytofluorimetric analyses was assessed using Student's t test, and the number of single‐cell events analyzed was never below 9980 cells out of 10,000 events at the outset (Bongiorno et al., 2020). The statistical significance of the MTT assay was evaluated using ANOVA and Sidak's multiple comparison test (post hoc test). The statistical significance of the expression analysis was assessed using ordinary one‐way ANOVA and Bonferroni's multiple comparison test. The significance threshold was set to p‐value ≤0.05 (*), p‐value ≤0.01 (**), p‐value ≤0.001 (***), and p‐value ≤0.0001(****).
3. RESULTS
3.1. Genotypic characteristics, agr typing, and toxin detection
The molecular features of the strains in the study are reported in Table 2.
TABLE 2.
Molecular characteristics of the samples included in the study
| Code | ST‐SCCmec‐spa type‐agr type | Source | δ‐hemolysis | Pathotype profile | |||||||||||||||||||||||||||
|---|---|---|---|---|---|---|---|---|---|---|---|---|---|---|---|---|---|---|---|---|---|---|---|---|---|---|---|---|---|---|---|
| MSCRAMMs (adhesins) | Toxins | ||||||||||||||||||||||||||||||
| fnbA | icaA | sdrE | clfA | clfB | cna | luk‐PV | eta | etb | hlb | hld | hlg | tst | sea | seb | sec | sed | see | seg | seh | sei | sej | seK/q | sel | sem | sen | seo | sep | ||||
| ATCC12598 | ST30‐MSSA‐t976‐III | − | + | + | + | + | + | + | + | + | − | − | − | + | + | − | − | − | − | − | − | + | − | + | − | − | − | + | − | − | − |
| 2SA | ST239‐HAMRSA‐III‐t037‐I | Blood | + | + | + | + | + | + | + | − | − | − | + | + | + | − | − | − | − | − | − | − | − | − | − | − | − | − | − | − | − |
| 10SA | ST228‐HAMRSA‐I‐t041‐II | Blood | − | + | + | + | + | + | + | + | − | − | − | + | + | − | + | − | − | − | − | + | − | + | − | − | − | + | − | + | − |
Clone characterization through: ST—sequence type; SCCmec—Staphylococcal Cassette Chromosome mec; spa type—staphylococcal protein A; agr type—locus agr; delta—hemolysis production; fnbA—fibronectin‐binding protein A; icaA—intracellular adhesion; sdrE—platelet aggregation; clfA/B—clumping factor A/B; cna—adhesin binding to collagen; luk‐PV—Panton–Valentine leukocidin; eta/b—exfoliative toxin A/B; hlb/d/g—hemolysins beta/delta/gamma; tst—toxic shock syndrome toxin; seA‐P—Staphylococcal enterotoxin from A to P; spa—protein A; agr—accessory gene regulated.
S. aureus ATCC12598 was associated with agr type III, while ST239‐III was associated with agr type I and ST228‐I with agr type II. δ‐Hemolysis production was observed in ATCC12598 and ST239‐III but not in ST228‐I.
Genes responsible for adhesion, such as fnbA, icaA, clfA/B, cna, and sdrE (the latter being responsible for platelet aggregation), were present in all strains. The strain belonging to ST239‐III showed a toxin gene pattern extremely different from that of ATCC12598; in fact, neither the exfoliative toxin (eta/b genes) nor the toxic shock syndrome toxin (tst) and the staphylococcal enterotoxin (esA‐P genes) were found. ST228‐I showed a toxin gene pattern similar to ATCC12598 (luk‐PV, seg, sei, sem) besides carrying enterotoxin A and O genes (sea and seo). All strains showed the presence of hld, and hlg and ST239‐III also carried the hlb gene. All strains carried the genes responsible for adhesion/invasion, toxicity, and microbial metabolism used in the subsequent expression studies.
3.2. Evaluation of bacterial intracellular internalization and persistence
We used imaging flow cytometry (IFC) to evaluate the number of bacteria that internalized and persisted in MG‐63 cells. We previously demonstrated the power of IFC in precisely estimating the percentage of osteoblasts infected with S. aureus strains in a sample of 10,000 MG‐63 cells. Here, we report the internalization rate, expressed as a percentage of internalization at 3 h p.i. and the persistence rate at 24 h p.i (Figure 1 and Table 3).
FIGURE 1.
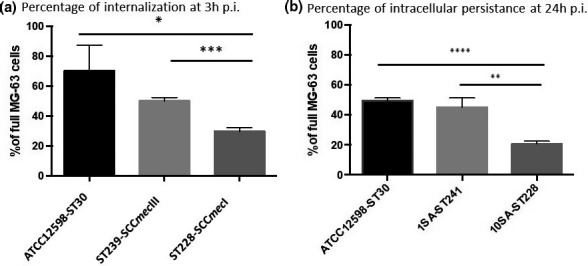
Evaluation of the internalization frequency by IFC evaluation and cellular metabolism viability, at 3 h p.i. and 24 h p.i. at an MOI of 100:1. (a) The graph reports the percentage of spots at 3 h p.i. for cell ±SD for each strain for three different experiments. (b) The graph reports the percentage of spots at 24 h p.i. for cell ±SD for each strain for three different experiments. Statistical data were obtained using Student's t test versus ATCC12598: p‐value, 95% confidence interval, and R‐squared. Statistically significant p‐value: ≤0.05*; ≤0.01**; ≤0.001***; and ≤0.0001****
TABLE 3.
Evaluation of the internalization frequency by IFC evaluation and cellular metabolism viability, at 3 h p.i. and 24 h p.i. at an MOI of 100:1
| Student's t‐test | ST239‐SCCmecIII versus ATCC12598‐ST30 | ST228‐SCCmecI versus ATCC12598‐ST30 | ST228‐SCCmecI versus ST239‐SCCmecIII |
|---|---|---|---|
| A. Statistical details of internalization at 3 h p.i. | |||
| p‐value | 0.1138 | 0.0152 | 0.0004 |
| p value summary | ns | * | *** |
| Significantly different? (p < 0.05) | No | Yes | Yes |
| 95% confidence interval | −47.57 to 7.527 | −68.02 to −12.90 | −25.62 to −15.26 |
| R squared | 0.5044 | 0.8059 | 0.9677 |
| B. Statistical details of internalization at 24 h p.i. | |||
| p‐value | 0.3226 | <0.0001 | 0.0028 |
| p‐value summary | ns | **** | ** |
| Significantly different? (p < 0.05) | No | Yes | Yes |
| 95% confidence interval | −14.66 to 6.192 | −32.96 to −24.43 | −34.83 to −14.11 |
| R squared | 0.2411 | 0.9887 | 0.915 |
(A) The table reports the detailed statistics of internalization at 3 h p.i. (B) The table reports the detailed statistics of internalization at 24 h p.i. Statistical data were obtained using the Student's t‐test versus ATCC12598: p‐value, 95% confidence interval, and R‐squared. Statistically significant p‐value: ≤0.05*; ≤0.01**; ≤0.001***, ≤0.0001****.
At 3 h p.i., ATCC12598 internalized in 70 ± 17.04% of MG‐63 cells, a slightly lower ability to internalize was found for the ST239‐III clone (50.24 ± 2.26%), while ST228‐I showed the lowest internalization rate, at 29.8 ± 2.31% (p = 0.015). The lower ability to internalize the ST228‐I strain was also evident when compared to ST239‐III (p = 0.0004) (Figure 1a and Table 3A). Persistence inside cells was measured at 24 h p.i.: 49 ± 1.96% of the ATCC12598 bacterial cells persisted inside MG‐63 cells; the same ability to persist was found in the ST239‐III clone (45.2 ± 6.2%), while ST228‐I showed a lower rate of persistence, 20.7 ± 1.80% (p < 0.0001). The lower ability to persist of ST228‐I was also evident when compared to ST239‐III (p = 0.0028) (Figure 1b and Table 3B).
This technique allowed us to estimate the percentage of MG‐63 cells that were internalized (full vs. empty cells) and the number of bacteria that internalized in a sample of 10,000 MG‐63 cells; moreover, we were able to establish bacterial persistence at 24 h p.i.
3.3. Analysis of MG‐63 cell metabolic status
Alterations in the metabolic status of human osteoblasts induced during internalization and persistence were evaluated in the same experimental condition by analyzing the MG‐63 cell viability at 3 h p.i. and 24 h p.i. (Table 4).
TABLE 4.
Cellular metabolic status during infection and persistence. Cellular metabolic status was determined using the MTT assay
| MG‐63 cells infected with | % of cellular metabolic status | Significance | Standard deviation | Variation |
|---|---|---|---|---|
| (A) MG‐63 Cellular metabolic status at 3 h p.i. | ||||
| ATCC12598 | 112.27 | *** | 7.59 | +12.27 |
| ST239‐SCCmecIII | 97.53 | ### | 2.97 | −2.47 |
| ST228‐SCCmecI | 107.57 | *; θθθ | 8.82 | +7.57 |
| (B) MG‐63 cellular metabolic status at 24 h p.i. | ||||
| ATCC12598 | 92.89 | * | 4.25 | −7.11 |
| ST239‐SCCmecIII | 81.67 | ***; ### | 5.94 | −18.32 |
| ST228‐SCCmecI | 103.79 | ###; θθθ | 8.69 | +3.79 |
Data are the mean of at least 8 independent experiments and are expressed as a percent variation with respect to the cellular metabolic status detected in control, uninfected cells (100%). (A) Cellular metabolic status 3 h p.i. (B) cellular metabolic status at 24 h p.i. Statistical significance was assessed using ANOVA and Sidak's multiple comparison tests (post hoc test), and the threshold was set p‐value: Statistically significant p‐value: ≤0.05*; ≤0.01**; and ≤0.001***. Symbols used: (*) versus empty MG63 cells (control); (#)versus ATCC12598; (θ) versus ST239‐SCCmecIII.
At 3 h p.i., MG‐63 cells infected with ATCC12598 and ST228‐I strains showed a statistically significant increase of +12.27% (p < 0.001) and +7.57% (p < 0.05), respectively, in their metabolic activity compared with control uninfected MG‐63 cells, whereas the ST239 strain induced only a slight decrease in their metabolic activity (−2.47%).
A statistically significant decrease (p < 0.001) was found when comparing the cellular metabolic status of MG‐63 infected with ST239‐III versus ATCC12598, while no statistical difference was observed when comparing the toxicity of MG‐63 cells infected with ST228‐I versus ATCC12598. A statistical difference in the human cell metabolic status was detected by comparing MG‐63 infected with ST239‐III and ST228‐III with each other (p < 0.001) (Table 4A).
At 24 h p.i., ATCC12598 and ST239‐III intracellular persistence induced a statistically significant decrease of −7.11% (p < 0.05) and −18.32% (p < 0.001), respectively, in the metabolic activity of MG‐63 cells, compared with uninfected control cells, while the ST228‐I strain showed only a slight increase in their metabolic activity (+3.79%).
A statistically significant decrease (p < 0.001) was found when comparing the cellular metabolic status of MG‐63 cells infected with ST239‐III and ST228‐I versus ATCC12598. Statistically significant differences in MG‐63 cell metabolic status were found by comparing the results obtained from cells infected with ST239‐III and ST228‐I (p < 0.001) (Table 4B).
Testing MG‐63 cells viability led us to understand the changes in the cellular metabolic status that were induced at 3 h p.i. and at 24 h p.i by the different strains used in the study.
3.3.1. Expression studies
We decided to study the expression of different staphylococcal genes involved in regulation (sigB, sarA, sarS, agr, and rot), adhesion—MSCRAMMS (bbp, fnbA/B, and sdrE), toxicity (psmA, hla, and hld), and bacterial metabolism (uhpT) to look for a potential relationship between variation in gene expression and the ability of S. aureus to internalize and persist in MG‐63 cells, as well as their damaging potential.
During the experiments of MG‐63 cell infection, the RNA was extracted and the expression of some regulatory, adhesion, and toxin genes was evaluated at 3 h p.i. and 24 h p.i. in comparison with non‐internalized bacteria (baseline condition). All experiments were the average of three biological experiments and are reported in Figures 2, 3, 4 and Table 5, with genes subdivided based on their function.
FIGURE 2.
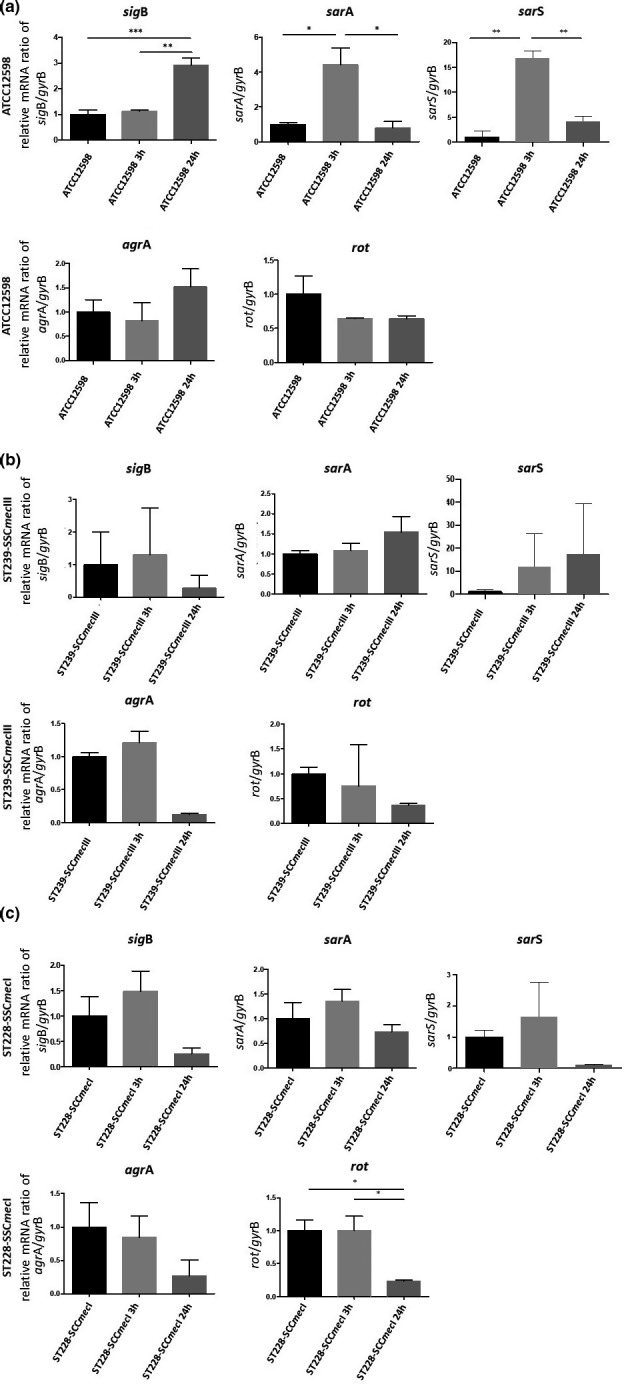
Evaluation of the relative mRNA expression of genes involved in regulation in ATCC12598, ST239, and ST228 strains at 3 h p.i. and 24 h p.i. versus baseline condition. Horizontal bars report the statistical analysis. Statistically significant p‐value ≤0.05 (*); ≤0.01 (**); and ≤0.001 (***)
FIGURE 3.
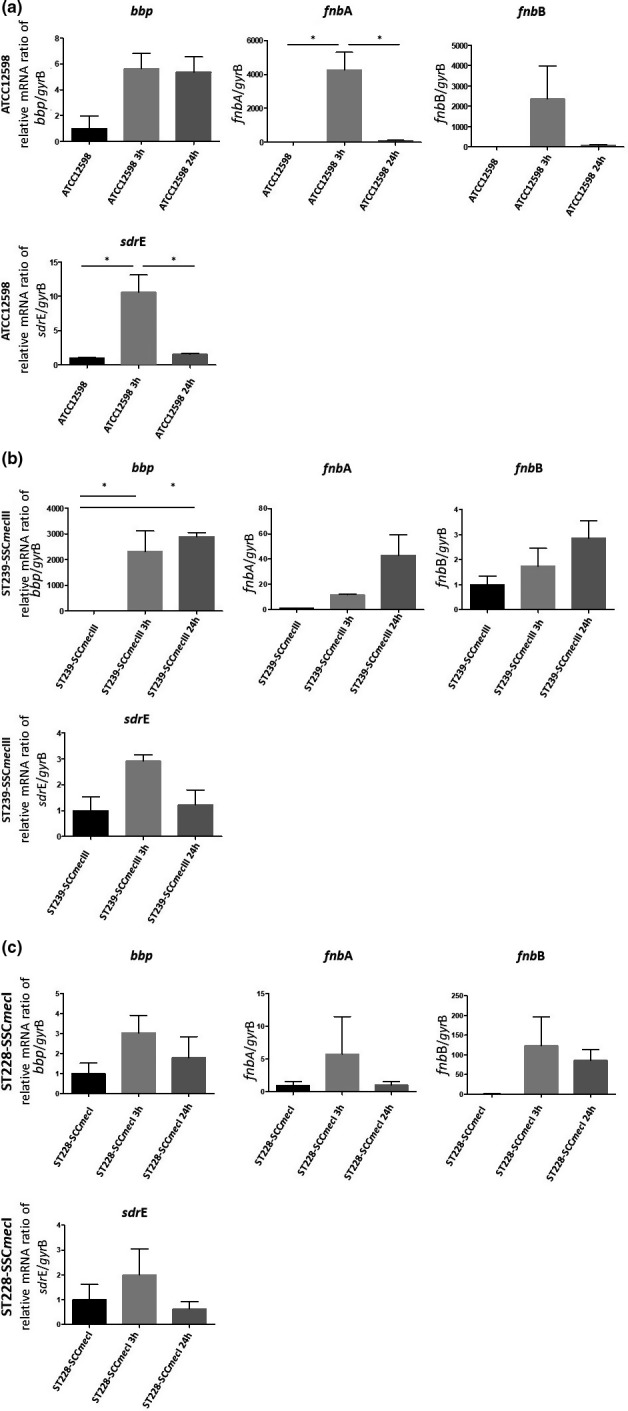
Evaluation of the relative mRNA expression of genes involved in regulation in ATCC12598, ST239, and ST228 strains at 3 h p.i. and 24 h p.i. versus baseline condition. Horizontal bars report the statistical analysis. Statistically significant p‐value ≤0.05 (*); ≤0.01 (**); ≤0.001 (***)
FIGURE 4.
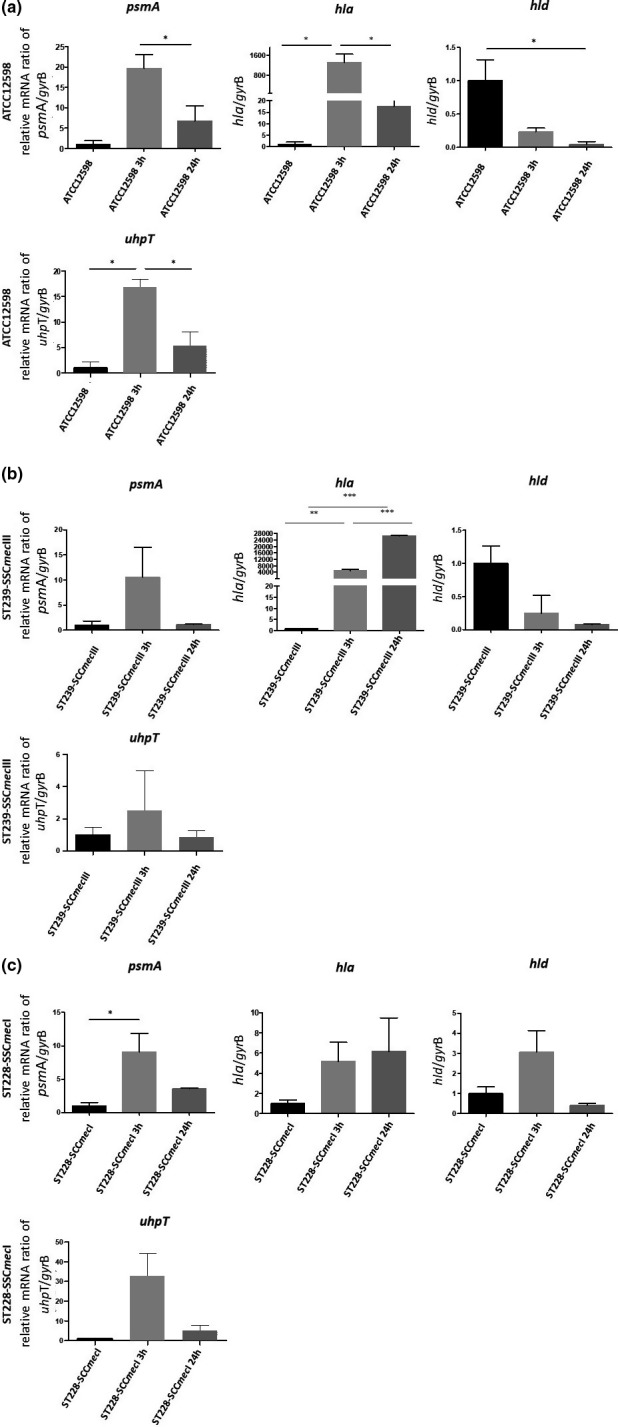
Evaluation of the relative mRNA expression of toxin and metabolic genes in ATCC12598, ST239, and ST228 strains at 3 h p.i. and 24 h p.i. versus baseline condition. Horizontal bars report statistical analysis. Statistically significant p‐value ≤0.05 (*); ≤0.01 (**); and ≤0.001 (***)
TABLE 5.
The up/down‐regulation of the genes considered in the study, at 3 h p.i. and 24 h p.i
| Regulator genes | sigB | sarA | sarS | agr | rot | ||||||||||
|---|---|---|---|---|---|---|---|---|---|---|---|---|---|---|---|
| Exp time | 3 h versus basal | 24 h versus basal | 3 h versus 24 h | 3 h versus basal | 24 h versus basal | 3 h versus 24 h | 3 h versus basal | 24 h versus basal | 3 h versus 24 h | 3 h versus basal | 24 h versus basal | 3 h versus 24 h | 3 h versus basal | 24 h versus basal | 3 h versus 24 h |
| ATCC12598 | = | **
|
***
|
*
|
ns= | *
|
**
|

|
**
|
= |
|

|
|
|
= |
| ST239‐SCCmecIII |
|
|
|
= |
|
|
|
|
|
|
|
|
|
|
|
| ST228‐SCCmecI |
|
|
|
|
|
|
|
|
|
|
|
|
= | *
|
*
|
| MSCRAMM genes | bbp | fnbA | fnbB | sdrE | ||||||||
|---|---|---|---|---|---|---|---|---|---|---|---|---|
| Exp time | 3 h versus basal | 24 h versus basal | 3 h versus 24 h | 3 h versus basal | 24 h versus basal | 3 h versus 24 h | 3 h versus basal | 24 h versus basal | 3 h versus 24 h | 3 h versus basal | 24 h versus basal | 3 h versus 24 h |
| ATCC12598 |
|
|
= | *
|
= | *
|
|
= |
|
*
|
= | *
|
| ST239‐SCCmecIII | *
|
*
|
|
|
|
|
|
|
|
|
= |
|
| ST228‐SCCmecI |
|
|
|
|
= |
|
|
|
|
|
|
|
| Toxin genes | psmA | hla | hld | ||||||
|---|---|---|---|---|---|---|---|---|---|
| Exp time | 3 h versus basal | 24 h versus basal | 3 h versus 24 h | 3 h versus basal | 24 h versus basal | 3 h versus 24 h | 3 h versus basal | 24 h versus basal | 3 h versus 24 h |
| ATCC12598 |
|
|
*
|
*
|
|
*
|
|
*
|
|
| ST239‐SCCmecIII |
|
= |
|
**
|
***
|
***
|
|
|
s
|
| ST228‐SCCmecI | *
|
|
|
|
|
|
|
|
|
| Other genes | uhpT | ||
|---|---|---|---|
| Exp time | 3 h versus basal | 24 h versus basal | 3 h versus 24 h |
| ATCC12598 | *
|
|
*
|
| ST239‐SCCmecIII |
|
= |
|
| ST228‐SCCmecI |
|
|
|
Statistically significance: not significant (gray arrow), p‐value: ≤0.05 (*); ≤0.01 (**); and ≤0.001 (***).
Up‐regulated.
Down‐regulated.
Up‐Regulated But No Significant difference.
Down‐regulated but no significant difference.
= same expression level as a basal condition.
The expression of the regulatory genes is reported in Figure 3, 4, 5 and Table 5.
FIGURE 5.
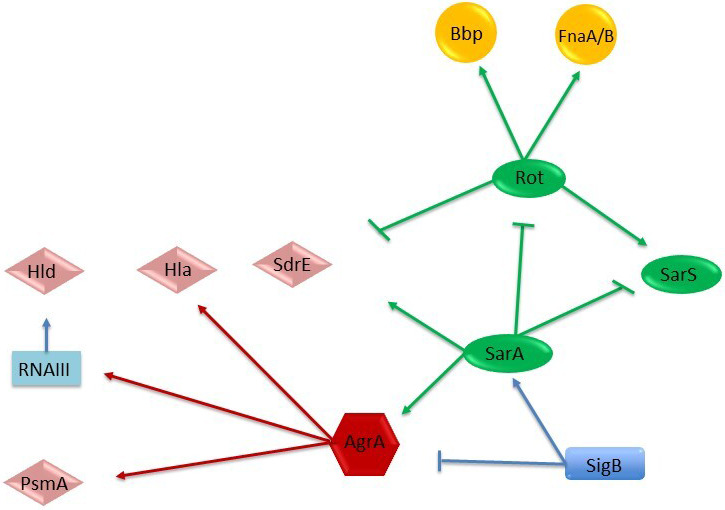
Regulation of adhesion and virulence determinants in S. aureus by global regulatory loci. Arrows stand for activation; bars for repression. The molecules that act as activators or repressors (members of SarA protein family, SarA, SarS, and rot), that is, regulating protease expression, are represented in green ovals; the alternate sigma factor (SigB) in blue rectangles; the agr quorum‐sensing system (AgrA) in red hexagons; the toxins in pink rumbles (Hla, Hld, SdrE, and PsmA); and the adhesion factors in yellow circles (Bbp and FnaA/B) (Jenul & Horswill, 2018; Romilly et al., 2014).
In ATCC12598, sigB was significantly up‐regulated at 24 h p.i, sarA and sarS were up‐regulated at 3 h p.i. In particular, the sigB gene mRNA expression showed a strong, statistically significant increase at 24 h p.i. (+2.92 ± 0.27‐fold change (fd); p ≤ 0.001) versus the baseline condition and comparing 24 h versus 3 h p.i. (p ≤ 0.01). The sarA gene mRNA expression showed an increase at 3 h versus baseline condition (+4.4 ± 0.98 fd, p ≤ 0.05) and a statistically significant decrease at 24 h versus baseline condition (+0.79 ± 0.36 fd, p ≤ 0.05). The sarS gene mRNA expression showed an increase at 3 h versus baseline condition (+7.45 ± 0.65 fd, p ≤ 0.01) and a statistically significant decrease at 24 h versus baseline condition (+1.83 ± 0.45 fd, p ≤ 0.01).
Although in the ST239‐III and ST228‐I strains the sigB, sarA, and sarS gene expressions were not statistically significant, some variations were observed compared with the baseline condition. In ST239‐III, the sigB gene expression showed a decrease at 24 h p.i; the sarA gene expression exhibited an increment at 24 h p.i., and the sarS gene expression showed a progressive increase at 3 h p.i. and 24 h p.i. In ST228‐I, the sigB, sarA, and sarS gene expression showed a slight increase at 3 h p.i., followed by a decrease at 24 h p.i.
The rot gene was significantly down‐regulated at 24 h p.i. in the ST228 strain only. The rot gene mRNA expression in the ST228 strain showed a statistically significant decrease at 24 h p.i. versus baseline condition (+0.23 ± 0.016 fd, p ≤ 0.05) and versus 3 h p.i. (p ≤ 0.05). Although no statistical differences were observed for ATCC12598 and ST239‐III, there was a down‐regulation versus baseline condition.
The expression of the MSCRAMM genes is reported in Figure 3, 4, 5 and Table 5. All MSCRAMM genes were differently modulated in our sample.
In the ATCC12598 strain, the fnbA gene mRNA expression showed a statistically significant increase at 3 h p.i. versus baseline condition (+4255.6 ± 1052.8 fd, p ≤ 0.05) and a statistically significant decrease at 24 h p.i. versus 3 h (+86.9 ± 28.03 fd, p ≤ 0.05). The sdrE gene mRNA expression exhibited a statistically significant increase at 3 h p.i. versus baseline condition (+10.63 ± 2.48 fd, p ≤ 0.05) and a statistically significant decrease at 24 h p.i. versus 3 h (+1.55 ± 0.1 fd, p ≤ 0.05).
The bbp gene mRNA expression showed a statistically significant increase (+2318.32 ± 801.5 fd, p ≤ 0.05) in the ST239‐III strain at 3 h p.i. versus baseline condition and at 24 h p.i. versus baseline condition (+2897.22 ± 156.12 fd, p ≤ 0.05). For the fnbB gene and the other strains, no other statistical differences were observed in each condition considered. Expression of toxin genes and the sugar phosphate antiporter gene is reported in Figure 4, 5 and Table 5.
The psmA gene mRNA expression in the ATCC12598 strain showed a statistically significant increase (+6.75 ± 3.75 fd, p ≤ 0.05) at 3 h p.i. vs. 24 h p.i. In the ST228‐I strain, this gene was statistically significantly up‐regulated (+32.84 ± 11.5 fd, p ≤ 0.05) at 3 h p.i versus baseline condition.
The hla gene mRNA expression showed a significant increase in the ATCC12598 strain (+1308.64 ± 323.75 fd, p ≤ 0.05) at 3 h p.i. versus baseline condition and a statistically significant decrease when comparing 24 h p.i. versus 3 h p.i. (17.58 ± 6.4 fd; p ≤ 0.05). In the ST239‐III strain, this gene showed a statistically significant increase at 3 h p.i. and 24 h p.i. when comparing 3 h p.i. versus baseline condition (4922.01 ± 840.23 fd, p ≤ 0.01 and 26698.18 ± 130.85 fd, p ≤ 0.001) and when comparing 3 h p.i versus 24 h p.i. (p ≤ 0.001). The hld gene mRNA expression showed a significant decrease in ATCC12598 at 24 h p.i. versus baseline condition (0.04 ± 0.04 fd; p ≤ 0.05). For the other strains, in each condition considered, no statistically significant differences were observed. The mRNA expression of the uhpT gene showed a statistically significant difference in the ATCC12598 strain only, in particular, an up‐regulation when comparing 3 h p.i. versus baseline condition (16.85 ± 1.5 fd; p ≤ 0.05) and a down‐regulation when comparing 24 h p.i. versus 3 h p.i. (5.32 ± 2.27 fd; p ≤ 0.05).
These findings support the idea that variations in the regulator, MSCRAMM, toxins, and metabolic gene transcription were related to the degree of invasiveness and persistence in MG‐63 cells.
4. DISCUSSION
Internalization of S. aureus in non‐phagocytic cells is an attractive field of study owing to the particular ability of this microorganism to generate chronic diseases.
The process of internalization includes different phases: In the early phase, microbial surface proteins (MSCRAMMs) are implicated in host cell adhesion and invasion, fighting against the immune system and entering the deep tissue structure (Painter et al., 2014); subsequently, the pathogenicity and virulence of S. aureus depend on the ability to produce several virulence factors including enterotoxins (SEs) and toxic shock syndrome toxin‐1 (TSST), pore‐forming toxins (hemolysins; Panton–Valentine leukocidin; phenol‐soluble modulins), exfoliative toxins (ETs), protein A, and several enzymes able to damage host cells by their cytotoxic/cytolytic activity and through modulation of immune responses.
In a previous study, we analyzed the different proclivity of the main staphylococcal clones to invade, internalize, and persist within human cells, using a highly performing IFC assay. In particular, we demonstrated that ST5‐II, ST8‐IV, and ST228‐I showed a statistically significant lower aptitude to intracellular subsistence, while ST239‐III and ST22‐IVh isolates had intracellular frequencies equal to, or greater than, those of the invasive ATCC12598 strain, suggesting their possible role as invasive and persistent clones responsible for chronic and recurrent infections (Bongiorno et al., 2020).
Based on the above observations, we used the same infection models to examine the differential expression of a set of genes responsible for the adhesion, invasion, and internalization of two S. aureus clones ST239‐III and ST228‐I compared with the control invasive ATCC12598 isolate.
The pathotype gene profile of the two strains included in the study showed only a few differences.
S. aureus ST228‐I is one of the most predominant clones associated with orthopedic infection (Jain et al., 2019) showing a high rate of virulence, drug resistance, and longer duration of hospitalization. It exhibited two more enterotoxins (SEA and SEO), suggesting a potentially augmented role in eliciting and deregulating the immune system of the host (Hussain et al., 2009).
Conversely, ST239‐III was the only strain carrying the hlb gene coding for a pore‐forming toxin involved in chronic skin infections and phagosomal escape (Katayama et al., 2013) and producing δ‐hemolysis, demonstrating that the agr locus is not defective. Moreover, this strain, belonging to the ST239 clone, did not carry the other toxin genes; therefore, its ability to damage host cells is related to hla and psmα or other unknown factors.
To further investigate these differences, we evaluated the expression of a selected set of genes grouped into three different general categories, that is, regulators, adhesion factors (MSCRAMMs), and toxins (Table 6, Figure 5). Moreover, to evaluate the metabolic activity of internalized bacteria, we evaluated a hexose phosphate antiporter for G6P. The expression of the regulatory global network SigB, SarA, SarS, agr locus, and Rot controls the expression of a set of virulence factors involved in adhesion and cytotoxic/cytolytic activities.
TABLE 6.
Comparison of % internalized MG‐63, cellular metabolic status, adhesin, and toxin gene regulation
| Strains | Time | MG‐63 internalized | % of Cellular metabolic status variation versus uninfected MG‐63 | Regulator Expression | Adhesin and Toxin Expression | Metabolism expression | ||||||||||
|---|---|---|---|---|---|---|---|---|---|---|---|---|---|---|---|---|
| sigB | sarA | sarS | agr | rot | bbp | fnbA | fnbB | sdrE | psmA | hla | hld | uhpT | ||||
| ATCC12598 | 3h | 70% | +12.27
|
= | **
|
**
|
= |
|
|
*
|
|
*
|
*
|
*
|
|
*
|
| 24h | ~50% | −7.11
|
**
|
= |
|
|
|
|
= | = | = |
|
|
*
|
|
|
| ST239‐SCCmecIII | 3h | 50% | −2.47
|
|
= |
|
|
|
*
|
|
|
|
|
*
|
|
|
| 24h | 45% | −18.32
|
|
|
|
|
|
*
|
|
|
= | = | *
|
|
= | |
| ST228‐SCCmecI | 3h | ~30% | +7.57 = |
|
|
|
|
= |
|
|
|
|
*
|
|
|
|
| 24h | 20% | +3.29 = |
|
|
|
|
*
|
|
= | = |
|
|
|
|
|
|
Statistical significance: not significant (gray arrow), p‐value: ≤0.05 (*); ≤0.01 (**); and ≤0.001 (***).
The genes responsible for invasiveness and persistence were analyzed by comparing the ability to infect and internalize into MG‐63 osteoblasts, according to their cytotoxic potential (based on the cellular metabolic status of infected MG‐63 osteoblasts) and the expression levels of surface and secreted toxins at 3 h and 24 h p.i.
As preliminarily observed and now confirmed (Bongiorno et al., 2020), the ability of ATCC12598‐ST30 and MRSA ST239‐III to internalize and persist in MG‐63 is quite similar (ATCC12598 internalized into 70% of MG‐63 cells and persisted in 49% of MG‐63 cells; ST239‐III internalized into 50% of MG‐63 cells and persisted in 45% of MG‐63 cells), while MRSA ST228‐I behaves differently (internalized into 29% of MG‐63 cells and persisted in the 20% of MG‐63 cells).
These differences among clones were also evaluated by measuring the metabolic status of MG‐63 cells in terms of cytotoxicity, demonstrating that ST239‐III was immediately able to decrease the metabolic activity of cells at 3 h p.i. (cellular metabolic status detected −2.47 vs. uninfected MG‐63 cells) and further damaged cells at 24 h p.i. (cellular metabolic status detected −18.32 vs. uninfected MG‐63 cells). The ATCC12598 clone was able to interfere with the MG‐63 cells at 24 h p.i. (cellular metabolic status detected −7.11 vs. uninfected control MG‐63), while ST228 affected the metabolic status of the cells only slightly.
These results are in agreement with other studies (Botelho et al., 2019), demonstrating that the ST239‐III clone can adapt to diverse pathological conditions (diverse syndromes) and undergo genomic adaptations, thus developing a distinct pattern of virulence‐associated genes.
The ATCC12598 strain was included as an invasive model. It displayed, at 3 h p.i., a higher ability to infect and internalize into MG‐63 human osteoblasts (70%), associated with a significant increase in the cellular metabolic status compared with the uninfected cell line. At 24 h p.i., although intracellular persistence decreased to 50%, ATCC12598 bacteria exerted a high intracellular cytotoxic activity against osteoblasts, as demonstrated by a decrease in the cellular metabolic status. The regulation of gene expression in ATCC12598 during the internalization and, especially, the persistence steps, followed an expected scheme: A significant increase in the expression of genes involved in adaptation to environmental stress (in particular sarA, sigB), resulting in up‐regulated expression of genes involved both in adherence (in particular to fnbA and sdrE) in and virulence (psmA and hla) at 3 h p.i, although rot, the toxin repressor gene, did not undergo statistically significant changes, which is still in line with the expression of toxins.
In particular, psmA and hla overexpression may be related to the 20% decrease in persistence; moreover, the overexpression of α‐hemolysin may enhance internalization and survival by modulating osteoblast expression of β1 integrin, as previously reported (Goldmann et al., 2016), and may also be involved in pore formation and cellular lysis, which might explain the decrease in cellular metabolism associated with enhanced cytotoxic activity. This is in line with previous studies in which hla expression was a requirement for the pathogenesis of the invasive disease (Oliveira et al., 2018). At 24 h p.i, an over decrease in the expression of regulatory genes was observed, except for sigB, probably due to cellular stimulation, which resulted in a decreased expression of genes involved in adhesion (fnbA and sdrE) and virulence (psmA and hla). We can conclude that, for the ATCC12598 strain, all events involving both adhesion/invasion and damage to host cells occurred within 3 h p.i. Furthermore, its metabolism, adapted to intracellular conditions, showed up‐regulation of the alternative antiporter of carbon source (UhpT) at 3 h p.i., as confirmed by the 12% increase in the cellular metabolic status, while there was a significant decrease in metabolism at 24 h p.i. versus 3 h p.i., as confirmed by the loss of −7.11% of the cell metabolic status. As the hld gene expression was down‐regulated in ATCC12598, we can conclude that this gene was not involved in cellular adaptation or invasion.
The strain belonging to ST239‐III, which did not show any toxin gene (Botelho et al., 2019) except for sdrE and hla, hlb and hld, was able to infect (3 h p.i.) 50% of MG‐63 human osteoblasts and induced a slowdown of the cell metabolic activity, which may be due to the production of hemolysins Hlb, Hla, and PsmA. The ST239‐III strain displayed, at 3 h p.i., a significant increase in bbp that is necessary for adhesion and invasion in MG‐63 cells, and an increase in agrA expression (although not statistically significant), resulting in an up‐regulation of hla and an increase in psmA expression (although not statistically significant), associated with a good ability to internalize into and infect MG‐63 cells. At 24 h p.i., ST239‐III bacteria stably persisted intracellularly (45%) and exerted a highly significant cytotoxic activity against osteoblasts, due to the overexpression of hla, as demonstrated by a remarkable decrease in the cellular metabolic status, also confirmed by the expression of the uhpT gene (although not statistically significant). Some studies have demonstrated the importance of this toxin for S. aureus pathogenicity, phagosomal escape, and induction of biofilm formation (Katayama et al., 2013; Tajima et al., 2009 ). At 24 h p.i., increased expression of the genes involved in adhesion was detected. A possible explanation could be that bacterial cells exit and enter MG‐63 cells through their membrane, using the integrins located in the cell wall.
The significantly higher rates of intracellular invasion by ST239‐III bacteria could justify their cytotoxicity despite the loss of toxin production and contribute to their survival in a higher number. These findings suggest that ST239‐III is associated with an intracellular adaptation that leads to decreased virulence and host immune escape, making this clone more prone to persistent infections.
During internalization and persistence, we did not find any difference in the expression of the genes involved in adaptation to environmental stress (sarA, sigB, sarS, agr) and of those involved in adherence (fnbA and fnbB) with respect to the baseline condition; this phenomenon could be probably because these genes were normally overexpressed at the baseline condition, while, under the same conditions, the genes involved in toxicity and phagosomal escape (psmA and hla) were down‐regulated. This regulation was in line with rot expression.
On the contrary, the strain belonging to ST228‐I was found to be less able to internalize (30%) at 3 h p.i.; correlation analysis between regulatory genes and virulence factors showed that at 3 h p.i., the ST228‐I strain displayed a baseline level of agrA expression and an up‐regulation of sigB and sarA, leading to up‐regulation of the surface proteins and up‐regulation of secreted toxins, such as PSMα, Hla, and Hld, associated with a significant non‐cytotoxic activity inside osteoblasts, and a lower ability to internalize into and infect MG‐63 cells. Even if these variations were not statistically significant, their expression levels showed an expected scheme. This strain is also characterized by the presence of the pls gene, carried by SCCmecI, known to be involved in the failure to adhere to the cell surface (Hussain et al., 2009).
After 24 h of intracellular persistence, all regulatory genes were down‐expressed, in particular, rot and consequently the genes involved in adhesion and virulence (except for an increased expression of hla at 3 h p.i.): 20% of MG‐63 cells were infected, and the cellular metabolic status did not show any variation compared with the uninfected cell line; the expression of uhpT supported these results.
The impact of PSMα suggests that regardless of the lower invasiveness, ST228 bacteria exert their potential to damage osteoblasts by a cytotoxic effect. ST228 is not capable of activating a sufficient cellular reaction; quite on the contrary, it seemed to “succumb” inside MG‐63 cells. This variation in the expression of agr, sigB, rot, hla, and fnbA was previously associated with the switch from an extracellular to an intracellular behavior, due to changes in the expression of the fibronectin‐binding protein and adhesion‐binding protein, important for host/cell invasion but not required difficult for intracellular persistence (Tuchscherr & Löffler, 2016).
Although rot variations were not statistically significant, except for the ST228‐I strain at 24 h p.i., they were still in line with the variations found in the toxin genes. Two further considerations are necessary: The regulation of toxin production was not dependent on rot regulation only, but also on other members of the SarA family, accessory sensor/regulators (RSP), and/or two‐component systems (i.e., SaeRS) (Horn et al., 2018); and rot was regulated by other genes, which have not been considered in this context, such as rbf (Gimza et al., 2019).
Our results, arising from the qualitative and quantitative assays of virulence and toxin factors, are in line with recently published studies according to which the genetic and phenotypic different characteristics of staphylococcal strains favor the infection process, invasiveness, and persistence inside host cells (Davis & Isberg, 2019; Recker et al., 2017; Tuchscherr et al., 2019). In our study, we analyzed two different genetic backgrounds to elucidate how bacteria can differently adapt strategies thanks to the interplay among regulatory and adhesion/toxin genes and rapidly react to changing environmental conditions and dynamically adjust their virulence factor expression at different times of infection. This ability was identified in the ST239‐III clone and not in others.
5. CONCLUSION
We found that the ST239‐III clone was able to infect, at 3 h p.i., 50% of MG‐63 human osteoblasts, and this rate stably persisted at 24 h p.i.; during the infection period, it exerted a highly significant cytotoxic activity against osteoblasts, due to the overexpression of hla, as demonstrated by a remarkable decrease in the cellular metabolic status. The increase in hla and, to a lesser extent, of psmA has as a consequence the increased expression of genes involved in adhesion (bbp), probably due to the release and re‐entry of bacteria inside MG‐63 cells at 24 h p.i. Our results lead us to conclude that the ST239‐III clone is more prone to persistent infections. Recent data from our group considering pro‐inflammatory and pro‐oxidant response in an ST239‐III osteoblast infection demonstrated a significant increase in gene expression of both interleukin‐6 and TNF‐α (Musso et al., 2021).
On the contrary, ST228‐I was found to be less able to internalize (30%), compared with the control strain and ST239‐III at 3 h p.i., and to persist (20%) at 24 h p.i., and this lower invasiveness was also correlated with the non‐cytotoxic activity inside osteoblasts. This is probably due to the presence of the pls gene in SCCmecI, which is involved in the failure to adhere to the cell surface. This clone is not able to activate a sufficient cellular reaction and succumbs inside MG‐63 cells.
Our idea is to consider new strategies, including a clonal and translational approach. We believe that our translational approach—eukaryotic host–pathogen interaction (EHPI)—based on the study of the genetic and biochemical basis of both pathogen and host can be applied on a large scale to predict S. aureus /osteoblast interaction and treat bone infections.
6. ETHICS STATEMENT
None required.
CONFLICT OF INTEREST
None declared.
AUTHOR CONTRIBUTIONS
Dafne Bongiorno: Conceptualization (equal); Investigation (equal); Methodology (equal); Project administration (lead); Validation (equal); Visualization (equal); Writing‐original draft (equal); Writing‐review & editing (equal). Nicolò Musso: Conceptualization (equal); Formal analysis (equal); Investigation (equal); Methodology (equal); Project administration (supporting); Validation (equal); Visualization (equal); Writing‐original draft (equal); Writing‐review & editing (supporting). Giuseppe Caruso: Formal analysis (equal); Investigation (equal); Methodology (equal); Validation (equal); Visualization (equal). Lorenzo Mattia Lazzaro: Formal analysis (supporting); Investigation (supporting). Filippo Caraci: Resources (equal). Stefania Stefani: Funding acquisition (equal); Resources (equal); Supervision (equal); Writing‐review & editing (equal). Floriana Campanile: Conceptualization (equal); Funding acquisition (equal); Methodology (supporting); Resources (equal); Supervision (equal); Writing‐review & editing (equal).
Supporting information
Supplementary Material
ACKNOWLEDGEMENTS
Some of the results of this study were presented at the 29th ECCMID (O0927) and the 44th Italian Society of Microbiology (SIM) congress (P127). We would like to thank the BRIT laboratory at the University of Catania (Italy) for valuable technical assistance and use of their laboratories. We also wish to thank the PharmaTranslated (http://www.pharmatranslated.com/) and in particular to Silvia Montanari for language support. The manuscript was partially supported by: a research grant project number PRIN2017SFBFER from the Ministry of Research (MIUR) Italy; a research grant from a private company; a research grant entitled “Fragment‐sized covalent inhibitors of MAOs to fight neurodegenerative diseases and repositioning against the 3CLPro main protease of the SARS‐COV‐2 and bacterial resistances [CovDock], ‘Programma PIACERI – Linea di intervento 2’. University of Catania, Dept. of Biomedical and Biotechnological Sciences.”
Dafne Bongiorno, Nicolò Musso and Giuseppe Caruso are equally contributed to the paper.
Contributor Information
Dafne Bongiorno, Email: d.bongiorno@unict.it.
Giuseppe Caruso, Email: giuseppe.caruso2@unict.it.
DATA AVAILABILITY STATEMENT
All data generated or analyzed during this study are included in this published article.
REFERENCES
- Bongiorno, D., Mongelli, G., Stefani, S., & Campanile, F. (2018). Burden of rifampicin‐ and methicillin‐resistant Staphylococcus aureus in Italy. Microbial Drug Resistance, 24, 732–738. [DOI] [PubMed] [Google Scholar]
- Bongiorno, D., Musso, N., Lazzaro, L. M., Mongelli, G., Stefani, S., & Campanile, F. (2020). Detection of methicillin‐resistant Staphylococcus aureus persistence in osteoblasts using imaging flow cytometry. Microbiologyopen. 2020, e1017. 10.1002/mbo3.1017 [DOI] [PMC free article] [PubMed] [Google Scholar]
- Botelho, A. M., Cerqueira e Costa, M. O., Moustafa, A. M., Beltrame, C. O., Ferreira, F. A., Côrtes, M. F., Costa, B. S., Silva, D. N., Bandeira, P. T., Lima, N. C., & Souza, R. C. (2019). Local diversification of methicillin‐resistant Staphylococcus aureus ST239 in South America after its rapid worldwide dissemination. Frontiers in Microbiology, 10, 82. 10.3389/fmicb.2019.00082. eCollection. [DOI] [PMC free article] [PubMed] [Google Scholar]
- Cafiso, V., Bertuccio, T., Purrello, S., Campanile, F., Mammina, C., Sartor, A., Raglio, A., & Stefani, S. (2014). dltA overexpression: A strain‐independent keystone of daptomycin resistance in methicillin‐resistant Staphylococcus aureus . International Journal of Antimicrobial Agents, 43(1), 26–31. 10.1016/j.ijantimicag.2013.10.001 [DOI] [PubMed] [Google Scholar]
- Cafiso, V., Bertuccio, T., Spina, D., Purrello, S., Blandino, G., & Stefani, S. (2012). A novel δ‐hemolysis screening method for detecting heteroresistant vancomycin‐intermediate Staphylococcus aureus and vancomycin‐intermediate S. aureus . Journal of Clinical Microbiology, 50(5), 1742–1744. 10.1128/JCM.06307-11 [DOI] [PMC free article] [PubMed] [Google Scholar]
- Cafiso, V., Bertuccio, T., Spina, D., Purrello, S., Campanile, F., Di Pietro, C., Purrello, M., & Stefani, S. (2012). Modulating activity of vancomycin and daptomycin on the expression of autolysis cell‐wall turnover and membrane charge genes in hVISA and VISA strains. PLoS One, 7(1), e29573. 10.1371/journal.pone.0029573 [DOI] [PMC free article] [PubMed] [Google Scholar]
- Campanile, F., Bongiorno, D., Falcone, M., Vailati, F., Pasticci, M. B., Perez, M., Raglio, A., Rumpianesi, F., Scuderi, C., Suter, F., Venditti, M., Venturelli, C., Ravasio, V., Codeluppi, M., & Stefani, S. (2012). Changing Italian nosocomial‐community trends and heteroresistance in Staphylococcus aureus from bacteremia and endocarditis. European Journal of Clinical Microbiology and Infectious Diseases, 31(5), 739–745. 10.1007/s10096-011-1367-y. Epub 2011 Aug 7. [DOI] [PMC free article] [PubMed] [Google Scholar]
- Campanile, F., Bongiorno, D., Perez, M., Mongelli, G., Sessa, L., Benvenuto, S., Gona, F., Varaldo, P. E., & Stefani, S. (2015). Epidemiology of Staphylococcus aureus in Italy: First nationwide survey, 2012. Journal of Global Antimicrobial Resistance, 3(4), 247–254. 10.1016/j.jgar.2015.06.006 [DOI] [PubMed] [Google Scholar]
- Chen, L., Shopsin, B., Zhao, Y., Smyth, D., Wasserman, G. A., Fang, C., Liu, L., & Kreiswirth, B. N. (2012). Real‐time nucleic acid sequence‐based amplification assay for rapid detection and quantification of agr functionality in clinical Staphylococcus aureus isolates . Journal of Clinical Microbiology, 50(3), 657–661. 10.1128/JCM.06253-11. [DOI] [PMC free article] [PubMed] [Google Scholar]
- Davido, B., Saleh‐Mghir, A., Laurent, F., Danel, C., Couzon, F., Gatin, L., Vandenesch, F., Rasigade, J. P., & Crémieux, A. C. (2016). Phenol‐soluble modulins contribute to early sepsis dissemination not late local USA300‐osteomyelitis severity in rabbits. PLoS One, 11(6), e0157133. 10.1371/journal.pone.0157133 [DOI] [PMC free article] [PubMed] [Google Scholar]
- Davis, K. M., Isberg, R.. (2019). One for all, but not all for one: Social behavior during bacterial diseases. Trends in Microbiology, 27(1), 64–74. 10.1016/j.tim.2018.09.001 [DOI] [PMC free article] [PubMed] [Google Scholar]
- Fresta, C. G., Chakraborty, A., Wijesinghe, M. B., Amorini, A. M., Lazzarino, G., Lazzarino, G., Tavazzi, B., Lunte, S. M., Caraci, F., Dhar, P., & Caruso, G. (2018). Non‐toxic engineered carbon nanodiamond concentrations induce oxidative/nitrosative stress, imbalance of energy metabolism, and mitochondrial dysfunction in microglial and alveolar basal epithelial cells. Cell Death & Disease, 9, 245. 10.1038/s41419-018-0280-z [DOI] [PMC free article] [PubMed] [Google Scholar]
- Fresta, C. G., Fidilio, A., Lazzarino, G., Musso, N., Grasso, M., Merlo, S., Amorini, A. M., Bucolo, C., Tavazzi, B., Lazzarino, G., Lunte, S. M., Caraci, F., & Caruso, G. (2020). Modulation of Pro‐oxidant and pro‐inflammatory activities of M1 macrophages by the natural dipeptide carnosine. International Journal of Molecular Sciences, 21(3), E776. 10.3390/ijms21030776 [DOI] [PMC free article] [PubMed] [Google Scholar]
- Gilot, P., Lina, G., Cochard, T., & Poutrel, B. (2002). Analysis of the genetic variability of genes encoding the RNA III‐activating components Agr and TRAP in a population of Staphylococcus aureus strains isolated from cows with mastitis. Journal of Clinical Microbiology, 40(11), 4060–4067. 10.1128/JCM.40.11.4060-4067.2002 [DOI] [PMC free article] [PubMed] [Google Scholar]
- Gimza, B. D., Larias, M. I., Budny, B. G., & Shaw, L. N. (2019). Mapping the global network of extracellular protease regulation in Staphylococcus aureus . mSphere, 4(5):e00676–19. 10.1128/mSphere.00676-19. [DOI] [PMC free article] [PubMed] [Google Scholar]
- Goldmann, O., Tuchscherr, L., Rohde, M., & Medina, E. (2016). α‐Hemolysin enhances Staphylococcus aureus internalization and survival within mast cells by modulating the expression of β1 integrin. Cellular Microbiology, 18(6), 807–819. [DOI] [PubMed] [Google Scholar]
- Herr, A. B., & Thorman, A. W. (2017). Hiding in plain sight: Immune evasion by the staphylococcal protein SdrE. The Biochemical Journal, 474(11), 1803–1806. 10.1042/BCJ20170132 [DOI] [PubMed] [Google Scholar]
- Horn, J., Stelzner, K., Rudel, T., & Fraunholz, M. (2018). Inside job: Staphylococcus aureus host‐pathogen interactions. International Journal of Medical Microbiology, 308(6), 607–624. 10.1016/j.ijmm.2017.11.009 [DOI] [PubMed] [Google Scholar]
- Hussain, M., Schäfer, D., Juuti, K. M., Peters, G., Haslinger‐Löffler, B., Kuusela, P. I., & Sinha, B. (2009). Expression of PLS (plasmin sensitive) in Staphylococcus aureus negative for PLS reduces adherence and cellular invasion and acts by steric hindrance. Journal of Infectious Diseases, 200(1), 107–117. 10.1086/599359. [DOI] [PubMed] [Google Scholar]
- Jain, S., Chowdhury, R., Datta, M., Chowdhury, G., & Mukhopadhyay, A. K. (2019). Characterization of the clonal profile of methicillin resistant Staphylococcus aureus isolated from patients with early post‐operative orthopedic implant‐based infections. Annals of Clinical Microbiology and Antimicrobials, 18(1), 8. 10.1186/s12941-019-0307-z [DOI] [PMC free article] [PubMed] [Google Scholar]
- Jenul, C., & Horswill, A. R. (2018). Regulation of Staphylococcus aureus virulence. Microbiology Spectrum, 7(2), 10.1128/microbiolspec.GPP3-0031-2018 [DOI] [PMC free article] [PubMed] [Google Scholar]
- Katayama, Y., Baba, T., Sekine, M., Fukuda, M., Hiramatsu, K.. (2013). Beta‐hemolysin promotes skin colonization by Staphylococcus aureus . Journal of Bacteriology, 195(6), 1194–1203. 10.1128/JB.01786-12 [DOI] [PMC free article] [PubMed] [Google Scholar]
- Monecke, S., Slickers, P., Gawlik, D., Müller, E., Reissig, A., Ruppelt‐Lorz, A., Akpaka, P. E., Bandt, D., Bes, M., Boswihi, S. S., Coleman, D. C., Coombs, G. W., Dorneanu, O. S., Gostev, V. V., Ip, M., Jamil, B., Jatzwauk, L., Narvaez, M., Roberts, R., … Ehricht, R. (2018). Molecular typing of ST239‐MRSA‐III from diverse geographic locations and the evolution of the SCCmec III element during its intercontinental spread. Frontiers in Microbiology, 9, 1436. 10.3389/fmicb.2018.01436 [DOI] [PMC free article] [PubMed] [Google Scholar]
- Moore, A. J., Whitehouse, M. R., Gooberman‐Hill, R., Heddington, J., Beswick, A. D., Blom, A. W., & Peters, T. J. (2017). A UK national survey of care pathways and support offered to patients receiving revision surgery for prosthetic joint infection in the highest volume NHS orthopaedic centres. Musculoskeletal Care, 15, 379–385. 10.1002/msc.1186 [DOI] [PMC free article] [PubMed] [Google Scholar]
- Mruk, A. L., & Record, K. E. (2012). Antimicrobial options in the treatment of adult staphylococcal bone and joint infections in an era of drug shortages. Orthopedics, 35(5), 401–407. 10.3928/01477447-20120426-07 [DOI] [PubMed] [Google Scholar]
- Muñoz‐Gallego, I., Lora‐Tamayo, J., Pérez‐Montarelo, D., Brañas, P., Viedma, E., & Chaves, F. (2017). Influence of molecular characteristics in the prognosis of methicillin‐resistant Staphylococcus aureus prosthetic joint infections: Beyond the species and the antibiogram. Infection, 45(4), 533–537. 10.1007/s15010-017-1011-6. Epub 2017 Apr 7. [DOI] [PubMed] [Google Scholar]
- Musso, N., Caruso, G., Bongiorno, D., Grasso, M., Bivona, D. A., Campanile, F., Caraci, F., & Stefani, S. (2021). Different modulatory effects of four methicillin‐resistant Staphylococcus aureus clones on MG‐63 osteoblast‐like cells. Biomolecules, 11(1), 72. 10.3390/biom11010072 [DOI] [PMC free article] [PubMed] [Google Scholar]
- Oliveira, D., Borges, A., & Simões, M. (2018). Staphylococcus aureus toxins and their molecular activity in infectious diseases. Toxins, 10(6), 252. 10.3390/toxins10060252. [DOI] [PMC free article] [PubMed] [Google Scholar]
- Otsuka, T., Saito, K., Dohmae, S., Takano, T., Higuchi, W., Takizawa, Y., Okubo, T., Iwakura, N., & Yamamoto, T. (2006). Key adhesin gene in community‐acquired methicillin‐resistant Staphylococcus aureus . Biochemical and Biophysical Research Communications, 346(4), 1234–1244. 10.1016/j.bbrc.2006.06.038 [DOI] [PubMed] [Google Scholar]
- Painter, K. L., Krishna, A., Wigneshweraraj, S., & Edwards, A. M. (2014). What role does the quorum‐sensing accessory gene regulator system play during Staphylococcus aureus bacteremia? Trends in Microbiology, 22(12), 676–685. 10.1016/j.tim.2014.09.002. Epub 2014 Oct 6. [DOI] [PubMed] [Google Scholar]
- Pedotti, S., Ussia, M., Patti, A., Musso, N., Barresi, V., & Condorelli, D. F. (2017). Synthesis of the ferrocenyl analogue of clotrimazole drug. Journal of Organometallic Chemistry, 830, 56–61. 10.1016/j.jorganchem.2016.12.009 [DOI] [Google Scholar]
- Peng, K. T., Huang, T. Y., Chiang, Y. C., Hsu, Y. Y., Chuang, F. Y., Lee, C. W., & Chang, P. J. (2019). Comparison of methicillin‐resistant Staphylococcus aureus isolates from cellulitis and from osteomyelitis in a Taiwan Hospital, 2016–2018. Journal of Clinical Medicine, 8(6), 2016–2018. 10.3390/jcm8060816 [DOI] [PMC free article] [PubMed] [Google Scholar]
- Pérez‐Montarelo, D., Viedma, E., Larrosa, N., Gómez‐González, C., Ruiz de Gopegui, E., Muñoz‐Gallego, I., San Juan, R., Fernández‐Hidalgo, N., Almirante, B., & Chaves, F. (2018). Molecular epidemiology of Staphylococcus aureus bacteremia: Association of molecular factors with the source of infection. . Frontiers in Microbiology, 9, 2210. 10.3389/fmicb.2018.02210. eCollection 2018. [DOI] [PMC free article] [PubMed] [Google Scholar]
- Purrello, S. M., Garau, J., Giamarellos, E., Mazzei, T., Pea, F., Soriano, A., & Stefani, S. (2016). Methicillin‐resistant Staphylococcus aureus infections: A review of the currently available treatment options. Journal of Global Antimicrobial Resistance, 7, 178–186. 10.1016/j.jgar.2016.07.010 [DOI] [PubMed] [Google Scholar]
- Recker, M., Laabei, M., Toleman, M. S., Reuter, S., Saunderson, R. B., Blane, B., Török, M. E., Ouadi, K., Stevens, E., Yokoyama, M., & Steventon, J. (2017). Clonal differences in Staphylococcus aureus bacteremia‐associated mortality. Nature Microbiology, 2(10), 1381–1388. 10.1038/s41564-017-0001-x. Epub 2017 Aug 7. [DOI] [PubMed] [Google Scholar]
- Romilly, C., Lays, C., Tomasini, A., Caldelari, I., Benito, Y., Hammann, P., Geissmann, T., Boisset, S., Romby, P., & Vandenesch, F. (2014). A non‐coding RNA promotes bacterial persistence and decreases virulence by regulating a regulator in Staphylococcus aureus . PLoS Path, 10(3), e1003979. 10.1371/journal.ppat.1003979 [DOI] [PMC free article] [PubMed] [Google Scholar]
- Shinji, H., Yosizawa, Y., Tajima, A., Iwase, T., Sugimoto, S., Seki, K., & Mizunoe, Y. (2011). Role of fibronectin‐binding proteins A and B in in vitro cellular infections and in vivo septic infections by Staphylococcus aureus . Infection and Immunity, 79(6), 2215–2223. 10.1128/IAI.00133-11. Epub 2011 Mar 21.l [DOI] [PMC free article] [PubMed] [Google Scholar]
- Stefani, S., Bongiorno, D., Cafiso, V., Campanile, F., Crapis, M., Cristini, F., Sartor, A., Scarparo, C., Spina, D., & Viale, P. (2009). Pathotype and susceptibility profile of a community‐acquired methicillin‐resistant Staphylococcus aureus strain responsible for a case of severe pneumonia. Diagnostic Microbiology and Infectious Disease, 63(1), 100–104. 10.1016/j.diagmicrobio.2008.09.012 [DOI] [PubMed] [Google Scholar]
- Stefani, S., Chung, D. R., Lindsay, J. A., Friedrich, A. W., Kearns, A. M., Westh, H., & Mackenzie, F. M. (2012). Methicillin‐resistant Staphylococcus aureus (MRSA): Global epidemiology and harmonization of typing methods. International Journal of Antimicrobial Agents, 39, 273–282. 10.1016/j.ijantimicag.2011.09.030. Epub 2012 Jan 9. [DOI] [PubMed] [Google Scholar]
- Szymanek‐Majchrzak, K., Mlynarczyk, A., & Mlynarczyk, G. (2018). Characteristics of glycopeptide‐resistant Staphylococcus aureus strains isolated from inpatients of three teaching hospitals in Warsaw, Poland. Antimicrobial Resistance & Infection Control 7, 105. 10.1186/s13756-018-0397-y. eCollection [DOI] [PMC free article] [PubMed] [Google Scholar]
- Tajima, A., Iwase, T., Shinji, H., Seki, K., & Mizunoe, Y. (2009). Inhibition of endothelial interleukin‐8 production and neutrophil transmigration by Staphylococcus aureus beta‐hemolysin. Infection and Immunity, 77(1), 327–334. 10.1128/IAI.00748-08. Epub 2008 Oct 20. [DOI] [PMC free article] [PubMed] [Google Scholar]
- Tong, S. Y., Davis, J. S., Eichenberger, E., Holland, T. L., & Fowler, V. G. (2015). Staphylococcus aureus infections: Epidemiology, pathophysiology, clinical manifestations, and management. Clinical Microbiology Reviews, 28(3), 603–661. 10.1128/CMR.00134-14 [DOI] [PMC free article] [PubMed] [Google Scholar]
- Tuchscherr, L., Bischoff, M., Lattar, S. M., Noto Llana, M., Pförtner, H., Niemann, S., Geraci, J., Van de Vyver, H., Fraunholz, M. J., Cheung, A. L., Herrmann, M., Völker, U., Sordelli, D. O., Peters, G., & Löffler, B. (2015). (2015) Sigma factor SigB Is crucial to mediate Staphylococcus aureus adaptation during chronic infections. PLoS Path, 11(4), e1004870. 10.1371/journal.ppat.1004870. eCollection. [DOI] [PMC free article] [PubMed] [Google Scholar]
- Tuchscherr, L., & Löffler, B. (2016). Staphylococcus aureus dynamically adapts global regulators and virulence factor expression in the course from acute to chronic infection. Current Genetics, 62(1), 15–17. 10.1007/s00294-015-0503-0 [DOI] [PubMed] [Google Scholar]
- Tuchscherr, L., Pöllath, C., Siegmund, A., Deinhardt‐Emmer, S., Hoerr, V., Svensson, C. M., Thilo Figge, M., Monecke, S., & Löffler, B. (2019). Clinical S. aureus isolates vary in their virulence to promote adaptation to the host. Toxins, 11(3), 135. 10.3390/toxins11030135 [DOI] [PMC free article] [PubMed] [Google Scholar]
- Wu, S., Huang, F., Zhang, H., & Lei, L. (2019). Staphylococcus aureus biofilm organization modulated by YycFG two‐component regulatory pathway. Journal of Orthopaedic Surgery and Research, 14(1), 10, 10.1186/s13018-018-1055-z [DOI] [PMC free article] [PubMed] [Google Scholar]
- Yang, Y., Sun, H., Liu, X., Wang, M., Xue, T., & Sun, B. (2016). Regulatory mechanism of the three‐component system HptRSA in glucose‐6‐phosphate uptake in Staphylococcus aureus . Medical Microbiology and Immunology, 205(3), 241–253. 10.1007/s00430-015-0446-6. [DOI] [PubMed] [Google Scholar]
Associated Data
This section collects any data citations, data availability statements, or supplementary materials included in this article.
Supplementary Materials
Supplementary Material
Data Availability Statement
All data generated or analyzed during this study are included in this published article.