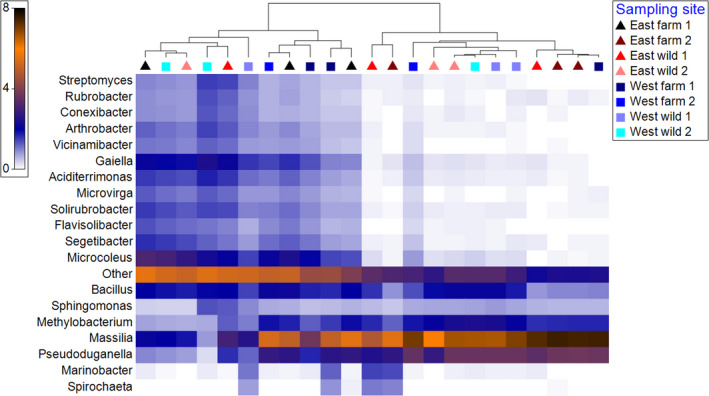
FIGURE 2.

Shade plots of relative abundance of operational taxonomic units OTUs (%) assigned to 20 most abundant genera of individual crab gut microbiomes from 8 different sampling sites. Triangles represent east coast samples and squares represent west coast samples. The samples are clustered with unconstrained hierarchical divisive clustering routine UNCTREE. The relative abundance is square root transformed. The taxa present less than 1% are combined under “Other”.
