

Abstract
Background
Coronary artery bypass graft (CABG) surgery has become a routine surgical procedure for patients with occlusive coronary artery atherosclerosis. Worldwide, increasing levels of obesity are associated with ischemic heart disease and systemic comorbidities. This retrospective study from a single center in China aimed to investigate the effects of obesity on patient mortality following CABG surgery.
Material/Methods
Patients undergoing CABG (N=1471) were grouped according to body mass index (BMI) as normal weight (N=596), overweight (N=684), or obese (N=191). Baseline clinical characteristics and outcomes were recorded. Logistic regression analysis was performed for 30-day postoperative mortality. Kaplan-Meier survival curves were plotted, and Cox regression analysis investigated risk and protective factors for long-term mortality, with subgroup analysis for differences between on-pump and off-pump CABG groups.
Results
The 30-day postoperative mortality was 5.0% in the normal-weight group, 1.3% in the overweight group, and 0% in the obese group. BMI was an independent protective factor for 30-day postoperative mortality (odds ratio=0.748; 95% confidence interval, 0.640–0.874; P<0.001). The 10-year mortality for the groups was 13.2% (normal), 7.8% (overweight), and 12.7% (obese). The >20-year mortality rates for the groups were 33.0% (normal), 41.5% (overweight), and 12.7% (obese). There was no significant correlation between BMI and long-term mortality. Being overweight had a protective effect against long-term mortality in the off-pump CABG subgroup.
Conclusions
An “obesity paradox” was identified in postoperative outcomes in patients following CABG surgery, with an increased BMI associated with reduced 30-day postoperative mortality. This association was more significant in the off-pump CABG group.
Keywords: Body Mass Index, Coronary Artery Bypass, Follow-Up Studies, Hospital Mortality, Obesity
Background
Currently, the worldwide incidence of obesity is increasing every year. By 2025, the obesity rate of males is expected to reach 18% and that of females is expected to exceed 21% [1]. Body mass index (BMI; kg/m2) is commonly used to quantify patients’ degree of obesity [2]. Many researchers have previously reported that obesity is a risk factor for various disorders, including cardiovascular diseases, diabetes, cerebrovascular diseases, and bone diseases [3–5]. In recent years the obesity rate of patients undergoing cardiac surgery has gradually increased, and an “obesity paradox” phenomenon has been clinically observed after cardiac surgery [6]. This paradox refers to a counterintuitive phenomenon of decreased mortality in obese patients after treatment. In general, obesity increases the incidence of cardiac diseases [6], and it is thus taken for granted that obesity should also increase mortality after cardiac surgery. However, many clinical studies have highlighted a contrary phenomenon, in which obesity may have a protective effect in patients undergoing cardiac surgery [6].
Obesity is well known to increase the death rate related to coronary artery disease (CAD) [3]. Therapy methods for CAD mainly include medical management, percutaneous coronary intervention (PCI), and coronary artery bypass graft (CABG) surgery. CABG can be performed under on-pump and off-pump [7]. At present, studies on BMI and outcome after CABG are controversial and are mainly based on studies of white populations [8–10]. Chinese people differ greatly from Europeans and Americans in terms of race, lifestyle, and diet. Whether the obesity paradox exists in Chinese patients undergoing CABG remains unclear, and the relationship between BMI and postoperative outcomes needs to be investigated in this patient population. To explore the effects of obesity on patient mortality following CABG surgery, we carried out this retrospective study using data from a single center in China.
Material and Methods
Patients
This was a single-center, observational, and retrospective cohort clinical study including patients undergoing CABG. Between January 1999 and January 2017, 1587 consecutive patients underwent isolated CABG in the Department of Cardiovascular Surgery. The exclusion criteria were as follows: (1) repeat CABG; (2) age under 30 years; (3) lack of perioperative information; and (4) lack of postoperative follow-up information (Figure 1). Patients with BMI <18.5 kg/m2 (underweight) were also excluded because they were a small proportion of the cohort.
Figure 1.

Flowchart of patient selection.
Finally, 1471 patients undergoing CABG were enrolled. All patients signed written informed consent for surgical procedures and participation in this research. The consent was approved through the Ethics Committee of Shanghai East Hospital (ID2020094). The clinical trial registration number was ChiCTR2000034505. According to the Chinese definition of BMI, patients’ weights were defined as (1) normal (18.5 kg/m2 ≤BMI <24.0 kg/m2), (2) overweight (24.0 kg/m2 ≤BMI <28.0 kg/m2), and (3) obese (BMI ≥28.0 kg/m2) [11] (Figure 2).
Figure 2.
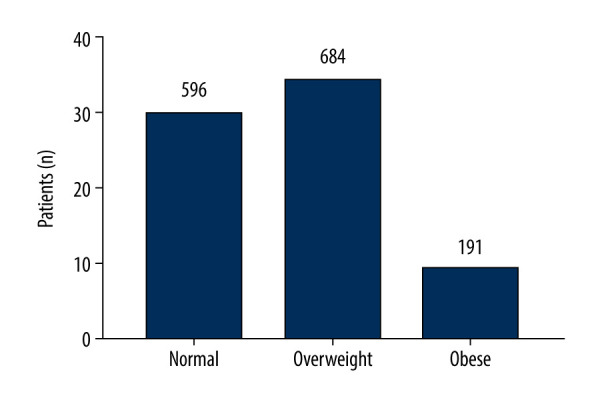
Histogram of body mass index (BMI) for the 3 groups of patients.
Baseline Characteristics
The data on clinical baseline characteristics were compared according to the 3 BMI categories. Preoperative variables included sex, age, BMI, body surface area, and types of CAD. Comorbidities included diabetes mellitus, hypertension, cerebrovascular disease, peripheral vascular disease, preoperative atrial fibrillation, chronic pulmonary disease (COPD), and pulmonary hypertension. The renal function index included serum creatinine, endogenous creatinine clearance rate (CCR), and renal failure. Other variables included left ventricular ejection fraction (LVEF), number of diseased vessels, previous PCI, New York Heart Association Grade of cardiac function (NYHA), and type of CABG. Thirty-day postoperative mortality was defined as patients dying within 30 days after operation.
Follow-Up
Routine follow-up was carried out for discharging patients. Patients were followed on the first and third months after discharge, and then regular follow-up was done every 6 months. All-cause death was recorded.
Statistical Analysis
Continuous variables are presented as mean±standard deviation (SD). Categorical variables are summarized using absolute numbers and percentages. To compare the differences between the 3 BMI categories, one-way analysis of variance (ANOVA) was used for continuous variables. Analysis of categorical variables was performed using Fisher’s exact or chi-square tests.
Thirty-day postoperative mortality was tested by univariate logistic regression. Variables with P<0.1 were entered into the multivariate analysis to explore independent risk factors related to 30-day postoperative mortality. Odds ratios (ORs) are reported with 95% confidence intervals (CIs). Fractional polynomial logistic method was used to explore variation tendency for 30-day postoperative mortality risk with the increase of BMI. All-cause intermediate-term and long-term mortality was calculated and plotted using Kaplan-Meier survival curves. All variables were analyzed using univariate Cox analysis. Variables with P<0.1 were entered into the multivariate analysis. Multivariate Cox regression analysis using variables from univariate Cox analysis revealed significantly different variables for long-term mortality. Hazard ratios (HR) are displayed with 95% CIs. Intermediate-term and long-term mortality of subgroup analysis between on-pump CABG and off-pump CABG was calculated by multivariate Cox regression.
SPSS 22.0 (IBM, Chicago, IL, USA) was performed for data processing and statistical analysis. GraphPad Prism 7 and R 4.0.3 were applied to draw the figures. Two-tailed P<0.05 represented differences with statistical significance.
Results
The present study included 1471 patients undergoing CABG. Among these patients, 596 patients were normal weight with a mean BMI of 22.17±1.28 kg/m2; 684 patients were overweight with a mean BMI of 25.75±1.10 kg/m2; and 191 patients were obese with a mean BMI of 30.10±2.16 kg/m2. Men predominated in the study cohort. The normal-weight group was 78.0% men (465/596), the overweight cohort was 77.2% men (528/684), and the obese group was 74.3% men (142/191). The 30-day postoperative mortality was 5.0% in the normal-weight group, 1.3% in the overweight group, and 0.0% in the obese group respectively (Table 1).
Table 1.
Demographic and clinical variables for coronary artery bypass grafting (CABG) patients by body mass index (BMI) groups.
| Variables | Normal (n=596) | Overweight (n=684) | Obese (n=191) | P value |
|---|---|---|---|---|
| Male sex (n,%) | 465 (78.0) | 528 (77.2) | 142 (74.3) | 0.574 |
| Age (y) | 66.36±8.03 | 64.52±8.11 | 61.75±9.55 | <0.001 |
| BMI (kg/m2) | 22.17±1.28 | 25.75±1.10 | 30.10±2.16 | <0.001 |
| BSA (m2) | 1.77±0.12 | 1.90±0.13 | 2.04±0.15 | <0.001 |
| Types of CAD | 0.399 | |||
| Stable angina pectoris (n, %) | 197 (33.1) | 244 (35.7) | 65 (34.0) | |
| Unstable angina pectoris (n, %) | 302 (50.7) | 351 (51.3) | 103 (53.9) | |
| Acute myocardial infarction (n, %) | 97 (16.3) | 89 (13.0) | 23 (12.0) | |
| Diabetes mellitus (n, %) | 188 (31.5) | 222 (32.5) | 68 (35.6) | 0.581 |
| Hypertension (n, %) | 360 (60.4) | 495 (72.4) | 147 (77.0) | <0.001 |
| Cerebrovascular disease | 0.773 | |||
| Stroke (n, %) | 17 (2.9) | 20 (2.9) | 7 (3.7) | |
| Lacunar infarction (n, %) | 96 (16.1) | 115 (16.8) | 25 (13.1) | |
| Peripheral vascular disease (n, %) | 15 (2.5) | 16 (2.3) | 3 (2.3) | 0.749 |
| Preoperative atrial fibrillation (n, %) | 22 (3.7) | 13 (1.9) | 4 (2.1) | 0.121 |
| Pulmonary hypertension (n, %) | 62 (10.4) | 68 (9.9) | 13 (6.8) | 0.332 |
| Serum creatinine (μmol/l) | 83.31±45.88 | 83.18±41.95 | 81.42±34.91 | 0.858 |
| Ccr (mL/min/1.73 m2) | 71.13±21.62 | 83.90±25.33 | 101.81±31.87 | <0.001 |
| Renal failure (n, %) | 13 (2.2) | 5 (0.7) | 1 (0.5) | 0.045 |
| LVEF<50% (n, %) | 81 (13.6) | 68 (9.9) | 18 (9.4) | 0.081 |
| Triple vessel disease (n, %) | 533 (89.4) | 616 (90.1) | 161 (84.3) | 0.145 |
| COPD (n, %) | 15 (2.5) | 19 (2.8) | 4 (2.1) | 0.863 |
| Previous PCI (n, %) | 37 (6.2) | 31 (4.5) | 11 (5.8) | 0.401 |
| NYHA | <0.001 | |||
| I (n, %) | 92 (15.4) | 69 (10.1) | 35 (18.3) | |
| II (n, %) | 375 (62.9) | 450 (65.8) | 122 (63.9) | |
| III (n, %) | 111 (18.6) | 158 (23.1) | 33 (17.3) | |
| IV (n, %) | 18 (3.0) | 7 (1.0) | 1 (0.5) | |
| Off-pump CABG (n, %) | 426 (71.5) | 540 (78.9) | 164 (85.9) | <0.001 |
| In-hospital death (n, %) | 30 (5.0) | 9 (1.3) | 0 (0.0) | <0.001 |
BMI – body mass index; BSA – body surface area; CAD – coronary artery disease; Ccr – creatinine clearance rate; LVEF – left ventricular ejection fraction; COPD – chronic obstructive pulmonary disease; PCI – percutaneous coronary intervention; NYHA – New York Heart Association; CABG – coronary artery bypass grafting.
Thirty-Day Postoperative Mortality
All clinical variables were entered into univariate analysis. Age, BMI, body surface area, types of CAD, serum creatinine, preoperative CCR, renal failure, LVEF, COPD, NYHA, and types of CABG were related to 30-day postoperative mortality. Sex, age, BMI, types of CAD, renal failure, LVEF, COPD, NYHA, and types of CABG were taken into the multivariate logistic regression. BMI showed a significant independent protective effect for 30-day postoperative mortality (OR=0.748, 95% CI 0.640–0.874, P<0.001; Table 2). Fractional polynomial logistic regression indicated 30-day postoperative mortality risk decreased as BMI increased (Figure 3).
Table 2.
Univariate and multivariate logistic regression analysis.
| Variables | Univariate logistic regression | Multivariate logistic regression | ||
|---|---|---|---|---|
| OR | P value | OR | P value | |
| Sex | 1.338 (0.659–2.717) | 0.420 | 1.231 (0.567–2.670) | 0.599 |
| Age (y) | 1.077 (1.031–1.126) | 0.001 | 1.043 (0.993–1.094) | 0.092 |
| BMI (kg/m2) | 0.710 (0.617–0.817) | <0.001 | 0.748 (0.640–0.874) | <0.001 |
| BSA (m2) | 0.013 (0.002–0.112) | <0.001 | ||
| Types of CAD | 1.576 (0.986–2.520) | 0.057 | 1.286 (0.775–2.131) | 0.330 |
| Diabetes mellitus | 0.921 (0.463–1.835) | 0.816 | ||
| Hypertension | 1.368 (0.661–2.831) | 0.398 | ||
| Cerebrovascular disease | 0.706 (0.322–1.550) | 0.386 | ||
| Peripheral vascular disease | 5.341 (1.785–15.979) | 0.003 | 4.693 (1.353–16.280) | 0.015 |
| Preoperative atrial fibrillation | – | 0.998 | ||
| Pulmonary hypertension | 0.495 (0.118–2.075) | 0.336 | ||
| Scrum creatinine (μmol/l) | 1.005 (1.002–1.008) | 0.003 | ||
| Ccr (mL/min/1.73 m2) | 0.956 (0.941–0.971) | <0.001 | ||
| Renal failure | 19.846 (7.106–55.427) | <0.001 | 8.709 (2.507–30.245) | 0.001 |
| LVEF | 0.943 (0.914–0.973) | <0.001 | 0.975 (0.937–1.013) | 0.197 |
| Triple vessel disease | 0.831 (0.320–2.157) | 0.704 | ||
| COPD | 3.326 (0.977–11.319) | 0.054 | 2.184 (0.551–8.662) | 0.266 |
| Previous PCI | 1.487 (0.448–4.938) | 0.517 | ||
| NYHA | 0.893 (1.825–4.585) | <0.001 | 2.146 (1.286–3.582) | 0.003 |
| Types of CABG | 1.892 (0.972–3.683) | 0.060 | 1.827 (0.867–3.849) | 0.113 |
BMI – body mass index; BSA – body surface area; CAD – coronary artery disease; Ccr – creatinine clearance rate; LVEF – left ventricular ejection fraction; COPD – chronic obstructive pulmonary disease; PCI – percutaneous coronary intervention; NYHA – New York Heart Association; CABG – coronary artery bypass grafting.
Figure 3.
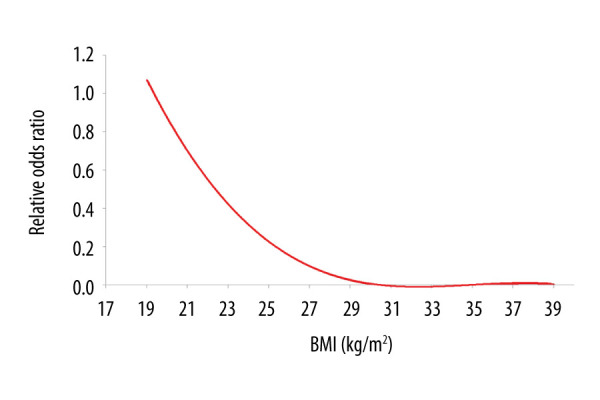
Fractional polynomial logistic regression of relationship between body mass index (BMI) and the risk of 30-day postoperative mortality.
Follow-Up
All patients, excluding those who died within the 30-day postoperative period (n=39), were followed using a formal procedure for outpatients or by telephone. The mean follow-up time (minimum value to maximum value) was 65.3 (1.0–259.3) months. During the follow-up period, 85 patients died, which accounted for 5.9% of the total follow-up cohort (n=1432). The time frame for long-term mortality was defined as 10 to 20 years. The 10-year mortality for the 3 groups was 13.2% (normal group), 7.8% (overweight group), and 12.7% (obese group), and the 20-year mortality was 33.0%, 41.5%, and 12.7%, respectively.
The Kaplan-Meier analysis showed that normal-weight patients versus overweight patients (P=0.05) and normal-weight patients versus obese patients (P=0.74) were not significantly different. In total, 697, 160, 23, and 2 patients were at risk at 5, 10, 15, and 20 years (Figure 4).
Figure 4.
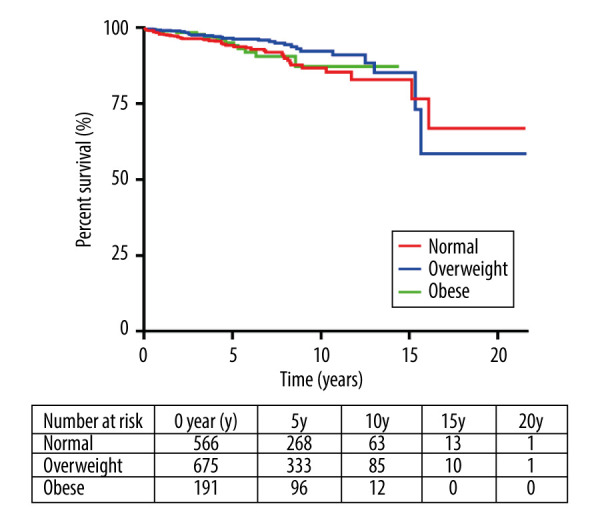
Kaplan-Meier survival curves for mortality in normal-weight, overweight, and obese patients.
Intermediate-Term and Long-Term Mortality
All clinical variables were brought into univariate analysis. Age, cerebrovascular disease, pulmonary hypertension, serum creatinine, preoperative CCR, renal failure, and NYHA were related to long-term mortality. Sex, age, BMI, cerebrovascular disease, pulmonary hypertension, preoperative CCR, renal failure, and NYHA were included in the multivariate Cox regression. BMI showed no significant relationship with long-term mortality (Table 3). According to the multivariate Cox regression forest figure, outcomes of all-cause intermediate-term (within 3 years and 6 years) and long-term (within 10 years and 20 years) mortality showed that different degrees of obesity following CABG had no significant difference. However, for 10-year mortality, overweight showed a protective trend versus normal weight (HR=0.61, 95% CI 0.37–1.00, P=0.054; Figure 5).
Table 3.
Univariate and multivariate Cox regression analysis.
| Variables | Univariate Cox regression | Multivariate Cox regression | ||
|---|---|---|---|---|
| HR | P value | HR | P value | |
| Sex | 0.986 (0.597–1.629) | 0.956 | 0.936 (0.561–1.561) | 0.801 |
| Age (y) | 1.127 (1.090–1.164) | <0.001 | 1.113 (1.077–1.150) | <0.001 |
| BMI (kg/m2) | 0.952 (0.880–1.029) | 0.215 | 0.974 (0.900–1.055) | 0.522 |
| BSA (m2) | 0.670 (0.172–2.615) | 0.564 | ||
| Types of CAD | 0.926 (0.673–1.275) | 0.639 | ||
| Diabetes mellitus | 1.337 (0.861–2.077) | 0.196 | ||
| Hypertension | 1.067 (0.664–1.713) | 0.789 | ||
| Cerebrovascular disease | 1.565 (1.080–2.266) | 0.018 | 1.337 (0.911–1.963) | 0.138 |
| Peripheral vascular disease | 0.723 (0.100–5.199) | 0.747 | ||
| Preoperative atrial fibrillation | 1.113 (0.273–4.532) | 0.881 | ||
| Pulmonary hypertension | 3.237 (1.666–6.291) | 0.001 | 2.319 (1.167–4.609) | 0.016 |
| Scrum creatinine (μmol/l) | 1.003 (1.001–1.005) | 0.013 | ||
| Ccr (mL/min/1.73 m2) | 0.972 (0.963–0.982) | <0.001 | ||
| Renal failure | 4.180 (1.015–17.047) | 0.048 | 2.492 (0.576–10.783) | 0.222 |
| LVEF | 0.982 (0.957–1.008) | 0.183 | ||
| Triple vessel disease | 1.472 (0.705–3.075) | 0.303 | ||
| COPD | 0.666 (0.092–4.793) | 0.686 | ||
| Previous PCI | 0.275 (0.038–1.975) | 0.199 | ||
| NYHA | 1.692 (1.209–2.370) | 0.002 | 1.393 (0.985–1.969) | 0.061 |
| Types of CABG | 0.192 (0.097–0.382) | <0.001 | 0.233 (0.117–0.465) | <0.001 |
BMI – body mass index; BSA – body surface area; CAD – coronary artery disease; Ccr – creatinine clearance rate; LVEF – left ventricular ejection fraction; COPD – chronic obstructive pulmonary disease;PCI – percutaneous coronary intervention; NYHA – New York Heart Association; CABG – coronary artery bypass grafting.
Figure 5.

Forest plot of the body mass index (BMI) classification for long-term mortality in the overall cohort.
Subgroup Analysis
The total follow-up cohort (N=1432) was divided into 2 subgroups: on-pump CABG and off-pump CABG. Multivariate Cox regression aimed to explore all-cause intermediate-term (within 3 years and 6 years) and long-term (within 10 years and 20 years) mortality, respectively. The results showed that in the on-pump CABG group, no significant difference was found within different degrees of obesity. However, in the off-pump CABG group, overweight showed a protective function versus normal weight in long-term mortality (10-year mortality: HR=0.56, 95% CI 0.33–0.95, P=0.031; 20-year mortality: HR=0.58, 95% CI 0.35–0.97, P=0.036; Figure 6).
Figure 6.

Forest plot of the body mass index (BMI) classification for long-term mortality in on-pump and off-pump coronary artery bypass grafting (CABG) group.
Discussion
Until now, research on the relationship between obesity and mortality following CABG has shown controversial results. In our study, 1471 patients undergoing CABG were enrolled to analyze the 30-day postoperative mortality. A total of 1432 patients, excluding 39 patients who died within 30 days after surgery, were followed and the all-cause death was recorded to analyze intermediate-term and long-term mortality. We mainly found that BMI, as a continuous variable, showed an independent protective effect for 30-day postoperative mortality. However, BMI had no effect on long-term mortality in Cox analysis. Interestingly, in subgroup analysis, overweight exhibited a protective effect versus normal weight for long-term mortality.
CAD is a common cardiovascular disease, and CABG is an important treatment method for surgical revascularization to restore cardiac blood perfusion [12]. The influence of BMI on the outcome of patients undergoing CABG surgery is still highly controversial. Gürbüz et al [13] compared the incidence of postoperative adverse events in an obese group (BMI <30 kg/m2) and nonobese group (BMI ≥30 kg/m2) and found that obese patients had a higher incidence of postoperative superficial wound infection, sternum fissure, and renal failure and a lower incidence of postoperative atrial fibrillation. However, there was no significant difference in postoperative mortality between obese and nonobese patients [13]. A large number of studies on the obesity paradox in CAD patients have been reported. Terada et al [8] compared outcomes for patients after PCI or CABG and found that overweight was associated with lower postoperative mortality. In contrast, Gurm et al [10] found that long-term mortality after CABG was higher as BMI increased. The cardiac mortality of patients whose BMI was ≥35kg/m2 increased, while there was no increase in all-cause mortality [14]. The Alberta Provincial Project for Outcome Assessment in Coronary Heart Disease (APPROACH) registry study indicated a decreased all-cause mortality as BMI rose when BMI was <33 kg/m2. However, when BMI reached >33 kg/m2, the all-cause mortality increased as BMI rose [15,16]. A cohort study of 557,720 patients undergoing cardiac surgery showed a U-shaped association between postoperative mortality and BMI [17].
The National Heart, Lung, and Blood Institute and the World Health Organization (WHO) classify BMI based on the population in Western countries [18]. This classification defines overweight as 25–30 kg/m2 and obesity as >30 kg/m2. The cortical thickness estimation method was used to compare the percentage of body fat (PBF) between Chinese and American populations, and it was found that Chinese had a higher PBF with the same BMI as whites [19]. A systematic review of all data from 2002 by the WHO expert group indicated that Asians had significantly higher PBF than whites of the same age, sex, and BMI [20]. Therefore, obesity standards for Asians should be lowered (BMI <30 kg/m2). In fact, Chinese researchers suggest taking BMI ≥28 kg/m2 as the standard for obesity in Chinese individuals [21]. Researchers in India defined obesity as a BMI ≥25 kg/m2 [22], and Japanese researchers defined obesity similarly [23]. It is worth noting that the Eastern populations are quite different from Western populations, so our study defined obesity based on Cooperative Meta-Analysis Group of China Obesity Task Force criteria [11]. This definition was more reasonable for our study cohort. Our study is the first to investigate the relationship between the obesity paradox and outcome after CABG in Chinese people.
Our results indicated that differences between 30-day postoperative mortality and obesity grade were statistically significant. Multivariate logistic regression results indicated that BMI had an independent protective effect for 30-day postoperative mortality. Specifically, 30-day postoperative mortality decreased as patients’ BMI increased. Kaplan-Meier results revealed no significant difference for normal weight versus overweight and normal weight versus obesity. Multivariate Cox regression also showed no significant difference between BMI and long-term mortality. One possible explanation may be selection bias because our cohort had a lack of high-risk obese patients (BMI >40 kg/m2). Another conceivable reason was that BMI may change during the follow-up period. A similar result was reported by Chan et al [24], who found that the risk of mortality or hospital readmission among obese patients with CABG did not increase during a 5-year follow-up period. To further investigate the relationship between BMI and different types of CABG, we performed a subgroup analysis. The results indicated that in the off-pump CABG group, long-term outcomes were better for overweight patients than normal-weight patients. The current study confirmed the existence of the obesity paradox after CABG, particularly in the off-pump CABG patients.
The obesity paradox can be explained from several aspects. BMI is commonly used in routine clinical practice to measure obesity because it is easily obtained. However, BMI cannot distinguish between fat mass and lean mass [25,26]. BMI is poorly correlated with body fat mass, especially in overweight patients [25,26], and lean mass is a protective factor in patients with CAD [26]. Being underweight or having too little lean mass increases the risk of CAD patients’ mortality. So, overweight patients may not necessarily have extra fat mass, but rather more lean mass than normal-weight patients. That possibility may explain why overweight patients had a better long-term outcome than normal-weight patients in the off-pump CABG group. Several limitations exist in our study. First, this retrospective study cohort was from a single center, which may lead to selection bias. Second, BMI, rather than waist circumference or waist-hip ratio, was used to identify obesity and it may not be a good measure of obesity. Third, underweight patients were excluded from our study. Meanwhile, there were fewer obese patients and a lack of high-risk obese patients in our study. All of these factors may have led to selection bias.
Conclusions
An increased BMI was found to be associated with reduced 30-day postoperative mortality in patients following CABG surgery, and the obesity paradox was found to exist with regard to postoperative outcomes after CABG. The effects were found to be more significant in the off-pump CABG group.
Footnotes
Ethics Statement
The present study was approved by the Ethics Committee of Shanghai East Hospital (ID2020094).
Conflict of interest
None.
Source of support: This research was funded by Shanghai Municipal Natural Science Foundation (No. 20ZR1446100)
References
- 1.NCD Risk Factor Collaboration (NCD-RisC) Trends in adult body-mass index in 200 countries from 1975 to 2014: A pooled analysis of 1698 population-based measurement studies with 19·2 million participants. Lancet. 2016;387(10026):1377–96. doi: 10.1016/S0140-6736(16)30054-X. [DOI] [PMC free article] [PubMed] [Google Scholar]
- 2.Hunt BJ. The effect of BMI on haemostasis: Implications for thrombosis in women’s health. Thromb Res. 2017;151(Suppl 1):S53–55. doi: 10.1016/S0049-3848(17)30068-3. [DOI] [PubMed] [Google Scholar]
- 3.Jahangir E, De Schutter A, Lavie CJ. The relationship between obesity and coronary artery disease. Transl Res. 2014;164(4):336–44. doi: 10.1016/j.trsl.2014.03.010. [DOI] [PubMed] [Google Scholar]
- 4.Tahir M, Ahmed N, Samejo MQA, et al. The phenomenon of “obesity paradox” in neck of femur fractures. Pak J Med Sci. 2020;36(5):1079–83. doi: 10.12669/pjms.36.5.1952. [DOI] [PMC free article] [PubMed] [Google Scholar]
- 5.Koszewicz M, Jaroch J, Brzecka A, et al. Dysbiosis is one of the risk factor for stroke and cognitive impairment and potential target for treatment. Pharmacol Res. 2021;164:105277. doi: 10.1016/j.phrs.2020.105277. [DOI] [PubMed] [Google Scholar]
- 6.Hartrumpf M, Kuehnel RU, Albes JM. The obesity paradox is still there: A risk analysis of over 15 000 cardiosurgical patients based on body mass index. Interact Cardiovasc Thorac Surg. 2017;25(1):18–24. doi: 10.1093/icvts/ivx058. [DOI] [PubMed] [Google Scholar]
- 7.Hou HT, Xue LG, Zhou JY, et al. Alteration of plasma trace elements magnesium, copper, zinc, iron and calcium during and after coronary artery bypass grafting surgery. J Trace Elem Med Biol. 2020;62:126612. doi: 10.1016/j.jtemb.2020.126612. [DOI] [PubMed] [Google Scholar]
- 8.Terada T, Forhan M, Norris CM, et al. Differences in short- and long-term mortality associated with BMI following coronary revascularization. J Am Heart Assoc. 2017;6(4):e005335. doi: 10.1161/JAHA.116.005335. [DOI] [PMC free article] [PubMed] [Google Scholar]
- 9.Schwann TA, Ramia PS, Engoren MC, et al. Evidence and temporality of the obesity paradox in coronary bypass surgery: An analysis of cause-specific mortality. Eur J Cardiothorac Surg. 2018;54(5):896–903. doi: 10.1093/ejcts/ezy207. [DOI] [PubMed] [Google Scholar]
- 10.Gurm HS, Whitlow PL, Kip KE. The impact of body mass index on short- and long-term outcomes inpatients undergoing coronary revascularization. Insights from the bypass angioplasty revascularization investigation (BARI) J Am Coll Cardiol. 2002;39(5):834–40. doi: 10.1016/s0735-1097(02)01687-x. [DOI] [PubMed] [Google Scholar]
- 11.Zhou BF Cooperative Meta-Analysis Group of the Working Group on Obesity in China. Predictive values of body mass index and waist circumference for risk factors of certain related diseases in Chinese adults – study on optimal cut-off points of body mass index and waist circumference in Chinese adults. Biomed Environ Sci. 2002;15(1):83–96. [PubMed] [Google Scholar]
- 12.Koechlin L, Zenklusen U, Doebele T, et al. Analysis of myocardial ischemia parameters after coronary artery bypass grafting with minimal extracorporeal circulation and a novel microplegia versus off-pump coronary artery bypass grafting. Mediators Inflamm. 2020;2020:5141503. doi: 10.1155/2020/5141503. [DOI] [PMC free article] [PubMed] [Google Scholar]
- 13.Gürbüz HA, Durukan AB, Salman N, et al. Obesity is still a risk factor in coronary artery bypass surgery. Anadolu Kardiyol Derg. 2014;14(7):631–37. doi: 10.5152/akd.2014.4954. [DOI] [PubMed] [Google Scholar]
- 14.Romero-Corral A, Montori VM, Somers VK, et al. Association of bodyweight with total mortality and with cardiovascular events in coronary artery disease: A systematic review of cohort studies. Lancet. 2006;368(9536):666–78. doi: 10.1016/S0140-6736(06)69251-9. [DOI] [PubMed] [Google Scholar]
- 15.Wenaweser P, Daemen J, Zwahlen M, et al. Incidence and correlates of drug-eluting stent thrombosis in routine clinical practice. 4-year results from a large 2-institutional cohort study. J Am Coll Cardiol. 2008;52(14):1134–40. doi: 10.1016/j.jacc.2008.07.006. [DOI] [PubMed] [Google Scholar]
- 16.Oreopoulos A, McAlister FA, Kalantar-Zadeh K, et al. The relationship between body mass index, treatment, and mortality in patients with established coronary artery disease: A report from APPROACH. Eur Heart J. 2009;30(21):2584–92. doi: 10.1093/eurheartj/ehp288. [DOI] [PMC free article] [PubMed] [Google Scholar]
- 17.Mariscalco G, Wozniak MJ, Dawson AG, et al. Body mass index and mortality among adults undergoing cardiac surgery: A nationwide study with a systematic review and meta-analysis. Circulation. 2017;135(9):850–63. doi: 10.1161/CIRCULATIONAHA.116.022840. [DOI] [PubMed] [Google Scholar]
- 18.Clinical guidelines on the identification, evaluation, and treatment of overweight and obesity in adults – the evidence report. National Institutes of Health. Obes Res. 1998;6(Suppl 2):51S–209S. [PubMed] [Google Scholar]
- 19.Pham DD, Lee SK, Shin C, et al. Koreans do not have higher percent body fat than Australians: implication for the diagnosis of obesity in Asians. Obesity (Silver Spring) 2019;27(11):1892–97. doi: 10.1002/oby.22610. [DOI] [PubMed] [Google Scholar]
- 20.WHO Expert Consultation. Appropriate body-mass index for Asian populations and its implications for policy and intervention strategies. Lancet. 2004;363(9403):157–63. doi: 10.1016/S0140-6736(03)15268-3. [DOI] [PubMed] [Google Scholar]
- 21.He W, Li Q, Yang M, et al. Lower BMI cutoffs to define overweight and obesity in China. Obesity (Silver Spring) 2015;23(3):684–91. doi: 10.1002/oby.20995. [DOI] [PubMed] [Google Scholar]
- 22.Misra A, Chowbey P, Makkar BM, et al. Consensus statement for diagnosis of obesity, abdominal obesity and the metabolic syndrome for Asian Indians and recommendations for physical activity, medical and surgical management. J Assoc Physicians India. 2009;57:163–70. [PubMed] [Google Scholar]
- 23.Examination Committee of Criteria for ‘Obesity Disease’ in Japan; Japan Society for the Study of Obesity. New criteria for ‘obesity disease’ in Japan. Circ J. 2002;66(11):987–92. doi: 10.1253/circj.66.987. [DOI] [PubMed] [Google Scholar]
- 24.Chan PG, Sultan I, Gleason TG, et al. Contemporary outcomes of coronary artery bypass grafting in obese patients. J Card Surg. 2020;35(3):549–56. doi: 10.1111/jocs.14415. [DOI] [PubMed] [Google Scholar]
- 25.Melenovsky V, Kotrc M, Borlaug BA, et al. Relationships between right ventricular function, body composition, and prognosis in advanced heart failure. J Am Coll Cardiol. 2013;62(18):1660–70. doi: 10.1016/j.jacc.2013.06.046. [DOI] [PubMed] [Google Scholar]
- 26.Lavie CJ, De Schutter A, Patel DA, et al. Body composition and survival in stable coronary heart disease: Impact of lean mass index and body fat in the “obesity paradox”. J Am Coll Cardiol. 2012;60(15):1374–80. doi: 10.1016/j.jacc.2012.05.037. [DOI] [PubMed] [Google Scholar]