Abstract
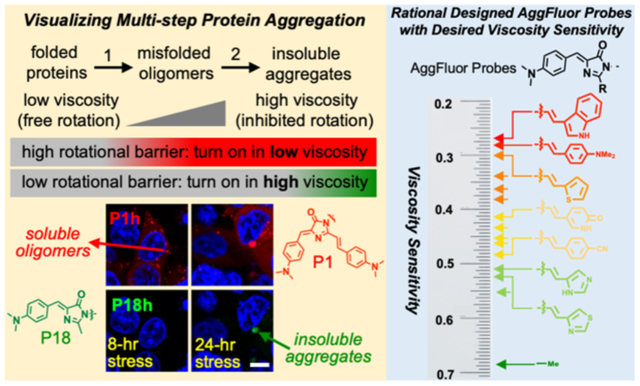
Aberrantly processed or mutant proteins misfold and assemble into a variety of soluble oligomers and insoluble aggregates, a process that is associated with an increasing number of diseases that are not curable or manageable. Herein, we present a chemical toolbox, AggFluor, that allows for live cell imaging and differentiation of complex aggregated conformations in live cells. Based on the chromophore core of green fluorescent proteins, AggFluor is comprised of a series of molecular rotor fluorophores that span a wide range of viscosity sensitivity. As a result, these compounds exhibit differential turn-on fluorescence when incorporated in either soluble oligomers or insoluble aggregates. This feature allows us to develop, for the first time, a dual-color imaging strategy to distinguish unfolded protein oligomers from insoluble aggregates in live cells. Furthermore, we have demonstrated how small molecule proteostasis regulators can drive formation and disassembly of protein aggregates in both conformational states. In summary, AggFluor is the first set of rationally designed molecular rotor fluorophores that evenly cover a wide range of viscosity sensitivities. This set of fluorescent probes not only change the status quo of current imaging methods to visualize protein aggregation in live cells, but also can be generally applied to study other biological processes that involve local viscosity changes with temporal and spatial resolutions.
Graphical Abstract
INTRODUCTION
Protein aggregation is a multistep process that has been associated with a growing number of human diseases, including neurodegenerative disorders, metabolic disorders, and some cancers1–4. Misfolding yields misfolded monomers, which subsequently associate with one another to form misfolded oligomers (step 1 in Figure 1a). Misfolded oligomers evolve into insoluble aggregates in forms of amyloid-β fibrils, amorphous aggregates, or stress granules (step 2 in Figure 1a). Decades of studies have delineated the structure, interaction, and activity of proteins in either their natively folded structures or in insoluble aggregates such as amyloid fibrils. However, a variety of intermediate species exist between these two extreme states in the protein folding landscape. Herein, we collectively term these conformations as misfolded oligomers, including soluble oligomers and pre-amyloidal oligomers whose formation is driven by misfolded proteins. Accumulating evidence shows that the misfolded oligomers may play key roles in both cell physiology and pathology5–7. Furthermore, it is important to distinguish insoluble aggregates from misfolded oligomers, because they do not only have distinct functions in cells, but also are managed differently by cells8, 9.
Figure 1: Proposed AggFluor probes can activate fluorescence differently with misfolded oligomers or insolouble aggregates via controlling their excited state rotational energy barrier.
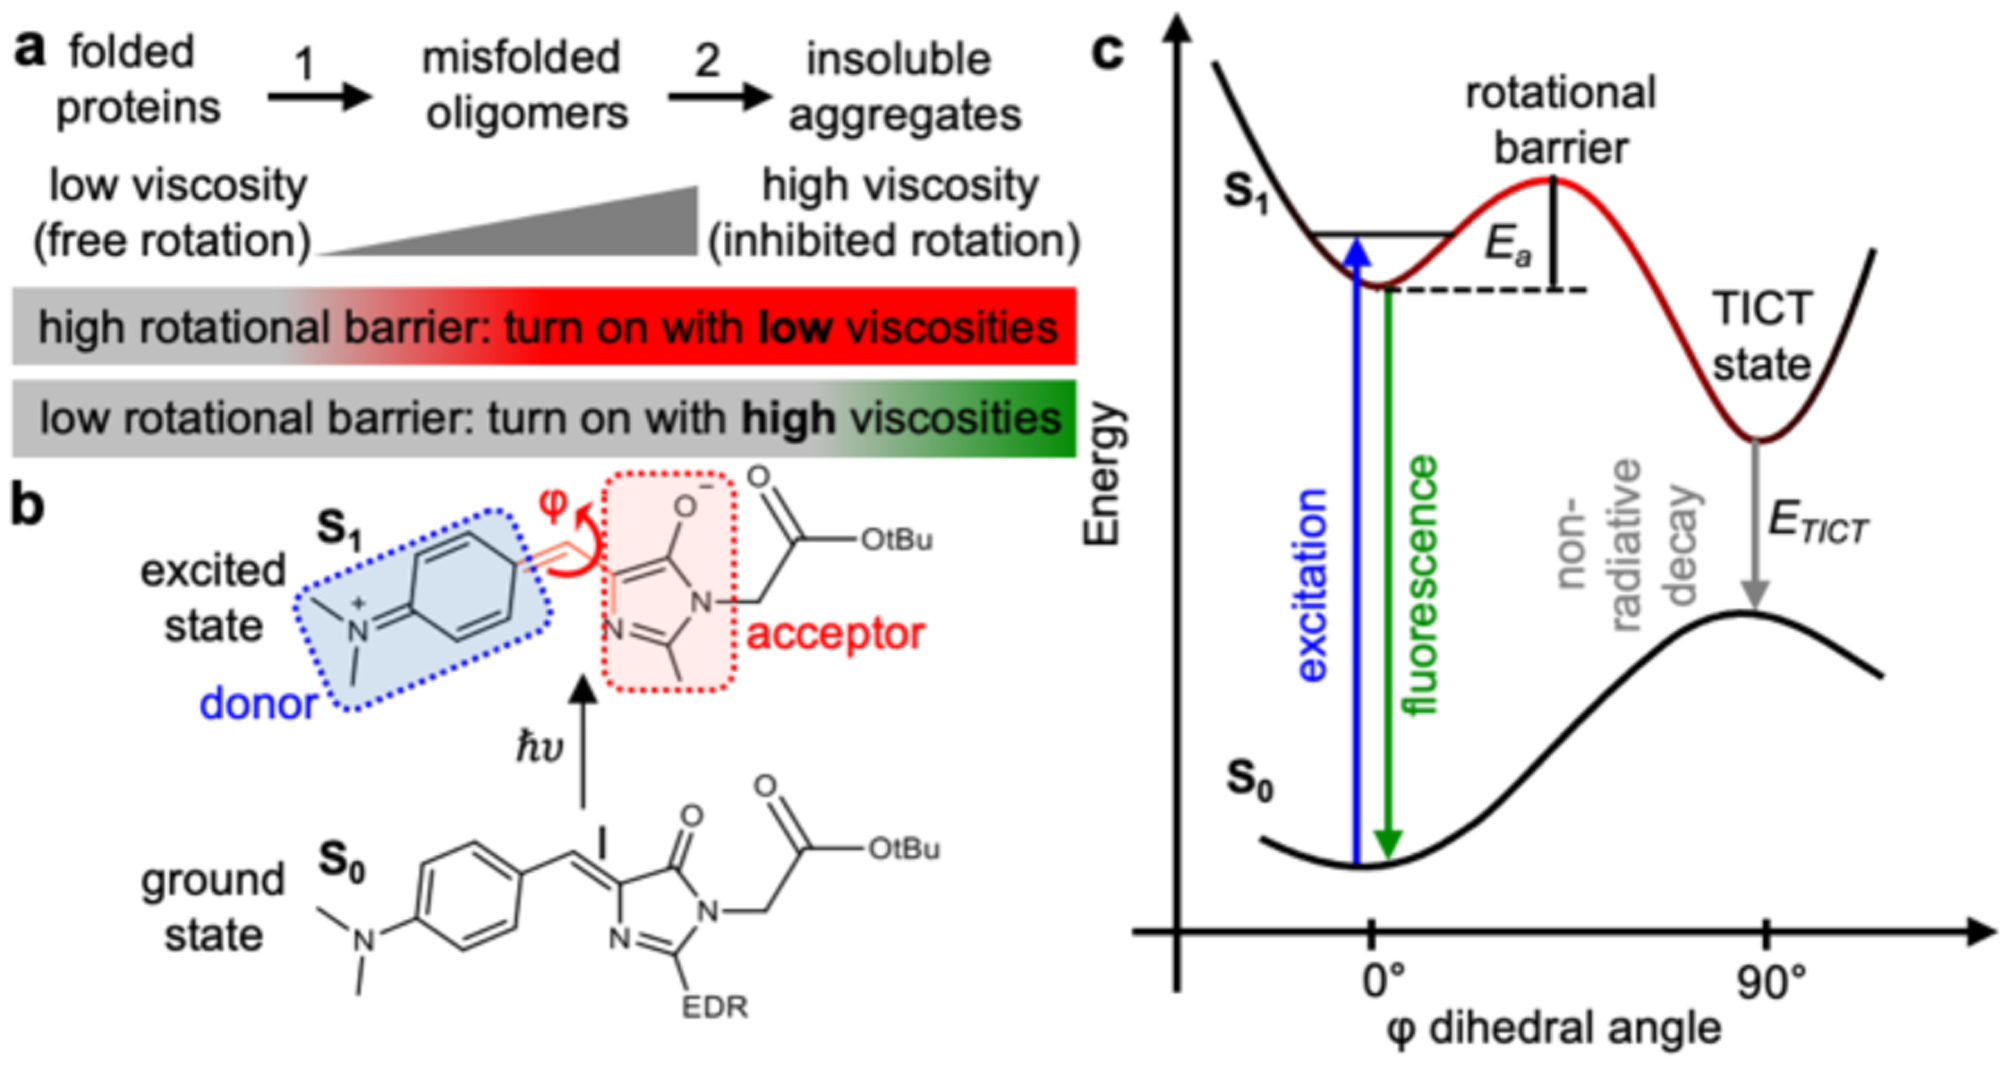
a) Diagram of how the fluorogenic AggFluor probes could visualize protein aggregation. Probes with lower barriers should activate fluorescence with both misfolded oligomers and insoluble aggregates. Whereas, probes with higher barriers should only activate fluorescence with insoluble aggregates. b) Structure of HBI at both the ground S0 and excited S1 states. At the S1 excited state, rotation occurs along the phenolate ring (P) or imidazoline ring (I) bond, wherein the prominent nonradiative decay pathway is via the rotation along the I bond as defined by the φ dihedral angle. c) The Jablonski diagram of AggFluor probes that harbor a rotational barrier between the luminescent state to the dark TICT state.
The need to reliably detect protein aggregation in live cells has promoted the emergence of a group of fluorescent-based methods. Firstly, chemical dyes (such as the PROTEOSTAT assay kit) can detect intracellular insoluble aggregates. However, this assay requires cell fixation and membrane permeabilization, thus not suited for live cells. Secondly, fluorescence microscopy using fusion of fluorescent proteins (FP) or labeling of fluorescent probes to protein-of-interest (POI) and Raman scattering microscopy using metabolic labeling have been used to visualize POI’s aggregation by observing fluorescent granules in live cells10–14. Because this method exhibits optical signals before and after misfolding, it is thus not suited to visualize soluble oligomers as these oligomers often show similar diffusive structures to folded proteins. Thirdly, diffusion constants of FP-fused POI can be quantified to differentiate insoluble aggregates from folded proteins15, 16. Such assays may not easily distinguish misfolded oligomers from folded proteins because both exhibit similar diffusion constants. Fourthly, luciferase signal has been used to quantify protein aggregates17. However, this method lacks the live cell imaging capacity. Finally, fluorescence resonance energy transfer (FRET) of FP-fused POI has been used to distinguish misfolded oligomers from folded proteins18, 19. Unfortunately, this method is laborious and can encounter complications because these two conformations may exhibit similar FRET signals. Thus, despite efforts in past few decades, no simple and direct method has been reported that enables enable live cell imaging to detect the intermediate species of protein aggregation, differentiates misfolded oligomers and insoluble aggregates, and monitors transition between these two conformations.
Herein, we report a series of novel fluorescent probes named AggFluor that, for the first time, allow for the direct visualization of the multistep protein aggregation process in live cells. When AggFluors are covalently conjugated to a protein tag (e.g., HaloTag) that is genetically fused to folded POI, their fluorescence is quenched. However, formation of misfolded oligomers and/or insoluble aggregates of the POI inhibits quenching and yields turn-on fluorescence. AggFluor is based on the synthetic green fluorescent protein (GFP) chromophore, 4-hydroxybenzylidene-imidazolinone (HBI, Figure 1b)20 and belongs to the family of molecular-rotor based fluorophores that have been widely applied in biological imaging21–30. HBI undergoes rotation along the I bond at excited state (φ angle in Figure 1b), thus exhibiting dark fluorescence due to nonradiative decay via twisted intramolecular charge transfer (TICT)31. Chemical and biological restrictions, as well as environmental viscosity, are capable of restoring HBI’s fluorescence emission via inhibiting its rotation at excited states32–38. In a previous work, we reported the first HBI derivative, AggFluor P1, which harbors a diarylethene extension to the dimethylamino benzyl group (Figure 2a and Supplementary Figure S1)39. Although P1 exhibits turn-on fluorescence in both misfolded oligomers and insoluble aggregates, it is unable to distinguish granules that contain misfolded oligomers or insoluble aggregates because misfolded oligomers can reside in granular structures that appear to be almost identical to granules formed by insoluble aggregates.
Figure 2: AggFluor P1 harbors a rotational barrier that could explain its fluorescence activation with misfolded oligomers of lower viscosities.
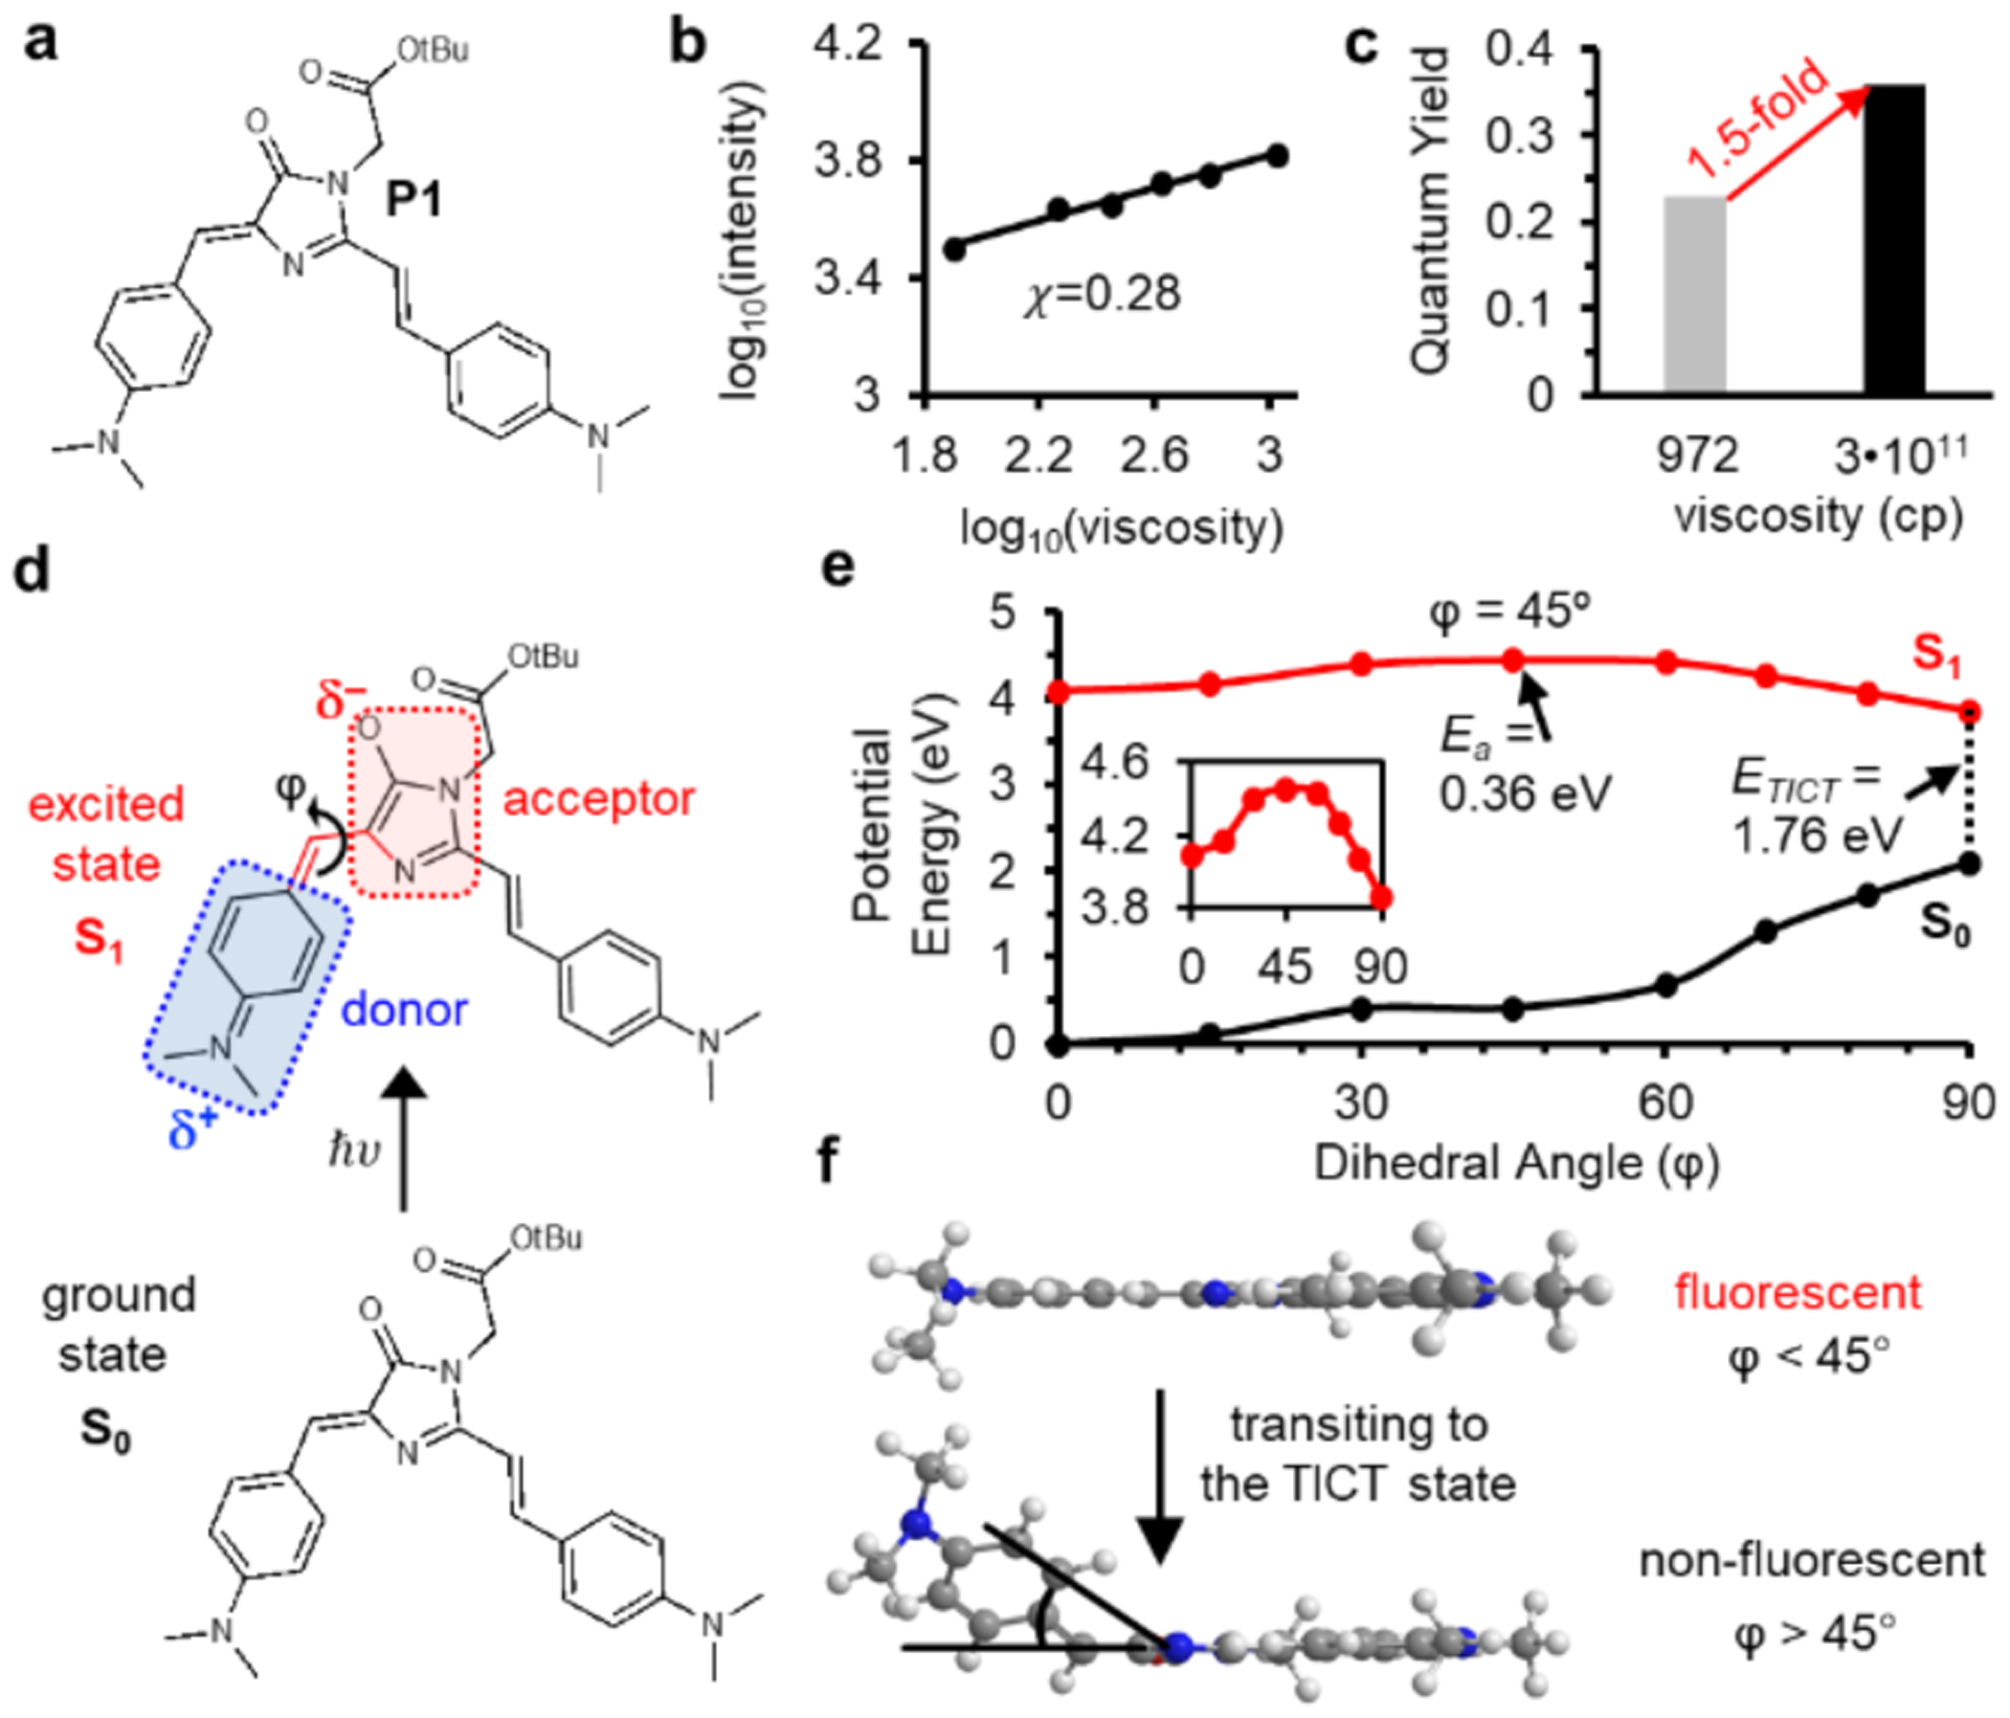
a) Structure of P1. b) Measurement of viscosity sensitivity (x) using the linear fitting of double logarithmic plots of intensity versus viscosity using ethylene glycol/glycerol mixtures, P1 shows a low viscosity sensitivity x = 0.28. c) Fluorescent intensity of P1 increase by 1.5-fold from glycerol (972 cp) to glycerol at −80°C (3•1011 cp) d). Diagram showing the donor and acceptor of P1 upon excitation. TICT state is formed via rotation between donor and acceptor along the dihedral angle φ. e) SA-CASSCF rigid scan over angle φ identifies the excited state rotational barrier at 45° with Ea = 0.36 eV. f) TICT initiates at rotational angles greater than 45°.
To further differentiate misfolded oligomers from insoluble aggregates, we explored the chemical principle that controls activation of HBI fluorescence in varying viscosities. We found that the correlation between rotational inhibition and environmental viscosity is primarily due to the excited state rotation barrier between the luminescent and TICT states (Figure 1c). Furthermore, we discovered that rotational barrier is controlled by an independent moiety that forms electron conjugation with HBI, herein termed as electron density regulator (EDR). Computational and structured analyses showed that π electron density of EDR is positively related to the energetic height of HBI’s excited state rotation barrier. Guided by this mechanism, we have created a series of HBI-based AggFluor probes that harbor a tunable gradient of viscosity sensitivity, wherein fluorophores with high rotational barriers activate fluorescence in lower viscosity than fluorophores with low rotational barriers (Figure 1a). Using these novel fluorophores, we were able to present a dual-color imaging technique that can differentiate misfolded protein oligomers and insoluble aggregates, thus revealing the entire pathway of the protein aggregation process in both test tubes and live cells (Figure 1a). Furthermore, we used this technique to demonstrate how small molecule proteostasis regulators can drive formation and disassembly of protein aggregates in both conformational states, providing important basis for future therapeutic exploration towards a wide spectrum of protein misfolding diseases that are rooted in protein aggregation.
RESULTS AND DISCUSSION
Mechanisms underlying activation of AggFluor P1 fluorescence with misfolded oligomers.
To develop AggFluor probes, we first attempted to understand why AggFluor P1 activates fluorescence in both misfolded oligomers and insoluble aggregates. Previous studies have shown a more porous and loosely-packed environment for misfolded oligomers and a more solid and tightly-packed structure for insoluble aggregates40. We hypothesized that P1 should bear chemical properties to activate fluorescence in a microenvironment with low viscosity. To test this hypothesis, we quantified how P1 activates fluorescence at varying viscosities, using a series of ethylene glycol and glycerol mixtures (Figure 2b)41. The slope (x) of P1’s fluorescence intensity as a function of viscosity was determined to be 0.28, a relatively low value when compared to commonly used molecular rotors including 9-(dicyanovinyl) julolidine (DCVJ, x = 0.50) and Thioflavin-T (ThT, x = 0.66)41. We found that the fluorescence quantum yield Ф of P1 in glycerol modestly increased from 0.22 to 0.33 when viscosity dramatically increased from 972 cp at 25 °C to 3•1011 cp at −80 °C (Figure 2c and Table S1)42, suggesting that P1 emits fluorescence even in solvents of low viscosity.
To investigate the mechanisms of activated P1 fluorescence in low viscosities, we calculated the potential energy profile when the electron donor (the dimethylaminobenzyl group at C4 of the imidazolinone heterocycle) rotates along the I bond relative to the electron acceptor (the imidazolinone heterocycle particularly the 5’-carbonyl group) at the S1 excited state (Figure 2d and Tables S2–3)39. Herein, the I-bond rotational profile was defined by the φ angle increasing from 0° to 90°, representing fluorescent and TICT states respectively (Figure 2d). Using the state-average complete active space self-consistent field (SA-CASSCF) method43, we identified a rotational barrier at φ angle of 45° and an activation energy (Ea) of 0.36 eV at the S1 excited state (Figure 2e and Table S4). Twisted molecular conformation with φ > 45° lead to the TICT state (φ = 90°) that quenches fluorescence. At TICT state, the energy gap (ETICT) between the S1 and S0 states was determined to be 1.76 eV (Figure 2e). Based on these results, P1 would effectively emit fluorescence without entering the TICT state if φ angles were within 0–30° (top panel of Figure 2f). However, P1 fluorescence would be quenched if the φ angle is greater than 45° as it reaches the TICT state (bottom panel of Figure 2f). Taken together, our findings demonstrate that the height and position of rotational barrier of P1 might explain why its fluorescence is activated in misfolded oligomers.
Rational design of AggFluor probes with a gradient of viscosity sensitivities.
We investigated how we can design AggFluor probes with desired viscosity sensitivity. For P1, we found that its LUMO molecular orbitals of the diarylethene group overlapped with the acceptor to form π conjugation that elongated to the donor (Figure 3a). Because conjugated π orbitals resist rotation, we hypothesized that π electron density of the diarylethene group would lead to a higher rotational barrier of P1 (Figure 3b). Herein, we named the diarylethene group as electron density regulator (EDR), whose π electron density should be positively correlated with the activation energy (Ea) of rotation and control the viscosity sensitivity.
Figure 3: Rational design of AggFluor probes with desired viscosity sensitivities.
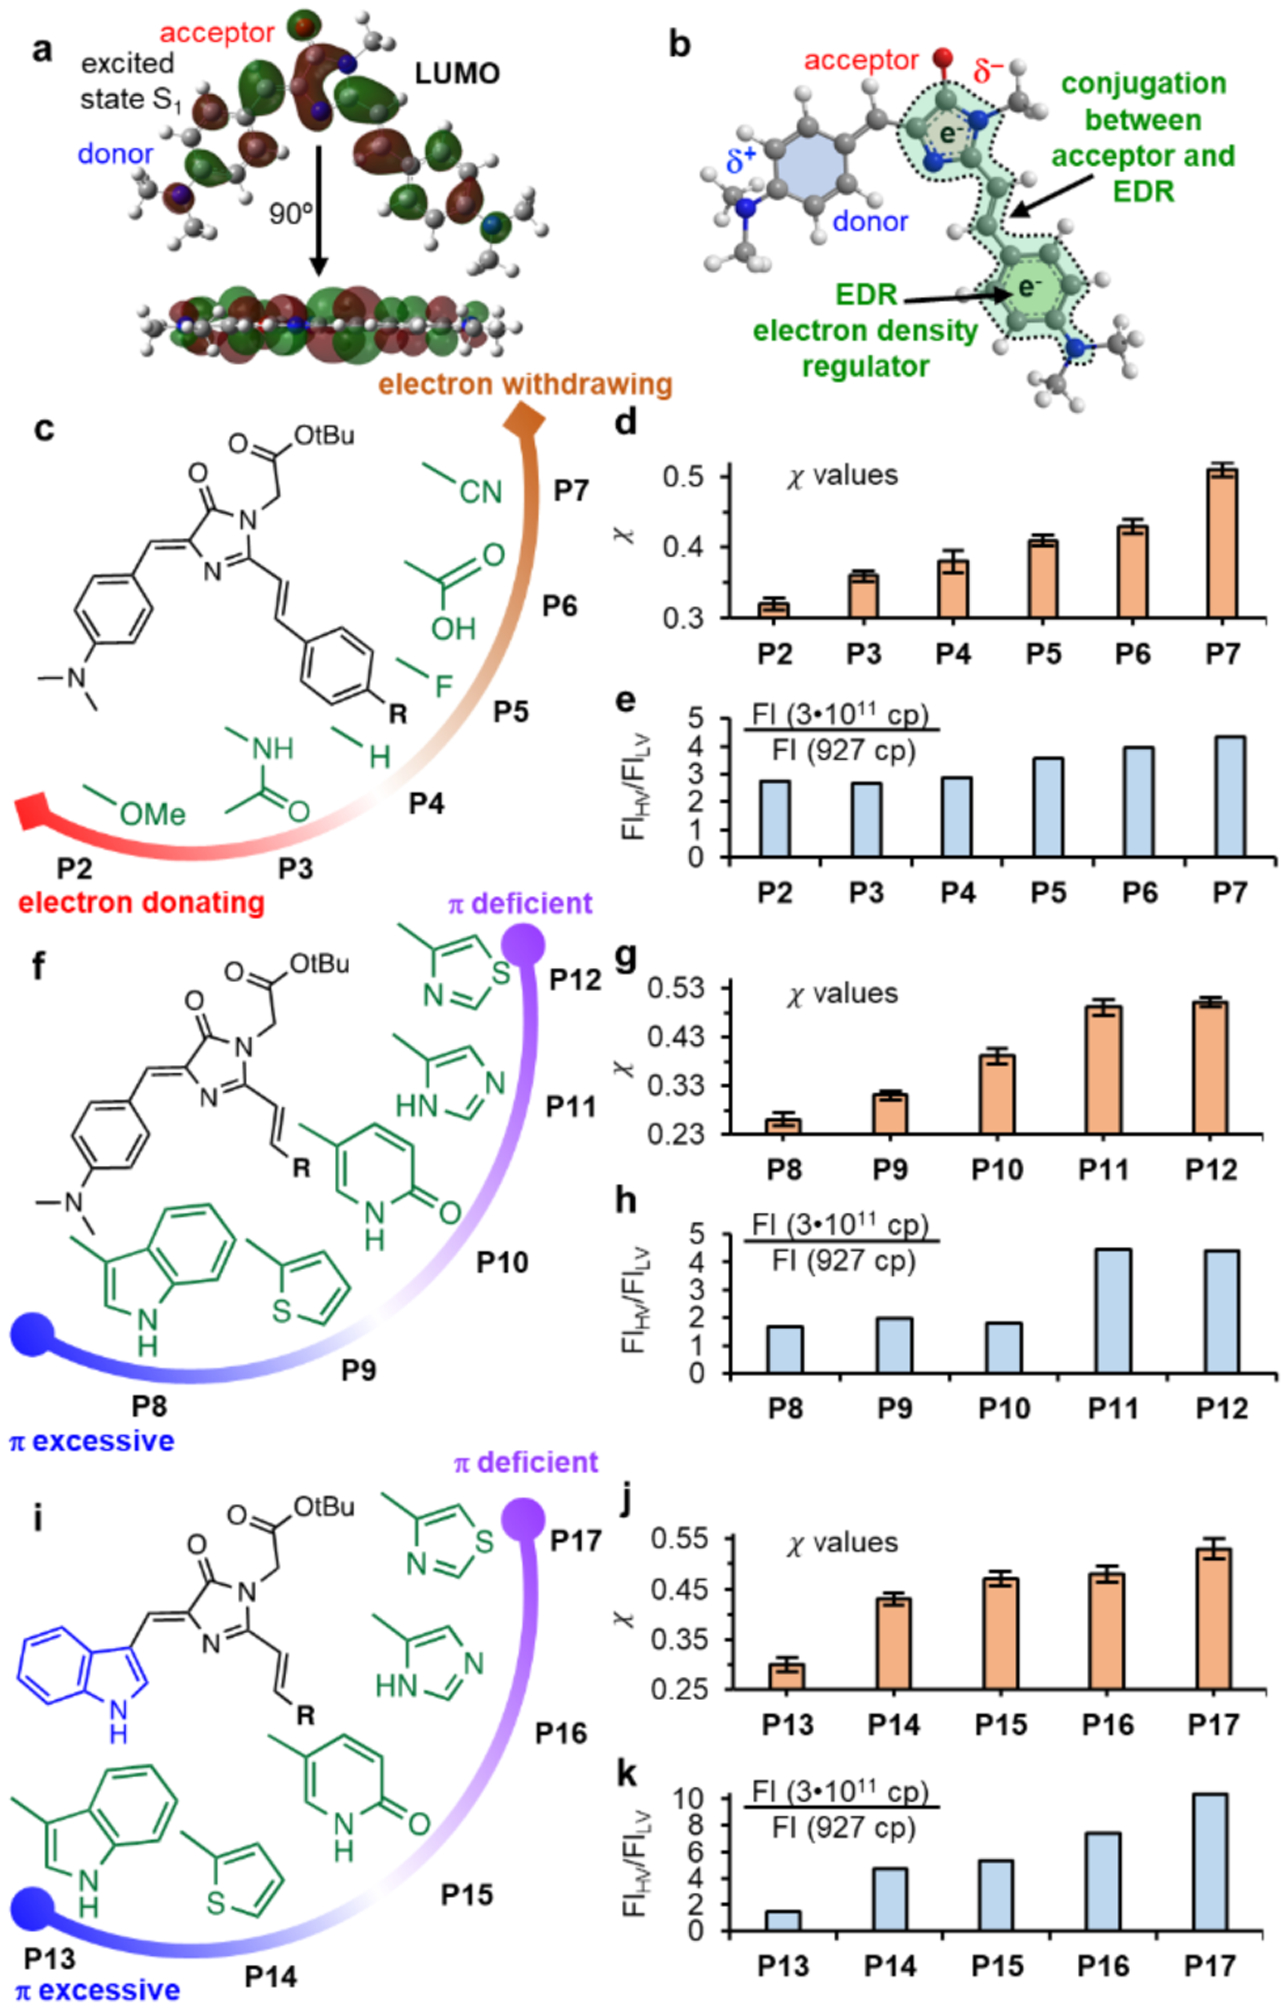
a) LUMO orbitals of P1 at excited state clearly show conjugation from the diarylethene moiety. b) Conjugation between the acceptor and EDR is proposed to control excited rotational barriers. c) Structure of P2–P7. d–e) P2–P7: the x values and fluorescence intensity increase in viscosities 3•1011 cp versus 927 cp. f) Structure of P8-P12. g–h) P8–P12: the x values and fluorescence intensity increase in viscosities 3•1011 cp versus 927 cp. i) Structure of P13-P17. j-k) P13–P17: the x values and fluorescence intensity increase in viscosities 3•1011 cp versus 927 cp.
Guided by this rationale, we synthesized AggFluor probes with varying EDRs and determined their viscosity sensitivity as the x value. In addition, the fold of fluorescence increase (FIHV/FILV) was quantified when viscosity increased from 972 (glycerol at 25 °C, FILV) to 3•1011 (glycerol at −80 °C, FIHV). For probes with decreasing π electron densities of EDR, we expect lower Ea values that are reflected by increasing x and FIHV/FILV values. Firstly, we replaced the 4’dimethylamine of EDR by groups with varying electron donation or withdrawal capabilities (P2–P7 in Figure 3c and Figures S2–7). Probes with slightly weaker electron donating groups than the dimethylamino donating group in P1 (x=0.28; Figure 2b), still show low x values (0.32 for P2 with methoxy and 0.36 for P3 with amide; Figure 3d, Figures S21 and Table S1), whereas probes with electron withdrawing groups exhibited higher x values (0.43 for P6 with carboxylic acid and 0.51 for P7 with nitrile). Consistent to these results, the FIHV/FILV value increased when π electron density of EDR decreased (Figure 3e). Secondly, we replaced the dimethylamino benzyl moiety by heterocycles with varying π electron densities and aromaticities (P8–P12 in Figure 3f and Figures S8–12). As predicted, x values similar to P1 were observed for π excessive heterocycles (0.26 for P8 with indole and 0.31 for P9 with thiophene; Figures 3g, Figures S22 and Table S1). By contrast, the π deficient heterocycles resulted in higher x values (0.49 for P11 with imidazole and 0.50 for P12 with thiazole). Similarly, the FIHV/FILV values also increased when the heterocycles varied from π excessive to π deficient moieties (Figure 3h). Finally, we replaced the donor group from dimethylaminobenzene to indole (mimicking the chromophore core of cyan fluorescent protein, CFP; P13–P17 in Figure 3i and Figures S13–17), with a goal to demonstrate that the effect of EDR is independent of the donor. Similar to P8–P12, π excessive heterocycles resulted in lower x values than π deficient heterocycles, shown as 0.30 for indole (P13) and 0.53 for thiazole (P17) (Figures 3j–k, Figures S23 and Table S1).
These results reveal that molecular orbitals of EDR form extended π conjugates that regulate activation energy of the rotational motion. Guided by this mechanism, we replaced the EDR of P1 with a methyl group, resulting in P18 (Figure 4a and Figure S18). The x value of P18 was determined as 0.68 (Figure 4b), 2.4-fold greater than that of P1 (0.28, Figure 2b). The FIHV/FILV value of P18 was determined to be 11-fold (Figure 4c), greater than that of P1 (1.5-fold, Figure 2c). This data suggests that P18 tends to activate its fluorescence only with high viscosity. We calculated the energy profile as the φ angle increased from 0° to 90°, representing fluorescent and TICT states respectively (Figure 4d, Tables S6–8). The SA-CASSCF analyses revealed key differences between P1 and P18 (Figure 4e, Tables S4 and S8): P18 exhibited a lower barrier (Ea is 0.36 eV for P1 and 0.08 eV for P18), a smaller angle as the transition state of rotation (45° for P1 and 30° for P18), and a smaller energy gap at the TICT state (ETICT is 1.76 eV for P1 and 1.38 eV for P18; Figures 2e and 4d). Milliken charge analyses revealed that charge transfer started to occur at different φ = 30° along the pathway to TICT (Figure 4f, Table S9). This charge transfer profile is different from P1, which starts to initiate TICT at rotations with φ > 45° (Figure 4f). Thus, P18 can emit fluorescence only when its donor rotates around φ angles within 30°; though beyond 30°, P1 would cross the transition state towards fluorescence quenching (Figure 4g).
Figure 4: Mechanisms underlying the different fluorescent activation behavior of P1 and P18.
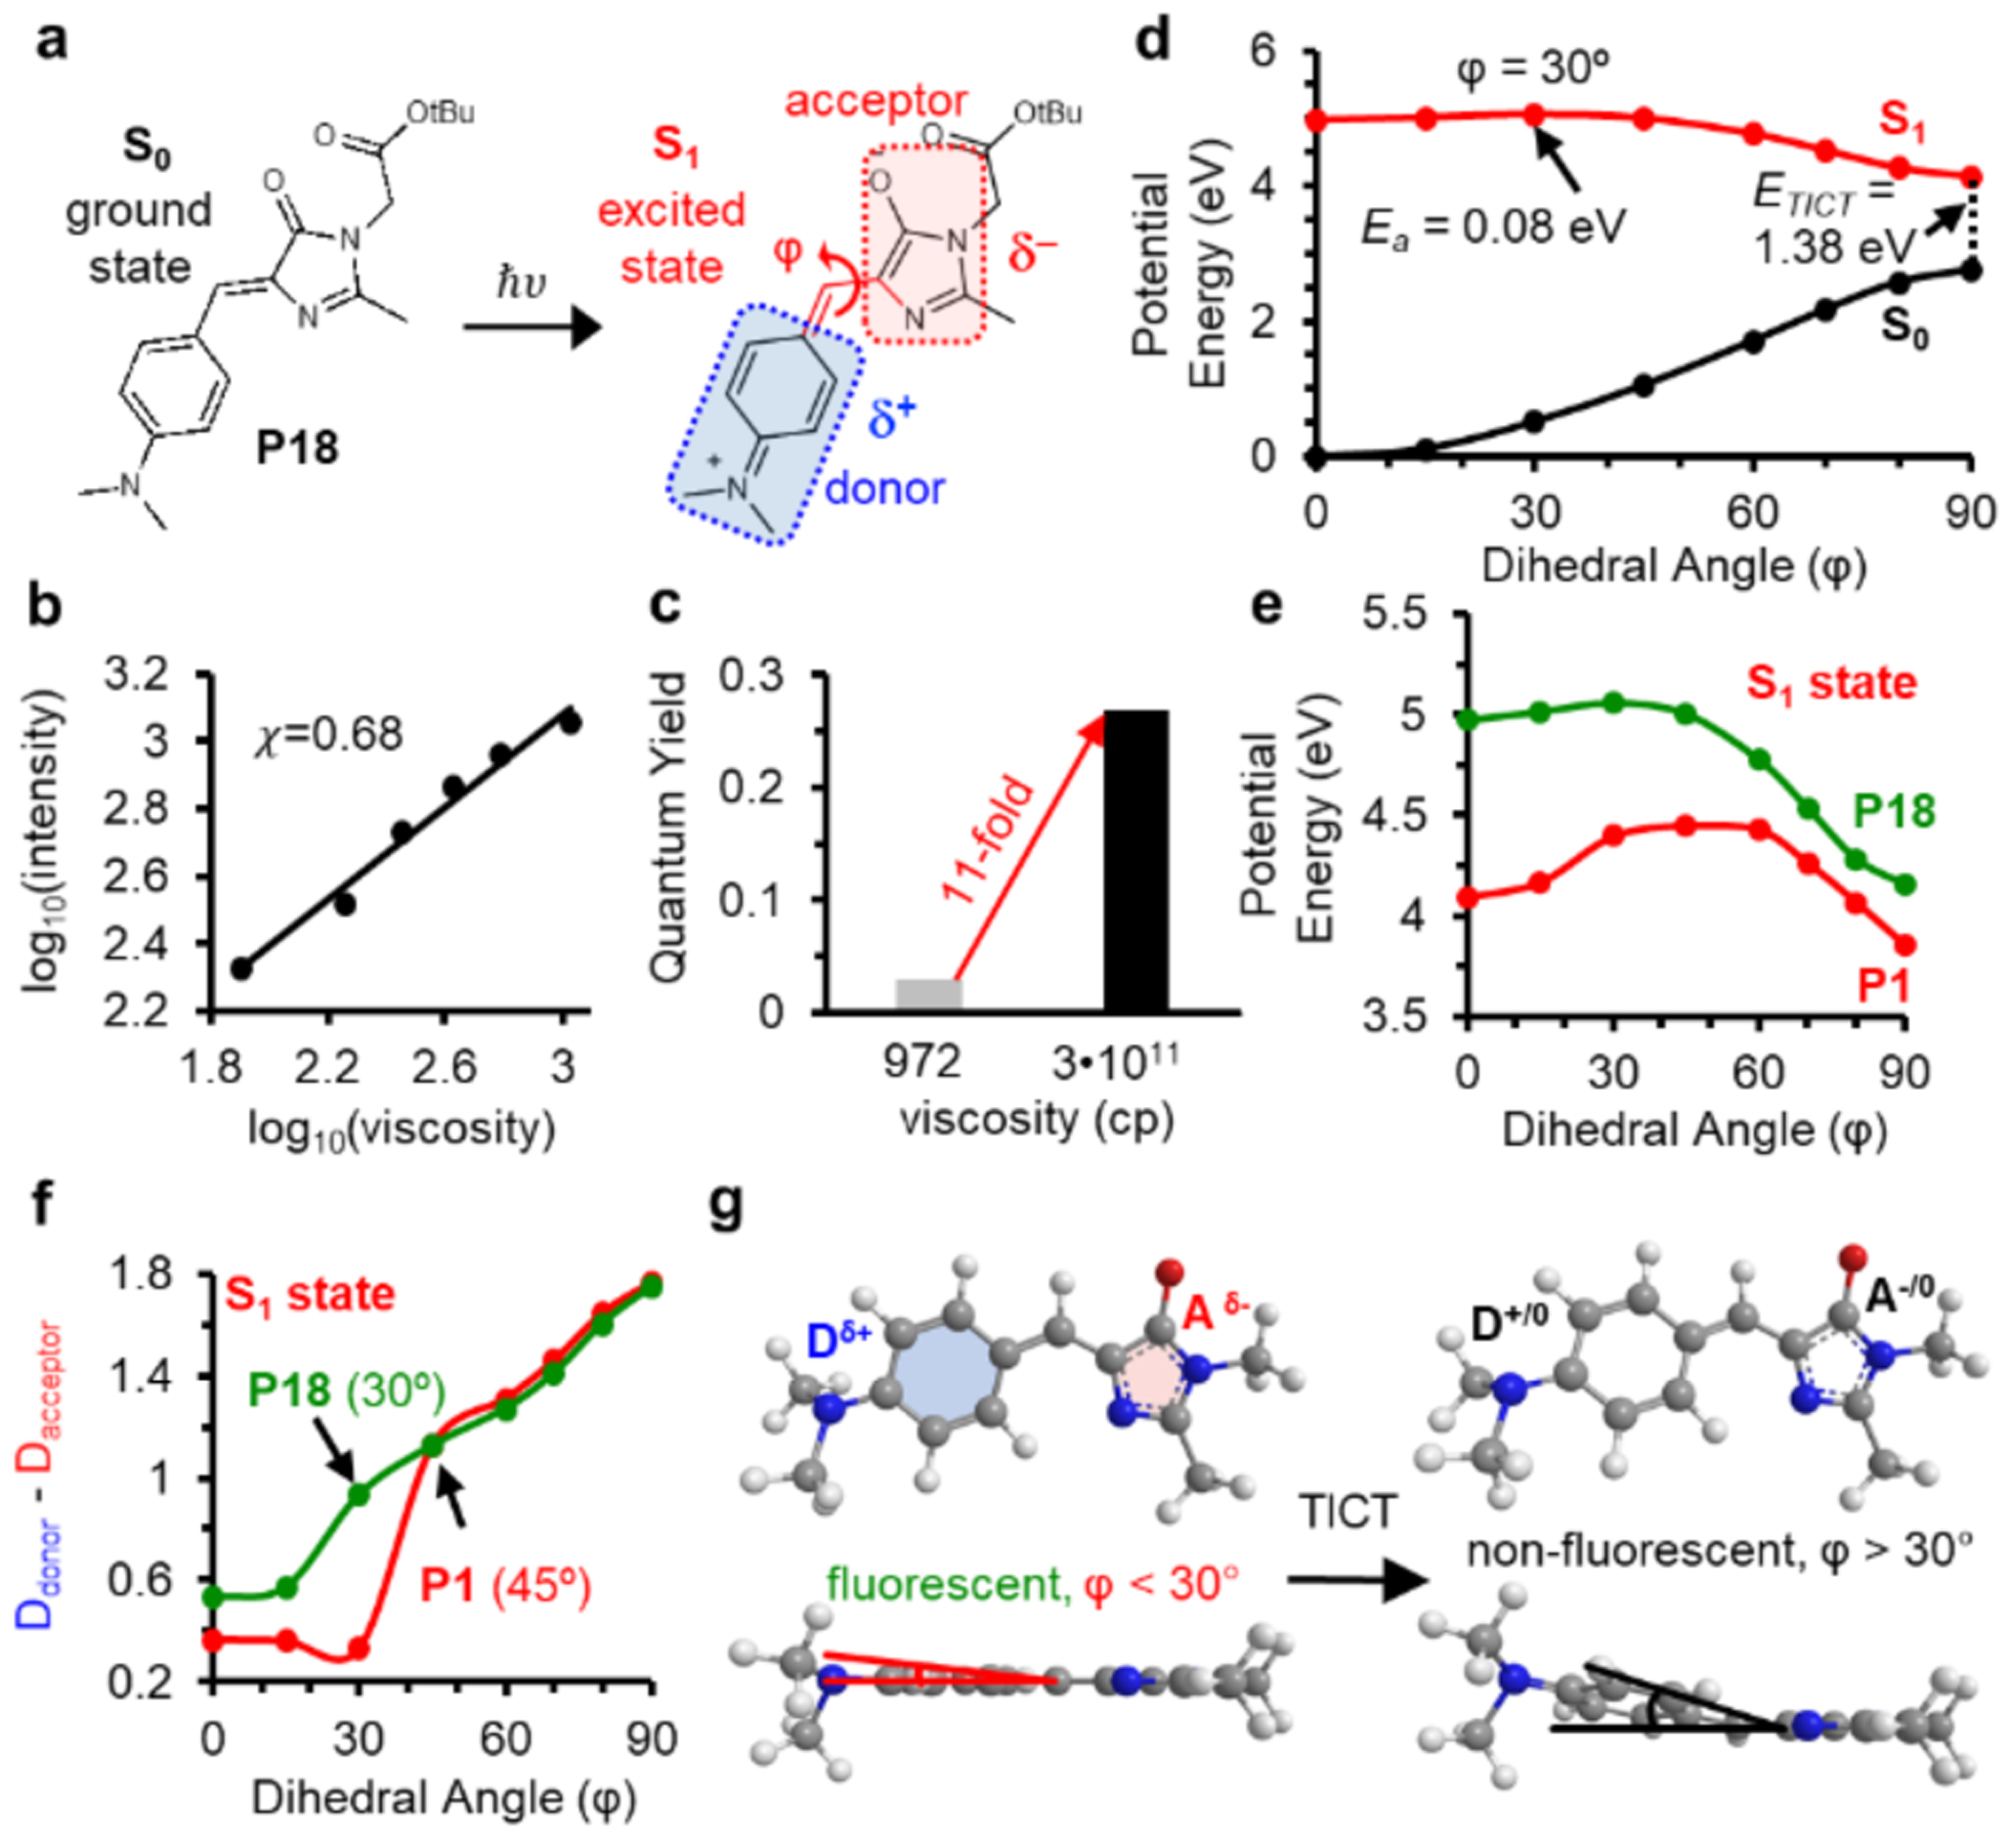
a) Structure of P18 and diagram showing the donor and acceptor of P18 upon excitation. b) Viscosity sensitivity (x = 0.68) of P18. c) Fluorescent intensity of P18 increase by 11-fold from glycerol (972 cp) to glycerol at −80°C (3•1011 cp) d) SA-CASSCF rigid scan over angle φ identifies the excited state rotational barrier at 30° with Ea = 0.06 eV. e) Rotational potential energy surfaces of P1 (red) and P18 (greed) at the S1 excited state. f) Mulliken charge analyses reveals TICT initiates at φ angles of 45° for P1 and 30° for P18. g) TICT for P18 initiates at rotational angles greater than 30°.
Collectively, using EDR to control the excited state rotational barrier allows for the creation of AggFluor P1–P18, whose x values almost evenly cover the range from 0.27 to 0.68, While probes with lower x values (similar to P1) should activate fluorescence in local environment that have lower viscosities, probes with higher x values (represented by P18) would only be fluorescent with highly viscous surroundings.
AggFluor probes P1h and P18h differently detect the protein aggregation process.
Next, we chose P1 and P18 to demonstrate the ability of the AggFluor probes to report on the multistep protein aggregation process, expecting that P1 activates fluorescence with misfolded oligomers and P18 only is fluorescent with insoluble aggregates (Figure 5a). To this end, we employed the recently developed AggTag method (Figure 5b), wherein P1 or P18 could be covalently conjugated with the HaloTag-fused protein-of-interest (POI-Halo)39. Using an optimized HaloTag linker and reactive warhead, P1 and P18 can be extended into the microenvironment surrounding the POI, and thus is able to emit turn-on fluorescence upon misfolding or aggregation of Halo-POI (Figure 5b).
Figure 5: P1 and P18 differentially detect the multistep process of protein aggregation.
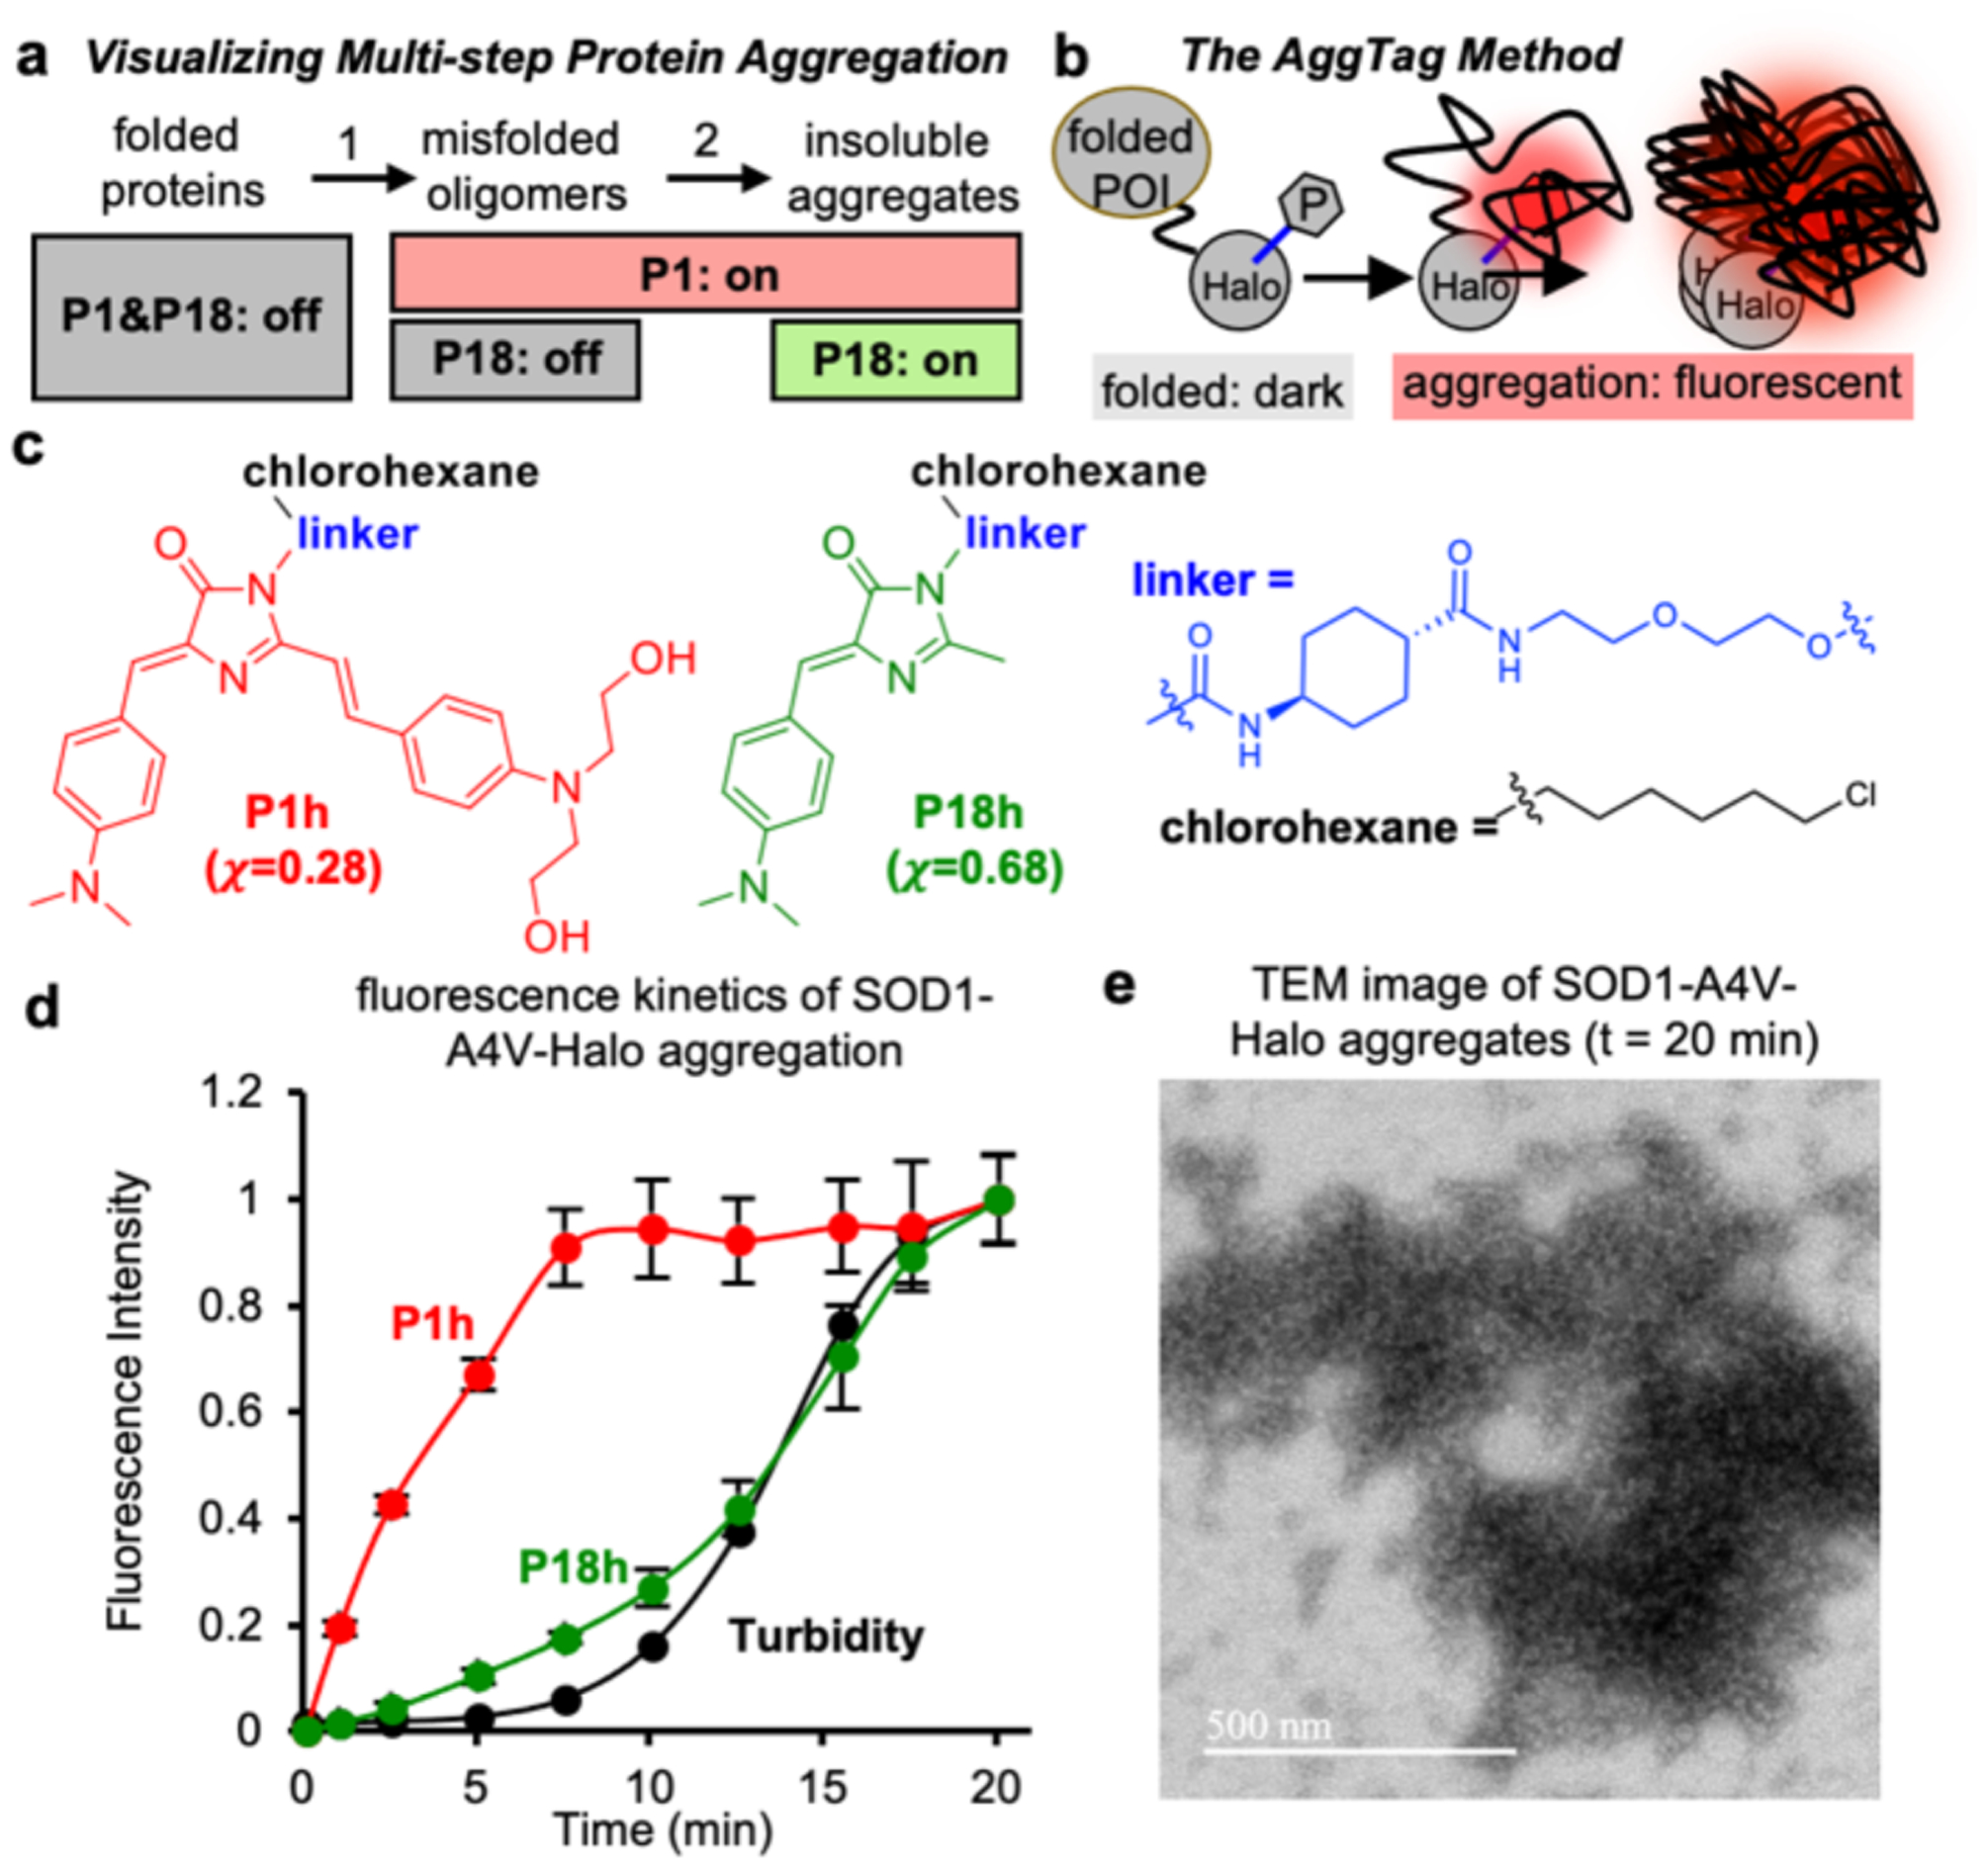
a) P1 detects both misfolded oligomers and insoluble aggregates. Whereas, P18 should only detect insoluble aggregates. b) Diagram of the AggTag method. POI: protein-of-interest, P: AggFluor probes. c) Structure of the P1h and P18h. d) Fluorescence and turbidity kinetics of heat-induced SOD1-A4V-Halo aggregation at 59°C, 25 μM proteins and 5 μM probes. e) TEM images of SOD1-A4V-Halo aggregates reveal large tightly packed structures (59°C, 25 μM proteins, 20 min).
Destabilized mutants of superoxide dismutase 1 (SOD1-A4V) was used as an example, whose aggregation has been associated with Amyotrophic Lateral Sclerosis44. We synthesized HaloTag-reactive AggFluor P1h and P18h (Figure 5c), which were conjugated to purified SOD1-A4V-Halo protein and both exhibited low fluorescent background with negligible quantum yield (ϕ < 0.02). Aggregation of SOD1-A4V-Halo could be induced by heating at 59 °C, and the formation of insoluble aggregates could be measured using turbidity (black curve, Figure 5d). Before the increase in the turbidity signal, we observed an initial lag phase that could indicate the formation of unfolded oligomers before they progress into insoluble aggregates. When SOD1-A4V-Halo was conjugated with P1h (x=0.28), its fluorescence increased immediately after the incubation at 59°C and reached the plateau around at the end of the lag phase of turbidity (red curve, Figure 5d). The rapid kinetics of P1h fluorescence indicates its detection of misfolded oligomers, consistent to previous studies39. When P18h (x=0.68) was used in an identical assay, we found that its fluorescence kinetic profile was comparable to that of turbidity (green curve, Figure 5d). This result supports our hypothesis that fluorescence of P18h is only activated when surrounded by highly viscous insoluble aggregates. Transmission electron microscopy (TEM) further revealed that the insoluble aggregates of SOD1-A4V-Halo exhibited amorphous and tightly packed structures, explaining why rotation of P18h could be stalled to activate its fluorescence (Figure 5e).
In addition to SOD1-A4V-Halo, we also tested another well-established aggregation-prone protein, Fluc-R188Q-Halo10. Using P1h, we again found its fluorescence activated quickly upon heating, as P1h fluorescence is known to correspond to the amount of oligomers in the solution (red curve, Figure S24a), showing a kinetics much faster than the turbidity signal (black curve, Figure S24a).39 By contrast, fluorescence of P18h was poorly activated even when the turbidity signal was prominent at 25 min, reaching only 25% of the P18h fluorescence when conjugated with SOD1-A4V-Halo aggregates (green curve, Figure S24a). This observation was explained by TEM images of Fluc-R188Q-Halo aggregates at 25 min heating: contrary to dense aggregates of SOD1-A4V-Halo, Fluc-R188Q-Halo formed small and low-density aggregates (Figure S24b). This structural feature could support the low fluorescence of P18h, as these low-density aggregates could not restrict rotation of P18h due to its low rotational barrier. P1h with a higher barrier, however, can be effectively activated in both misfolded oligomers and low-density insoluble Fluc-R188Q-Halo. Collectively, these results suggest that probes with rationally controlled viscosity sensitivity allow detection and differentiation of multiple steps of protein aggregation.
Direct visualization of the multi-step protein aggregation process in live cells using AggFluor probes P1h and P18h.
It is desirable to distinguish insoluble aggregates from misfolded oligomers in live cells because they have distinct functions and are managed differently by cells8, 9. While there are no current techniques available to achieve this goal, we envision that a combination of P1h and P18h can enable a two-color imaging platform, wherein fluorescence of P1h (Ex/Em = 540/640 nm) and P18h (Ex/Em = 450/520 nm) can monitor misfolded oligomers and insoluble aggregates (Figure 6a, Figures S19–20). For both P1h and P18h, we observed low fluorescence background in the absence of stress that induces protein misfolding (Figure 6b). The minimal fluorescence was not due to the lack of protein expression, as demonstrated by a triple-probe labeling experiment using P1h, P18h and the always-fluorescent coumarin ligand in cells expressing SOD1-A4V-Halo, Htt-Q19-Halo and HaloTag (Figures S25–26).
Figure 6: P1h and P18h differentiate misfolded oligomers and insoluble aggregates in live cells.
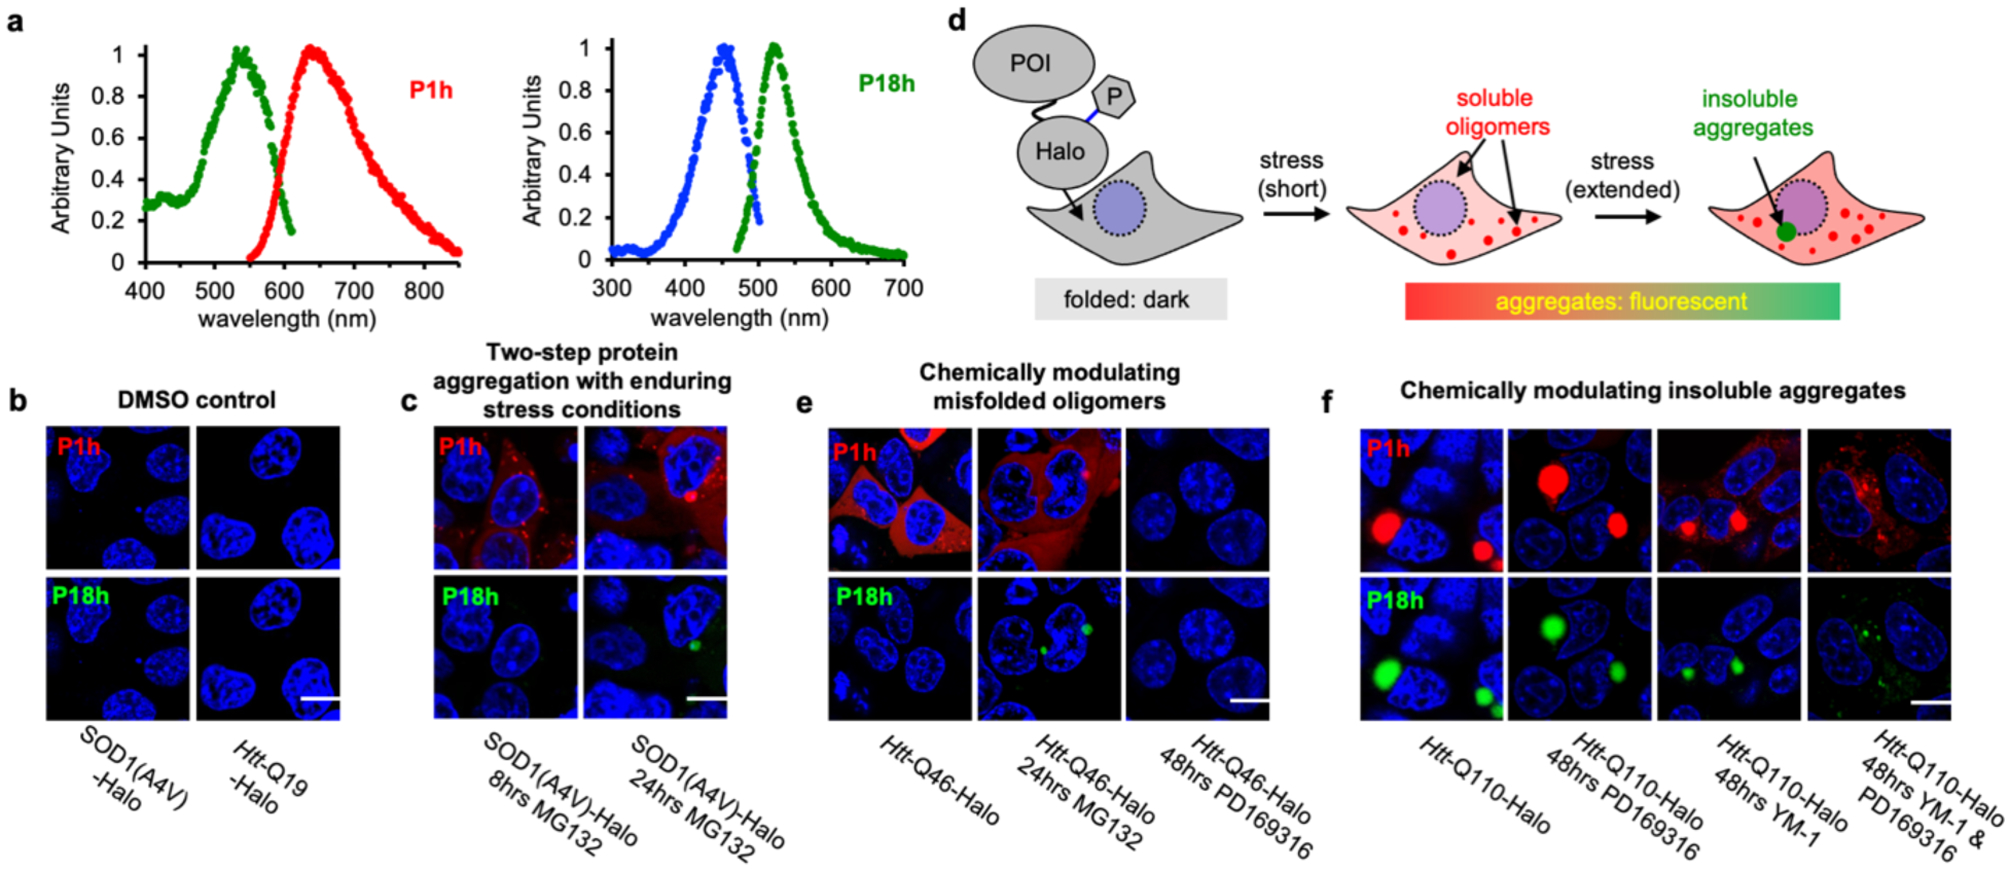
a) Normalized excitation and emission spectra of P1h (in glycerol, 25 °C) and P18h (in glycerol, −80 °C). b) Dark background of P1h and P18h in the absence of protein aggregates. HEK293T cells were treated with 0.5 μM of P1h and P18h during transfection of desired proteins. c) MG132-induced (5uM) SOD1-A4V-Halo aggregation at 8 and 24 h. At 8 h, P1h exhibited fluorescence in both diffusive and small granular misfolded oligomers while P18h remained dark. At 24 h, P18h exhibited fluorescence only in perinuclear granular aggresomes and P1h remained to be fluorescent in both diffusive and small granular misfolded oligomers. HEK293T cells were treated with 0.5 μM of P1h and P18h during transfection of desired proteins. 5 μM MG132 were added at 24 h post-transfection. d) In cells expressing POI-Halo, stress conditions induce POI aggregation that forms misfolded oligomers (with short stress durations) and subsequently insoluble aggregates (with extended stress durations). e) Chemical modulation of Htt-Q46-Halo aggregates. Left panel: Htt-Q46-Halo forms diffusive misfolded oligomers that were detected only by P1h but not P18h. Middle panel: MG132 drives Htt-Q46-Halo to form perinuclear aggresomes that can be detected by P18h. Right panel: PD169316 eliminated fluorescence signal for both P1h and P18h. HEK293T cells were treated with 0.5 μM of P1h and P18h during transfection of desired proteins. 5 μM MG132 was added at 24 hrs post-transfection and 1 μM PD169316 was added at 30 min post-transfection. f) Left panel: Htt-Q110-Halo forms only perinuclear granular aggresomes that were detected by P1h and P18h. Chemical dis-aggregation of Htt-Q110-Halo. While PD169316 (1 μM) showed no effect on Htt-Q110-Halo aggregates, YM-1 (1 μM) reduced size of aggresomes. Co-treatment of PD169316 and YM-1 (both at 1 μM) resulted in further reduced aggresomes and appearance of misfolded oligomers. 1 μM PD169316 and/or YM-1 were added at 30 min post-transfection. Blue: Hochster 33342; scale bar: 5 μm.
We treated cells expressing SOD1-A4V-Halo with the proteasome inhibitor MG132 at 5 μM (Figure S25). In an 8h induction of stress, we observed P1h fluorescence activation in both diffusive and small granular structures (Figure 6c and Figure S27). At this point in time, P18h fluorescence remained dark, comparable to its background in unstressed cells. When this stress condition persists to an extended 24-h period, we observed large nuclear-adjacent granules that exhibited green fluorescence from both P1h and P18h (Figure 6c and Figure S27), corresponding to aggresomes that encapsulate insoluble aggregates40. In addition to A4V, we also examined other pathogenic mutants of SOD1, including G85R and G93A44. In cells treated with 5 μM MG132 for 8 h and 24 h, we observed activated fluorescence of P1h and dark signal of P18h for both mutants, suggesting their ability to form misfolded oligomers but not dense insoluble aggregates (Figures S28–29). This observation is consistent to previous reports that A4V is a more aggregation-prone mutant than G85R and G93A44. By contrast, cells expressing wild-type SOD1-Halo exhibited minimal fluorescence for both P1h and P18h when treated with 5 μM MG132 for 8 h, suggesting that the wild-type SOD1 is resistant to stress-induced protein aggregation (Figure S30). Thus, the combination of P1h and P18h allows us, for the first time, to monitor the two-step aggregation process of SOD1-A4V in cells treated with MG132, particularly using two distinct colors to simultaneously visualize the intermediate misfolded oligomers in their granular or diffusive form and the final product as insoluble aggregates in aggresomes (Figure 6d).
Proteostasis regulators intervene the multistep protein aggregation process.
This unprecedented imaging capacity allows us to explore how small molecule proteostasis regulators can intervene the process of protein aggregation with a focus on how they could promote or prevent formation of misfolded oligomers or insoluble aggregates45, 46. To test this notion, we chose the Huntingtin exon 1 protein with expansion of a polyglutamine tract within its N-terminal domain (Htt-polyQ)47, well known for its protein aggregation and association with Huntington’s disease. As previously reported, Htt-polyQ with repeats shorter than Q78 form predominantly soluble oligomeric protein aggregates in the cytosol7, 48. Consistent to this notion, we observed fluorescence signal only from P1h but not from P18h (left panels, Figure 6e and Figure S31), when Htt-Q46-Halo was expressed in HEK293T cells. Treating cells with 5 μM MG132 for 24 h clearly induced misfolded oligomers of Htt-Q46-Halo to form aggresomes that exhibited fluorescence signals from both P1h and P18h (center panels, Figure 6e). Similar to Htt-Q46-Halo, Htt-Q72-Halo also was found to form misfolded oligomers that can be driven to insoluble aggregates, as observed in a time-lapse imaging experiment wherein the misfolding oligomers of Htt-Q72-Halo appeared first and then condensed to form aggresomes that exhibit fluorescence signals from both P1h and P18h (Figure S33). Interestingly, the Htt-Q72-Halo puncta showed an average diameter via P1h fluorescence to be 5.5 ± 0.50 μm and P18h fluorescence to be 4.3 ± 0.54 μm (Figure S34b, n=6). This result indicates that there are different misfolding states in the Htt-Q72-Halo aggresomes, wherein the core region is composed of insoluble aggregates and the shell area is primarily misfolded oligomers. These findings collectively suggest that misfolding proteins are degraded by ubiquitous-proteasome system and inhibition results in a buildup of misfolded oligomers and formation of insoluble aggregates. Thus, we hypothesized that proteasome activators, as exemplified by the recently discovered compound PD16931649, should clear misfolded oligomers. As expected, treatment with an established proteasome activator PD169316 (1 μM) leads to clearance of Htt-Q46-Halo misfolded oligomers as shown by the lack of red fluorescence (right panels, Figure 6e and Figure S31).
Htt-Q110 is a highly aggressive Htt mutant that forms exclusively large aggresomal structures even without cellular stress7. When expressed in HEK293T cells, Htt-Q110-Halo formed exclusively perinuclear aggresomes, a form of insoluble aggregates, which exhibited bright fluorescence from both P1h and P18h (left panels, Figure 6f). The average diameter of Htt-Q110-Halo perinuclear aggresomes were determined P1h fluorescence to be 4.4 ± 0.43 μm, almost identical to the values as measured via P18h fluorescence to be 4.1 ± 0.45 μm (Figure S34a). This result suggests that aggresomes formed by Htt-Q110-Halo contain primarily insoluble aggregates. Thus, activation of proteasome by PD169316 (1 μM) exerted a minimal effect on Htt-Q110-Halo aggresomes (center left panel, Figure 6f). It was reported previously that activation of heat-shock protein 70 (Hsp70) could reduce the formation of Htt aggresomes50. To test this idea, cells expressing Htt-Q110-Halo were treated with an Hsp70 activator YM-1 (1 μM) for 48 hours. Although aggresomes were found as indicated by the green fluorescence from P18h (center right panels, Figure 6f), their average diameters (2.6 μm) were smaller compared to aggresomes (4.1 μm) in cells without the treatment of YM-1 (Figure S32). Moreover, misfolded oligomers started to appear as indicated by both diffusive and small punctate structures that only emitted red fluorescence from P1h (center right panels, Figure 6f). To further clear Htt-Q110 aggregates, we co-treated cells with both YM-1 and PD169316 (both at 1 μM) to simultaneously activate both the Hsp70 and proteasome (right panels, Figure 6f). Although treated cells did not show total clearance of aggregates, the fluorescent intensity of both P1h and P18h was significantly reduced and large aggresomes were not observed. Hence, the combined use of P1h and P18h suggest a cooperation between Hsp70 and proteasome to reduce Htt-polyQ aggregation in forms of misfolded oligomers and insoluble aggregates, providing potential directions for future therapeutic efforts towards Huntington’s disease and other protein misfolding diseases.
CONCLUSION
In summary, we have developed a novel class of fluorescent probes, AggFluor. Studies using structure-functional relationship and quantum chemistry revealed the strategy to control the viscosity sensitivity via incorporation of the electron density regulator (EDR) in the HBI chromophore core of the green fluorescent protein. This newly discovered strategy allows us to conduct a rational design of 18 AggFluor probes, which harbor an unprecedented coverage of a wide range of sensitivity towards local viscosity. Combined with the established AggTag method, these probes allow for direct visualization of the multistep process of protein aggregation. In particular, we demonstrate that two probes can be combined to enable the two-color fluorescent imaging technology to distinguish, for the first time, the misfolded oligomers from insoluble aggregates in live cells. This capacity has led to the demonstration on how small molecule proteostasis regulators can drive formation and disassembly of protein aggregates in both conformational states, providing important basis for future therapeutic exploration towards a wide spectrum of protein misfolding diseases that are rooted in protein aggregation.
In addition to protein misfolding and aggregation, AggFluor probes can also be applied to study other biological processes that involve local viscosity changes with temporal and spatial resolutions. Compared to traditional molecular rotor fluorophores that have been applied to study these processes, the advantage of the AggFluor probes lies in the rational control of their viscosity sensitivity. Our work reveals how π electron density of EDR modulates molecular orbital of the rotational bond at an excited state, thus controlling both the activation energy and position of the rotational energy barrier that leads to the twisted TICT conformation. This mechanism allows for the design of 18 different probes that span the range of viscosity sensitivities (x spanning from 0.28 to 0.68). Thus, we envision that these probes could potentiate a wide spectrum of novel applications in biological systems, membrane biochemistry and biomaterial research.
Supplementary Material
ACKNOWLEDGEMENTS
We thank P. Cremer and S.J. Benkovic for the contributed insight and helpful discussions. We thank support from the Burroughs Welcome Fund Career Award at the Scientific Interface 1013904 (X.Z.), Paul Berg Early Career Professorship (X.Z.), Lloyd and Dottie Huck Early Career Award (X.Z.), Sloan Research Fellowship FG-2018-10958 (X.Z.), PEW Biomedical Scholars Program (X.Z.), National Institute of General Medical Sciences R35 GM133484 (X.Z.), and NSF CHE-1856210 (X.L.). We thank Ms. Missy Hazen of the Penn State Microscopy Core Facility and Dr. Tatiana Laremore of the Penn State Proteomics and Mass Spectrometry Core Facility for technical assistance.
Footnotes
Experimental methods, supplemental figures/notes, and synthetic methods
COMPETING INTERESTS
The authors declare no competing interests.
REFERENCES:
- 1.Balch WE; Morimoto RI; Dillin A; Kelly JW, Adapting proteostasis for disease intervention. Science 2008, 319 (5865), 916–9. [DOI] [PubMed] [Google Scholar]
- 2.Labbadia J; Morimoto RI, Huntington’s disease: underlying molecular mechanisms and emerging concepts. Trends Biochem Sci 2013, 38 (8), 378–85. [DOI] [PMC free article] [PubMed] [Google Scholar]
- 3.Kaushik S; Cuervo AM, Proteostasis and aging. Nat Med 2015, 21 (12), 1406–15. [DOI] [PubMed] [Google Scholar]
- 4.Olzscha H; Schermann SM; Woerner AC; Pinkert S; Hecht MH; Tartaglia GG; Vendruscolo M; Hayer-Hartl M; Hartl FU; Vabulas RM, Amyloid-like aggregates sequester numerous metastable proteins with essential cellular functions. Cell 2011, 144 (1), 67–78. [DOI] [PubMed] [Google Scholar]
- 5.Kayed R; Head E; Thompson JL; McIntire TM; Milton SC; Cotman CW; Glabe CG, Common structure of soluble amyloid oligomers implies common mechanism of pathogenesis. Science 2003, 300 (5618), 486–9. [DOI] [PubMed] [Google Scholar]
- 6.Haass C; Selkoe DJ, Soluble protein oligomers in neurodegeneration: lessons from the Alzheimer’s amyloid beta-peptide. Nat Rev Mol Cell Biol 2007, 8 (2), 101–12. [DOI] [PubMed] [Google Scholar]
- 7.Kim YE; Hosp F; Frottin F; Ge H; Mann M; Hayer-Hartl M; Hartl FU, Soluble Oligomers of PolyQ-Expanded Huntingtin Target a Multiplicity of Key Cellular Factors. Mol Cell 2016, 63 (6), 951–64. [DOI] [PubMed] [Google Scholar]
- 8.Kaganovich D; Kopito R; Frydman J, Misfolded proteins partition between two distinct quality control compartments. Nature 2008, 454 (7208), 1088–U36. [DOI] [PMC free article] [PubMed] [Google Scholar]
- 9.Sontag EM; Vonk WIM; Frydman J, Sorting out the trash: the spatial nature of eukaryotic protein quality control. Curr Opin Cell Biol 2014, 26, 139–146. [DOI] [PMC free article] [PubMed] [Google Scholar]
- 10.Gupta R; Kasturi P; Bracher A; Loew C; Zheng M; Villella A; Garza D; Hartl FU; Raychaudhuri S, Firefly luciferase mutants as sensors of proteome stress. Nat Methods 2011, 8 (10), 879–84. [DOI] [PubMed] [Google Scholar]
- 11.Winkler J; Seybert A; Konig L; Pruggnaller S; Haselmann U; Sourjik V; Weiss M; Frangakis AS; Mogk A; Bukau B, Quantitative and spatio-temporal features of protein aggregation in Escherichia coli and consequences on protein quality control and cellular ageing. EMBO J 2010, 29 (5), 910–23. [DOI] [PMC free article] [PubMed] [Google Scholar]
- 12.Hsieh TY; Nillegoda NB; Tyedmers J; Bukau B; Mogk A; Kramer G, Monitoring Protein Misfolding by Site-Specific Labeling of Proteins In Vivo. PloS One 2014, 9 (6). [DOI] [PMC free article] [PubMed] [Google Scholar]
- 13.Ignatova Z; Gierasch LM, Monitoring protein stability and aggregation in vivo by real-time fluorescent labeling. Proc Natl Acad Sci USA 2004, 101 (2), 523–528. [DOI] [PMC free article] [PubMed] [Google Scholar]
- 14.Miao K; Wei L, Live-Cell Imaging and Quantification of PolyQ Aggregates by Stimulated Raman Scattering of Selective Deuterium Labeling. ACS Cent Sci 2020, 6 (4), 478–486. [DOI] [PMC free article] [PubMed] [Google Scholar]
- 15.Ramdzan YM; Polling S; Chia CPZ; Ng IHW; Ormsby AR; Croft NP; Purcell AW; Bogoyevitch MA; Ng DCH; Gleeson PA; Hatters DM, Tracking protein aggregation and mislocalization in cells with flow cytometry. Nat Methods 2012, 9 (5), 467–U76. [DOI] [PubMed] [Google Scholar]
- 16.Nath S; Meuvis J; Hendrix J; Carl SA; Engelborghs Y, Early aggregation steps in alpha-synuclein as measured by FCS and FRET: evidence for a contagious conformational change. Biophys J 2010, 98 (7), 1302–11. [DOI] [PMC free article] [PubMed] [Google Scholar]
- 17.Zhao J; Nelson TJ; Vu Q; Truong T; Stains CI, Self-Assembling NanoLuc Luciferase Fragments as Probes for Protein Aggregation in Living Cells. ACS Chem Biol 2016, 11 (1), 132–8. [DOI] [PMC free article] [PubMed] [Google Scholar]
- 18.Wood RJ; Ormsby AR; Radwan M; Cox D; Sharma A; Vopel T; Ebbinghaus S; Oliveberg M; Reid GE; Dickson A; Hatters DM, A biosensor-based framework to measure latent proteostasis capacity. Nat Commun 2018, 9 (1), 287. [DOI] [PMC free article] [PubMed] [Google Scholar]
- 19.Kitamura A; Nagata K; Kinjo M, Conformational Analysis of Misfolded Protein Aggregation by FRET and Live-Cell Imaging Techniques. Int J Mol Sci 2015, 16 (3), 6076–6092. [DOI] [PMC free article] [PubMed] [Google Scholar]
- 20.Tsien RY, The green fluorescent protein. Annu Rev Biochem 1998, 67, 509–44. [DOI] [PubMed] [Google Scholar]
- 21.Kuimova MK; Yahioglu G; Levitt JA; Suhling K, Molecular rotor measures viscosity of live cells via fluorescence lifetime imaging. J Am Chem Soc 2008, 130 (21), 6672–+. [DOI] [PubMed] [Google Scholar]
- 22.Goh WL; Lee MY; Joseph TL; Quah ST; Brown CJ; Verma C; Brenner S; Ghadessy FJ; Teo YN, Molecular Rotors As Conditionally Fluorescent Labels for Rapid Detection of Biomolecular Interactions. J Am Chem Soc 2014, 136 (17), 6159–6162. [DOI] [PubMed] [Google Scholar]
- 23.Yu WT; Wu TW; Huang CL; Chen IC; Tan KT, Protein sensing in living cells by molecular rotor-based fluorescence-switchable chemical probes. Chem Sci 2016, 7 (1), 301–307. [DOI] [PMC free article] [PubMed] [Google Scholar]
- 24.Kuimova MK; Botchway SW; Parker AW; Balaz M; Collins HA; Anderson HL; Suhling K; Ogilby PR, Imaging intracellular viscosity of a single cell during photoinduced cell death. Nat Chem 2009, 1 (1), 69–73. [DOI] [PubMed] [Google Scholar]
- 25.Liu X; Chi WJ; Qiao QL; Kokate SV; Cabrera EP; Xu ZC; Liu XG; Chang YT, Molecular Mechanism of Viscosity Sensitivity in BODIPY Rotors and Application to Motion-Based Fluorescent Sensors. Acs Sensors 2020, 5 (3), 731–739. [DOI] [PubMed] [Google Scholar]
- 26.You MX; Jaffrey SR, Structure and Mechanism of RNA Mimics of Green Fluorescent Protein. Annu Rev Biophys 2015, 44, 187–206. [DOI] [PubMed] [Google Scholar]
- 27.Qian J; Tang BZ, AIE Luminogens for Bioimaging and Theranostics: from Organelles to Animals. Chem-Us 2017, 3 (1), 56–91. [Google Scholar]
- 28.Liang J; Tang B; Liu B, Specific light-up bioprobes based on AIEgen conjugates. Chem Soc Rev 2015, 44 (10), 2798–2811. [DOI] [PubMed] [Google Scholar]
- 29.Chan J; Dodani SC; Chang CJ, Reaction-based small-molecule fluorescent probes for chemoselective bioimaging. Nat Chem 2012, 4 (12), 973–84. [DOI] [PMC free article] [PubMed] [Google Scholar]
- 30.Owyong TC; Subedi P; Deng J; Hinde E; Paxman JJ; White JM; Chen W; Heras B; Wong WWH; Hong Y, A Molecular Chameleon for Mapping Subcellular Polarity in an Unfolded Proteome Environment. Angew Chem Int Ed Engl 2020, 59 (25), 10129–10135. [DOI] [PubMed] [Google Scholar]
- 31.Martin ME; Negri F; Olivucci M, Origin, nature, and fate of the fluorescent state of the green fluorescent protein chromophore at the CASPT2//CASSCF resolution. J Am Chem Soc 2004, 126 (17), 5452–5464. [DOI] [PubMed] [Google Scholar]
- 32.Baranov MS; Lukyanov KA; Borissova AO; Shamir J; Kosenkov D; Slipchenko LV; Tolbert LM; Yampolsky IV; Solntsev KM, Conformationally locked chromophores as models of excited-state proton transfer in fluorescent proteins. J Am Chem Soc 2012, 134 (13), 6025–32. [DOI] [PubMed] [Google Scholar]
- 33.Baldridge A; Samanta SR; Jayaraj N; Ramamurthy V; Tolbert LM, Steric and electronic effects in capsule-confined green fluorescent protein chromophores. J Am Chem Soc 2011, 133 (4), 712–5. [DOI] [PubMed] [Google Scholar]
- 34.Walker CL; Lukyanov KA; Yampolsky IV; Mishin AS; Bommarius AS; Duraj-Thatte AM; Azizi B; Tolbert LM; Solntsev KM, Fluorescence imaging using synthetic GFP chromophores. Curr Opin Chem Biol 2015, 27, 64–74. [DOI] [PubMed] [Google Scholar]
- 35.Williams DE; Dolgopolova EA; Pellechia PJ; Palukoshka A; Wilson TJ; Tan R; Maier JM; Greytak AB; Smith MD; Krause JA; Shustova NB, Mimic of the green fluorescent protein beta-barrel: photophysics and dynamics of confined chromophores defined by a rigid porous scaffold. J Am Chem Soc 2015, 137 (6), 2223–6. [DOI] [PubMed] [Google Scholar]
- 36.Baldridge A; Feng S; Chang YT; Tolbert LM, Recapture of GFP chromophore fluorescence in a protein host. ACS Comb Sci 2011, 13 (3), 214–7. [DOI] [PubMed] [Google Scholar]
- 37.Paige JS; Wu KY; Jaffrey SR, RNA mimics of green fluorescent protein. Science 2011, 333 (6042), 642–6. [DOI] [PMC free article] [PubMed] [Google Scholar]
- 38.Feng G; Luo C; Yi H; Yuan L; Lin B; Luo X; Hu X; Wang H; Lei C; Nie Z; Yao S, DNA mimics of red fluorescent proteins (RFP) based on G-quadruplex-confined synthetic RFP chromophores. Nucleic Acids Res 2017, 45 (18), 10380–10392. [DOI] [PMC free article] [PubMed] [Google Scholar]
- 39.Liu Y; Wolstenholme CH; Carter GC; Liu HB; Hu H; Grainger LS; Miao K; Fares M; Hoelzel CA; Yennawar HP; Ning G; Du MY; Bai L; Li XS; Zhang X, Modulation of Fluorescent Protein Chromophores To Detect Protein Aggregation with Turn-On Fluorescence. J Am Chem Soc 2018, 140 (24), 7381–7384. [DOI] [PMC free article] [PubMed] [Google Scholar]
- 40.Matsumoto G; Kim S; Morimoto RI, Huntingtin and mutant SOD1 form aggregate structures with distinct molecular properties in human cells. J. Biol. Chem 2006, 281 (7), 4477–4485. [DOI] [PubMed] [Google Scholar]
- 41.Qian H; Cousins ME; Horak EH; Wakefield A; Liptak MD; Aprahamian I, Suppression of Kasha’s rule as a mechanism for fluorescent molecular rotors and aggregation-induced emission. Nat Chem 2017, 9 (1), 83–87. [DOI] [PubMed] [Google Scholar]
- 42.Ferreira AGM; Egas APV; Fonseca IMA; Costa AC; Abreu DC; Lobo LQ, The viscosity of glycerol. J Chem Thermodyn 2017, 113, 162–182. [Google Scholar]
- 43.Eade RHA; Robb MA, Direct Minimization in Mc Scf Theory - the Quasi-Newton Method. Chem Phys Lett 1981, 83 (2), 362–368. [Google Scholar]
- 44.Bruijn LI; Houseweart MK; Kato S; Anderson KL; Anderson SD; Ohama E; Reaume AG; Scott RW; Cleveland DW, Aggregation and motor neuron toxicity of an ALS-linked SOD1 mutant independent from wild-type SOD1. Science 1998, 281 (5384), 1851–1854. [DOI] [PubMed] [Google Scholar]
- 45.Powers ET; Morimoto RI; Dillin A; Kelly JW; Balch WE, Biological and chemical approaches to diseases of proteostasis deficiency. Annu Rev Biochem 2009, 78, 959–91. [DOI] [PubMed] [Google Scholar]
- 46.Burslem GM; Crews CM, Small-Molecule Modulation of Protein Homeostasis. Chem Rev 2017, 117 (17), 11269–11301. [DOI] [PubMed] [Google Scholar]
- 47.DiFiglia M; Sapp E; Chase KO; Davies SW; Bates GP; Vonsattel JP; Aronin N, Aggregation of huntingtin in neuronal intranuclear inclusions and dystrophic neurites in brain. Science 1997, 277 (5334), 1990–3. [DOI] [PubMed] [Google Scholar]
- 48.Krobitsch S; Lindquist S, Aggregation of huntingtin in yeast varies with the length of the polyglutamine expansion and the expression of chaperone proteins. Proc Natl Acad Sci U S A 2000, 97 (4), 1589–94. [DOI] [PMC free article] [PubMed] [Google Scholar]
- 49.Leestemaker Y; de Jong A; Witting KF; Penning R; Schuurman K; Rodenko B; Zaal EA; van de Kooij B; Laufer S; Heck AJR; Borst J; Scheper W; Berkers CR; Ovaa H, Proteasome Activation by Small Molecules. Cell Chem Biol 2017, 24 (6), 725–736 e7. [DOI] [PubMed] [Google Scholar]
- 50.Wang AM; Miyata Y; Klinedinst S; Peng HM; Chua JP; Komiyama T; Li X; Morishima Y; Merry DE; Pratt WB; Osawa Y; Collins CA; Gestwicki JE; Lieberman AP, Activation of Hsp70 reduces neurotoxicity by promoting polyglutamine protein degradation. Nat Chem Biol 2013, 9 (2), 112–8. [DOI] [PMC free article] [PubMed] [Google Scholar]
Associated Data
This section collects any data citations, data availability statements, or supplementary materials included in this article.


