

Abstract
Objectives:
Although older adult prescription drug misuse (PDM) is associated with concerning correlates, including psychopathology and substance use disorders (SUD), stimulant PDM and poly-PDM involving multiple medication classes remain understudied. Our objectives were to examine PDM and poly-PDM prevalence by medication class in US older adults and to identify the mental health, SUD, and health-related quality-of-life correlates of poly-PDM.
Method:
Data were from the National Epidemiologic Survey on Alcohol and Related Conditions-III, with 14,667 US adults aged 50 and older. PDM was defined as opioid, tranquilizer/sedative, and/or stimulant medication use without a prescription or in ways not intended by the prescriber. Prevalence of PDM and poly-PDM by medication class was estimated. Design-based logistic regression established odds of ten outcomes: four SUD diagnoses, five psychopathology diagnoses and lifetime suicide attempts; design-based linear regression evaluated health-related quality-of-life by PDM/poly-PDM status.
Results:
Past-year PDM abstinence increased with age (50–54 years: 80.5%; 80 and older: 96.0%), with corresponding drops in poly-PDM; past-year stimulant PDM was rare (≤ 0.6%), except when combined with opioid and tranquilizer/sedative PDM. Compared to no past-year PDM, both past-year opioid-only PDM and opioid-involved poly-PDM were associated with poorer health-related quality-of-life and greater odds of psychopathology (e.g., major depression odds > 1.5) and SUD (e.g., cannabis use disorder odds > 2.5), with the highest odds in poly-PDM.
Conclusion:
The presence of any opioid-involved PDM in older adults suggests a need for screening for SUD, psychopathology, and other medical conditions, with the most significant intervention needs likely in those with opioid-involved poly-PDM.
Keywords: prescription drug misuse, opioid, benzodiazepine, sedative, older adult, psychopathology, substance use
INTRODUCTION
Adults 50 years and older are exposed to opioid and tranquilizer/sedative (i.e., benzodiazepine, barbiturate or Z-drug) medication at either the highest or among the highest rates across age groups (Paulozzi, Strickler, Kreiner, & Koris, 2015), perhaps as a consequence of their higher rates of cancer, pain conditions, surgery, anxiety, and insomnia (Fayaz, Croft, Langford, Donaldson, & Jones, 2016; Hall, Schwartzman, Zhang, & Liu, 2017; Kim & Park, 2018; Meucci, Fassa, & Faria, 2015; Pary, Sarai, Micchelli, & Lippmann, 2019; Patel, Steinberg, & Patel, 2018; Takano, 2017). When used appropriately, opioid medications can be a crucial part of pain management for many adults over 50 years and, with the exception of meperidine (Demerol®), are not contraindicated for use by older adults (American Geriatrics Society Beers Criteria® Update Expert Panel, 2019). Still, such opioid use is associated with greater risk of drug-drug interactions and other adverse events than in younger individuals (Maree, Marcum, Saghafi, Weiner, & Karp, 2016), and evidence suggests that other interventions, like physical therapy or cognitive-behavioral therapy, offer greater effectiveness and better long-term safety profiles than opioid medication (Archer et al., 2016; Goga et al., 2019; Makris, Abrams, Gurland, & Reid, 2014).
In contrast, benzodiazepine, barbiturate, and Z-drug use in adults 65 and older is strongly discouraged in the Beers Criteria because of the increased risk of falls, fractures, cognitive impairment, and physiological dependence (American Geriatrics Society Beers Criteria® Update Expert Panel, 2019). As with opioid medication, other interventions (e.g., cognitive-behavioral therapy) and pharmacological agents (e.g., duloxetine, or Cymbalta®) exist that are both safe and effective in treating anxiety, insomnia, and other conditions for which tranquilizer/sedative medications are prescribed (Gooneratne & Vitiello, 2014; Jayasinghe et al., 2017).
Another risk from longer-term use of opioid or tranquilizer/sedative medications in adults 50 and older is that of prescription drug misuse (PDM). Such misuse consists of inappropriate use of one’s own medication, such as self-directed increases in dosage or more frequent administration, and/or of use of another individual’s medication, whether alongside use of one’s own prescription or when such medication is no longer legitimately available. Opioid and tranquilizer/sedative PDM are less common than in younger groups, with the second lowest rates in the 50–64 age group and the lowest rates in the 65 and older age group (B. Han et al., 2017; Schepis, Teter, Simoni-Wastila, & McCabe, 2018).
Nonetheless, evidence suggests increased rates of both opioid and tranquilizer/sedative PDM in adults 50 years and older between 2002/03 and 2012/13 (Schepis & McCabe, 2016). PDM in adults 50 and older is consistently associated with alcohol, cannabis, other illicit drug use, and other forms of PDM (Blazer & Wu, 2009; B. H. Han, Sherman, & Palamar, 2019; Schepis, Teter, et al., 2018), and alcohol and other substance use disorders (SUDs; Chang, 2018; Schepis & McCabe, 2019). PDM in aging adults is also strongly linked to depressive symptoms (Chang, 2018), major depression diagnosis (Blazer & Wu, 2009; Schepis & McCabe, 2019), anxiety or post-traumatic stress disorder diagnosis (Schepis & McCabe, 2019), suicidal ideation (K. T. Chan, Winston, Jennings, Trant, & Moller, 2019; Schepis, Simoni-Wastila, & McCabe, 2019), and serious psychological distress (K. Chan et al., 2020). More limited evidence suggests that PDM is associated with greater emergency department use, overnight hospitalizations, chest pain or angina, arthritis, and pain conditions in adults 50 and older (Chang, 2018; Maree et al., 2016; Schepis & McCabe, 2019). Research using theory to examine PDM in adults 50 and older is not present in the literature to the best of our knowledge, but research across the population suggests that PDM interacts with mental health in complex, bi-directional ways that could signal self-medication by PDM, precipitation of mental health problems via PDM, or a shared vulnerability to PDM and mental health conditions (Martins et al., 2012; Schepis & Hakes, 2011).
Aims
Despite an accumulating knowledge base on PDM in aging adults, gaps exist in our understanding of this important phenomenon. Here, using data from the US nationally representative National Epidemiologic Survey on Alcohol and Related Conditions-III (NESARC-III), we address an important one: the prevalence and correlates of poly-prescription drug misuse, or poly-PDM, are understudied in adults 50 years and older. Misuse of both opioid and tranquilizer/sedative medication was associated with the highest rates of suicidal ideation across age groups (Schepis, Teter, et al., 2018), but research has not examined correlates of poly-PDM in aging adults. Given the particularly elevated risks of poly-PDM in those 50 years and older (e.g., drug-drug interactions), research examining poly-PDM in aging adults is needed. Thus, this research has two main aims: 1) to examine the prevalence of PDM and poly-PDM by medication class in US adults aged 50 years and older; and 2) to identify the mental health, SUD, and health-related quality-of-life correlates of opioid-involved PDM and poly-PDM.
For aim 1, we hypothesized that prevalence of both single medication class (i.e., opioid-only) and poly-PDM would decrease with increasing age. For aim 2, we hypothesized that odds ratios for the mental health and SUD variables would be highest in those engaged in poly-PDM, with lower odds ratios in those with single medication class PDM. We expected that odds ratios for those with single medication class or poly-PDM would be significantly higher than those with no PDM. Finally, we hypothesized that health-related quality-of-life scores would be lowest, signifying poorer functioning, in those with poly-PDM, followed by those with single medication class PDM. These hypotheses were based on past research on single medication class PDM in adults 50 and older (e.g., Blazer & Wu, 2009; Schepis & McCabe, 2016; Schepis et al., 2019; Wu & Blazer, 2011).
MATERIALS AND METHODS
The NESARC-III, the third wave of the NESARC series of studies, uses a multistage probability sampling design structured to create a nationally representative sample of the non-institutionalized, civilian US adult population in 2012–13, weighted and adjusted for oversampling of non-white individuals and non-response. Surveys were performed in both household and group (e.g., assisted living) settings. The NESARC-III screening response rate was 72.0%, and the interview response rate was 84.0%, which resulted in an overall response rate of 60.1%. This is similar to that of other large, nationally representative surveys, such as the National Survey on Drug Use and Health (Center for Behavioral Health Statistics and Quality, 2017). The NESARC-III protocol was approved by both the NIH and Westat IRBs; this study was exempted from further oversight by the first author’s IRB. For more information on the NESARC-III, please see Grant et al (2014; 2015).
Participants
In total, 36,309 US adults participated in the NESARC-III. Here, analyses are restricted to the 50 and older sample (n = 14,667, 40.4%), which has a range of 50 to 90 (all participants 90 and older are recoded as being 90 years of age), mean age of 63.53, and a standard deviation of 10.1. As noted in the Measures (below), participant age is categorized into a series of five-year cohorts: 50–54, 55–59, 60–64, 65–69, 70–74, 75–79, and 80 years and older. The weighted older adult sample was predominantly female (53.3%), white, non-Hispanic (75.5%), married (60.9%), and between the ages of 50 and 64 (59.6%). Beyond white, non-Hispanic participants, the sample was also 10.0% black, 9.0% Hispanic/Latinx, 4.5% Asian, Native Hawaiian or Pacific Islander, and 1.4% Native American/American Indian. In all, 12.6% were widowed and 15.0% divorced. In terms of educational attainment, 14.1% did not complete high school (HS), 27.1% completed HS or their graduate equivalency degree (GED), 29.3% attended some college or obtained a 2-year college degree, and 29.5% completed a 4-year college degree.
Measures
Prescription Drug Misuse
Prescription drug misuse was assessed in a NESARC-III module on use/misuse of non-alcohol and non-tobacco substances. This module was introduced via the following, read aloud by the field interviewer (emphasis and pauses from the NESARC-III):
“Now I’d like to ask you about your experiences with medicines and other kinds of drugs that you may have used ON YOUR OWN – that is, either WITHOUT a doctor’s prescription (PAUSE); in GREATER amounts, MORE OFTEN, or LONGER than prescribed (PAUSE); or for a reason other than a doctor said you should use them. People use these medicines and drugs ON THEIR OWN to feel more alert, to relax or quiet their nerves, to feel better, to enjoy themselves, to get high or just to see how they work.”
To maximize clarity, descriptions of the medication classes were included in the questions. For opioids, it read: “Painkillers, for example…methadone, codeine, Demerol, Vicodin, Oxy-Contin, opioid, oxy, Percocet, Dilaudid, Percodan, morphine”; for tranquilizer/sedatives: “Sedatives or tranquilizers, for example…barbs, downers, Ambien, Lunesta, phenobarbital, Halcion, Tuinal, Nembutal, Seconal, Librium, Valium, Xanax, benzodiazepines, tranks, Ativan”; and for stimulants, it read: “Stimulants, for example…Adderall, Concerta, Cylert, Provigil, Ritalin or Dexedrine, speed, amphetamine, methamphetamine, uppers, bennies, pep pills, crystal, crank.”
For those with lifetime PDM from a given class, misuse recency was assessed: “Did you use [medication class] in the last 12 months only, before the last 12 months only, or during both time periods?” Only those with past-year PDM from at least one medication class were included in analyses. Given the low rates of non-opioid-involved PDM in older adults (please see Table 1), a three-level variable of PDM/poly-PDM status was created: no past year opioid-involved PDM, past-year opioid-only PDM, and past-year opioid-involved poly-PDM.
Table 1:
Prevalence of Specific PDM Combinations by Age Cohort (n= 14,637)
| 50–54 years (a) | 55–59 years (b) | 60–64 years (c) | 65–69 years (d) | 70–74 years (e) | 75–79 years (f) | 80 and older (g) | |
|---|---|---|---|---|---|---|---|
| No Past-year PDM | 80.5 (78.6–82.2) | 80.6 (78.6–82.4) | 85.6 (83.7–87.2) | 90.8 (88.7–92.6) | 92.7 (90.7–94.2) | 94.5 (92.4–96.0) | 96.0 (94.9–97.0) |
| Single Class PDM | 10.4 (9.1–11.8) d, e, f, g | 11.2 (9.6–12.9) d, e, f, g | 8.2 (7.0–9.7) e, f, g | 5.9 (4.6–7.4) a, b, g | 4.8 (3.5–6.5) a, b, c | 3.3 (2.2–4.7) a, b, c | 3.1 (2.3–4.2) a, b, c, d |
| Opioid-only | 9.5 (8.3–10.9) | 10.4 (9.0–12.0) | 7.7 (6.5–9.2) | 5.5 (4.3–7.1) | 4.3 (3.1–6.0) | 2.8 (1.9–4.1) | 2.8 (2.0–3.9) |
| Stimulant-only | 0.3 (0.1–0.8) | 0.6 (0.3–1.1) | 0.03 (0.01–0.2) | no cases | 0.09 (0.01–0.6) | no cases | 0.05 (0.01–0.3) |
| TRQ/SED-Only | 0.6 (0.3–1.0) | 0.6 (0.3–1.1) | 0.5 (0.2–0.9) | 0.4 (0.2–0.8) | 0.4 (0.1–1.0) | 0.5 (0.2–1.1) | 0.2 (0.1–0.6) |
| Two Class PDM | 5.1 (4.1–6.3) d, e, f, g | 4.5 (3.7–5.5) d, e, f, g | 3.6 (2.9–4.6) g | 2.3 (1.5–3.6) a, b, g | 1.9 (1.3–2.9) a, b | 1.9 (1.2–3.1) a, b | 0.9 (0.5–1.6) a, b, c, d |
| Opioid-Stimulant | 0.04 (0.01–0.3) | 0.08 (0.02–0.2) | 0.2 (0.07–0.6) | no cases | no cases | no cases | no cases |
| Opioid-TRQ/SED | 5.0 (4.0–6.2) | 4.4 (3.6–5.4) | 3.3 (2.6–4.3) | 2.3 (1.5–3.6) | 1.9 (1.3–2.9) | 1.8 (1.1–3.0) | 0.8 (0.5–1.5) |
| Stimulant-TRQ/SED | 0.07 (0.02–0.4) | no cases | 0.1 (0.04–0.4) | no cases | no cases | 0.08 (0.01–0.6) | 0.04 (0.01–0.3) |
| Three Class PDM | 4.0 (3.4–4.9) d, e, f, g | 3.8 (3.0–4.7) d, e, f, g | 2.6 (1.9–3.5) e | 1.0 (0.6–1.6) a, b | 0.6 (0.3–1.4) a, b, c | 0.3 (0.1–1.3) a, b | no cases |
Data Source: NESARC-III
Abbreviations: PDM = Prescription Drug Misuse; TRQ/SED = Tranquilizer/Sedative
Notes: Superscript letters denote significant differences from the age cohort with the letter at a Bonferroni correct p-value ≤ 0.0024 (0.05/21 comparisons), with no past-year PDM set as the referent level for the multinomial regressions.
Psychopathology and Substance Use Disorders
Psychopathology, including substance use disorder (SUD) diagnosis, was measured via the Alcohol Use Disorder and Associated Disabilities Interview Schedule-5 (AUDADIS-5). The AUDADIS-5 is a fully structured self-report that provides DSM-5 diagnoses. Five past-year non-SUD psychopathology diagnoses were used: major depression, generalized anxiety, social anxiety, panic disorder and post-traumatic stress disorder (PTSD). Analyses also included a dichotomous single-item assessment of any lifetime suicide attempts (“In your ENTIRE life did you EVER attempt suicide?”). In addition, four SUD variables were included: alcohol use disorder, cannabis use disorder, nicotine dependence, and prescription opioid use disorder. The AUDADIS-5 has fair to good reliability for the assessment of non-SUD psychiatric diagnoses and strong reliability for assessment of SUD diagnoses (Grant et al., 2015; Hasin et al., 2015).
Health-related Quality-of-life
Health-related Quality-of-life was assessed via the 12-item Short Form Health Survey, version 2 (SF-12v2), composed of two component scores that capture overall physical and mental quality-of-life, with each component score containing four scale scores. The physical component scale scores are the physical functioning, role-physical, bodily pain, and general health scales; these assess physical activity limitations (e.g., climbing stairs) due to physical health, limited productivity due to physical health, pain interference with activity, and overall self-reported health, respectively. The mental component scale scores include vitality, role-emotional, mental health, and social functioning scales; these assess level of energy, limited productivity due to mental health, self-reported anxiety and sadness, and social limitations (e.g., visiting with friends) due to mental and physical health. Scores on both the component and scale measures are T-scores, normed to a mean of 50 points, with a standard deviation of 10. Substantial evidence suggests that the SF-12 is reliable and valid in older adults (Bentur & King, 2010; Cernin, Cresci, Jankowski, & Lichtenberg, 2010; Gobbens, 2018; Ware, Kosinski, & Keller, 1996).
Sociodemographics
Age was split into seven cohorts of adults aged 50 years and older: 50–54 years, 55–59 years, 60–64 years, 65–69 years, 70–74 years, 75–79 years, and 80 years and older. Other sociodemographic variables were sex (male/female), race/ethnicity (Hispanic/Latinx, white, black, Asian/Native Hawaiian/Pacific Islander, American Indian/Alaskan Native; the last four are non-Hispanic), region of the US (Northeast, Midwest, South, West), urbanicity (urban/rural), marital status (married, living with someone as if married, widowed, divorced, separated, never married), and educational attainment (highest grade completed, high school graduate, graduate equivalency degree, some college, completed associate’s degree, completed college, completed graduate degree).
Data Analyses
All analyses used Stata 16.1 (College Station, TX), with analyses using the NESARC-III complex sampling features and data weights to create unbiased estimates. All Stata analyses used the svy command set. First, cross-tabulations were performed to examine the relationship between age group and pattern of PDM and/or poly-PDM in older adults. Multinomial logistic regressions were then used to evaluate age-based change in single medication class, two medication class and three medication class PDM (no past-year PDM is reference) by age group. Pairwise comparisons were Bonferroni-adjusted for 21 comparisons (between the seven age cohorts), with an a priori p-value of 0.0024 (i.e., 0.05/21) or less set for significance. Analyses used logistic regression to examine prevalence differences in the non-SUD psychopathology and SUD variables by the three-level opioid PDM/poly-PDM variable. Finally, analyses for differences in SF-12v2 scores used linear regression to examine score differences by the three-level opioid PDM/poly-PDM variable for both component scores and the eight scale scores. All analyses controlled for the sociodemographic variables noted above.
RESULTS
Prevalence of PDM and Poly-PDM by Age Cohort
Prevalence of no past-year PDM (i.e., abstinence from PDM) increased with age, from the 55–59 (80.6%) to the 60–64 (85.6%) and 65–69 cohorts (90.8%; Table 1); no past-year PDM peaked in those 80 years and older (96.0%). In contrast, single medication class PDM and poly-PDM prevalence decreased with increasing age. Single medication class PDM peaked in the 55–59 year old cohort (11.2%), with those in their 50s having significantly higher rates of single medication class PDM than those 65 years and older. Adults 50–64 years of age had much higher rates of two and three medication class PDM than adults 65 years and older, with peak poly-PDM rates in the 50–54 cohort (two class: 5.1%, three class: 4.0%). Across age groups, those aged 80 years and older had the lowest rates of single medication class PDM (3.1%) and poly-PDM (0.9%), with no cases of three medication class PDM in this age group.
Past-year Non-SUD Psychopathology and Lifetime Suicide Attempts
As noted previously, given the low prevalence rates of non-opioid PDM in the 50 and older sample, all further analyses concentrated on opioid-only PDM or opioid-involved PDM. With the exception of past-year panic disorder in those with opioid-only PDM, adults 50 years and older who engaged in any form of opioid-involved PDM had higher prevalence rates of past-year non-SUD psychopathology and lifetime suicide attempts (Table 2).
Table 2:
Odds of Past-Year Psychiatric Diagnosis and Lifetime Suicide Attempts by Opioid-Involved PDM and Poly-PDM Status (n= 14,637)
| Past-Year Major Depression | Past-Year Social Anxiety | Past-Year Panic Disorder | Past-Year Generalized Anxiety | Past-Year PTSD | Lifetime Suicide Attempt | |
|---|---|---|---|---|---|---|
| No Past-Year PDM | 1.00 (reference) | 1.00 (reference) | 1.00 (reference) | 1.00 (reference) | 1.00 (reference) | 1.00 (reference) |
| Opioid-Only PDM | 1.56 (1.24–1.98)*** | 1.83 (1.24–2.70)** | 1.37 (0.86–2.19) | 1.86 (1.38–2.49)*** | 2.00 (1.48–2.71)*** | 2.15 (1.60–2.90)*** |
| Poly-PDM | 2.41 (1.91–3.03)***a | 2.82 (2.02–3.94)*** | 3.09 (2.10–4.56)***a | 2.13 (1.64–2.76)*** | 2.86 (2.02–4.06)*** | 3.41 (2.50–4.65)*** |
Data Source: NESARC-III
Abbreviations: PDM = Prescription Drug Misuse; PTSD = Post-Traumatic Stress Disorder
denotes p ≤ 0.05;
denotes p ≤ 0.01;
denotes p ≤ 0.001;
denotes significant difference between Opioid-Only and Poly-PDM (p ≤ 0.01)
All analyses control for age, sex, race/ethnicity, region of the US, urbanicity, marital status, and educational attainment.
Odds ratios (ORs) were highest in those with opioid-involved poly-PDM, with over 100% greater odds of these outcomes, versus those without past-year PDM. Those with opioid-involved PDM had higher ORs of both past-year major depression and panic disorder versus no past-year PDM (major depression OR= 2.41, 95% confidence interval [95% CI]= 1.91–3.03; Panic OR= 3.09, 95% CI= 2.10–4.56) than those with opioid-only PDM (major depression OR= 1.56, 95% CI= 1.24–1.98; panic OR= 1.37, 95% CI= 0.86–2.19). Notably, lifetime suicide attempt odds were 115% and 241% higher in those with past-year opioid-only PDM or opioid-involved poly-PDM, respectively (versus those without past-year PDM).
Past-year SUD
Alcohol Use Disorder (AUD), Cannabis Use Disorder (CUD), and Nicotine Dependence (ND) evidenced significantly elevated odds in those with any opioid-involved PDM versus those without past-year PDM (Table 3). Compared to those without PDM, AUD odds were 117% and 248% higher, CUD odds were 186% and 405% higher, and ND odds were 59% and 162% higher in those with opioid-only or opioid-involved poly-PDM, respectively. ND odds were significantly different between those with opioid-only PDM and opioid-involved poly-PDM, with higher relative odds in those with poly-PDM. Those with poly-PDM also had elevated odds of opioid use disorder versus those with opioid-only PDM, with a 67% elevation in odds.
Table 3:
Odds of Past-Year Substance Use Diagnosis by Opioid-Involved PDM and Poly-PDM Status (n= 14,637)
| Alcohol Use Disorder | Cannabis Use Disorder | Nicotine Dependence | Opioid Use Disorder | |
|---|---|---|---|---|
| No Past-Year PDM | 1.00 (reference) | 1.00 (reference) | 1.00 (reference) | Not applicable |
| Opioid-Only PDM | 2.17 (1.77–2.67)*** | 2.86 (1.39–5.91)*** | 1.59 (1.33–1.90)*** | 1.00 (reference) |
| Poly-PDM | 2.48 (1.97–3.12)*** | 5.05 (2.84–8.97)*** | 2.62 (2.21–3.10)***a | 1.67 (1.09–2.55)* |
Data Source: NESARC-III
Abbreviations: PDM = Prescription Drug Misuse
denotes p ≤ 0.05;
denotes p ≤ 0.01;
denotes p ≤ 0.001;
denotes significant difference between Opioid-Only and Poly-PDM (p ≤ 0.01)
All analyses control for age, sex, race/ethnicity, region of the US, urbanicity, marital status, and educational attainment.
Health-related Quality-of-life (SF-12v2)
Data on the SF-12v2 component scores are summarized in Figure 1, with the physical health scales in Figure 2, and the mental health scales in Figure 3. Both the physical and mental health component scores evidenced significant stepwise decreases from those without past-year PDM (physical health component [PCS]=45.27, mental health component [MCS]=51.25), to those with opioid-only PDM (PCS=44.31, MCS=48.21) and those with opioid-involved poly-PDM (PCS= 42.82, MCS= 46.28).
Figure 1:

Health-Related Quality-of-Life (SF-12) by Opioid-Involved PDM and Poly-PDM
For all figures:
Data Source: NESARC-III
Abbreviations: PDM = Prescription Drug Misuse
Notes: SF-12 scores are normed to a value of 50, with a standard deviation of 10; higher scores denote better health-related quality-of-life.
* denotes corrected (for three comparisons) p ≤ 0.05, ** denotes corrected (for three comparisons) p ≤ 0.01, and *** denotes corrected (for three comparisons) p ≤ 0.001, with analyses controlling for age, sex, race/ethnicity, region of the US, urbanicity, marital status, and educational attainment.
Error bars denote standard errors.
Figure 2:

Physical Health-Related Quality-of-Life Subscales (SF-12) by Opioid-Involved PDM and Poly-PDM
For all figures:
Data Source: NESARC-III
Abbreviations: PDM = Prescription Drug Misuse
Notes: SF-12 scores are normed to a value of 50, with a standard deviation of 10; higher scores denote better health-related quality-of-life.
* denotes corrected (for three comparisons) p ≤ 0.05, ** denotes corrected (for three comparisons) p ≤ 0.01, and *** denotes corrected (for three comparisons) p ≤ 0.001, with analyses controlling for age, sex, race/ethnicity, region of the US, urbanicity, marital status, and educational attainment.
Error bars denote standard errors.
Figure 3:
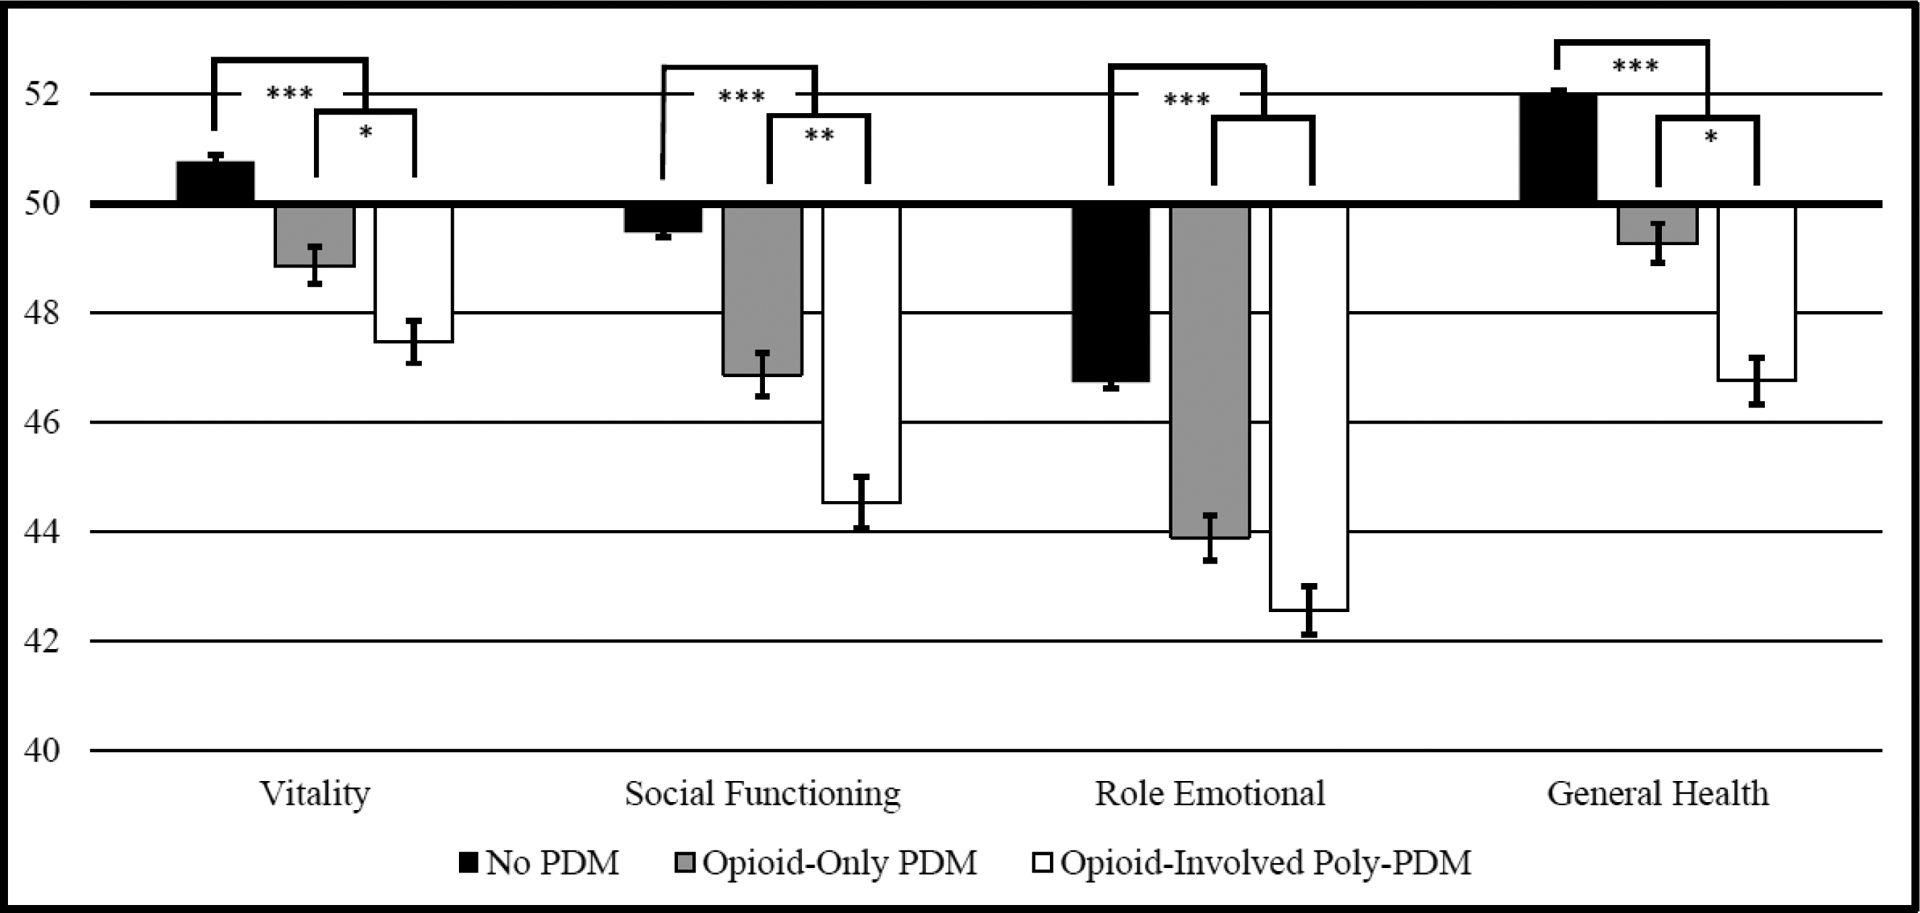
Mental Health-Related Quality-of-Life Subscales (SF-12) by Opioid-Involved PDM and Poly-PDM
For all figures:
Data Source: NESARC-III
Abbreviations: PDM = Prescription Drug Misuse
Notes: SF-12 scores are normed to a value of 50, with a standard deviation of 10; higher scores denote better health-related quality-of-life.
* denotes corrected (for three comparisons) p ≤ 0.05, ** denotes corrected (for three comparisons) p ≤ 0.01, and *** denotes corrected (for three comparisons) p ≤ 0.001, with analyses controlling for age, sex, race/ethnicity, region of the US, urbanicity, marital status, and educational attainment.
Error bars denote standard errors.
Similar stepwise results were found for the four physical health and four mental health scales, with the exceptions of the physical functioning and role emotional scales, which did not differ between those with past-year opioid-only PDM and those with opioid-involved poly-PDM. Notably, the bodily pain scale was quite low (noting poorer quality-of-life) in those with opioid-involved poly-PDM (42.02), with significant increases to those with opioid-only PDM (44.30) or no past-year PDM (46.76). Similarly, the social functioning and mental health scales evidenced stepwise increases of two points or more from those with opioid-involved PDM to those with opioid-only PDM, and finally, those without PDM.
DISCUSSION
Our hypotheses were supported by the results we observed: decreasing rates of PDM and poly-PDM with aging, and the highest odds of SUD, other psychopathology, and health-related quality-of-life scores in adults 50 and older with opioid-involved poly-PDM. We also found very low rates of stimulant PDM in adults 50 and older. There were generally consistent decreases in any PDM and poly-PDM from the youngest (50–54) to the oldest (80 and older) cohorts. For no past-year PDM, those 50–54 and 55–59 years of age had virtually identical rates (80.5% and 80.6%, respectively), with the highest rates in those 80 and older (96.0%). While single medication class PDM peaked in those 55–59 years of age (11.2%), poly-PDM was most common in those 50–54 years (9.1%). In both cases, those 80 and older had the lowest prevalence rates: 3.1% single medication class PDM, and 0.9% poly-PDM, with no cases of three medication class PDM. These results suggest the importance of screening for opioid PDM and opioid-involved poly-PDM in adults 50 and older, especially those under 70 years, given that roughly 10% or greater of these cohorts engaged in PDM.
Also, these findings are consistent with past work suggesting that any PDM is less prevalent in adults 65 years and older, versus adults 50–64 years (e.g., Schepis, McCabe, & Teter, 2018). Decreasing rates of PDM and poly-PDM with age may reflect greater levels of chronic health conditions, religiosity, and adverse effects of substance use with aging. Diagnosis of an incident chronic health condition in adults was associated with decreased substance use post-diagnosis (Xiang, 2016), and religiosity generally increases with age (Pew Research Center, 2015) and is associated with decreased substance use in older adults (Kuerbis, Sacco, Blazer, & Moore, 2014; Wu & Blazer, 2011). Finally, aging is associated with increased adverse effects of substance use (Kuerbis et al., 2014; Wu & Blazer, 2011), which may provide a physiological signal to reduce use.
SUD, other psychopathology and health-related quality-of-life outcomes were all significantly worse in those with opioid-involved PDM of any kind, with the highest ORs in those with opioid-involved poly-PDM. Odds of major depression, panic disorder and nicotine dependence were higher in late middle aged and older adults with opioid-involved poly-PDM those with opioid-only PDM; similarly, both higher-order SF-12v2 component scores were significantly lower (i.e., worse) in those with poly-PDM, as were six of eight scales. The bodily pain, general health, and role emotional scale scores were quite low in those with poly-PDM, suggesting key functional limitations related to pain, health problems, and emotional problems. Recent U.S. Preventive Task Force guidelines recommend screening for substance use, including PDM, in all adults (U.S. Preventive Services Task Force, 2019); such screening is particularly needed in those with PDM. Those with PDM also need screening for underlying mental and physical health conditions, with a particular need for assessment of suicidality, given its consequences and past research associating suicidal ideation with PDM in aging adults (K. T. Chan et al., 2019; Schepis et al., 2019).
Notably, the SF-12v2 scores were generally higher than in past research in adults 50 and older for both past-year and prior to past-year opioid PDM (Schepis & McCabe, 2019), suggesting that those examined here with poly-PDM are likely to be composed of a mix of those with only past-year initiation and those with more persistent PDM engagement. As noted in the Introduction, these associations could result from a shared vulnerability to other substance use, psychopathology, and poorer health among those with PDM; this is consistent with past longitudinal research on PDM and mental health (Martins et al., 2012; Schepis & Hakes, 2011), and while this cross-sectional research cannot evaluate pathways between PDM and the examined outcomes, future longitudinal research in aging adults should do so.
Finally, stimulant PDM was quite rare in adults 50 and older, except for stimulant PDM in the guise of three medication class poly-PDM. Given the nature of the NESARC-III assessment of stimulant misuse, methamphetamine use was included and likely affected these results. Data from the 2017 and 2018 NSDUH, though, indicate that any past-year methamphetamine use in adults 50 and older is very rare, at 0.3 and 0.4% of the age group, respectively (Substance Abuse and Mental Health Services Administration, 2019). Thus, while a limitation, it is unlikely that methamphetamine use accounted for a major proportion of the stimulant misuse found in three medication class PDM, given its prevalence (e.g., 3.8–4.0% in the 50–59 age groups). Stimulant PDM was rare in adults 50 and older, assessed via the 2002/03 and 2012/13 (Schepis & McCabe, 2016) and the 2015/16 National Survey on Drug Use and Health data (Compton, Han, Blanco, Johnson, & Jones, 2018), and these results further supports that finding.
Limitations
There were several limitations of this study. One, given the cross-sectional design of the NESARC-III, causal inference cannot be made. Second, both self-report and retrospective biases for recency of PDM and diagnoses were possible, particularly given the personalized interview nature of the NESARC-III. Overall, though, research indicates that self-report substance use and mental health data are generally reliable and valid (Grant et al., 2015; Johnston & O’Malley, 1985; O’Malley, Bachman, & Johnston, 1983). Third, analyses were limited by the available variables and the sample, given the secondary data analytic nature of the work. A key missing construct was cognitive status, which may be impaired in aging adults. While cognitively impaired older adults were less likely to be included, due to their inability to participate and give consent (per Grant et al., 2014), the effects of cognitive impairment on PDM are unknown. Fourth, older adults in controlled access dwellings, like nursing homes, were likely to be undersampled, with more limited coverage of the aging adult population in the NESARC-III (Grant et al., 2014). Given that older adults in controlled access dwellings may have less access to medication for PDM, our results may not apply to that population. Furthermore, interrater reliability (kappa) values for the assessed mental health outcomes was fair to moderate, though the SUD measures had better reliability (Grant et al., 2015). Finally, and as noted above, methamphetamine use was included in the stimulant misuse assessment, affecting the results.
Clinical Implications
Consistent with past research both across the population (B. Han et al., 2017; Mowbray & Quinn, 2015) and in adults 50 years and older (Chang, 2018; Schepis & McCabe, 2019), any opioid-involved PDM is associated with a greater level of concurrent substance use, SUD, and psychopathology, with poorer health-related quality-of-life. Thus, the presence of opioid PDM warrants screening for other problematic substance use and mental and physical health concerns. The markedly poorer health-related quality-of-life scores indicating elevated bodily pain found here also suggests screening for pain conditions. In adults 50 years and older for whom screening indicated treatment needs, non-opioid and non-tranquilizer sedative options should be implemented, given their history of PDM.
Adults 50 years and older with poly-PDM are more likely to have impaired health-related quality-of-life, major depression, panic disorder, and nicotine dependence. While the first step in attending to the needs of aging adults with poly-PDM is a thorough health history and assessment, it is likely these individuals will need a greater level of intervention than those with opioid-only PDM. For both those with opioid-only and those with opioid-involved PDM, screening for prescription opioid use disorder is needed, with screening for a sedative use disorder in those with poly-PDM.
Nonetheless, adults 50 years and older already on opioid therapy should not be tapered without a full evaluation of benefits and risks, given the potential harms associated with forced tapering (Darnall et al., 2018). If opioid discontinuation is warranted, clear communication with the patient is needed to maximize safety and outcomes (Matthias et al., 2017). As noted in the Introduction, Makris et al. (2014) recommend acetaminophen as a first-line pharmacological treatment in aging adults, combined with increased physical activity, and opioid therapy as an option when acetaminophen fails. Finally, for those with opioid use disorder, the American Society of Addiction Medicine guidelines for treatment are recommended as a resource (Kampman & Jarvis, 2015).
Future Directions and Summary
In conclusion, our results indicate that past-year PDM decreases as age increases in US adults 50 years and older, with corresponding reductions in single medication class and poly-PDM. Stimulant PDM was rare in adults 50 and older, except for in the context of PDM with both opioid and tranquilizer/sedative medication. Finally, any opioid-involved PDM was associated with greater odds of four SUD diagnoses, lifetime suicide attempts, major depression, PTSD and three anxiety diagnoses, with the highest odds in aging adults with opioid-involved poly-PDM. Future research should combine examination of poly-PDM with variables on duration and frequency of PDM, both of which are important indicators of severity. With the aging of the Baby Boomers into the eighth and ninth decades of life, it is unclear if PDM rates will rise, compared to past similarly aged cohorts. As a consequence, continued research on changes in PDM in adults 50 and older is needed, with emphasis on analyses of data with greater sample sizes, richer measures, and longitudinal data to determine theoretical and causal relationships.
FUNDING
This work was supported by the National Institute on Drug Abuse (NIDA) under Grant R01 DA043691; Grant R01 DA042146; Grant R01 DA036541; and Grant R01 DA031160. The NESARC-III was funded by the National Institute on Alcohol Abuse and Alcoholism (NIAAA). The content is the authors’ responsibility and does not necessarily represent the views of NIDA or NIAAA.
Footnotes
DISCLOSURE STATEMENT
The authors report no conflicts of interest.
DATA AVAILABILITY STATEMENT
The data that support the findings of this study are available from the US National Institute on Alcohol Abuse and Alcoholism. Restrictions apply to the availability of these data, which were used under license for this study. Applications to use the data are available at https://www.niaaa.nih.gov/research/nesarc-iii/nesarc-iii-data-access
REFERENCES
- 2019 American Geriatrics Society Beers Criteria® Update Expert Panel. (2019). American Geriatrics Society 2019 Updated AGS Beers Criteria(R) for Potentially Inappropriate Medication Use in Older Adults. J Am Geriatr Soc, 67(4), 674–694. doi: 10.1111/jgs.15767 [DOI] [PubMed] [Google Scholar]
- Archer KR, Devin CJ, Vanston SW, Koyama T, Phillips SE, Mathis SL, … Wegener ST (2016). Cognitive-Behavioral-Based Physical Therapy for Patients With Chronic Pain Undergoing Lumbar Spine Surgery: A Randomized Controlled Trial. J Pain, 17(1), 76–89. doi: 10.1016/j.jpain.2015.09.013 [DOI] [PMC free article] [PubMed] [Google Scholar]
- Bentur N, & King Y (2010). The challenge of validating SF-12 for its use with community-dwelling elderly in Israel. Qual Life Res, 19(1), 91–95. doi: 10.1007/s11136-009-9562-3 [DOI] [PubMed] [Google Scholar]
- Blazer DG, & Wu LT (2009). Nonprescription use of pain relievers by middle-aged and elderly community-living adults: National Survey on Drug Use and Health. J Am Geriatr Soc, 57(7), 1252–1257. doi: 10.1111/j.1532-5415.2009.02306.x [DOI] [PMC free article] [PubMed] [Google Scholar]
- Center for Behavioral Health Statistics and Quality. (2017). 2016 National Survey on Drug Use and Health: Methodological resource book (Section 8, data collection final report). Rockville, MD: Substance Abuse and Mental Health Services Administration. [Google Scholar]
- Cernin PA, Cresci K, Jankowski TB, & Lichtenberg PA (2010). Reliability and validity testing of the short-form health survey in a sample of community-dwelling African American older adults. J Nurs Meas, 18(1), 49–59 [DOI] [PubMed] [Google Scholar]
- Chan K, Moller M, Marsack-Topolewski C, Winston P, Jennings R, & Prifti A (2020). Age Differences in Non-Medical Prescription Opioid Use and Psychological Distress. Subst Use Misuse, 1–9. doi: 10.1080/10826084.2020.1765808 [DOI] [PubMed] [Google Scholar]
- Chan KT, Winston P, Jennings R, Trant J, & Moller M (2019). Age differences in the association of nonmedical prescription opioid use and suicidality. J Opioid Manag, 15(1), 5–10. doi: 10.5055/jom.2019.0480 [DOI] [PubMed] [Google Scholar]
- Chang YP (2018). Factors associated with prescription opioid misuse in adults aged 50 or older. Nurs Outlook, 66(2), 112–120. doi: 10.1016/j.outlook.2017.10.007 [DOI] [PMC free article] [PubMed] [Google Scholar]
- Compton WM, Han B, Blanco C, Johnson K, & Jones CM (2018). Prevalence and Correlates of Prescription Stimulant Use, Misuse, Use Disorders, and Motivations for Misuse Among Adults in the United States. Am J Psychiatry, 175(8), 741–755. doi: 10.1176/appi.ajp.2018.17091048 [DOI] [PMC free article] [PubMed] [Google Scholar]
- Darnall BD, Juurlink D, Kerns RD, Mackey S, Van Dorsten B, Humphreys K, … Lovejoy T (2018). International Stakeholder Community of Pain Experts and Leaders Call for an Urgent Action on Forced Opioid Tapering. Pain Medicine, 20(3), 429–433. doi: 10.1093/pm/pny228 [DOI] [PMC free article] [PubMed] [Google Scholar]
- Fayaz A, Croft P, Langford RM, Donaldson LJ, & Jones GT (2016). Prevalence of chronic pain in the UK: a systematic review and meta-analysis of population studies. BMJ open, 6(6), e010364–e010364. doi: 10.1136/bmjopen-2015-010364 [DOI] [PMC free article] [PubMed] [Google Scholar]
- Gobbens RJ (2018). Associations of ADL and IADL disability with physical and mental dimensions of quality of life in people aged 75 years and older. PeerJ, 6, e5425. doi: 10.7717/peerj.5425 [DOI] [PMC free article] [PubMed] [Google Scholar]
- Goga JK, Michaels A, Zisselman M, DePaolo A, Khushalani S, Walters JK, … Kopp M (2019). Reducing opioid use for chronic pain in older adults. American Journal of Health-System Pharmacy, 76(8), 554–559. doi: 10.1093/ajhp/zxz025 [DOI] [PubMed] [Google Scholar]
- Gooneratne NS, & Vitiello MV (2014). Sleep in older adults: normative changes, sleep disorders, and treatment options. Clin Geriatr Med, 30(3), 591–627. doi: 10.1016/j.cger.2014.04.007 [DOI] [PMC free article] [PubMed] [Google Scholar]
- Grant BF, Chu A, Sigman R, Amsbary M, Kali J, Sugawara Y, … Goldstein R (2014). Source and accuracy statement: National Epidemiologic Survey on Alcohol and Related Conditions-III (NESARC-III). Rockville, MD: National Institute on Alcohol Abuse and Alcoholism. [Google Scholar]
- Grant BF, Goldstein RB, Smith SM, Jung J, Zhang H, Chou SP, … Hasin DS (2015). The Alcohol Use Disorder and Associated Disabilities Interview Schedule-5 (AUDADIS-5): reliability of substance use and psychiatric disorder modules in a general population sample. Drug Alcohol Depend, 148, 27–33. doi: 10.1016/j.drugalcdep.2014.11.026 [DOI] [PMC free article] [PubMed] [Google Scholar]
- Hall MJ, Schwartzman A, Zhang J, & Liu X (2017). Ambulatory Surgery Data From Hospitals and Ambulatory Surgery Centers: United States, 2010. Natl Health Stat Report(102), 1–15 [PubMed] [Google Scholar]
- Han B, Compton WM, Blanco C, Crane E, Lee J, & Jones CM (2017). Prescription Opioid Use, Misuse, and Use Disorders in U.S. Adults: 2015 National Survey on Drug Use and Health. Ann Intern Med, 167(5), 293–301. doi: 10.7326/m17-0865 [DOI] [PubMed] [Google Scholar]
- Han BH, Sherman SE, & Palamar JJ (2019). Prescription opioid misuse among middle-aged and older adults in the United States, 2015–2016. Preventive medicine, 121, 94–98. doi: 10.1016/j.ypmed.2019.02.018 [DOI] [PMC free article] [PubMed] [Google Scholar]
- Hasin DS, Shmulewitz D, Stohl M, Greenstein E, Aivadyan C, Morita K, … Grant BF (2015). Procedural validity of the AUDADIS-5 depression, anxiety and post-traumatic stress disorder modules: Substance abusers and others in the general population. Drug Alcohol Depend, 152, 246–256. doi: 10.1016/j.drugalcdep.2015.03.027 [DOI] [PMC free article] [PubMed] [Google Scholar]
- Jayasinghe N, Finkelstein-Fox L, Sar-Graycar L, Ojie MJ, Bruce ML, & Difede J (2017). Systematic Review of the Clinical Application of Exposure Techniques to Community-Dwelling Older Adults with Anxiety. Clin Gerontol, 40(3), 141–158. doi: 10.1080/07317115.2017.1291546 [DOI] [PMC free article] [PubMed] [Google Scholar]
- Johnston LD, & O’Malley PM (1985). Issues of validity and population coverage in student surveys of drug use. NIDA Research Monograph, 57, 31–54 [PubMed] [Google Scholar]
- Kampman K, & Jarvis M (2015). American Society of Addiction Medicine (ASAM) National Practice Guideline for the Use of Medications in the Treatment of Addiction Involving Opioid Use. Journal of Addiction Medicine, 9(5), 358–367. doi: 10.1097/ADM.0000000000000166 [DOI] [PMC free article] [PubMed] [Google Scholar]
- Kim BH, & Park J-W (2018). Epidemiology of liver cancer in South Korea. Clinical and molecular hepatology, 24(1), 1–9. doi: 10.3350/cmh.2017.0112 [DOI] [PMC free article] [PubMed] [Google Scholar]
- Kuerbis A, Sacco P, Blazer DG, & Moore AA (2014). Substance abuse among older adults. Clin Geriatr Med, 30(3), 629–654. doi: 10.1016/j.cger.2014.04.008 [DOI] [PMC free article] [PubMed] [Google Scholar]
- Makris UE, Abrams RC, Gurland B, & Reid MC (2014). Management of persistent pain in the older patient: a clinical review. Jama, 312(8), 825–836. doi: 10.1001/jama.2014.9405 [DOI] [PMC free article] [PubMed] [Google Scholar]
- Maree RD, Marcum ZA, Saghafi E, Weiner DK, & Karp JF (2016). A Systematic Review of Opioid and Benzodiazepine Misuse in Older Adults. Am J Geriatr Psychiatry, 24(11), 949–963. doi: 10.1016/j.jagp.2016.06.003 [DOI] [PMC free article] [PubMed] [Google Scholar]
- Martins SS, Fenton MC, Keyes KM, Blanco C, Zhu H, & Storr CL (2012). Mood and anxiety disorders and their association with non-medical prescription opioid use and prescription opioid-use disorder: longitudinal evidence from the National Epidemiologic Study on Alcohol and Related Conditions. Psychol Med, 42(6), 1261–1272. doi: 10.1017/S0033291711002145 [DOI] [PMC free article] [PubMed] [Google Scholar]
- Matthias MS, Johnson NL, Shields CG, Bair MJ, MacKie P, Huffman M, & Alexander SC (2017). “I’m Not Gonna Pull the Rug out From Under You”: Patient-Provider Communication About Opioid Tapering. J Pain, 18(11), 1365–1373. doi: 10.1016/j.jpain.2017.06.008 [DOI] [PMC free article] [PubMed] [Google Scholar]
- Meucci RD, Fassa AG, & Faria NM (2015). Prevalence of chronic low back pain: systematic review. Rev Saude Publica, 49. doi: 10.1590/s0034-8910.2015049005874 [DOI] [PMC free article] [PubMed] [Google Scholar]
- Mowbray O, & Quinn A (2015). Prescription pain reliever misuse prevalence, correlates, and origin of possession throughout the life course. Addict Behav, 50, 22–27. doi: 10.1016/j.addbeh.2015.06.006 [DOI] [PubMed] [Google Scholar]
- O’Malley PM, Bachman JG, & Johnston LD (1983). Reliability and consistency in self-reports of drug use. International Journal of Addiction, 18, 805–824 [DOI] [PubMed] [Google Scholar]
- Pary R, Sarai SK, Micchelli A, & Lippmann S (2019). Anxiety Disorders in Older Patients. Prim Care Companion CNS Disord, 21(1). doi: 10.4088/PCC.18nr02335 [DOI] [PubMed] [Google Scholar]
- Patel D, Steinberg J, & Patel P (2018). Insomnia in the Elderly: A Review. J Clin Sleep Med, 14(6), 1017–1024. doi: 10.5664/jcsm.7172 [DOI] [PMC free article] [PubMed] [Google Scholar]
- Paulozzi LJ, Strickler GK, Kreiner PW, & Koris CM (2015). Controlled Substance Prescribing Patterns--Prescription Behavior Surveillance System, Eight States, 2013. MMWR Surveill Summ, 64(9), 1–14. doi: 10.15585/mmwr.ss6409a1 [DOI] [PubMed] [Google Scholar]
- Pew Research Center. (2015). America’s Changing Religious Landscape. Retrieved from https://www.pewforum.org/2015/05/12/americas-changing-religious-landscape/
- Schepis TS, & Hakes JK (2011). Nonmedical prescription use increases the risk for the onset and recurrence of psychopathology: results from the National Epidemiological Survey on Alcohol and Related Conditions. Addiction, 106(12), 2146–2155. doi: 10.1111/j.1360-0443.2011.03520.x [DOI] [PubMed] [Google Scholar]
- Schepis TS, & McCabe SE (2016). Trends in older adult nonmedical prescription drug use prevalence: Results from the 2002–2003 and 2012–2013 National Survey on Drug Use and Health. Addict Behav, 60, 219–222. doi: 10.1016/j.addbeh.2016.04.020 [DOI] [PMC free article] [PubMed] [Google Scholar]
- Schepis TS, & McCabe SE (2019). Prescription Opioid Misuse in US Older Adults: Associated Comorbidities and Reduced Quality of Life in the National Epidemiologic Survey of Alcohol and Related Conditions-III. J Clin Psychiatry, 80(6), 19m12853. doi: 10.4088/JCP.19m12853 [DOI] [PMC free article] [PubMed] [Google Scholar]
- Schepis TS, McCabe SE, & Teter CJ (2018). Sources of opioid medication for misuse in older adults: Results from a nationally representative survey. Pain, 159(8), 1543–1549. doi: 10.1097/j.pain.0000000000001241 [DOI] [PMC free article] [PubMed] [Google Scholar]
- Schepis TS, Simoni-Wastila L, & McCabe SE (2019). Prescription opioid and benzodiazepine misuse is associated with suicidal ideation in older adults. Int J Geriatr Psychiatry, 34(1), 122–129. doi: 10.1002/gps.4999 [DOI] [PMC free article] [PubMed] [Google Scholar]
- Schepis TS, Teter CJ, Simoni-Wastila L, & McCabe SE (2018). Prescription tranquilizer/sedative misuse prevalence and correlates across age cohorts in the US. Addict Behav, 87, 24–32. doi: 10.1016/j.addbeh.2018.06.013 [DOI] [PMC free article] [PubMed] [Google Scholar]
- Substance Abuse and Mental Health Services Administration. (2019). Results from the 2018 National Survey on Drug Use and Health: Detailed tables. Rockville, MD: Center for Behavioral Health Statistics and Quality, Substance Abuse and Mental Health Services Administration. [Google Scholar]
- Takano T (2017). Natural history of thyroid cancer. Endocr J, 64(3), 237–244. doi: 10.1507/endocrj.EJ17-0026 [DOI] [PubMed] [Google Scholar]
- U.S. Preventive Services Task Force. (2019). Illicit Drug Use, Including Nonmedical Use of Prescription Drugs: Screening. Retrieved from https://www.uspreventiveservicestaskforce.org/Page/Document/draft-recommendation-statement/drug-use-in-adolescents-and-adults-including-pregnant-women-screening
- Ware J Jr., Kosinski M, & Keller SD (1996). A 12-Item Short-Form Health Survey: construction of scales and preliminary tests of reliability and validity. Med Care, 34(3), 220–233 [DOI] [PubMed] [Google Scholar]
- Wu LT, & Blazer DG (2011). Illicit and nonmedical drug use among older adults: a review. J Aging Health, 23(3), 481–504. doi: 10.1177/0898264310386224 [DOI] [PMC free article] [PubMed] [Google Scholar]
- Xiang X (2016). Chronic Disease Diagnosis as a Teachable Moment for Health Behavior Changes Among Middle-Aged and Older Adults. Journal of Aging and Health, 28(6), 995–1015. doi: 10.1177/0898264315614573 [DOI] [PubMed] [Google Scholar]