

Abstract
Osteosarcoma (OS) is the most prevalent form of bone cancer. It has a high metastatic potential and progresses rapidly. The molecular mechanisms of OS remain unclear and this study aims to examine the functional role of circPVT1 and miR‐423‐5p in OS. Quantitative RT‐PCR (qRT‐PCR) and western blotting were used to examine levels of miR‐423‐5p, circPVT1, Wnt5a, Ror2, and glycolysis‐related proteins, including HK2, PKM2, GLUT1, and LDHA. Colony formation and transwell assays were used to test the roles of miR‐423‐5p, circPVT1, and Wnt5a/Ror2 in OS cell proliferation, migration, and invasion. Dual luciferase assay and Ago2‐RIP were used to validate the interactions of miR‐423‐5p/Wnt5a, miR‐423‐5p/Ror2, and circPVT1/miR‐423‐5p. Glucose uptake assay and measurement of lactate production were performed to assess the glycolysis process. A nude mouse xenograft model was used to evaluate the effects of sh‐circPVT1 and miR‐423‐5p mimics on tumor growth and metastasis in vivo. miR‐423‐5p was reduced in both OS tissues and OS cell lines, while Wnt5a/Ror2 and circPVT1 were elevated. miR‐423‐5p bound to 3′‐UTR of Wnt5a and Ror2 mRNA, and inhibited glycolysis and OS cell proliferation, migration, and invasion by targeting Wnt5a and Ror2. circPVT1 interacted with miR‐423‐5p and activated Wnt5a/Ror2 signaling by sponging miR‐423‐5p. Knockdown of circPVT1 or overexpression of miR‐423‐5p suppressed OS tumor growth and metastasis in vivo. miR‐423‐5p inhibited OS glycolysis, proliferation, migration, and metastasis by targeting and suppressing Wnt5a/Ror2 signaling pathway, while circPVT1 promoted those processes by acting as a sponge of miR‐423‐5p.
Keywords: circPVT1, glycolysis, miR‐423‐5p, osteosarcoma, Ror2 signaling, Wnt5a
miR‐423‐5p was diminished while circPVT1 and Wnt5a/Ror2 were increased in OS. miR‐423‐5p restrained glycolysis, OS cell proliferation, and migration by targeting Wnt5a/Ror2 signaling. circPVT1 bound to miR‐423‐5p and acted as a sponge. circPVT1 promoted glycolysis, OS cell proliferation, and metastasis by binding to miR‐423‐5p. Knockdown of circPVT1 or overexpression of miR‐423‐5p inhibited OS tumor growth and metastasis in vivo.

1. INTRODUCTION
Osteosarcoma (OS) is an extremely malignant tumor and the most prevalent type of primary bone cancer. It derives from primitive osteogenic mesenchymal cells. 1 , 2 The majority of people diagnosed with OS are under 25 years. It comprises approximately 2.4% of pediatric diseases. 3 OS is a highly malignant carcinoma, and the rates of hematogenous metastasis and lung metastasis are very high. 1 , 4 , 5 Currently, surgical resection in combination with chemotherapy and radiation is the most common treatment for OS. 6 , 7 , 8 The prognosis of OS is remains poor and the 5‐year survival rate of OS patients has not increased significantly in the past 10 decades. 9 One of the major challenges is its high metastasis and rapid progression. Furthermore, the pathogenesis and mechanisms underlying OS are complex and elusive. Therefore, revealing the molecular mechanisms underlying OS development and progression is critical for developing specific therapies for OS.
Glycolysis is a biological process in which glucose is broken down into 2,3‐carbon compounds. It is widely used by the cells in the body for energy generation and the process produces pyruvate or lactate in aerobic conditions or in anaerobic settings, respectively. 10 The glucose uptake rate in tumor cells is extremely high as they grow and proliferate fast, resulting in the production of a large amount of lactate. 11 This is known as the Warburg effect. 12 The exact function of the Warburg effect is still not fully understood. Some studies indicate that it can help promote cancer cell growth and migration. 10 Other studies suggest that it can build up the tumor microenvironment that enhances the disruption of tissue architecture and immune cell evasion. 13 The importance of glycolysis to cancer cells is further highlighted by a study showing that 2‐Deoxy‐d‐glucose, a glycolysis inhibitor, represses OS growth. 14 Therefore, the glycolysis process could serve as an attractive target for OS treatment or cancer treatment in genaral.
Wnt proteins are a class of secreted cysteine‐rich proteins that have critical roles in many cellular processes, such as cell proliferation and movement. 15 , 16 They function by acting as ligands for Wnt receptors to activate intracellular signaling pathways, including canonical (β‐catenin dependent) and non–canonical (β‐catenin independent) pathways. Wnt5a is a member of the Wnt family and usually induces the activation of non–canonical signaling. 17 Indeed, Wnt5a can function against and inhibit canonical Wnt pathways. Thus, it has been shown that Wnt5a suppresses cell growth and proliferation, suggesting a tumor repressor role, while some studies show that Wnt5a facilitates cell migration and invasion. 18 Therefore, the function of Wnt5a remains complex and is probably cell/tissue‐specific. Receptor tyrosine kinase‐like orphan receptor 2 (Ror2) is an important member of the Ror‐family, which are receptor tyrosine‐protein kinases. Ror2 functions as a Wnt5a receptor/co–receptor. 19 , 20 The Wnt5a/Ror2 signal could induce the activation of the Jun N‐terminal kinase (JNK) pathway but also antagonize the canonical β‐catenin‐dependent Wnt pathway. 21 Wnt5a signaling promotes melanoma by enhancing the glycolysis process. 22 Previous studies indicate that in OS, Wnt5a/Ror2 signaling is enhanced and that this activation greatly enhances the migration and invasion abilities of OS cells. 23 However, the upstream regulator of Wnt5a/Ror2 signaling and the mechanisms underlying the function of Wnt5a/Ror2 in OS remain unclear.
Circular RNA (circRNA) are a family of endogenous non–coding RNA that are covalently closed with a very stable structure. 24 , 25 Emerging evidence suggests that circRNA play important roles in many developmental and physiological processes. 25 Furthermore, many circRNA have been implicated in diseases, such as cardiovascular diseases, neurological disorders, and cancers. 25 In OS, circPVT1 (hsa_circ_0001821) has been observed as elevated in OS tissues and cells and its level positively correlates with poor prognosis of OS patients. 26 However, the underlying mechanisms are elusive. Numerous studies have shown that many circRNA function by acting as microRNA or protein inhibitors through competitive binding. 25 To study the exact function of circPVT1 in OS, we hypothesized that circPVT1 may function through binding to some downstream miRNA as well. Therefore, we performed an initial bioinformatic analysis (StarBase) to search for miRNA that could potentially bind with circPVT1 and that are involved in OS. One of our top hits was miR‐423‐5p. First, our bioinformatic analysis identified some complementary binding sites between circPVT1 and miR‐423‐5p. Second, miR‐423‐5p is an important tumor suppressor and inhibits proliferation and invasion of cancer cells, including in ovarian cancer and hepatocarcinoma. 27 , 28 Furthermore, there are some but not many studies that indicate that miR‐423‐5p is involved in OS. Overexpression of miR‐423‐5p inhibits OS proliferation and invasion. 29 Therefore, we hypothesized that circPVT1 may exert its function in OS through miR‐423‐5p.
In this study, we fully investigated the function of circPVT1/miR‐423‐5p/Wnt5a/Ror2 in OS. We found that circPVT1, Wnt5a, and Ror2 were all elevated in OS tissues and cells, while miR‐423‐5p was greatly reduced. Knockdown of circPVT1 or overexpression of miR‐423‐5p suppressed the glycolysis process, as well as OS cell proliferation and movement, including migration and invasion. Mechanistically, we provided evidence that miR‐423‐5p directly interacted with Wnt5a and Ror2 and negatively regulated their expression, while circPVT1 bound to miR‐423‐5p and activated Wnt5a/Ror2 signaling by acting as a miR‐423‐5p sponge. Knockdown of Wnt5a or Ror2 reversed the effects of miR‐423‐5p inhibitor or circPVT1 overexpression on OS cell glycolysis, cell proliferation, and movement abilities. Moreover, knockdown of circPVT1 or miR‐423‐5p mimics significantly inhibited OS tumor growth in vivo and its lung metastasis. Together, our study reveals an essential role of circPVT1/miR‐423‐5p/Wnt5a/Ror2 in glycolysis and OS development, providing insight into the molecular mechanisms underlying OS progression. Our work suggests that circPVT1/miR‐423‐5p/Wnt5a/Ror2 could serve as a target for the development of specific therapeutic strategies to treat OS.
2. MATERIALS AND METHODS
2.1. Human osteosarcoma samples
Human OS tissues were obtained from 36 OS patients during the process of surgery from Xiangya Hospital of Central South University. The adjacent non–tumor bone tissues were collected as control samples. The patients received no preoperative treatment prior to the sample collection. The protocol has been reviewed and approved by the ethics committee of Xiangya Hospital. All patients were informed of the study and provided written consent. All human specimens were fast‐frozen in liquid nitrogen and then kept at −80°C for subsequent experiments.
2.2. Cell culture and transfection
Four human OS cell lines (MG‐63, SaOS‐2, HOS, and U2OS) and one normal human osteoblastic cell line hFOB1.19 were used for the study. They were sourced from the Cell Bank of the Chinese Academy of Sciences. The culture medium used for growing the cells was composed of DMEM (Sigma‐Aldrich) plus 10% FBS (Sigma‐Aldrich) and antibiotics (1% penicillin‐streptomycin [P/S]; Gibco). Cells were grown in a cell incubator at 37°C and 5% CO2.
The circPVT1 sequence was cloned into the overexpression plasmid. miR‐423‐5p mimics and inhibitor were purchased from Genepharma. Sh‐Wnt5a, sh‐Ror2, and control shRNA were synthesized from GenePharma. Cell transfection was carried out as the manufacturer’s protocol described using Lipofectamine 3000 (Invitrogen). Briefly, cells were grown to 60%‐80% confluence and approximately 1 μg construct together with 1 μL Lipofectamine 3000 was added into the media. Cells were harvested for further analysis 48 hours after transfection. Stable cell lines were chosen with puromycin (3 μg/μL; Sigma) for 10 days after construct transfection or virus infection.
2.3. Colony formation assay
Human OS cells were seeded and cultured in the 12‐well culture plate for 1 week in the incubator. The observed colonies were fixed in 4% paraformaldehyde (PFA)/sucrose at room temperature 10‐15 minutes and washed with PBS afterwards. Then colonies were incubated with crystal violet (1%) for 10‐15 minutes for staining followed by imaging with the EVOS FL Imaging System. The number of colonies was quantified using ImageJ software.
2.4. Transwell migration and invasion assay
Transfected OS cells were seeded in the culture medium without any serum on top of the filter membrane (8‐μm pore) in the transwell insert. Full culture medium with 10% FBS was placed in the lower chamber and cells were grown for 24 hours. Afterwards, the upper filter was discarded. Cells growing on the lower dish were cells that had migrated there from the filter. They were fixed in 4% paraformaldehyde first for 10‐15 minutes, and then .2% crystal violet was added to stain the cells, followed by imaging. To analyze the invasive ability of cells, the upper filter was pre‐coated with Matrigel (BD Biosciences) overnight before cells were seeded. Following 24 hours of growth, cells residing in the lower dish were cells that had invaded from the top. Crystal violet staining was performed, as described above.
2.5. Glucose uptake assay
The glucose uptake/consumption rate of OS cells was quantified using the Glucose Uptake Assay Kit (Abcam), as described by the protocol. Briefly, OS cells were plated and grown in medium without glucose for 12 hours and then exposed to 2‐deoxyglucose (2‐DG) for 20 minutes at 37°C, followed by washing three times with PBS. The cells were later lysed with extraction buffer and the NADPH level in the supernatant was measured by an enzymatic recycling amplification reaction.
2.6. Measurement of lactate production
Lactate production was measured using a Lactate Assay Kit (Cell Biolabs), as described by the protocol. OS cells were maintained for 24 hours and the culture media supernatant was collected for the detection of lactate content using the lactate assay kit. The absorbance (450 nm) was determined using the spectrophotometer of the microplate reader.
2.7. Dual luciferase report assay
The wild‐type sequences or mutated binding sites of miR‐423‐5p in 3′UTR of Wnt5a and Ror2 and circPVT1 were cloned into downstream of the luciferase report vector (psiCHECK2). A Phusion Site‐Directed Mutagenesis Kit (Thermo Fisher Scientific) was used to mutate the predicted binding sites based on the manufacturer’s protocol. OS cells were seeded in 24‐well culture plates overnight and then recombinant constructs were transfected into OS cells using Lipofectamine 3000 together with miR‐423 mimics or mimics negative control (NC). After 48 hours, the cells were harvested in reporter lysis buffer from a commercial kit (Promega) and the relative luciferase activity was measured.
2.8. RNA immunoprecipitation assay
The OS cells were lysed and harvested using homemade lysis buffer (50 mmol/L Tris‐HCl, 150 mmol/L NaCl, 2 mmol/L EDTA, 1% Triton X‐100, 1% sodium deoxycholate) plus RNase and protease inhibitors (Roche). The extracted lysate was incubated with specific antibodies (anti–Ago2/IgG, 1:500, Abcam) overnight at 4°C and then pulled down with Protein G‐Sepharose beads (Abcam). The beads were washed with lysis buffer five times and then digested with Proteinase K (Sigma‐Aldrich) for 1.5 hours. The digested solution underwent RNA purification using TRIzol Reagent. Quantitative RT‐PCR was performed to examine the RNA yield. The primers used for analysis are listed below in the qRT‐PCR section.
2.9. Nude mice xenograft experiments
All animal experiments and protocols have been studied and authorized by the Institutional Animal Care and Use Committee of Xiangya Hospital of Central South University. Adult nude mice were obtained from SJA Laboratory and kept under a 12 h:12 h light/dark cycle for 2 weeks. The nude mice (8 weeks old) were subcutaneously unilaterally injected with 5 × 10⁶ transfected OS cells (HOS cells, control sh‐NC group, sh‐circPVT1 group, mimics NC group, and miR‐423 mimics group) to induce tumors. To calculate the volume of the tumors (V), tumor length (L) and tumor width (W) were measured every 5 days for 30 days. The volume of the tumor was measured according to the formula: V = .5 × (W)2 × (L). At the end point of experiments, animals were killed to dissect out the tumors. To measure lung metastasis, transfected OS cells (5 × 10⁶) (control sh‐NC group, sh‐circPVT1 group, mimics NC group, and miR‐423 mimics group) were injected through the tail vein. Lung tissues were harvested after 30 days for further analysis (H&E staining and immunohistochemistry).
2.10. Sanger sequencing and RNase R treatment
The circPVT1 sequence was obtained using divergent primers sent to Sangon for Sanger sequencing analysis. For RNase R treatment, total RNA (2 μg) was incubated for 1 hour at 37°C with or without 3 U/μg of RNase R (Epicentre Technologies). After treatment with RNase R, qRT‐PCR was performed to determine the expression levels of circPVT1 and PVT1 mRNA.
2.11. RNA fluorescence in situ hybridization
The OS cells were washed with ice‐cold PBS and then fixed with 4% paraformaldehyde for 10 minutes at room temperature. The cells were washed with PBS and then permeabilized with .5% Triton X‐100 in PBS for 2 minutes at room temperature. Fluorescence‐labeled specific probes for miR‐423‐5p and circPVT1 were incubated with cells at 37°C overnight in the dark chamber. The next day, samples were washed with PBS and DAPI was added before the slides were mounted in mounting media (Invitrogen).
2.12. Immunohistochemistry
The tumor tissues from each group of mice were fixed in 4% PFA/sucrose overnight at 4°C, embedded in paraffin, and then sliced into 5‐μm thick sections. The paraffin sections were deparaffinized and rehydrated by bathing in a graded concentration of alcohol. The tissue sections were washed and then quenched in .3% hydrogen peroxide followed by blocking with blocking buffer at room temperature for 1 hour. Primary antibodies were added to incubate with slices overnight at 4°C. Primary antibodies were washed off using PBS three times and the slices were incubated with secondary antibodies at room temperature. Slices were washed again with PBS and incubated with DAPI solution at room temperature for 5‐10 minutes. Signals were detected with a standard HRP‐based immunohistochemistry kit (Biocompare), as described in the protocol. Primary antibodies used for the study were as follows: anti–Ki‐67 antibody (1:400; Abcam), anti–Wnt5a antibody (1:250; Thermo Fisher), and anti–Ror2 antibody (1:400; Cell Signaling).
2.13. H&E staining
Lung tissues were fixed with 4% PFA/sucrose solution overnight at 4°C and then washed with PBS. The tissues were embedded in paraffin followed by slicing into 20‐μm sections. Slices were stained with hematoxylin for 8 minutes first and washed followed by eosin staining for 1 minute, as described in the manufacturer’s protocol.
2.14. RNA extraction and quantitative RT‐PCR
TRIzol containing buffer (Invitrogen) was used to extract total RNA from OS tissues or cultured OS cells following the standard instructions. Following RNA preparation, 1‐2 μg RNA of each sample was reversely subjected for RT‐PCR using a reverse transcription kit (Thermo Fisher Scientific). The DNA were amplified by PCR with the PCR Master Mix Kit (Invitrogen). The levels of miR‐423 were determined using the miDETECT A Track miRNA qRT‐PCR Kit (Ruibo), as described in the protocol. Relative expression levels of circRNA or mRNA were normalized to U6 and β‐actin mRNA, respectively. The primers used in the study were as follows:
circPVT1 F(forward) primer: 5′‐GGTTCCACCAGCGTTATTC‐3′;
circPVT1 R(reverse)primer: 5′‐CAACTTCCTTTGGGTCTCC‐3′;
Wnt5a F primer: 5′‐AGGGCTCCTACGAGAGTGCT‐3′;
Wnt5a R primer: 5′‐GACACCCCATGGCACTTG‐3′;
Ror2 F primer: 5′‐GGCAGAACCCATCCTCGTG‐3′;
Ror2 R primer: 5′‐CGACTGCGAATCCAGGACC‐3′;
U6 F primer: 5′‐GCTTCGGCAGCACATATACTAAAAT‐3′;
U6 R primer: 5′‐CGCTTCACGAATTTGCGTGTCAT‐3′;
β‐actin F primer: 5′‐TGGCACCACACCTTCTACAA‐3′;
β‐actin R primer: 5′‐CCAGAGGCGTACAGGGATAG‐3′.
2.15. Western blotting
Proteins were extracted from the OS tissues or cultured OS cells by RIPA lysis buffer (Abcam) with protease inhibitor supplement. The concentration of protein in each sample was quantified by BCA assay with a standard assay kit (Thermo Fisher Scientific). Equal amount of protein was loaded for SDS‐PAGE. Proteins in the gels were then transferred to Nitrocellulose membranes (Millipore). Following that, 5% skimmed milk was used as blocking buffer to block the membranes for 30 min at room temperature and then primary antibodies were added for incubation at 4°C overnight. The membranes were washed with TBST three times and then incubated with specific species secondary antibodies (KPL) at room temperature for 2 hours. The membranes were washed again before visualization using an ECL kit. The primary antibodies used for the study were as follows: anti–GLUT1 (1:1000; Santa Cruz); anti–HK2 (1:500; Cell Signaling); (1:800; Cell Signaling); anti–LDHA (1:800; Cell Signaling); anti–Wnt5a (1:800; Abcam); anti–Ror2 (1:800; Abcam); and anti–β‐actin (1:2000; Abcam).
2.16. Statistical analysis
All experimental data were analyzed using GraphPad Prism 7. Statistical analysis was carried out using an unpaired two‐tailed Student t test (two groups) or one‐way ANOVA (multiple groups). Survival curves were plotted using the Kaplan‐Meier method and the statistical analysis was conducted using the log‐rank test. The data standard bars indicated ± SD. P < .05 was considered significant.
3. RESULTS
3.1. miR‐423‐5p was decreased in osteosarcoma and overexpression of miR‐423‐5p inhibited glycolysis and osteosarcoma cell proliferation, migration, and invasion
To investigate the functions of miR‐423‐5p in OS, we first examined its level in OS tissues from OS patients. In comparison with adjacent normal bone tissues, the miR‐423‐5p level in OS tissues was significantly diminished (Figure 1A). Through Kaplan‐Meier survival rate analysis, we observed that the survival rate was greatly lower in OS patients with low miR‐423‐5p than in OS patients with high miR‐423‐5p (Figure 1B). To further study the role, we employed four OS cell lines. We found that the miR‐423‐5p level was drastically diminished in OS cells compared to normal human osteoblastic cells (Figure 1C). As HOS and U2OS cells had the lowest level of miR‐423‐5p, we used those two cell lines for further investigations. Transfection of miR‐423‐5p mimics greatly increased miR‐423‐5p level in OS cells (Figure 1D). Moreover, with a colony formation assay, we saw smaller numbers of colonies formed in miR‐423‐5p mimics‐transfected OS cells than in cancer cells expressed with control mimics NC (Figure 1E), suggesting that miR‐423‐5p suppresses cancer cell proliferation. Using the transwell assay, we showed that overexpression of miR‐423‐5p significantly decreased the number of invasion cells and migration cells (Figure 1F,G). We then assessed the glycolysis process because it has been implicated in cancers. We found that miR‐423‐5p mimics dramatically diminished the level of glucose consumption and the production of lactate in OS cells (Figure 1H,I). In addition, we revealed that miR‐423‐5p mimics downregulated the levels of glycolysis‐related proteins, including HK2, PKM2, GLUT1, and LDHA (Figure 1J). Taken together, these results indicate that miR‐423‐5p is downregulated in OS and that enhancing miR‐423‐5p expression inhibits the glycolysis, as well as the proliferation, migration, and invasion of OS cells.
FIGURE 1.

miR‐423‐5p was decreased in and overexpression of miR‐423‐5p inhibited glycolysis and osteosarcoma (OS) cell proliferation, migration, and invasion. A, miR‐423‐5p level in human OS tissues from OS patients. B, Correlation between tumor miR‐423‐5p level and OS patient survival rate. C, miR‐423‐5p levels in various OS cells and normal human osteoblastic cells. D, miR‐423‐5p levels in mimics negative control (NC)‐transfected or miR‐423‐5p mimics‐transfected cells. E, Representative images of colonies formed in miR‐423‐5p mimics or mimics NC transfected cells. F, Representative images of migrated cells following transfection with miR‐423‐5p mimics or mimics NC. G, Representative images of invasive cells following transfection with miR‐423‐5p mimics or mimics NC. H, Relative glucose consumption rate in miR‐423‐5p mimics‐transfected or control mimics NC‐transfected cells. I, Relative lactate production in miR‐423‐5p mimics or mimics NC transfected cells. J, Protein levels of glycolysis‐related proteins (HK2, PKM2, GLUT1, and LDHA) in transfected cells. Error bars represented ± SD. *P < .05, **P < .01, ***P < .001
3.2. miR‐423‐5p directly targeted Wnt5a and Ror2 and negatively regulated their expression
It is widely acknowledged that miRNA exert their functions through binding to their target mRNA. 30 Using StarBase, we identified some potential complementary binding sites between miR‐423‐5p and Wnt5a/Ror2 (Figure 2A,B). We next directly examined their interactions. First, we found that Wnt5a and Ror2 levels were greatly elevated in OS tissues and OS cell lines wherein miR‐423‐5p was reduced in comparison to adjacent normal bone tissues and normal human osteoblastic cells (Figure 2C‐F). Second, overexpression of miR‐423‐5p remarkably decreased both the mRNA level and protein levels of Wnt5a and Ror2 (Figure 2G‐I). Third, using a dual luciferase assay, we found that miR‐423‐5p mimics greatly decreased the relative luciferase activity of WT‐Wnt5a and WT‐Ror2 but not MUT‐Wnt5a and MUT‐Ror2, wherein the predicted binding sites with miR‐423‐5p were mutated (Figure 2J,K). Therefore, we conclude that miR‐423‐5p directly binds to 3′‐UTR of Wnt5a and Ror2 mRNA and negatively regulates their expression.
FIGURE 2.

miR‐423‐5p directly targeted Wnt5a and Ror2 and negatively regulated their expression. A, B, Binding sites between miR‐423‐5p and Wnt5a/Ror2. C, Relative Wnt5a mRNA level in osteosarcoma (OS) tissues. D, Relative Ror2 mRNA level in OS tissues. E, F, Relative Wnt5a/Ror2 mRNA levels in OS cells. G, H, Relative Wnt5a/Ror2 mRNA levels in OS cells transfected with mimics negative control (NC) or miR‐423‐5p mimics. I, Wnt5a/Ror2 protein levels in miR‐423‐5p mimics or mimics NC‐transfected OS cells. J, K, Relative luciferase activity in OS cells following co–transfection of miR‐423‐5p mimics and WT‐Wnt5a/MUT‐Wnt5a or WT‐Ror2/MUT‐Ror2 3′‐UTR. Error bars represent ± SD. *P < .05, **P < .01, ***P < .001
3.3. Knockdown Wnt5a/Ror2 reversed the effects of miR‐423‐5p inhibitor on glycolysis, OS cell proliferation, migration, and invasion
We next tested whether miR‐423‐5p functioned through Wnt5a/Ror2 in OS. Transfection of sh‐Wnt5a and sh‐Ror2 greatly downregulated the mRNA and protein levels of Wnt5a and Ror2 in OS cells, respectively (Figure 3A,B). With the colony formation assay, we saw that miR‐423‐5p inhibitor robustly upregulated the number of colonies formed while knockdown of Wnt5a or Ror2 with shRNA reversed the effect of miR‐423‐5p inhibitor (Figure 3C). Similarly, using the transwell assay, we showed that miR‐423‐5p inhibitor increased the numbers of migrated and invasive cells, while knockdown of Wnt5a or Ror2 suppressed the increases (Figure 3D,E). miR‐423‐5p inhibitor also promoted the glucose consumption and lactate production of OS cells, but knockdown of Wnt5a or Ror2 inhibited the upregulations (Figure 3F,G). Glycolysis‐related proteins were significantly increased with miR‐423‐5p inhibitor but went back to baseline when Wnt5a or Ror2 was knocked down (Figure 3H). Collectively, these data show that miR‐423‐5p regulated glycolysis, OS cell proliferation, migration, and invasion through targeting Wnt5a/Ror2.
FIGURE 3.

Knockdown Wnt5a/Ror2 reversed the effects of miR‐423‐5p inhibitor on glycolysis, osteosarcoma (OS) cell proliferation, migration, and invasion. A, B, Relative Wnt5a/Ror2 mRNA levels in shWnt5a or shRor2 transfected OS cells. C, Representative images of colony formed in OS cells transfected with miR‐423‐5p inhibitor and shWnt5a or shRor2. D, Representative images of migrated cells after transfection of indicated plasmids. E, Representative images of invasive cells after transfection of indicated plasmids. F, Relative glucose consumption rate in transfected cells as indicated. G, Relative lactate generation in transfected cells as indicated. H, Protein levels of glycolysis‐related proteins (HK2, PKM2, GLUT1, LDHA) in cells transfected with indicated constructs. Error bars represent ± SD. *P < .05, **P < .01, ***P < .001
3.4. circPVT1 activated Wnt5a/Ror2 signaling through targeting miR‐423‐5p
Previous studies have implicated circPVT1 in OS. 26 Therefore, we investigated the role of circPVT1 in OS. We found that the circPVT1 level was elevated in OS tissues from OS patients (Figure 4A). In the Kaplan‐Meier survival rate analysis, we noticed that patients with high circPVT1 levels had lower survival rates than patients with low circPVT1 (Figure 4B). In OS cells, we also saw a significantly higher level of circPVT1 (Figure 4C). These results clearly show that circPVT1 is increased in OS. We then fully characterized the circular RNA features of circPVT1 (hsa_circ_0001821). circPVT1 is derived from exon 3 of the PVT1 gene, whose spliced mature sequence length is 410 bp (Figure 4D). Using divergent primers specific for circPVT1 followed by Sanger sequencing, we confirmed the back‐splice junction site of circSFMBT1 (Figure 4D). Furthermore, we applied RNase R, a processive 3′‐5′ exoribonuclease, to digest total extracted RNA and again observed that circPVT1 was more resistant to RNase R compared to PVT1, suggesting that circPVT1 was a circular RNA (Figure 4E). These results demonstrate the circular RNA characteristic of circPVT1. Interestingly, using StarBase we identified some potential complementary binding sites between circPVT1 and miR‐423‐5p (Figure 4F). We then directly examined their interactions. Using a dual luciferase activity assay, we found that miR‐423‐5p mimics greatly diminished the relative luciferase activity of WT‐circPVT1 but not MUT‐circPVT1, wherein the predicted binding sites with miR‐423‐5p were mutated (Figure 4G). Furthermore, immunoprecipitation with Ago2 antibody significantly pulled down circPVT1 and miR‐423‐5p compared to immunoprecipitation with IgG antibody (Figure 4H). These results demonstrate that circPVT1 directly binds to miR‐423‐5p. We further investigated how the miR‐423‐5p level affected circPVT1 expression. Transfection of cells with miR‐423‐5p mimics greatly diminished the circPVT1 level, while overexpression of miR‐423‐5p inhibitor in cells remarkably increased circPVT1 expression (Figure 4I). As miR‐423‐5p negatively regulates Wnt5a/Ror2 expression, we next examined how circPVT1 affected Wnt5a/Ror2 signaling. Knockdown circPVT1 through sh‐circPVT1 drastically increased the miR‐423‐5p level but decreased both mRNA and protein levels of Wnt5a and Ror2 (Figure 4J,K). In addition, we performed RNA FISH to examine the subcellular localizations of circPVT1 and miR‐423‐5p and found that miR‐423‐5p colocalized well with circPVT1 and that they mainly localized in the cytoplasm of OS cells (Figure 4L). These data indicate that circPVT1 regulates the Wnt5a/Ror2 signaling pathway, probably through directly targeting miR‐423‐5p.
FIGURE 4.

circPVT1 activated Wnt5a/Ror2 signaling by targeting miR‐423‐5p. A, Relative circPVT1 level in osteosarcoma (OS) tissues. B, Correlation between circPVT1 level and OS patient survival rate. C, Relative circPVT1 level in OS cells. D, Sanger sequencing to characterize circMETTL3. E, Characterization of the stability of circMETTL3 by RNase digestion. F, Binding sites between circPVT1 and miR‐423‐5p. G, Relative luciferase activity of cells co–transfected with miR‐423‐5p mimics and WT‐circPVT1 or MUT‐circPVT1. H, Relative circPVT1 and miR‐423‐5p levels pulled down with Ago2 antibody or IgG antibody. I, Relative circPVT1 levels in cells transfected with miR‐423‐5p mimics or miR‐423‐5p inhibitor. J, K, Relative Wnt5a/Ror2 mRNA and protein levels in sh‐circPVT1‐transfected OS cells. L, FISH analysis of subcellular localization of circPVT1 and miR‐423‐5p in OS cells. Scale bar: 50 μm. Error bars represented ± SD. *P < .05, **P < .01, ***P < .001
3.5. Knockdown of circPVT1 inhibited glycolysis, OS cell proliferation, migration, and invasion
We next examined the function of circPVT1 in OS. Using the colony formation assay, we found that knockdown of circPVT1 by sh‐circPVT1 significantly decreased the number of colonies formed (Figure 5A). With the transwell assay, we observed that the numbers of migrated and invasive cells were remarkably reduced in the sh‐circPVT1 group compared to the sh‐NC group (Figure 5B,C). In addition, we showed that knockdown of circPVT1 diminished the glucose consumption and lactate generation of OS cells (Figure 5D,E). Glycolysis‐related proteins were significantly downregulated in these cells, as well in cells transfected with sh‐circPVT1 (Figure 5F). Together, these results clearly show that inhibition of circPVT1 suppresses the glycolysis process and restrains OS cell proliferation, migration, and invasion.
FIGURE 5.
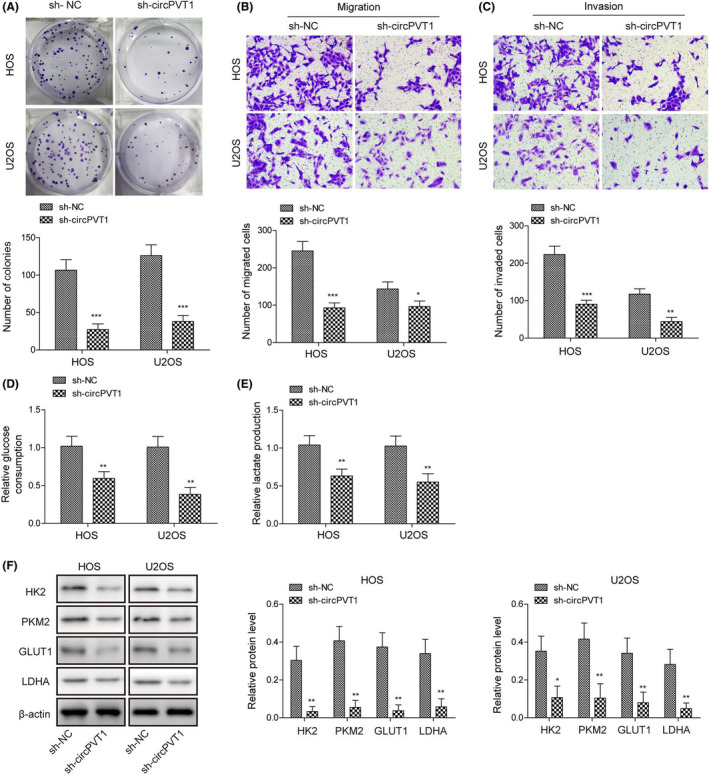
Knockdown of circPVT1 inhibited glycolysis, osteosarcoma (OS) cell proliferation, migration, and invasion. A, Representative images of colony formed in OS cells transfected with sh‐circPVT1. B, Representative images of stained migrated cells following transfection with sh‐circPVT1. C, Representative images of stained invasive cells following transfection with indicated constructs. D, Relative glucose consumption rate in transfected cells. E, Relative lactate generation in transfected cells as indicated. F, Protein levels of glycolysis‐related proteins (HK2, PKM2, GLUT1, and LDHA) in transfected cells as indicated. Error bars represented ± SD. *P < .05, **P < .01, ***P < .001
3.6. circPVT1 promoted osteosarcoma cell proliferation, migration, and invasion through targeting miR‐423‐5p and regulating Wnt5a/Ror2
We have shown that circPVT1 directly bound to miR‐423‐5p. We next investigated the function of this interaction in OS. Transfection of cells with circPVT1 greatly increased the level of circPVT1 (Figure 6A). Consistent with the aforementioned results, overexpression of circPVT1 increased the number of colonies formed and the numbers of migration and invasion OS cells (Figure 6B‐D). However, overexpression of miR‐423‐5p or knockdown of Wnt5a or Ror2 reversed the effects of circPVT1 overexpression (Figure 6B‐D). Similarly, overexpression of circPVT1 significantly enhanced the glucose consumption and the lactate generation of OS cells, as well as the expression levels of glycolysis‐related proteins, while miR‐423‐5p mimics and shWnt5a or shRor2 reversed the effects of circPVT1 overexpression (Figure 6E‐G). Therefore, we conclude that circPVT1 promotes the glycolysis process and OS cell proliferation, migration, and invasion by targeting miR‐423‐5p and regulating the Wnt5a/Ror2 pathway.
FIGURE 6.

circPVT1 regulated osteosarcoma (OS) cell proliferation, migration, and invasion by targeting miR‐423‐5p. A, Relative circPVT1 levels in OS cells transfected with circPVT1 overexpressing vector. B, Representative images of colony formed in OS cells transfected with circPVT1, miR‐423‐5p mimics, shWnt5a, or shRor2. C, Representative images of migrated cells following transfection with circPVT1, miR‐423‐5p mimics, shWnt5a, or shRor2. D, Representative images of invasive cells following transfection with circPVT1, miR‐423‐5p mimics, shWnt5a, or shRor2. E, Relative glucose consumption rate in transfected cells as indicated. F, Relative lactate production in transfected cells as indicated. G, Protein levels of glycolysis‐related proteins (HK2, PKM2, GLUT1, and LDHA) in transfected cells as indicated. Error bars represented ± SD. *P < .05, **P < .01, ***P < .001
3.7. Knockdown of circPVT1 or overexpression of miR‐423‐5p inhibited osteosarcoma tumor growth and lung metastasis in vivo
Finally, we evaluated the function of circPVT1 and miR‐423‐5p in OS in vivo using the nude mice xenograft model. OS cells were transfected with sh‐circPVT1 or sh‐NC, and miR‐423‐5p mimics or mimics NC before they were delivered into the nude mice. We monitored the tumor growth every 5 days. In control groups that were implanted with control‐transfected OS cells, tumor volume progressively increased with time (Figure 7A,B). However, in mice implanted with cells transfected with sh‐circPVT1 or miR‐423‐5p mimics, the tumor volume was much diminished (Figure 7A,B). The tumor weight was also remarkably diminished in sh‐circPVT1 and miR‐423‐5p mimics groups (Figure 7A,C). These data indicate that knockdown of circPVT1 or overexpression of miR‐423‐5p greatly restrains the growth of OS tumors in vivo. Mechanistically, we found that both circPVT1 knockdown and overexpression of miR‐423‐5p significantly reduced the levels of Wnt5a, Ror2, and Ki‐67, a nuclear protein associated with cell proliferation, compared to control groups (Figure 7D). The glycolysis‐related proteins (HK2, PKM2, GLUT1, and LDHA) were downregulated as well in mice implanted with sh‐circPVT1‐transfected OS cells or miR‐423‐5p‐transfected OS cells (Figure 7E). In addition, we found that the number of metastatic nodules in the lung from mice injected with sh‐circPVT1‐transfected cells or miR‐423‐5p mimics‐transfected cells was significantly smaller than from mice injected with shNC‐transfected or mimics‐NC‐transfected cells (Figure 7F‐H), indicating that knockdown of circPVT1 or overexpression of miR‐423‐5p represses the lung metastases in vivo. To sum up, these results show that inhibition of circPVT1 or overexpression of miR‐423‐5p suppresses OS tumor growth and lung metastases in animals.
FIGURE 7.

Knockdown of circPVT1 or overexpression of miR‐423‐5p inhibited osteosarcoma (OS) tumor growth and lung metastasis in vivo. A, Representative tumor images from each group of mice. B, Tumor volume in each group of mice. C, Tumor weight in each group of mice. D, Representative immunohistochemistry images to analyze levels of Ki‐67, Wnt5a, and Ror2 in tumor tissues. Scale bar: 50 μm. E, Protein levels of glycolysis‐related proteins (HK2, PKM2, GLUT1, and LDHA) in each group. F, Representative images of tumor nodes in the lung of each group of mice. G, Representative H&E staining images of the lung tissue from each group of mice. Scale bar: 100 or 50 μm. H, The number of tumor nudes in the lung of each group. Error bars represent ± SD. *P < .05, **P < .01
4. DISCUSSION
Osteosarcoma is a primary malignant bone cancer that is characterized by osteoid or immature bone production. 1 , 31 It is the most prevalent primary bone malignancy in people under 25 years and ranks as the top malignancy among adolescents. 9 Owing to its high metastasis, rapid progression, and limited treatments, the prognosis of OS is still not satisfactory. 6 To provide insights into the pathogenesis of OS, in the current study, we elucidated the function of circPVT1/miR‐423‐5p/Wnt5a/Ror2 in OS. We showed that the expression level of miR‐423‐5p was reduced in OS tissues and cells and that overexpression of miR‐423‐5p remarkably suppressed the glycolysis process and OS cell proliferation, migration, and invasion through targeting the Wnt5a/Ror2 signaling pathway. Moreover, we found that circPVT1 was increased in OS and it acted as a miR‐423‐5p sponge to modulate the glycolysis process, as well as the proliferation and invasion abilities of OS cells. Suppression of circPVT1 or overexpression of miR‐423‐5p significantly suppressed the OS tumor growth and lung metastasis in vivo. Taken together, our study demonstrates an essential role of circPVT1/miR‐423‐5p/Wnt5a/Ror2 in OS and sheds light on the molecular mechanisms of OS, providing avenues for future therapy development.
It is well accepted that miRNA have critical roles in many processes, including physiological and pathological processes. 30 , 32 , 33 , 34 Numerous miRNA have been implicated in OS, such as miR‐126 and miR‐142. 35 , 36 , 37 miR‐423‐5p has been implicated in various diseases, such as cardiovascular diseases, neurological diseases, and cancers. 29 , 38 , 39 , 40 As reported, miR‐423‐5p acts as a tumor suppressor in cancers. 27 , 28 , 29 The level of miR‐423‐5p is reduced in cancers like ovarian cancer, hepatocarcinoma, and somatotroph adenomas and is correlated with the prognosis of the diseases. 27 , 28 , 40 In addition, miR‐423‐5p can suppress tumor metastasis by targeting downstream genes involved in cell migration and invasion. In OS, lower expression of miR‐423‐5p has been reported as well. 29 Here, consistently, we saw a significantly reduced level of miR‐423‐5p in both OS tissues and cells. We also showed that rescue of the level by miR‐423‐5p mimics could greatly inhibit the glycolysis process and OS cell proliferation, migration, and invasion. Furthermore, we found that miR‐423‐5p exerts its function though targeting Wnt5a and Ror2. Our study, together with other research, clearly demonstrates that miR‐423‐5p is a tumor suppressor in cancers, including OS.
CircRNA are a relatively new class of non–coding RNA compared to miRNA, but emerging evidence suggests that they also play important roles in many processes. 24 Most circRNA act as ceRNA (competing endogenous RNA) or miRNA sponges to inhibit the functions of targeted miRNA. Dysregulated circRNA have been reported in diseases like cancers as well. 25 , 41 In OS, it has been shown that many circRNA contribute to the development and progression of the disease. 41 , 42 For example, circ_0008717 is elevated in OS and this elevation functions to boost the proliferation and migration abilities of OS cells through sponging miR‐203 43 ; circ_0002052 is downregulated in OS and functions to promote OS cell apoptosis through binding to miR‐1205. 44 CircRNA also regulates the glycolysis process. For instance, circENO1 has been shown to promote glycolysis and lung adenocarcinoma growth and metastasis. Again, circENO1 functions as a ceRNA to interact with miR‐22‐3p. 45 Previous studies indicate that circPVT1 is increased in OS tissues and cells and that its level is correlated with poor prognosis of OS patients. 26 However, the underlying mechanisms are not well understood. Here, we examined its downstream targets. We showed that circPVT1 directly bound to miR‐423‐5p and acted as a miR‐423‐5p sponge to activate Wnt5a/Ror2 signaling pathway. The circPVT1 level was inversely correlated with the patient survival rate and circPVT1 promoted glycolysis and OS cell proliferation, migration, and invasion through the miR‐423‐5p/Wnt5a/Ror2 axis. Moreover, using an in vivo animal model, we showed that knockdown of circPVT1 significantly suppressed OS tumor growth and lung metastasis. These results provide detailed mechanisms underlying the functional roles of circPVT1 in OS.
In tumors, cancer cells change their metabolism to maintain the enhanced cell proliferation and survival (eg, dramatically increasing the glucose uptake rate). 12 , 46 , 47 The glycolysis process is, indeed, very important for cancer development as this metabolic shift promotes tumor cell growth, proliferation, and migration. 13 The Wnt5a/Ror2 signaling pathway has been shown to be largely involved in the metabolism change of cancer cells and many studies show that this regulation promotes cancer cell proliferation and migration. 48 For example, Wnt5a increases glycolysis in melanoma cells by activating Akt signaling and LDH activity. 48 In addition, activated Wnt5a/Ror2 signaling enhances melanoma metastasis. 49 In OS, previous studies suggest that the Wnt5a/Ror2 signaling pathway is activated and associated with cancer cell migration and invasion. 23 Nevertheless, the underlying mechanisms or the upstream regulators of Wnt5a/Ror2 signaling in OS are unclear. In the current study, we showed that miR‐423‐5p directly targeted Wnt5a and Ror2 and that circPVT1 could also modulate Wnt5a/Ror2 signaling via miR‐423‐5p. Furthermore, both miR‐423‐5p and circPVT1 regulate glycolysis, OS cell proliferation, and migration through Wnt5a/Ror2 signaling. Our study sheds light on the molecular mechanisms of OS. It might be possible that there are some other upstream regulators of Wnt5a/Ror2 signaling and future investigations are necessary to test this.
In summary, with a combination of in vivo animal and in vitro cell models of OS, as well as human OS samples, we have provided strong evidence that circPVT1/miR‐423‐5p/Wnt5a/Ror2 plays a key role in the glycolysis process and OS development and progression. Inhibition of circPVT1 or rescue of miR‐423‐5p could inhibit OS tumor growth and metastasis and, thus, they could serve as molecular targets to develop effective therapy.
CONFLICT OF INTEREST
The authors declare no competing financial interests.
ACKNOWLEDGMENTS
We would like to give our sincere gratitude to the reviewers for their constructive comments.
Wan J, Liu Y, Long F, Tian J, Zhang C. circPVT1 promotes osteosarcoma glycolysis and metastasis by sponging miR‐423‐5p to activate Wnt5a/Ror2 signaling. Cancer Sci. 2021;112:1707–1722. 10.1111/cas.14787
REFERENCES
- 1. Lindsey BA, Markel JE, Kleinerman ES. Osteosarcoma overview. Rheumatol Ther. 2017;4:25‐43. [DOI] [PMC free article] [PubMed] [Google Scholar]
- 2. Kager L, Tamamyan G, Bielack S. Novel insights and therapeutic interventions for pediatric osteosarcoma. Future Oncol. 2017;13:357‐368. [DOI] [PubMed] [Google Scholar]
- 3. Duong LM, Richardson LC. Descriptive epidemiology of malignant primary osteosarcoma using population‐based registries, United States, 1999–2008. J Registry Manag. 2013;40:59‐64. [PMC free article] [PubMed] [Google Scholar]
- 4. Wan J, Zhang X, Liu T, Zhang X. Strategies and developments of immunotherapies in osteosarcoma. Oncol Lett. 2016;11:511‐520. [DOI] [PMC free article] [PubMed] [Google Scholar]
- 5. He H, Ni J, Huang J. Molecular mechanisms of chemoresistance in osteosarcoma (Review). Oncol Lett. 2014;7:1352‐1362. [DOI] [PMC free article] [PubMed] [Google Scholar]
- 6. Bishop MW, Janeway KA, Gorlick R. Future directions in the treatment of osteosarcoma. Curr Opin Pediatr. 2016;28:26‐33. [DOI] [PMC free article] [PubMed] [Google Scholar]
- 7. Kansara M, Teng MW, Smyth MJ, Thomas DM. Translational biology of osteosarcoma. Nat Rev Cancer. 2014;14:722‐735. [DOI] [PubMed] [Google Scholar]
- 8. He J‐P, Hao Y, Wang X‐L, et al. Review of the molecular pathogenesis of osteosarcoma. Asian Pac J Cancer Prev. 2014;15:5967‐5976. [DOI] [PubMed] [Google Scholar]
- 9. Luetke A, Meyers PA, Lewis I, Juergens H. Osteosarcoma treatment – where do we stand? A state of the art review. Cancer Treat Rev. 2014;40:523‐532. [DOI] [PubMed] [Google Scholar]
- 10. Akram M. Mini‐review on glycolysis and cancer. J Cancer Educ. 2013;28:454‐457. [DOI] [PubMed] [Google Scholar]
- 11. Dang CV. Links between metabolism and cancer. Genes Dev. 2012;26:877‐890. [DOI] [PMC free article] [PubMed] [Google Scholar]
- 12. Schwartz L, Supuran CT, Alfarouk KO. The Warburg effect and the hallmarks of cancer. Anticancer Agents Med Chem. 2017;17:164‐170. [DOI] [PubMed] [Google Scholar]
- 13. Liberti MV, Locasale JW. The Warburg effect: how does it benefit cancer cells? Trends Biochem Sci. 2016;41:211‐218. [DOI] [PMC free article] [PubMed] [Google Scholar]
- 14. Sottnik JL, Lori JC, Rose BJ, Thamm DH. Glycolysis inhibition by 2‐deoxy‐D‐glucose reverts the metastatic phenotype in vitro and in vivo. Clin Exp Metastasis. 2011;28:865‐875. [DOI] [PubMed] [Google Scholar]
- 15. Ljungberg JK, Kling JC, Tran TT, Blumenthal A. Functions of the WNT signaling network in shaping host responses to infection. Front Immunol. 2019;10:2521. [DOI] [PMC free article] [PubMed] [Google Scholar]
- 16. Pai SG, Carneiro BA, Mota JM, et al. Wnt/beta‐catenin pathway: modulating anticancer immune response. J Hematol Oncol. 2017;10:101. [DOI] [PMC free article] [PubMed] [Google Scholar]
- 17. Endo M, Nishita M, Fujii M, Minami Y. Insight into the role of Wnt5a‐induced signaling in normal and cancer cells. Int Rev Cell Mol Biol. 2015;314:117‐148. [DOI] [PubMed] [Google Scholar]
- 18. McDonald SL, Silver A. The opposing roles of Wnt‐5a in cancer. Br J Cancer. 2009;101:209‐214. [DOI] [PMC free article] [PubMed] [Google Scholar]
- 19. Oishi I, Suzuki H, Onishi N, et al. The receptor tyrosine kinase Ror2 is involved in non–canonical Wnt5a/JNK signalling pathway. Genes Cells. 2003;8:645‐654. [DOI] [PubMed] [Google Scholar]
- 20. Green JL, Kuntz SG, Sternberg PW. Ror receptor tyrosine kinases: orphans no more. Trends Cell Biol. 2008;18:536‐544. [DOI] [PMC free article] [PubMed] [Google Scholar]
- 21. Nishita M, Enomoto M, Yamagata K, Minami Y. Cell/tissue‐tropic functions of Wnt5a signaling in normal and cancer cells. Trends Cell Biol. 2010;20:346‐354. [DOI] [PubMed] [Google Scholar]
- 22. Anastas JN, Kulikauskas RM, Tamir T, et al. WNT5A enhances resistance of melanoma cells to targeted BRAF inhibitors. J Clin Invest. 2014;124:2877‐2890. [DOI] [PMC free article] [PubMed] [Google Scholar]
- 23. Enomoto M, Hayakawa S, Itsukushima S, et al. Autonomous regulation of osteosarcoma cell invasiveness by Wnt5a/Ror2 signaling. Oncogene. 2009;28:3197‐3208. [DOI] [PubMed] [Google Scholar]
- 24. Kristensen LS, Andersen MS, Stagsted LVW, Ebbesen KK, Hansen TB, Kjems J. The biogenesis, biology and characterization of circular RNAs. Nat Rev Genet. 2019;20:675‐691. [DOI] [PubMed] [Google Scholar]
- 25. Barrett SP, Salzman J. Circular RNAs: analysis, expression and potential functions. Development. 2016;143:1838‐1847. [DOI] [PMC free article] [PubMed] [Google Scholar]
- 26. Kun‐Peng Z, Xiao‐Long M, Chun‐Lin Z. Overexpressed circPVT1, a potential new circular RNA biomarker, contributes to doxorubicin and cisplatin resistance of osteosarcoma cells by regulating ABCB1. Int J Biol Sci. 2018;14:321‐330. [DOI] [PMC free article] [PubMed] [Google Scholar]
- 27. Tang X, Zeng X, Huang Y, et al. miR‐423‐5p serves as a diagnostic indicator and inhibits the proliferation and invasion of ovarian cancer. Exp Ther Med. 2018;15:4723‐4730. [DOI] [PMC free article] [PubMed] [Google Scholar]
- 28. Stiuso P, Potenza N, Lombardi A, et al. MicroRNA‐423‐5p promotes autophagy in cancer cells and is increased in serum from hepatocarcinoma patients treated with sorafenib. Mol Ther Nucleic Acids. 2015;4:e233. [DOI] [PubMed] [Google Scholar]
- 29. Wang X, Peng L, Gong X, Zhang X, Sun R, Du J. miR‐423‐5p inhibits osteosarcoma proliferation and invasion through directly targeting STMN1. Cell Physiol Biochem. 2018;50:2249‐2259. [DOI] [PubMed] [Google Scholar]
- 30. O’Brien J, Hayder H, Zayed Y, Peng C. Overview of microRNA biogenesis, mechanisms of actions, and circulation. Front Endocrinol. 2018;9:402. [DOI] [PMC free article] [PubMed] [Google Scholar]
- 31. Moore DD, Luu HH. Osteosarcoma. Cancer Treat Res. 2014;162:65‐92. [DOI] [PubMed] [Google Scholar]
- 32. Tan W, Liu B, Qu S, Liang G, Luo W, Gong C. MicroRNAs and cancer: key paradigms in molecular therapy. Oncol Lett. 2018;15:2735‐2742. [DOI] [PMC free article] [PubMed] [Google Scholar]
- 33. Li H, Zhang K, Liu L‐H, et al. MicroRNA screening identifies circulating microRNAs as potential biomarkers for osteosarcoma. Oncol Lett. 2015;10:1662‐1668. [DOI] [PMC free article] [PubMed] [Google Scholar]
- 34. Chu Y, Zhu H, Lv L, Zhou Y, Huo J. MiRNA s in oesophageal squamous cancer. Neth J Med. 2013;71:69‐75. [PubMed] [Google Scholar]
- 35. Jiang L, He A, He X, Tao C. MicroRNA‐126 enhances the sensitivity of osteosarcoma cells to cisplatin and methotrexate. Oncol Lett. 2015;10:3769‐3778. [DOI] [PMC free article] [PubMed] [Google Scholar]
- 36. Jiang L, He A, Zhang Q, Tao C. miR‐126 inhibits cell growth, invasion, and migration of osteosarcoma cells by downregulating ADAM‐9. Tumour Biol. 2014;35:12645‐12654. [DOI] [PubMed] [Google Scholar]
- 37. Zheng Z, Ding M, Ni J, Song D, Huang J, Wang J. MiR‐142 acts as a tumor suppressor in osteosarcoma cell lines by targeting Rac1. Oncol Rep. 2015;33:1291‐1299. [DOI] [PubMed] [Google Scholar]
- 38. Sun G, Ding X, Bi N, et al. MiR‐423‐5p in brain metastasis: potential role in diagnostics and molecular biology. Cell Death Dis. 2018;9:936. [DOI] [PMC free article] [PubMed] [Google Scholar]
- 39. Rizzacasa B, Morini E, Mango R, et al. MiR‐423 is differentially expressed in patients with stable and unstable coronary artery disease: a pilot study. PLoS One. 2019;14:e0216363. [DOI] [PMC free article] [PubMed] [Google Scholar]
- 40. Zhao S, Li J, Feng J, et al. Identification of serum miRNA‐423‐5p expression signature in somatotroph adenomas. Int J Endocrinol. 2019;2019:8516858. [DOI] [PMC free article] [PubMed] [Google Scholar]
- 41. Liu W, Zhang J, Zou C, et al. Microarray expression profile and functional analysis of circular RNAs in osteosarcoma. Cell Physiol Biochem. 2017;43:969‐985. [DOI] [PubMed] [Google Scholar]
- 42. Zhang Y, Li J, Wang Y, Jing J, Li J. The roles of circular RNAs in osteosarcoma. Med Sci Monit. 2019;25:6378‐6382. [DOI] [PMC free article] [PubMed] [Google Scholar]
- 43.[43] Zhou X, Natino D, Qin Z. Identification and functional characterization of circRNA‐0008717 as an oncogene in osteosarcoma through sponging miR‐203. Oncotarget. 2017; 9: 22288‐22300. [DOI] [PMC free article] [PubMed]
- 44. Wu Z, Shi W, Jiang C. Overexpressing circular RNA hsa_circ_0002052 impairs osteosarcoma progression via inhibiting Wnt/beta‐catenin pathway by regulating miR‐1205/APC2 axis. Biochem Biophys Res Commun. 2018;502:465‐471. [DOI] [PubMed] [Google Scholar]
- 45. Zhou J, Zhang S, Chen Z, He Z, Xu Y, Li Z. CircRNA‐ENO1 promoted glycolysis and tumor progression in lung adenocarcinoma through upregulating its host gene ENO1. Cell Death Dis. 2019;10:885. [DOI] [PMC free article] [PubMed] [Google Scholar]
- 46. DeBerardinis RJ, Chandel NS. Fundamentals of cancer metabolism. Sci Adv. 2016;2:e1600200. [DOI] [PMC free article] [PubMed] [Google Scholar]
- 47. Xiong W, Wang L, Yu F. Regulation of cellular iron metabolism and its implications in lung cancer progression. Med Oncol. 2014;31:28. [DOI] [PubMed] [Google Scholar]
- 48. Sherwood V, Chaurasiya SK, Ekstrom EJ, et al. WNT5A‐mediated beta‐catenin‐independent signalling is a novel regulator of cancer cell metabolism. Carcinogenesis. 2014;35:784‐794. [DOI] [PMC free article] [PubMed] [Google Scholar]
- 49. O’Connell MP, Fiori JL, Xu M, et al. The orphan tyrosine kinase receptor, ROR2, mediates Wnt5A signaling in metastatic melanoma. Oncogene. 2010;29:34‐44. [DOI] [PMC free article] [PubMed] [Google Scholar]