

Abstract
Signaling pathways that drive bladder cancer (BC) progression may be promising and specific targets for systemic therapy. Here, we investigated the clinical significance and targetability of NOTCH and mitogen‐activated protein kinase (MAPK) signaling for this aggressive malignancy. We assessed NOTCH1 and MAPK activity in 222 stage III and IV BC specimens of patients that had undergone radical cystectomy, and tested for clinical associations including cancer‐specific and overall survival. We examined therapeutic effects of NOTCH and MAPK repression in a murine xenograft model of human bladder cancer cells and evaluated tumor growth and tumor cell plasticity. In BC, NOTCH1 and MAPK signaling marked two distinct tumor cell subpopulations. The combination of high NOTCH1 and high MAPK activity indicated poor cancer‐specific and overall survival in univariate and multivariate analyses. Inhibition of NOTCH and MAPK in BC xenografts in vivo depleted targeted tumor cell subpopulations and revealed strong plasticity in signaling pathway activity. Combinatorial inhibition of NOTCH and MAPK signaling most strongly suppressed tumor growth. Our findings indicate that tumor cell subpopulations with high NOTCH and MAPK activity both contribute to tumor progression. Furthermore, we propose a new concept for BC therapy, which advocates specific and simultaneous targeting of these different tumor cell subpopulations through combined NOTCH and MAPK inhibition.
Keywords: biomarkers, cystectomy, mitogen‐activated protein kinase kinases receptors, notch, urinary bladder neoplasms
NOTCH1 and MAPK signaling together characterize aggressive bladder cancer. Targeting both pathways simultaneously seems to be an interesting and novel therapeutic approach in advanced bladder cancer.

Abbreviations
- AZD
selumetinib/AZD6244
- BC
bladder cancer
- CSS
cancer‐specific survival
- DAB
3,3′‐diaminobenzidine
- DBZ
dibenzazepine
- GSI
gamma‐secretase inhibitors
- MIBC
muscle‐invasive bladder cancer
- OS
overall survival
- RC
radical cystectomy
1. INTRODUCTION
Bladder cancer (BC) was newly diagnosed in more than 430 000 cases and caused about 165 000 deaths worldwide in 2012. 1 There have been only very few discoveries with impact on patient prognosis within the last decades until the approval of several programmed cell death‐(ligand) 1 PD(L)‐1 immune‐checkpoint inhibitors and recently FGFR inhibitors. 2 However, overall and complete response rates range around 40%‐50% and 5%‐10% for checkpoint inhibitors, and 37% and 3% for fibroblast growth factor receptors (FGFR) inhibitors, respectively. 2 , 3 Besides the need for novel druggable targets for advanced BC, there is an unmet demand for prognostic and predictive markers in the neoadjuvant and adjuvant settings, as most therapies bear severe side effects and significant costs.
The evolutionary highly conserved NOTCH pathway is an intercellular signaling mechanism that controls angiogenesis, cancer cell maintenance, and epithelial‐mesenchymal transition in the oncological setting. 4 , 5 After binding of ligands (DLL1, DLL3, DLL4, JAG1, and JAG2) to their receptors (NOTCH1‐4), gamma‐secretase cleaves the NOTCH intracellular domain (NICD) of the transmembrane receptor, which then can act as a transcription factor and therefore indicates active NOTCH signaling. In contrast to many other pathways NOTCH signaling can be either oncogenic or tumor suppressive. NOTCH activation has been associated with tumor progression in T‐ALL, melanoma, renal cell carcinoma, prostate carcinoma, and ovarian cancer. In contrast, NOTCH inactivation was described in small cell lung carcinoma and AML. For BC, the situation is rather inconclusive, as both tumor‐suppressive as well as oncogenic functions have been proposed for NOTCH signaling. 6 , 7 , 8 , 9 , 10 In addition to NOTCH, mitogen‐activated protein kinase (MAPK/ERK) signaling, which controls proliferative processes in different cancer entities, also seems to be relevant for BC progression. 11 , 12 , 13 , 14
Previous studies suggested an inverse link between NOTCH and MAPK signaling, as NOTCH activates dual‐specific phosphatases (DUSP), which then inactivate targets of MAPK by dephosphorylation. 8 , 15 However, other studies demonstrated a synergistic function of NOTCH and MAPK signaling. 16 Different tumor cell subpopulations within the same tumor may contribute to resistance mechanisms that cause treatment failures and progressive disease in patients with advanced BC undergoing systemic therapies. 17 As both pathways can be inhibited with targeted therapies currently under investigation for other tumors, we conducted a translational approach to investigate the prognostic and therapeutic role of NOTCH1 and MAPK signaling in BC.
2. MATERIALS AND METHODS
2.1. Clinical cohort
A total of 222 patients who underwent radical cystectomy (RC) between 2004 and 2014 at the Department of Urology, Ludwig‐Maximilians‐University Munich because of muscle‐invasive BC (MIBC) were included. To evaluate NOTCH and MAPK signaling regarding therapeutic implications in advanced BC, we only included Union Internationale Contre Le Cancer (UICC) stage III and IV bladder cancer cases. Additional exclusion criteria were inadequate availability of archived tumor tissue. Follow‐up was done primarily by written questionnaires sent in predefined intervals and secondarily by telephone interview. It was found that 2.7% (n = 6) of patients received neoadjuvant chemotherapy. Mean follow‐up was 2.95 years. All patients signed a written consent form for clinical follow‐up and the study was performed according to the ethical principles for medical research of the Declaration of Helsinki. The institutional ethics committee of the Medical Faculty of the Ludwig‐Maximilians‐University Munich (LMU) waived the need for consent for immunohistochemistry studies after irreversible anonymization of patient data. The clinical endpoint for overall survival (OS) was any death, which occurred in 147 of 222 patients. For cancer‐specific survival (CSS), BC‐associated death was defined as the clinical endpoint, which occurred in 108 of 222 cases.
2.2. Tissue‐microarrays and immunohistochemistry
Formalin‐fixed paraffin‐embedded BC specimens were retrieved from the archives of the Institute of Pathology. Specimens of the RC cohort underwent an expert histopathological review regarding tumor type, stage, and grade. One millimeter cores of the periphery and the tumor center were assembled in triplicate in a tissue‐microarray (TMA), and hematoxylin‐eosin stained sections were used as templates. Immunohistochemical protein detection on 5 µm deparaffinized sections of primary BCs, xenograft tumors, or embedded cell lines was performed with an ultraView Universal 3,3′‐diaminobenzidine (DAB) detection kit on a Ventana Benchmark XT autostainer (Ventana Medical Systems). For cleaved NOTCH1 (N1ICD), the primary rabbit anti‐human antibody Val1744 (Cell Signaling) was used at 1:100 dilution and for fos‐related antigen 1 (FRA1), primary mouse anti‐human antibody sc‐28310 (Santa Cruz) was used at 1:50 dilution. Staining for both N1ICD and FRA1 was assessed blinded from clinical outcome. Tumors were given scores of absent (0), weak (1), moderate (2) or strong (3) staining. Weak and absent staining then were defined as low expression, whereas moderate and strong staining were defined as high expression.
2.3. Cell culture and immunoblotting
HT‐1376 (RRID: CVCL_1292) and 5637 (RRID: CVCL_0126) BC cell lines were obtained from the ATCC, authenticated using short‐tandem repeat profiling, and expanded in Dulbecco's modified Eagle's medium (DMEM) supplemented with 10% fetal bovine serum (FBS), 100 U/mL penicillin, and 0.1 mg/mL streptomycin (Biochrom). Cells were tested for mycoplasma contamination before experiments. For in vitro analyses, HT‐1376 cells were fixed with formalin, carefully removed with cell scrapers, embedded in paraffin using HistoGel (Thermo Scientific), and subjected to immunohistochemical staining as described above. For immunoblotting, HT‐1376 cells were cultivated in six‐well plates and incubated with the gamma‐secretase inhibitor (GSI) dibenzazepine (DBZ, Axon Medchem) at 10 µmol/L, or the mitogen‐activated ERK kinase (MEK)‐inhibitor selumetinib (AZD 6244, Selleckchem) at 0.5 µmol/L in 0.1% DMSO, respectively. DMSO‐treated cells were used as control. Cells were harvested and proteins were isolated using Mammalian Protein Extraction Reagent (Thermo Scientific) supplemented with protease and phosphatase inhibitors (Roche). After sonication, centrifugation, and determining protein concentrations, proteins were denatured in Laemmli sample buffer (Bio‐Rad), separated by SDS‐PAGE, and transferred onto PVDF membranes (Merck Millipore). Membranes then were incubated with anti‐cleaved Notch1 (Cell Signaling, #4147S, 1:300), anti‐phosphorylated extracellular signal‐regulated kinase (New England Biolabs, #9101, 1:1500), and anti‐β‐Tubulin (New England Biolabs, #2146, 1:2000). Bands were visualized using HRP‐conjugated secondary rabbit (Sigma) antibody and chemiluminescent HRP Substrate (Millipore).
2.4. Tumor xenografts and in vivo treatments
For the xenograft assays, HT‐1376 and 5637 cells were suspended in 100 µL of a 1:1 mixture of growth factor depleted matrigel (Corning) and PBS and subsequently injected subcutaneously into 6‐8‐week‐old non‐obese diabetic/severe combined immunodeficiency mice (NOD.CB17‐Prkdcscid, The Jackson Laboratory) (RRID:IMSR_JAX:001303). For short time experiments, mice were treated with 0.35 mg of DBZ i.p. or 1.25 mg of AZD p.o. for 5 days once daily, whereas for long‐term experiments these doses were given every 3 days. Treatments were started when tumors had a minimum volume of 60 mm3. Vehicle was used as control and mice were sacrificed when tumors reached a maximum volume of 1200 mm3. In vivo xenograft assays were reviewed and approved by the Regierung von Oberbayern. After mice were sacrificed, tumors were immediately removed, formalin‐fixed, and paraffin‐embedded for further analysis.
2.5. Statistical analysis
To monitor the impact of DBZ and/or AZD treatments on tumor xenografts, the ratio of N1ICD‐ or FRA1‐positive tumor cells over all BC cells was evaluated in >100 tumor cells per xenograft. Statistical assessment was performed with a two‐tailed Student's t test and n ≥ 3. Survival analysis was done with the Kaplan‐Meier method using a log‐rank test with OS and CSS as primary endpoints. Multivariate analysis was performed with a Cox‐regression analysis including established prognostic parameters. Correlations of high N1ICD and FRA1 with important clinicopathological parameters were tested for significance with a Pearson's chi‐squared test. Xenograft size among different treatment groups was compared by independent Student's t test. Statistical tests were done with IBM SPSS 25.
3. RESULTS
3.1. High NOTCH1 and MAPK activity label different tumor cell subpopulations in bladder cancer
To obtain insights into NOTCH1 and MAPK signaling in bladder cancer, we examined the distribution of N1ICD and FRA1 in tissue specimens of 222 bladder cancers by immunostaining. The case characteristics are summarized in Table 1. Interestingly, both N1ICD and FRA1 showed different frequencies and distributions within these tumors. Nuclear staining for N1ICD, indicating high NOTCH1 activity, was diffusely distributed throughout the tumor in 82.6% of cases, while in a minority of 17.4% they were predominantly located at the tumor edge and thus in close proximity to the tumor‐stroma interface (Figure 1A‐C). On the contrary, nuclear staining for FRA1, indicating high MAPK activity, was scattered throughout the tumor in 63.6%, while it accumulated at the tumor edge in 36.4% of bladder cancers (Figure 1D‐F), and thus more frequently than did N1ICD. Of note, N1ICD was also positive in endothelial cells while FRA1 was not detectable in stromal cells. This suggested that high NOTCH1 and MAPK activity marked different subsets of bladder cancer cells.
TABLE 1.
Clinical data of NICD and FRA1 expression in bladder cancer patients undergoing radical cystectomy
| Characteristics | Total | N1ICD | FRA1 | N1ICD/FRA1 | ||||||
|---|---|---|---|---|---|---|---|---|---|---|
| Low | High | P | Low | High | P | Low | High | P | ||
| All patients | 222 | 136 | 86 | 167 | 55 | 193 (86.9) | 29 (13.1) | |||
| Age (y, median 68) | ||||||||||
| >68 | 112 | 71 (63.4) | 41 (36.6) | .511 | 88 (78.6) | 24 (21.4) | .244 | 99 (88.4) | 13 (11.6) | .516 |
| ≤68 | 110 | 65 (59.1) | 45 (40.9) | 79 (71.8) | 31 (28.2) | 94 (85.5) | 16 (14.5) | |||
| Gender | ||||||||||
| Male | 159 | 103 (64.8) | 56 (35.2) | .087 | 122 (76.7) | 37 (23.2) | .409 | 138 (86.8) | 21 (13.2) | .916 |
| Female | 63 | 33 (52.4) | 30 (47.6) | 45 (71.4) | 18 (28.6) | 55 (87.3) | 8 (12.7) | |||
| T‐stage (UICC) | ||||||||||
| T2 | 26 | 13 (50.0) | 13 (50.0) | .232 | 20 (76.9) | 6 (23.1) | .349 | 24 (92.3) | 2 (7.7) | .064 |
| T3 | 136 | 89 (65.4) | 47 (34.6) | 106 (77.9) | 30 (22.1) | 122 (89.7) | 14 (10.3) | |||
| T4 | 60 | 34 (56.7) | 26 (43.3) | 41 (68.3) | 19 (31.7) | 47 (78.3) | 13 (21.7) | |||
| Lymph node status | ||||||||||
| pN+ | 104 | 66 (63.5) | 38 (36.5) | .691 | 81 (77.9) | 23 (22.1) | .644 | 92 (88.5) | 12 (11.5) | .770 |
| pN0 | 101 | 61 (60.4) | 40 (39.69 | 73 (72.3) | 28 (27.7) | 86 (85.1) | 15 (14.9) | |||
| pNX | 17 | 9 (52.9) | 8 (47.1) | 13 (76.5) | 4 (23.5) | 15 (88.2) | 2 (11.8) | |||
| Metastatic spread | ||||||||||
| cM0 | 188 | 111 (59.0) | 77 (41.0) | .111 | 141 (75.0) | 47 (25.0) | .855 | 163 (86.7) | 25 (13.3) | .807 |
| cM1 | 34 | 25 (73.5) | 9 (26.5) | 26 (76.5) | 8 (23.5) | 30 (80.2) | 4 (11.8) | |||
| UICC | ||||||||||
| UICC 3 | 179 | 106 (59.2) | 73 (40.8) | .202 | 135 (75.4) | 44 (24.6) | .891 | 156 (87.2) | 23 (12.8) | .847 |
| UICC 4 | 43 | 30 (69.8) | 13 (30.2) | 32 (74.4) | 11 (25.6) | 37 (86.0) | 6 (14.0) | |||
| Vascular invasion (V) | ||||||||||
| V 0 | 185 | 112 (60.5) | 73 (39.5) | .622 | 138 (74.6) | 47 (25.4) | .626 | 160 (86.5) | 25 (13.5) | .656 |
| V 1 | 37 | 24 (64.9) | 13 (35.1) | 29 (78.4) | 8 (21.6) | 33 (89.2) | 4 (10.8) | |||
| Lymphovascular invasion (LVI) | ||||||||||
| LVI 0 | 137 | 79 (57.7) | 58 (42.3) | .163 | 96 (70.1) | 41 (29.9) | .024 | 116 (84.7) | 21 (15.3) | .204 |
| LVI 1 | 85 | 57 (67.1) | 28 (32.9) | 71 (83.5) | 14 (16.5) | 77 (90.6) | 8 (9.4) | |||
| Adjuvant therapy | ||||||||||
| Adj. chemotherapy | 70 | 45 (33.1) | 25 (29.1) | .530 | 55 (32.9) | 15 (27.3) | .443 | 64 (33.2) | 6 (20.7) | .178 |
| Adj. radiotherapy | 58 | 35 (25.7) | 23 (26.7) | .868 | 38 (22.8) | 20 (36.4) | .046 | 48 (24.9) | 10 (34.5) | .272 |
Row percent values are given in parentheses. P values indicate chi‐square test results.
FIGURE 1.
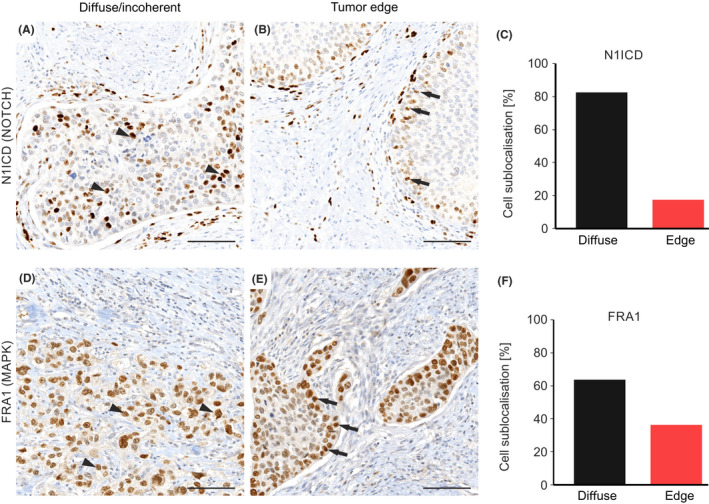
Intratumoral distribution of bladder cancer cells with high NOTCH1 and MAPK activity. Representative immunostaining for N1ICD (A, B) and FRA1 (D, E) in primary bladder cancer tissue. Arrowheads indicate tumor cells at the tumor center and arrows indicate tumor cells towards the tumor front. Scale bars, 100 µm. All cases were subcategorized regarding intratumoral distribution. Subgroups were diffuse/incoherent tumor cell distribution (A, D) or distribution at the tumor front (B, E). Relative distribution is shown for N1ICD‐ (C) and FRA1‐positive bladder cancer cells (F)
3.2. NOTCH1 and MAPK are linked to prognosis in patients with bladder cancer
Next, to determine the clinical relevance of tumor cell subpopulations with high NOTCH1 and MAPK activity in bladder cancer, we semi‐quantitatively scored N1ICD and FRA1 in our case collection, and defined tumors with low and high expression of these markers (Figure 2A). Of 222 bladder cancer cases, 86 (38.7%) showed high levels of N1ICD, whereas 55 (24.8%) had high expression of FRA1. Using Kaplan‐Meier analysis we found that low and high levels of N1ICD did not separate cases with significantly different OS or CSS (Figure 2B). Similarly, different FRA1 levels were not associated with differential survival in this collection (Figure 2B). Furthermore, neither N1ICD nor FRA1 significantly correlated with other clinical variables including age, sex, T‐stage, lymph node metastasis, metastatic spread, and vascular invasion, while there was only a weak association of FRA1 and absence of lymphovascular invasion (Table 1). However, when we tested N1ICD and FRA1 in combination, patients whose tumors expressed high levels of both markers had a significantly worse OS (P = .006) and CSS (P = .020) (Figure 2B), while there was no significant association of this combination with other clinical variables (Table 1).
FIGURE 2.

Prognostic relevance of MAPK and NOTCH1 in bladder cancer. Assessment of N1ICD and FRA1 in primary bladder cancers. Scale bars, 100 µm (A). Survival associations of N1ICD, FRA1, and their combination in 222 UICC stage III‐IV bladder cancers. Kaplan‐Meier plots for overall survival and cancer‐specific survival are shown (B). P values are log‐rank test results. Ratios on curves indicate the number of events over the number of patients per group
We then included these variables in Cox regression analysis and found that high N1ICD and FRA1 proved to function as an independent predictor for poor survival for both CSS (P = .013; Table 2) and OS (P = .002; Table S1). These data implicated that NOTCH1 and MAPK signaling are both important for bladder cancer progression and that combined evaluation of these pathways is an independent prognostic marker for poor prognosis in patients with advanced bladder cancer.
TABLE 2.
Multivariate analysis of cancer‐specific survival in bladder cancer patients
| Variables | Cancer‐specific survival | ||
|---|---|---|---|
| HR | 95% confidence interval | P | |
| Age (≥ vs < median) | 0.977 | 0.972‐1.022 | .882 |
| Gender (M vs F) | 0.999 | 0.672‐1.590 | .995 |
| T‐stage (UICC) | 1.291 | 0.872‐1.911 | .201 |
| Lymph node status | 1.316 | 0.851‐2.035 | .217 |
| Metastatic spread (cM1 vs cM0) | 1.492 | 0.892‐2.495 | .128 |
| Lymphovascular invasion (LVI) | 1.065 | 0.677‐1.675 | .786 |
| Surgical margin (R + vs R0) | 1.655 | 0.965‐2.840 | .670 |
| N1ICD/FRA1 (high vs low) | 2.059 | 1.165‐3.640 | .013 |
3.3. Therapeutic targeting of NOTCH and MAPK signaling causes a shift in signaling pathway activity
NOTCH and MAPK signaling can be repressed with the GSI DBZ and the MEK inhibitor selumetinib (AZD), respectively. We first validated the efficacy of these inhibitors in HT‐1376 cells on the protein level in vitro (Figure S1). To evaluate treatment effects in vivo, we then used xenograft tumors derived from the HT‐1376 urothelial cancer cell line (Figure 3A). Xenografts showed N1ICD accumulation in tumor cells that were diffusely distributed throughout the tumor while FRA1 expression was predominantly seen in tumor cells at the tumor edge (Figure 3B). Thus, they adequately modeled the intratumoral composition and distribution of NOTCH1 and MAPK activity in primary bladder cancer. We then treated mice bearing these xenografts with DBZ for 5 days and observed that N1ICD expression was mostly lost in these tumors (Figure 3C). Surprisingly however, the frequency of FRA1‐positive tumor cells slightly expanded upon DBZ treatment, demonstrating limited effects of NOTCH repression on tumor cell populations with high MAPK signaling activity. Next, to repress MAPK signaling, we treated HT‐1376 xenografts with AZD and found an almost complete loss of FRA1 expression after 5 days of treatment. However, N1ICD‐positive tumor cells resisted AZD treatment, and their frequency did not change (Figure 3B,C).
FIGURE 3.

Impact of MAPK and NOTCH repression on tumor cell distribution in bladder cancer xenografts. Schema and experimental schedule for xenografting, inhibitor treatment and tumor analysis (A). Immunohistochemistry for N1ICD and FRA1 in HT1376 derived xenografts (B). Scale bars, 50 µm. Vehicle‐treated tumors (Ctrl), and AZD or DBZ treated tumors at indicated time points were analyzed. Quantification of N1ICD‐ and FRA1‐positive tumor cells (C). Comparison to Ctrl. Error bars are mean ± SD. *P <.05 by t test, n ≥ 3 independent biological replicates
With these findings in mind, we then analyzed xenograft tumors of mice that had been treated with DBZ or AZD, and where treatment then had been discontinued for 10 days before analysis. Astonishingly, the original frequencies of bladder cancer cells with N1ICD and FRA1 expression were readily restored in these xenografts (Figure 3B,C). Collectively, these data suggested that the treatment effects of NOTCH or MAPK inhibition were mostly limited to targeted tumor cell subpopulations with respective pathway activity in BC. These cancers thus may evade targeted treatment against NOTCH or MAPK signaling by persistence of tumor cells sustained by nontargeted signaling pathways. Of note, in 2D culture HT‐1376 cells did not show the same degree of heterogeneity with absence of FRA1‐ and few N1ICD‐positive tumor cells only, indicating that our findings may apply to tumors grown in vivo only (Figure S2).
3.4. Combined targeting of NOTCH and MAPK may have additive treatment effects on bladder cancer in vivo
Next, we assessed tumor growth in bladder cancer xenografts on targeting NOTCH and MAPK activity. We applied DBZ, AZD, or a combination of both at treatment intervals of 3 days for several weeks. In addition to HT‐1376, we included xenografts of the bladder cancer cell line 5637. On treatment start, mean tumor volumes did not significantly differ between treatment groups for the HT‐1376 xenografts (control 192.8 mm3, AZD 231.2 mm3, DBZ 200.3 mm3, AZD/DBZ 181.1 mm3) and the 5637 xenografts (control 97.1 mm3, AZD 110.7 mm3, DBZ 114.3 mm3, AZD/DBZ 137.7 mm3). For HT‐1376 xenografts, n = 8 (control), n = 7 (AZD), n = 7 (DBZ), and n = 8 (AZD/DBZ), and for 5637 xenografts n = 14 (control), n = 10 (AZD), n = 9 (DBZ), and n = 5 (AZD/DBZ) mice were analyzed per group, respectively. We then evaluated tumor growth over time. DBZ (P < .001), AZD (P < .001), and their combination (P < .001) all significantly reduced tumor growth compared to controls at 12 days after initiation of treatment in HT‐1376 xenografts (Figure 4A). After 21 days, mice in the AZD (P = .034) and combination therapy (P = .013) subgroups both had significantly reduced tumor masses, while we did not observe this effect on DBZ treatment. Importantly, after 39 days, the combination therapy was significantly superior (P = .023) compared to the AZD treated subgroup. For 5637 xenografts, DBZ (P = .027), AZD (P = .006), and the combination (P = .017) significantly reduced tumor growth compared to controls at 12 days after initiation of treatment (Figure 4B). Interestingly, the combination therapy (P = .031), but not the AZD subgroup, performed significantly better when compared to the DBZ subgroup at this time point. Collectively, these data demonstrate that NOTCH and MAPK inhibition may be effective strategies for targeted treatment of bladder cancer while their combination may be a superior novel therapeutic strategy in some tumors.
FIGURE 4.

Therapeutic inhibition of NOTCH and MAPK in bladder cancer xenografts. Long‐term treatment effects of DBZ, AZD, their combination, or vehicle (Ctrl) on HT1376 (A) and 5637 (B) bladder cancer xenografts demonstrated as growth curves. Data are mean ± SEM in growth curves. n ≥ 5 independent biological replicates for each treatment group
4. DISCUSSION
Intratumoral heterogeneity likely contributes to treatment resistance in different tumor entities. 18 In addition, phenotypically different tumor cell subpopulations may complicate efforts to classify individual tumors and thereby impede selection of precise personalized treatment strategies. 19 , 20 In BC, a variable extent of intratumoral heterogeneity has been identified on the genomic and protein level. 21 , 22 , 23 , 24 For example, differential expression of FGFR3 between tumor cells at the tumor edge and the tumor center has been described, indicating that key oncogenic pathway components in BC may be subject to intratumoral heterogeneity. 25 In this context, we here identified substantial heterogeneity of NOTCH1‐ and MAPK‐signaling, two core signaling pathways in muscle‐invasive bladder cancer (MIBC). We found that high MAPK activity, which we assessed through FRA1 expression, was frequently restricted to a subset of tumor cells close to the invasive tumor edge. This is of interest because previous studies attributed tumor cell stemness, invasion, and epithelial‐mesenchymal transition (EMT) to high MAPK activity in BC. 12 , 13 , 26 , 27 , 28 , 29 Furthermore, MIBC may have significantly higher MAPK activity than non‐MIBC, and MAPK signaling was shown to control BC cell motility. 30 We therefore suggest that these malignant traits of tumor progression are predominantly inherent in the subpopulation of BC cells with high MAPK activity. On the other hand, when looking at NOTCH1 activity, we found that this marked a distinct tumor cell subpopulation, which was more diffusely spread throughout the tumor in most BC cases. While this suggested differential and distinct regulation of MAPK and NOTCH signaling in BC, it mirrored recent observations made in colorectal cancer. 31 We therefore suggest that both NOTCH and MAPK signaling might be important for tumor maintenance and progression, while acting in different tumor cell subpopulations. 8 , 16 , 31 , 32 Furthermore, a mechanistic link of both pathways has been reported, since NOTCH1 in BC was shown to activate dual‐specific phosphatases (DUSP), which inhibit downstream targets of MAPK signaling. 15 Differential and rather inverse activity of MAPK and NOTCH thus may be a more general principle that is not restricted to BC and may be an important aspect for pathway‐directed precision medicine.
When looking for clinical associations of high NOTCH1 and MAPK activity in BC, we found that the combined activity of both pathways was associated with worse oncological and overall patient survival, and served as an independent prognostic predictor. Interestingly, this was not the case for individually high signaling activity. Of note, high NOTCH1 and MAPK were not robustly associated with other clinicopathological parameters of tumor progression, which might be explained by stratification of our study cohort with exclusion of nonmuscle invasive bladder cancer and restriction to UICC stage III and IV. While a functional contribution of MAPK activity to tumor progression is known, 12 , 26 , 29 the role of NOTCH signaling remains less clear. Previous studies in BC showed inconsistent tumor suppressor or oncogenic functions of NOTCH1‐3. 6 , 7 , 8 , 9 , 32 , 33 , 34 Some of these studies that suggested a tumor suppressive role were underpowered and examined few cases of MIBC only, 32 or based their conclusions mainly on murine and cell culture models. 33 On the contrary, other studies proposed an oncogenic role of NOTCH signaling in BC. Protein expression of NOTCH1 and its downstream target Jagged1 was higher in MIBC compared to non‐MIBC, 9 and oncogenic potential of NOTCH2 and NOTCH3 by promoting tumor growth, stemness, and epithelial‐mesenchymal transition has been suggested. 6 , 35 Furthermore, high expression of the NOTCH ligand Jagged2 was correlated with recurrent BC and targeting of NOTCH signaling with a GSI‐inhibited cell proliferation and EMT, therefore supporting NOTCH signaling as a valuable therapeutic target in BC. 7 , 36 We hypothesize that such discrepancies of NOTCH function in BC may in part be explained by the heterogeneous distribution that we observed within the tumors. Due to their interdependence both pathways may need to be considered together and may then inform more precisely on tumor aggressiveness and the risk of tumor progression.
We then investigated plasticity of signaling under therapeutic pressure in a xenograft model in vivo and found that targeting of BC cells with high NOTCH or MAPK activity with a GSI or MEK inhibitor, respectively, caused loss of the respective tumor cell subpopulation. However, NOTCH repression did not affect BC cells with high MAPK activity and, correspondingly, the BC cell subpopulation with high NOTCH1 activity did not change under MAPK inhibition. When we discontinued inhibitor therapy, the initial distribution of BC cells with high NOTCH1 and MAPK activity was readily restored, underlining tumor cell plasticity for these signaling pathways in BC. Cellular plasticity was suggested to be a key phenomenon in different cancer entities promoting resistance to therapies. 37 Notably, subsequent recurrence and metastatic spread are still the most frequent reasons for lethal cancer disease. The clinical relevance of this problem is reflected by an increasing number of clinical BC trials investigating combinatorial regimens, like chemotherapy and PD(L)1‐checkpoint therapy 38 or anti‐vascular endothelial growth factor and chemotherapy. 39 Based on our data showing substantial tumor heterogeneity in BC, we propose that targeting oncogenic pathways with single inhibitors might affect certain subpopulations of BC cells only, leaving others with intrinsic therapy resistance that may still foster tumor growth. We therefore believe that consideration of tumor cell heterogeneity and plasticity may pave the way for more effective therapeutic concepts.
Based on these results, we compared the effects of long‐term NOTCH and MAPK inhibition as well as combinatorial targeting of both pathways on tumor growth in xenograft assays. We found that combinatorial inhibition of NOTCH and MAPK signaling was superior in reducing tumor growth for two different cell line derived BC xenograft models, compared to targeting either pathway alone. Interestingly, inhibition of NOTCH signaling only was inferior to sole MAPK targeting. Furthermore, in previous studies inhibition of NOTCH signaling with a GSI either reduced cancer cell invasion in a BC cell culture model, 36 while mice with a deficiency of a component of the gamma‐secretase complex were more susceptible to BC development. 33 Such apparently inconsistent findings further underpin that the role of NOTCH signaling in BC for tumor progression requires further investigation. Nevertheless, our data indicate that combined targeting of both pathways may be a promising strategy for patients with BC. Concerning therapeutic side effects, we here did not specifically assess toxicity or body weight under treatment, and our xenograft therapies were relatively short. However, both pan‐NOTCH inhibitors like GSI and the MEK inhibitor selumetinib demonstrated acceptable toxicity in clinical trials, 40 , 41 , 42 indicating that combined NOTCH and MAPK targeting may be a feasible and promising novel approach. 28 , 40 , 43 Because the activity of both pathways can be readily assessed on tumor tissues in situ, we speculate that high levels of N1ICD and FRA1 may then serve as a predictive biomarker for therapy response, which of course will require robust independent evaluation.
In our study, we demonstrated a prognostic and therapeutic relevance of NOTCH and MAPK signaling in BC. However, our study has certain limitations. One limitation is the nonspecificity of GSI for inhibition of NOTCH signaling, as this class of drugs may also interact with other signaling pathways. 44 Additionally, our in situ findings and our survival data were based on N1ICD, indicating NOTCH1 activity, while GSI acted as a pan‐NOTCH inhibitor in our xenograft assays. A limitation is the lack of mechanism for how NOTCH1 and MAPK pathways might be intermingled and how this could contribute to tumor cell plasticity and intratumoral heterogeneity. Thus, for further validation, genetic constructs that conditionally and specifically repress or remove N1ICD and FRA1 in BC tumors will be needed to prove the specificity of our observations in vivo. In addition, single‐cell RNA sequencing has been successfully employed to investigate tumor heterogeneity and might be an attractive approach for future studies in BC. 45 , 46 , 47 Another limitation is the xenograft model itself because it may be affected by inconsistent take‐rates and possibly limited genomic stability of xenografted tumors, as others suggest. 48 Also, the tumor microenvironment that is typical for primary bladder cancer in human patients is not fully present in this model system, so therapeutic effects in humans may be different. Therefore, clinical trials will have to evaluate the effectiveness and safety profiles of combined NOTCH and MAPK directed treatment strategies.
In conclusion, NOTCH1 and MAPK signaling together characterize aggressive BC cases. Targeting both pathways simultaneously seems to be an interesting and novel therapeutic approach in advanced BC. The investigation of different tumor cell subpopulations and respective pathways might pave the way to more effective synchronous treatment strategies for patients with BC.
DISCLOSURE
The authors declare no potential conflicts of interest.
Supporting information
Table S1: Multivariate analysis of overall survival in bladder cancer patients undergoing radical cystectomy.
Fig S1: Inhibition of NOTCH‐ and MAPK‐signaling in HT‐1376 cells.
Fig S2: FRA1 and N1ICD in 2D culture HT‐1376.
ACKNOWLEDGEMENTS
This study was supported by a grant (111669) from the Deutsche Krebshilfe (to DH) and a fellowship (SCHU 3406/1‐1) from the Deutsche Forschungsgemeinschaft (to GBS).
Schulz GB, Elezkurtaj S, Börding T, et al. Therapeutic and prognostic implications of NOTCH and MAPK signaling in bladder cancer. Cancer Sci. 2021;112:1987–1996. 10.1111/cas.14878
Contributor Information
Gerald B. Schulz, Email: gerald.schulz@med.uni-muenchen.de.
David Horst, Email: david.horst@charite.de.
REFERENCES
- 1. Antoni S, Ferlay J, Soerjomataram I, Znaor A, Jemal A, Bray F. Bladder cancer incidence and mortality: a global overview and recent trends. Eur Urol. 2017;71(1):96‐108. [DOI] [PubMed] [Google Scholar]
- 2. Loriot Y, Necchi A, Park SH, et al. Erdafitinib in locally advanced or metastatic urothelial carcinoma. N Engl J Med. 2019;381(4):338‐348. [DOI] [PubMed] [Google Scholar]
- 3. Siefker‐Radtke A, Curti B. Immunotherapy in metastatic urothelial carcinoma: focus on immune checkpoint inhibition. Nat Rev Urol. 2018;15(2):112‐124. [DOI] [PubMed] [Google Scholar]
- 4. Ranganathan P, Weaver KL, Capobianco AJ. Notch signalling in solid tumours: a little bit of everything but not all the time. Nat Rev Cancer. 2011;11(5):338‐351. [DOI] [PubMed] [Google Scholar]
- 5. Wieland E, Rodriguez‐Vita J, Liebler SS, et al. Endothelial Notch1 activity facilitates metastasis. Cancer Cell. 2017;31(3):355‐367. [DOI] [PubMed] [Google Scholar]
- 6. Hayashi T, Gust KM, Wyatt AW, et al. Not all NOTCH is created equal: the oncogenic role of NOTCH2 in bladder cancer and its implications for targeted therapy. Clin Cancer Res. 2016;22(12):2981‐2992. [DOI] [PubMed] [Google Scholar]
- 7. Li W, Liu M, Feng Y, et al. High expression of Notch ligand Jagged2 is associated with the metastasis and recurrence in urothelial carcinoma of bladder. Int J Clin Exp Pathol. 2013;6(11):2430‐2440. [PMC free article] [PubMed] [Google Scholar]
- 8. Rampias T, Vgenopoulou P, Avgeris M, et al. A new tumor suppressor role for the Notch pathway in bladder cancer. Nat Med. 2014;20(10):1199‐1205. [DOI] [PubMed] [Google Scholar]
- 9. Shi T‐P, Xu H, Wei J‐F, et al. Association of low expression of notch‐1 and jagged‐1 in human papillary bladder cancer and shorter survival. J Urol. 2008;180(1):361‐366. [DOI] [PubMed] [Google Scholar]
- 10. Goriki A, Seiler R, Wyatt AW, et al. Unravelling disparate roles of NOTCH in bladder cancer. Nat Rev Urol. 2018;15(6):345‐357. [DOI] [PubMed] [Google Scholar]
- 11. Cancer Genome Atlas Research N . Comprehensive molecular characterization of urothelial bladder carcinoma. Nature. 2014;507(7492):315‐322. [DOI] [PMC free article] [PubMed] [Google Scholar]
- 12. Hepburn AC, Veeratterapillay R, Williamson SC, et al. Side population in human non‐muscle invasive bladder cancer enriches for cancer stem cells that are maintained by MAPK signalling. PLoS One. 2012;7(11):e50690. [DOI] [PMC free article] [PubMed] [Google Scholar]
- 13. Lv D, Wu H, Xing R, et al. HnRNP‐L mediates bladder cancer progression by inhibiting apoptotic signaling and enhancing MAPK signaling pathways. Oncotarget. 2017;8(8):13586‐13599. [DOI] [PMC free article] [PubMed] [Google Scholar]
- 14. Vandekerkhove G, Todenhöfer T, Annala M, et al. Circulating tumor DNA reveals clinically actionable somatic genome of metastatic bladder cancer. Clin Cancer Res. 2017;23(21):6487‐6497. [DOI] [PubMed] [Google Scholar]
- 15. Greife A, Hoffmann MJ, Schulz WA. Consequences of disrupted notch signaling in bladder cancer. Eur Urol. 2015;68(1):3‐4. [DOI] [PubMed] [Google Scholar]
- 16. Mittal S, Subramanyam D, Dey D, Kumar RV, Rangarajan A. Cooperation of Notch and Ras/MAPK signaling pathways in human breast carcinogenesis. Mol Cancer. 2009;8:128. [DOI] [PMC free article] [PubMed] [Google Scholar]
- 17. Dagogo‐Jack I, Shaw AT. Tumour heterogeneity and resistance to cancer therapies. Nat Rev Clin Oncol. 2018;15(2):81‐94. [DOI] [PubMed] [Google Scholar]
- 18. Andor N, Graham TA, Jansen M, et al. Pan‐cancer analysis of the extent and consequences of intratumor heterogeneity. Nat Med. 2016;22(1):105‐113. [DOI] [PMC free article] [PubMed] [Google Scholar]
- 19. Dunne PD, McArt DG, Bradley CA, et al. Challenging the cancer molecular stratification dogma: intratumoral heterogeneity undermines consensus molecular subtypes and potential diagnostic value in colorectal cancer. Clin Cancer Res. 2016;22(16):4095‐4104. [DOI] [PubMed] [Google Scholar]
- 20. Gerlinger M, Rowan AJ, Horswell S, et al. Intratumor heterogeneity and branched evolution revealed by multiregion sequencing. N Engl J Med. 2012;366(10):883‐892. [DOI] [PMC free article] [PubMed] [Google Scholar]
- 21. Jakobsson L, Chebil G, Marzouka NA, Liedberg F, Sjodahl G. Low frequency of intratumor heterogeneity in bladder cancer tissue microarrays. Bladder Cancer. 2018;4(3):327‐337. [DOI] [PMC free article] [PubMed] [Google Scholar]
- 22. Thomsen MBH, Nordentoft I, Lamy P, et al. Spatial and temporal clonal evolution during development of metastatic urothelial carcinoma. Mol Oncol. 2016;10(9):1450‐1460. [DOI] [PMC free article] [PubMed] [Google Scholar]
- 23. Thomsen MBH, Nordentoft I, Lamy P, et al. Comprehensive multiregional analysis of molecular heterogeneity in bladder cancer. Sci Rep. 2017;7(1):11702. [DOI] [PMC free article] [PubMed] [Google Scholar]
- 24. Warrick JI, Sjödahl G, Kaag M, et al. Intratumoral heterogeneity of bladder cancer by molecular subtypes and histologic variants. Eur Urol. 2019;75(1):18‐22. [DOI] [PubMed] [Google Scholar]
- 25. Pouessel D, Neuzillet Y, Mertens LS, et al. Tumor heterogeneity of fibroblast growth factor receptor 3 (FGFR3) mutations in invasive bladder cancer: implications for perioperative anti‐FGFR3 treatment. Ann Oncol. 2016;27(7):1311‐1316. [DOI] [PMC free article] [PubMed] [Google Scholar]
- 26. Kumar B, Koul S, Petersen J, et al. p38 mitogen‐activated protein kinase‐driven MAPKAPK2 regulates invasion of bladder cancer by modulation of MMP‐2 and MMP‐9 activity. Cancer Res. 2010;70(2):832‐841. [DOI] [PubMed] [Google Scholar]
- 27. Kumar B, Sinclair J, Khandrika L, Koul S, Wilson S, Koul HK. Differential effects of MAPKs signaling on the growth of invasive bladder cancer cells. Int J Oncol. 2009;34(6):1557‐1564. [DOI] [PubMed] [Google Scholar]
- 28. Tomlinson DC, Baxter EW, Loadman PM, Hull MA, Knowles MA. FGFR1‐induced epithelial to mesenchymal transition through MAPK/PLCgamma/COX‐2‐mediated mechanisms. PLoS One. 2012;7(6):e38972. [DOI] [PMC free article] [PubMed] [Google Scholar]
- 29. Zhou Y, Chu XI, Deng F, et al. The adenosine A2b receptor promotes tumor progression of bladder urothelial carcinoma by enhancing MAPK signaling pathway. Oncotarget. 2017;8(30):48755‐48768. [DOI] [PMC free article] [PubMed] [Google Scholar]
- 30. Sayan AE, Stanford R, Vickery R, et al. Fra‐1 controls motility of bladder cancer cells via transcriptional upregulation of the receptor tyrosine kinase AXL. Oncogene. 2012;31(12):1493‐1503. [DOI] [PubMed] [Google Scholar]
- 31. Schmidt EM, Lamprecht S, Blaj C, et al. Targeting tumor cell plasticity by combined inhibition of NOTCH and MAPK signaling in colon cancer. J Exp Med. 2018;215(6):1693‐1708. [DOI] [PMC free article] [PubMed] [Google Scholar]
- 32. Greife A, Jankowiak S, Steinbring J, et al. Canonical Notch signalling is inactive in urothelial carcinoma. BMC Cancer. 2014;14:628. [DOI] [PMC free article] [PubMed] [Google Scholar]
- 33. Maraver A, Fernandez‐Marcos PJ, Cash TP, et al. NOTCH pathway inactivation promotes bladder cancer progression. J Clin Investig. 2015;125(2):824‐830. [DOI] [PMC free article] [PubMed] [Google Scholar]
- 34. Wen WU, Li J, Wang L, et al. Inhibition of NEDD4 inhibits cell growth and invasion and induces cell apoptosis in bladder cancer cells. Cell Cycle. 2017;16(16):1509‐1514. [DOI] [PMC free article] [PubMed] [Google Scholar]
- 35. Zhang H, Liu L, Liu C, et al. Notch3 overexpression enhances progression and chemoresistance of urothelial carcinoma. Oncotarget. 2017;8(21):34362‐34373. [DOI] [PMC free article] [PubMed] [Google Scholar]
- 36. Wang Y, Wang G, Zhang X, et al. gamma‐Secretase inhibitor inhibits bladder cancer cell drug resistance and invasion by reducing epithelial‐mesenchymal transition. Mol Med Rep. 2015;12(2):2821‐2827. [DOI] [PubMed] [Google Scholar]
- 37. Yuan S, Norgard RJ, Stanger BZ. Cellular plasticity in cancer. Cancer Discov. 2019;9(7):837‐851. [DOI] [PMC free article] [PubMed] [Google Scholar]
- 38. Sonpavde G, Necchi A, Gupta S, et al. ENERGIZE: a Phase III study of neoadjuvant chemotherapy alone or with nivolumab with/without linrodostat mesylate for muscle‐invasive bladder cancer. Future Oncol. 2020;16(2):4359‐4368. [DOI] [PubMed] [Google Scholar]
- 39. Petrylak DP, de Wit R, Chi KN, et al. Ramucirumab plus docetaxel versus placebo plus docetaxel in patients with locally advanced or metastatic urothelial carcinoma after platinum‐based therapy (RANGE): a randomised, double‐blind, phase 3 trial. Lancet. 2017;390(10109):2266‐2277. [DOI] [PubMed] [Google Scholar]
- 40. Tolcher AW, Messersmith WA, Mikulski SM, et al. Phase I study of RO4929097, a gamma secretase inhibitor of Notch signaling, in patients with refractory metastatic or locally advanced solid tumors. J Clin Oncol. 2012;30(19):2348‐2353. [DOI] [PMC free article] [PubMed] [Google Scholar]
- 41. Gross AM, Wolters PL, Dombi E, et al. Selumetinib in children with inoperable plexiform neurofibromas. N Engl J Med. 2020;382(15):1430‐1442. [DOI] [PMC free article] [PubMed] [Google Scholar]
- 42. Carvajal RD, Piperno‐Neumann S, Kapiteijn E, et al. Selumetinib in combination with dacarbazine in patients with metastatic uveal melanoma: a phase III, multicenter, randomized trial (SUMIT). J Clin Oncol. 2018;36(12):1232‐1239. [DOI] [PubMed] [Google Scholar]
- 43. Tai WM, Yong WP, Lim C, et al. A phase Ib study of selumetinib (AZD6244, ARRY‐142886) in combination with sorafenib in advanced hepatocellular carcinoma (HCC). Ann Oncol. 2016;27(12):2210‐2215. [DOI] [PubMed] [Google Scholar]
- 44. Takebe N, Miele L, Harris PJ, et al. Targeting Notch, Hedgehog, and Wnt pathways in cancer stem cells: clinical update. Nat Rev Clin Oncol. 2015;12(8):445‐464. [DOI] [PMC free article] [PubMed] [Google Scholar]
- 45. Ledergor G, Weiner A, Zada M, et al. Single cell dissection of plasma cell heterogeneity in symptomatic and asymptomatic myeloma. Nat Med. 2018;24(12):1867‐1876. [DOI] [PubMed] [Google Scholar]
- 46. Li H, Courtois ET, Sengupta D, et al. Reference component analysis of single‐cell transcriptomes elucidates cellular heterogeneity in human colorectal tumors. Nat Genet. 2017;49(5):708‐718. [DOI] [PubMed] [Google Scholar]
- 47. Patel AP, Tirosh I, Trombetta JJ, et al. Single‐cell RNA‐seq highlights intratumoral heterogeneity in primary glioblastoma. Science. 2014;344(6190):1396‐1401. [DOI] [PMC free article] [PubMed] [Google Scholar]
- 48. Shi J, Li Y, Jia R, Fan X. The fidelity of cancer cells in PDX models: Characteristics, mechanism and clinical significance. Int J Cancer. 2020;146(8):2078‐2088. [DOI] [PubMed] [Google Scholar]
Associated Data
This section collects any data citations, data availability statements, or supplementary materials included in this article.
Supplementary Materials
Table S1: Multivariate analysis of overall survival in bladder cancer patients undergoing radical cystectomy.
Fig S1: Inhibition of NOTCH‐ and MAPK‐signaling in HT‐1376 cells.
Fig S2: FRA1 and N1ICD in 2D culture HT‐1376.