Abstract
Increasing bodies of evidence support the involvement of tumor‐intrinsic action in PD‐L1‐mediated cancer progression. However, the mechanisms underlying the tumor‐intrinsic function of PD‐L1 are less well understood. In the present study, we found a positive correlation between PD‐L1 expression and MET phosphorylation in lung cancer and melanoma cell lines. PD‐L1 inhibition led to a decrease in MET phosphorylation, while PD‐L1 induction by IFN‐γ resulted in a PD‐L1‐dependent increase of MET phosphorylation both in vitro and in vivo. The results indicated that MET phosphorylation can be positively regulated by PD‐L1. Furthermore, we identified PTP1B as a mediator contributing to the regulation of MET phosphorylation by PD‐L1. In agreement with the induction of MET phosphorylation by PD‐L1, inhibition of PD‐L1 caused reduced phosphorylation of ERKs, a known downstream kinase of MET, and inhibited cell proliferation. Collectively, the present study demonstrated for the first time that the MET pathway, as a downstream of PD‐L1, contributed to its tumor‐intrinsic effect, and provided a novel mechanistic explanation for the tumor‐intrinsic function of PD‐L1 and a rationale for the combination of immunotherapy and MET‐targeted therapy in cancer treatment.
Keywords: lung cancer, melanoma, MET phosphorylation, PD‐L1, tumor‐intrinsic signal
PD‐L1 expression is positively correlated with the levels of MET phosphorylation. MET phosphorylation can be positively regulated by PD‐L1 both in vitro and in vivo. PTP1B is a mediator of the regulation of MET phosphorylation by PD‐L1.
Abbreviations
- HPD
hyper‐progressive disease
- IFN‐γ
interferon‐gamma
- NKT
natural killer T cell
- PD‐1
programmed cell death 1
- PD‐L1
programmed death‐ligand 1
- PTP
protein tyrosine phosphatase
1. INTRODUCTION
Programmed cell death 1 (PD‐1, also called CD279), a member of the immunoglobulin gene superfamily, is a key component of the classical type of programmed cell death. 1 As an immune modulatory receptor, PD‐1 is expressed on activated T cells, B cells, monocytes, DCs, and natural killer T cells (NKT). 2 Programmed death‐ligand 1 (PD‐L1, also called CD274 or B7‐H1), a ligand of PD‐1, is a member of the B7 family and can be expressed on different types of cell including myeloid, epithelial, endothelial, and tumor cells. 3 , 4 The interaction between PD‐1 and its ligand PD‐L1 has been found to contribute to the negative regulation of T cell‐activating signals, and in turn promote the immune escape of cancer cells and inhibit the anti‐cancer reactivity of T cells. 5 Therefore, it is logical that the PD‐1/PD‐L1 pathway has been explored as a target for cancer immunotherapy. Indeed, suppression of the PD‐1/PD‐L1 pathway‐based T cell activation strategy has demonstrated its highly promising efficacy on several types of cancer, especially melanoma, non‐small‐cell lung cancer, renal cell carcinoma, and bladder cancer. 6 , 7 , 8
Although, extensively, studies have focused on the role of PD‐L1 in regulation of T cell activity, increasing attention is being paid to investigations of immune‐independent functions of PD‐L1. 9 , 10 , 11 For example, Clark et al 11 demonstrated the tumor‐intrinsic functions of PD‐L1 in regulating tumor cell proliferation, apoptosis, and autophagy. In line with this study, PD‐L1 was also found to be involved in tumor chemoresistance and glucose metabolism dysregulation by modulation of cell‐intrinsic signals in tumor cells. 12 , 13 , 14 , 15
The contribution of PD‐L1 tumor‐intrinsic function to cancer development is becoming recognized, but the mechanisms involved in the PD‐L1‐mediated tumor‐intrinsic effect on cancer are less well understood. In the present study, we aimed to investigate downstream targets of PD‐L1 that trigger tumor‐intrinsic signals. The results demonstrated that PD‐L1‐PTP1B‐MET as a novel signal transduction pathway contributed to the tumor‐intrinsic function of PD‐L1.
2. MATERIALS AND METHODS
2.1. Chemicals and reagents
PTP1B inhibitor and MET inhibitor were purchased from Sigma‐Aldrich (St. Louis, MO, USA). Recombinant human hepatocyte growth factor protein, recombinant mouse interferon‐gamma, recombinant human PD‐1, and recombinant human interferon‐gamma (IFN‐γ) were purchased from MedChemExpress. Antibodies specific for PD‐L1 (human), p‐MET, MET, and ERK1/2 were purchased from Cell Signaling Technology. Antibodies specific for PD‐L1 (mouse), PTP1B, and ubiquitin were purchased from Abcam. Antibody for β‐actin was purchased from MBL International Corporation. Secondary antibody specific for rabbit was purchased from MBL International Corporation.
2.2. Cell culture and treatments
Lung cancer cell lines including HCC827, A549, H2228, PC9, LLC, human normal lung fibroblast cell MRC‐5, melanoma cell lines A375, A431, SK‐MEL‐5 and SK‐MEL‐28, prostate cancer cell DU145, and human epidermal keratinocyte HaCat were used in this study. A549, HCC827, H2228, LLC, A375, A431, Du145, HaCat, and MRC‐5 originated from the American Type Culture Collection (ATCC, Manassas, VA, USA). PC9, SK‐MEL‐5, and SK‐MEL‐28 cell lines were kindly provided by Dr. Feng Zhu (Huazhong University of Science and Technology, Wuhan, China). HCC827, A549, H2228, PC9, and DU145 cells were grown in RPMI 1640 medium supplemented with 10% fetal bovine serum without antibiotics. LLC, HaCat, A375, and A431 were grown in DMEM supplemented with 10% fetal bovine serum without antibiotics. MRC‐5, SK‐MEL‐5, and SK‐MEL‐28 were grown in Minimum Essential Medium (MEM) supplemented with 10% fetal bovine serum without antibiotics.
2.3. Western blotting
Cells or tumor tissues were lysed with ice‐cold RIPA buffer with protease inhibitor and phosphatase inhibitor (Sigma‐Aldrich). The protein concentration was determined with the BCA Protein Quantitation Analysis Kit (Solarbio Life Science). Equal amounts of proteins of the samples were loaded onto gels. After electrophoretic separation, proteins were transferred to a nitrocellulose membrane (0.2 μm). After incubation in blocking buffer (5% non‐fat milk in PBS), the membrane was subsequently probed with specific antibodies to perform immunoblot analyses. The immunoreacted bands were visualized by enhanced chemiluminescence (ECL; Fisher/Pierce) and recorded on X‐ray film. Bands were quantified using ImageJ software (v.1.46; NIH, Bethesda, MD) and normalized to actin.
2.4. Cell cycle analysis
Cell cycle distribution was analyzed by measuring the amount of propidium iodide (PI)‐labeled DNA in ethanol‐fixed cells. The fixed cells were washed with PBS and stored at −20°C until analysis by flow cytometry. On the day of analysis, the cells were washed with cold PBS, suspended in 100 μL of PBS plus 10 μL of RNase A (250 μg/mL) and incubated for 30 min. A total of 110 μL of PI stain (100 μg/mL) was added to each tube and tubes were incubated at 4°C for at least 30 min prior to analysis.
2.5. RNA interference
PD‐L1 siRNA and non‐targeting siRNA were obtained from Thermo Fisher Scientific. To knockdown PD‐L1, 5, 10, or 20 nmol/L of PD‐L1 siRNA was transfected into the cells using the INTERFERin siRNA transfection reagent (Polyplus‐Transfection, Illkirch, France) in accordance with the manufacturer's instructions. At 48 h post‐transfection, the cells were used for subsequent experiments.
2.6. Analysis of MET phosphorylation by flow cytometry
Next, 4% formaldehyde‐fixed cells were permeabilized with methanol. The dissociated cells were labeled with primary antibody and fluorochrome‐conjugated secondary antibody and were analyzed by flow cytometry (BD FACSCalibur). The data were analyzed using Summit Software v5.0 (Beckman Coulter). The “% of mean fluorescence intensity (MFI) of control” were calculated using the MFI of the PD‐L1 siRNA group and the control siRNA group.
2.7. Mouse xenograft model of LLC
Animal care and procedures were approved by the Institutional Animal Care and Use Committee. In total, 5 × 10⁶ LLC cells were mixed with Matrigel (50%) (Corning) and injected subcutaneous (sc) into the right flank of 6‐ to 7‐wk‐old male C57/6N mice (Charles River Laboratories, Beijing, China). After 7 d, the animals with cancer xenografts were divided randomly into treatment group and control group. Recombinant mouse interferon‐gamma (IFN‐γ) was administered by ip injection at doses of 25 μg/kg/d for 6 d. At the termination of the experiments, the animals were euthanized and the xenografts tumors were collected. A portion of the tumors from control and treated animals was used for preparation of tumor lysate and used in further analysis.
2.8. Real‐time quantitative polymerase chain reaction (real‐time PCR)
PTP1B mRNA expression was measured by real‐time PCR. Total RNA was extracted from cell samples using TRIzol reagent (Thermo Fisher Scientific Inc) and real‐time PCR was performed on an iCycler iQ5 system (Bio‐Rad Laboratories Inc), as reported in a previous study. 16 Data normalization was accomplished using the endogenous reference GAPDH. Gene expression levels were analyzed by relative quantification using a standard curve method. Sequences of the primers were: GAPDH: F: GAAGGTCGGAGTCAACGGATT; R: CGCTCCTGGAAGATGGTAAT; and PTP1B: F: ATCCTGGAGCCACACAATGG; R: AACTCAGTGCATGGTCCTCG.
2.9. Cell migration assay
The migration ability of cells was measured by the wound‐healing assay, as described previously. 17 Cells (4 × 10⁵ cells/2 mL) were seeded into a 6‐well plate and incubated at 37°C. confluent cells were scratched with a 200 μL tip, followed by washing with PBS, and then treated as indicated. After 48 h, cells were fixed and stained with crystal violet, and fields chosen at random were photographed under a microscope.
2.10. Statistical analysis
Data are presented as mean ± SD. Statistical comparisons were performed by one‐way ANOVA followed by Tukey's post hoc test using SPSS v.19.0. Graphs were drawn using GraphPad Prism software (v.6.0 for MacOS).
3. RESULTS
3.1. PD‐L1 expression is positively associated with levels of MET phosphorylation on tyr1234/5 in lung cancer and melanoma cell lines
MET is an oncogenic receptor tyrosine kinase and its phosphorylation on Tyr1234/5 is required for its kinase activation. 18 To determine the relationship between PD‐L1 expression and MET phosphorylation (activation), we analyzed PD‐L1 expression and MET phosphorylation on Tyr1234/5 in melanoma and lung cancer cells, as the role of PD‐L1 in these 2 types of cancer is now being actively investigated. As shown in Figure 1A,C, the order for PD‐L1 expression in lung cancer cells was the following: HCC827, H2228, PC‐9, and A549, which was well correlated with levels of MET phosphorylation on Tyr1234/5 in these cells. In agreement with that found in lung cancer cells, a positive correlation between PD‐L1 expression and phospho‐MET was also observed in melanoma cells (Figure 1B,D). The results indicated that a positive correlation between PD‐L1 protein levels and phosphorylation of MET on Tyr1234/5 existed in the cell lines tested.
FIGURE 1.
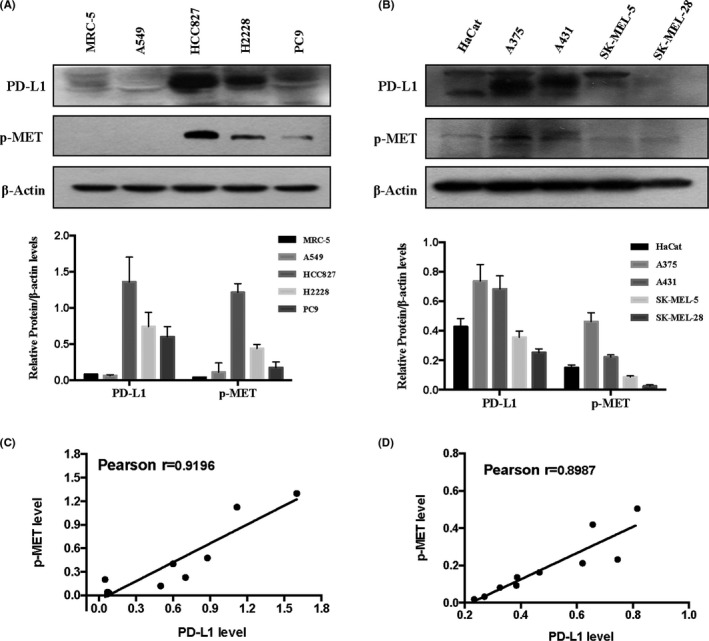
A positive correlation between PD‐L1 expression and MET phosphorylation in lung cancer cells (A) and melanoma cells (B), analyzed by western blot. Pearson correlation between PD‐L1 expression and MET phosphorylation in lung cancer cells (C) and melanoma cells (D) analyzed. Bands were quantified using ImageJ software and quantitative data are presented as mean ± SD based on 3 biological replicates
3.2. Silencing of PD‐L1 decreases phosphorylation of MET Tyr1234/5
Having established the correlation between PD‐L1 expression and MET phosphorylation, we next asked whether MET phosphorylation could be regulated by PD‐L1. An RNAi approach was employed to manipulate PD‐L1 expression, and western blot analysis was used to measure knocking‐down efficiency. As shown in Figure 2A,B, PD‐L1 siRNA at concentration of 5‐20 nmol/L caused a concentration‐dependent reduction of its protein level in A375 cells. Interestingly, downregulation of PD‐L1 by its siRNA led to decreased MET phosphorylation in a same manner, with changes in PD‐L1 expression. Furthermore, similar results were also found in A431 and HCC827 cells (Figure 2C‐F). In addition, these western blot analysis results were further validated by flow cytometry, as described in Materials and Methods. As shown in Supplementary Figure S1, when PD‐L1 was silenced by its siRNA, the intensity of fluorescence (representing MET phosphorylation) was significantly decreased compared with the non‐targeting siRNA. Taken together, these data suggested that PD‐L1 played a role in regulating MET phosphorylation in these cancer cells. To investigate whether the decreased MET phosphorylation by PD‐L1 inhibition was due to decrease of total MET protein level, we analyzed the changes in total MET protein in response to silencing of PD‐L1. As shown in Figure 2A‐F, no changes in the total level of MET were found in A431 and HCC827 cells, while a modest reduction of total MET was observed in A375 cells. These results suggested a different mechanism of regulation for MET phosphorylation by PD‐L1, without changing the total MET protein level. To determine whether PD‐L1 inhibition could affect hepatocyte growth factor (HGF)‐induced MET phosphorylation, we analyzed the changes in MET phosphorylation in the presence of HGF under conditions of PD‐L1 silencing. As shown in Figure 2G, HGF‐induced MET phosphorylation was obviously suppressed by PD‐L1 inhibition. To know whether PD‐L1 inhibition by its antibody could influence PD‐L1‐mediated tumor‐intrinsic signaling, we analyzed the changes in MET phosphorylation in the presence of PD‐L1 antibody. As shown in Figure 2H, MET phosphorylation was not affected by PD‐L1 antibody. We speculated that PD‐L1 antibody might only influence the interaction between PD‐L1 and PD‐1, and could not interrupt PD‐L1‐mediated tumor‐intrinsic signaling. Moreover, we further investigated the effect of PD‐1 recombinant protein on MET activation. As shown in Figure 2I,J, consistent with the results generated with the PD‐L1 antibody, PD‐L1 binding to PD‐1 did not affect MET phosphorylation.
FIGURE 2.
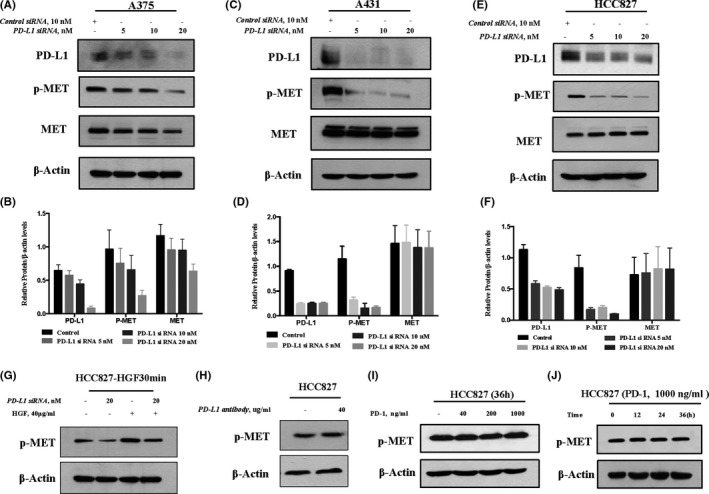
Inhibition of PD‐L1 decreases phosphorylation of MET Tyr1234/5. A‐F, Cells were transfected with various concentrations of PD‐L1‐siRNA or control siRNA for 48 h, and western blot was used to analyze the knockdown efficiency and changes in MET phosphorylation in A375 (A, B), A431 (C, D), and HCC827 (E, F). G, Effect of PD‐L1 inhibition on HGF‐induced MET phosphorylation. Cells were treated with 40 μg/mL HGF for 30 min after the cells were transfected with PD‐L1 siRNA, and the changes in MET phosphorylation were analyzed by western blot. H, Effects of PD‐L1 inhibition by PD‐L1 antibody on MET activation. Cells were treated with 40 μg/mL PD‐L1 antibody for 48 h, and changes in MET phosphorylation were analyzed by western blot. I, Effects of PD‐L1 inhibition by PD‐1 recombinant protein on MET activation. Cells were treated with 40‐1000 ng/mL PD‐1 recombinant protein for 36 h, and the changes in MET phosphorylation were analyzed by western blot. J, Effects of PD‐L1 inhibition by PD‐1 recombinant protein on MET activation. Cells were treated with 1000 ng/mL PD‐1 recombinant protein for 12, 24, and 36 h, and changes in MET phosphorylation were analyzed by western blot. Bands were quantified using ImageJ software and quantitative data are presented as mean ± SD based on 3 biological replicates
3.3. IFN‐γ‐induced PD‐L1 expression promotes MET phosphorylation on Tyr1234/5 in vitro and in vivo
It has been shown that IFN‐γ can induce expression of PD‐L1 through the JAK/STAT pathway. 19 The above results showed that PD‐L1 reduction led to decreased MET phosphorylation, we therefore hypothesized that PD‐L1 induction by IFN‐γ could cause increased MET phosphorylation. A375 cells were treated with various concentrations of IFN‐γ for the times indicated, and changes in MET phosphorylation were measured using western blot analysis. As shown in Figure 3A, PD‐L1 expression was expected to be upregulated by IFN‐γ in a concentration‐dependent manner, while increased MET phosphorylation was detected in a parallel manner. To determine the generality of this result, 2 additional cell lines HCC827 and LLC were tested and the results showed that IFN‐γ‐induced MET phosphorylation was also observed in these 2 cell lines (Figures 3B and S2A). To critically examine the role of PD‐L1 upregulation in IFN‐γ‐induced MET phosphorylation, we assessed the changes in MET phosphorylation induction by IFN‐γ when PD‐L1 was inhibited by RNAi. As shown in Figures 3C‐E and S2B, IFN‐γ‐induced MET phosphorylation was almost abolished under the conditions for silencing PD‐L1 in all 4 cell lines tested. These results clearly suggested that PD‐L1 induction contributed to IFN‐γ‐induced MET phosphorylation in these cells. Next, we tested whether IFN‐γ‐PD‐L1‐induced MET phosphorylation can be achieved in vivo. C57/6N mice bearing LLC xenografts were treated with IFN‐γ at concentration of 25 μg/kg body weight (BW) for 6 d, and changes in PD‐L1 expression and MET phosphorylation in tumor samples were analyzed by western blot; results are shown in Figure S2C. Consistent with the findings in the cell culture model, the induction of PD‐L1 by IFN‐γ was observed in the tumor samples, and was accompanied by an increase in MET phosphorylation. We also performed an experiment to assess the effect of MET inhibitor on IFN‐γ‐PD‐L1‐MET‐mediated cell proliferation, and the results are shown in Figure S3. The data showed that MET inhibitor can inhibit MET activation‐mediated cell proliferation under “IFN‐γ plus MET inhibitor” conditions; similar results were also found under conditions of IFN‐γ plus siPD‐L1. However, MET inhibition failed to produce a further inhibitory effect under the “IFN‐γ plus siPD‐L1 plus MET inhibitor” conditions. Collectively, these results suggested that upregulation of PD‐L1 by IFN‐γ was able to promote MET phosphorylation, which in turn facilitated cell proliferation.
FIGURE 3.
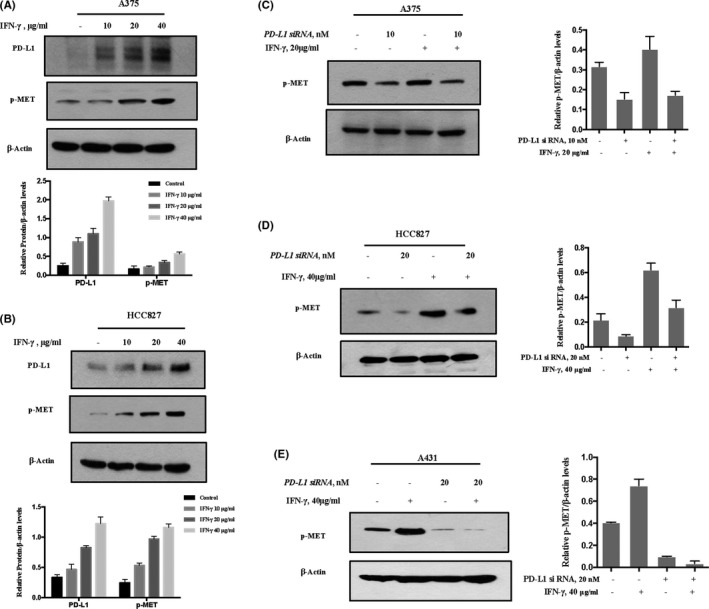
IFN‐γ‐induced PD‐L1 expression promotes MET phosphorylation. A, B, The cells were treated with various concentrations of IFN‐γ for 36 h, and PD‐L1 expression and MET phosphorylation were measured by western blot. A375 (A), HCC827 (B). C‐E, Effect of PD‐L1 inhibition on IFN‐γ‐induced MET phosphorylation in A375 (C), HCC827 (D) and A431 (E). Cells were treated with 40 μg/mL IFN‐γ after the cells were transfected with either PD‐L1 siRNA or control siRNA for 48 h, and the changes of MET phosphorylation were analyzed by western blot. Bands were quantified using ImageJ software and quantitative data are presented as mean ± SD based on 3 biological replicates
3.4. PD‐L1 regulates MET phosphorylation through PTP1B
It has been shown that PTP1B is a negative regulator of the major autophosphorylation sites of the MET receptor catalytic domain (Tyr‐1234/1235). 20 , 21 To decipher the mechanisms involved in PD‐L1‐mediated MET phosphorylation, we investigated the contribution of PTP1B in this event. Firstly, we assessed the influence of PD‐L1 manipulation on PTP1B expression. As shown in Figure 4A,B, knockdown of PD‐L1 caused the upregulation of PTP1B expression in both A431 melanoma and HCC827 lung cancer cells. In agreement with PTP1B induction, PTP1B/MET association was elevated when PD‐L1 was silenced (Figure 4C). To further confirm the contribution of PTP1B, we evaluated the effect of PTP1B inhibitor on PD‐L1‐mediated MET phosphorylation. As shown in Figure 4D, MET phosphorylation reduction by PD‐L1 inhibition was significantly attenuated in the present of PTP1B inhibitor, indicating the involvement of PTP1B in the regulation of MET phosphorylation by PD‐L1. In addition, we measured the influence of PD‐L1 on PTP1B mRNA expression to investigate the contribution of the transcriptional mechanism on the regulation of PTP1B by PD‐L1. As shown in Figure 4E, no obvious changes of PTP1B mRNA levels were found when PD‐L1 was silenced, suggesting that PD‐L1 regulated PTP1B expression through a post‐transcriptional mechanism. To support this notion, we evaluated the changes in PTP1B ubiquitination level in response to PD‐L1 knockdown. As shown in Figure 4F, PD‐L1 inhibition led to a reduction in PTP1B ubiquitination. Taken together, these results suggested that PD‐L1 positively regulated MET phosphorylation, possibly by promoting PTP1B degradation.
FIGURE 4.
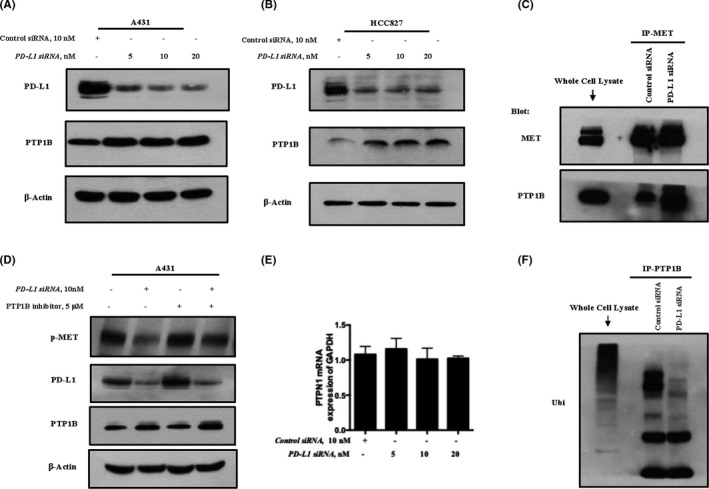
PD‐L1 regulates MET phosphorylation through PTP1B. A, B, Influence of PD‐L1 manipulation on PTP1B expression in A431 and HCC827. Cells were transfected with various concentrations of PD‐L1‐siRNA or control siRNA for 48 h, and western blot was used to analyze the changes of PD‐L1 and PTP1B expression in A431 (A) and HCC827 (B). C, Immunoprecipitation analysis of influence of PD‐L1 inhibition on PTP1B/MET association in A431. D, Effect of PTP1B inhibitor on PD‐L1‐mediated MET phosphorylation in A431. E, Influence of PD‐L1 inhibition on PTP1B mRNA expression in A431. F, Immunoprecipitation analysis of effect of PD‐L1 inhibition on PTP1B ubiquitination in A431. Quantitative data are presented as mean ± SD based on 3 biological replicates
3.5. Effect of PD‐L1 inhibition on cell proliferation and MET‐related signaling
ERKs are the key downstream molecules of MET to mediate cell proliferation and survival. 22 We next examined the effect of knockdown PD‐L1 on ERK phosphorylation, and the results are shown in Figure 5A. As expected, silencing of PD‐L1 caused a concentration‐dependent decrease of ERK phosphorylation in A375 cells that was well correlated with the changes in MET phosphorylation. We next measured the influence of PD‐L1 inhibition on cell viability and the cell cycle, and the results are shown in Figure 5B‐E. In line with the inhibition of the MET‐ERKs axis, downregulation of PD‐L1 led to a reduced cell viability and G1 cell cycle arrest. In addition, we performed a wound‐healing assay to evaluate the effect of PD‐L1 silencing on cell migration; the results showed that PD‐L1 inhibition resulted in a significant reduction in A375 cell migration (Figure 5F). These results indicated that the promoting effect of PD‐L1 on cancer cell proliferation was likely to be attributed to the activation of the MET‐ERKs axis.
FIGURE 5.
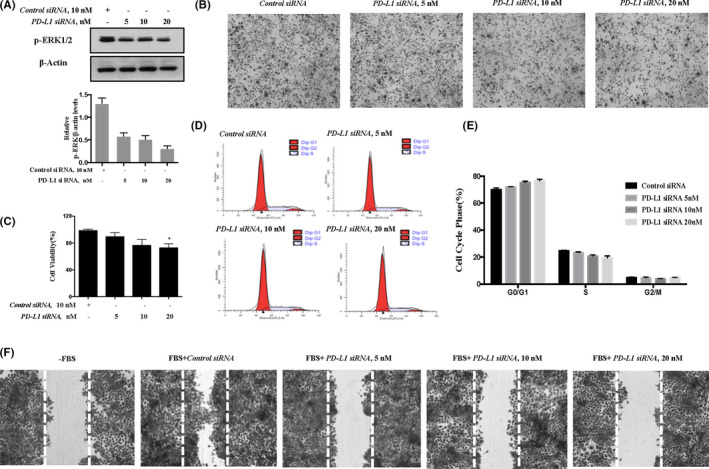
Effect of PD‐L1 inhibition on cell proliferation and MET‐related signaling in A375 cells. A, Effect of PD‐L1 knockdown on ERKs phosphorylation. B‐E, Influence of PD‐L1 inhibition on cell viability (B, C) and cell cycle distribution (D, E). F, Effect of PD‐L1 inhibition on A375 cell migration. Quantitative data are presented as mean ± SD based on 3 biological replicates. *P < .05 compared with the corresponding control group
4. DISCUSSION
A growing body of evidence indicates that PD‐L1 promotes cancer development by either suppression of T cell function or by an immune‐independent mechanism. The PD‐L1‐mediated tumor‐intrinsic effect has been gradually established, however the mechanisms by which PD‐L1 regulates tumor‐intrinsic signals remain largely unknown. In the present study, we identified MET receptor kinase as a downstream target of PD‐L1 to activate oncogenic signaling in cancer cells, and provided a novel mechanistic explanation for the tumor‐intrinsic function of PD‐L1.
MET tyrosine kinase, the receptor for hepatocyte growth factor/scatter factor (HGF/SF), is a transmembrane receptor with autonomic phosphorylation activity. 23 Aberrant activation of the MET pathway has been found in many types of cancer and it is confirmed to be associated with disease progression, metastasis, and drug resistance. 18 , 24 , 25 Therefore, the HGF/MET axis is considered to be a reasonable target for molecularly targeted cancer therapy. 26 , 27 Targeting MET has indeed achieved promising efficacy in pre‐clinical/clinical studies. Regarding the relationship between MET and PD‐L1, a recent study by Li et al 28 demonstrated that the levels of MET were inversely correlated with PD‐L1 in HCC samples. Furthermore, they found that GSK3B could be phosphorylated and activated by MET, which in turn resulted in a reduction in PD‐L1 expression. In contrast, several other studies have shown that MET was positively correlated with PD‐L1 expression in both lung cancer and colorectal tumor samples, and MET inhibition led to the suppression of PD‐L1. 29 These paradoxical findings might be associated with types of cancer. Nevertheless, these studies supported the finding that MET plays an important role in the regulation of PD‐L1 expression, however it is not clear if PD‐L1 can exert its tumor‐intrinsic effect by regulating MET activity. In the present study, we first observed in several types of cancer cells that PD‐L1 expression was positively correlated with MET phosphorylation. Inhibition of PD‐L1 led to a reduced MET phosphorylation, whereas upregulation of PD‐L1 by IFN‐γ caused increased MET phosphorylation both in vitro and in vivo. Furthermore, IFN‐γ‐induced MET phosphorylation was inhibited when PD‐L1 was silenced. In addition, phosphorylation of ERKs, a key downstream target of MET, was also decreased under the conditions of PD‐L1 inhibition. Together, these data strongly indicated that PD‐L1 positively regulated MET phosphorylation (activation). Given the oncogenic function of MET, the activation of MET by PD‐L1 might represent a novel signal transduction pathway that contributed to its tumor‐intrinsic activity.
Recently, a paradoxical phenomenon, termed HPD, in response to treatment with either PD‐1 or PD‐L1 inhibitors, has been reported. 30 This paradoxical phenomenon was characterized by promotion, rather than suppression, of tumor growth upon treatment with immune‐checkpoint inhibitors. The purposed mechanisms included: (i) both PD‐1 and PD‐L1 inhibitors could cause the activation of certain types of T suppressor cells; (ii) these inhibitors may also inhibit the activity of specific T cell subsets; an (iii) the antibody‐Fc/FcR interaction‐mediated activation of tumor‐associated macrophages. 31 It has been shown that treatment with immune‐checkpoint inhibitors causes increase in IFN‐γ release, which in turn led to an induction in PD‐L1. 32 Based on the findings of the present study, we speculated that IFN‐γ‐PD‐L1‐mediated activation of MET may serve as an additional mechanism, contributing to this paradoxical phenomenon induced by immune‐checkpoint inhibition. The findings also provided a rationale for combining immunotherapy and MET‐targeted therapy in cancer treatment.
PTPs play an important role in regulating phosphorylation of receptor tyrosine kinases. 33 , 34 We therefore hypothesized that the regulation of MET phosphorylation by PD‐L1 might be associated with PTPs. Our data showed that downregulation of PD‐L1 by the knocking‐down approach led to increased PTP1B expression, whereas inactivation of PTP1B by its inhibitor resulted in the attenuation of MET phosphorylation reduction by PD‐L1. These results clearly supported the involvement of PTP1B in PD‐L1‐induced MET phosphorylation, and provided a mechanistic interpretation for the regulation of MET phosphorylation by PD‐L1.
In summary, phosphorylation of oncogenic MET receptor tyrosine kinase can be positively regulated by PD‐L1 through PTP1B in tumor cells (Figure 6). The findings of the present study have uncovered a novel signal transduction pathway involved in PD‐L1‐induced tumor‐intrinsic effects.
FIGURE 6.
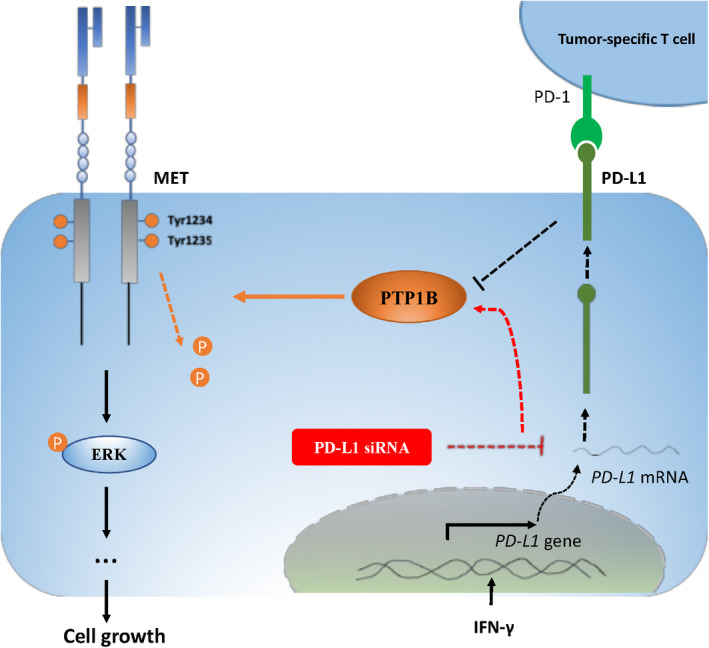
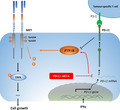
Phosphorylation of oncogenic MET receptor tyrosine kinase can be positively regulated by PD‐L1 through inhibiting PTP1B. Silencing of PD‐L1 led to increased PTP1B protein levels, possibly through suppressing its degradation, which in turn resulted in increased dephosphorylation of MET and its downstream kinase ERKs, and reduced cell proliferation. PD‐L1 induction by IFN‐γ promoted MET phosphorylation, possibly associated with suppression of PTP1B
DISCLOSURE
The authors declare that they have no competing interests.
CONSENT FOR PUBLICATION
All of the authors of this article have participated in the planning and drafting and all of the authors listed have read and approved the final version including details and images. Written informed consent for the publication has been obtained from all of the authors.
Supporting information
Fig S1
Fig S2
Fig S3
Supplementary Material
Supplementary Material
ACKNOWLEDGMENTS
We thank the Ministry of Science and Technology of China for providing the funding. This work was supported by grant from the Ministry of Science and Technology of China (National Key Research and Development Program of China, 2018YFC1603706).
Lu S, Sun Z, Hu W, Yin S, Zhao C, Hu H. PD‐L1 positively regulates MET phosphorylation through inhibiting PTP1B. Cancer Sci. 2021;112:1878–1887. 10.1111/cas.14844
Contributor Information
Shutao Yin, Email: yinshutao@cau.edu.cn.
Hongbo Hu, Email: hongbo@cau.edu.cn.
REFERENCES
- 1. Ishida Y, Agata Y, Shibahara K, Honjo T. Induced expression of PD‐1, a novel member of the immunoglobulin gene superfamily, upon programmed cell death. EMBO J. 1992;11(11):3887‐3895. [DOI] [PMC free article] [PubMed] [Google Scholar]
- 2. Agata Y, Kawasaki A, Nishimura H, et al. Expression of the PD‐1 antigen on the surface of stimulated mouse T and B lymphocytes. Int Immunol. 1996;8:765‐772. [DOI] [PubMed] [Google Scholar]
- 3. Sun C, Mezzadra R, Schumacher TN. Regulation and function of the PD‐L1 checkpoint. Immunity. 2018;48(3):434‐452. [DOI] [PMC free article] [PubMed] [Google Scholar]
- 4. Chen J, Jiang CC, Jin L, Zhang XD. Regulation of PD‐L1: a novel role of pro‐survival signalling in cancer. Ann Oncol. 2016;27(3):409‐416. [DOI] [PubMed] [Google Scholar]
- 5. Kleffel S, Posch C, Barthel SR, et al. Melanoma cell‐intrinsic PD‐1 receptor functions promote tumor growth. Cell. 2015;162(6):1242‐1256. [DOI] [PMC free article] [PubMed] [Google Scholar]
- 6. Antonia SJ, Villegas A, Daniel D, et al. Durvalumab after chemoradiotherapy in stage III non‐small‐cell lung cancer. N Engl J Med. 2017;377:1919‐1929. [DOI] [PubMed] [Google Scholar]
- 7. Weber JS, D’Angelo SP, Minor D, et al. Nivolumab versus chemotherapy in patients with advanced melanoma who progressed after anti‐CTLA‐4 treatment (CheckMate 037): a randomised, controlled, open‐label, phase 3 trial. Lancet Oncol. 2015;16:375‐384. [DOI] [PubMed] [Google Scholar]
- 8. Weber J, Mandala M, Del Vecchio M, et al. Adjuvant nivolumab versus ipilimumab in resected stage III or IV melanoma. N Engl J Med. 2017;377:1824‐1835. [DOI] [PubMed] [Google Scholar]
- 9. Gupta HB, Clark CA, Yuan B, et al. Tumor cell‐intrinsic PD‐L1 promotes tumor‐initiating cell generation and functions in melanoma and ovarian cancer. Signal Transduct Target Ther. 2016;1:16030. [DOI] [PMC free article] [PubMed] [Google Scholar]
- 10. Dong P, Xiong Y, Yue J, Hanley SJ, Watari H. Tumor‐intrinsic PD‐L1 signaling in cancer initiation, development and treatment: beyond immune evasion. Front Oncol. 2018;19(8):386. [DOI] [PMC free article] [PubMed] [Google Scholar]
- 11. Clark CA, Gupta HB, Sareddy G, et al. Tumor‐intrinsic PD‐L1 signals regulate cell growth, pathogenesis, and autophagy in ovarian cancer and melanoma. Can Res. 2016;76(23):6964‐6974. [DOI] [PMC free article] [PubMed] [Google Scholar]
- 12. Tang D, Zhao D, Wu Y, et al. The miR‐3127‐5p/p‐STAT3 axis up‐regulates PD‐L1 inducing chemoresistance in non‐small‐cell lung cancer. J Cell Mol Med. 2018;22(8):3847‐3856. [DOI] [PMC free article] [PubMed] [Google Scholar]
- 13. Kasikara C, Kumar S, Kimani S, et al. Phosphatidylserine sensing by TAM receptors regulates AKT‐dependent chemoresistance and PD‐L1 expression. Mol Cancer Res. 2017;15(6):753‐764. [DOI] [PMC free article] [PubMed] [Google Scholar]
- 14. Merelli B, Massi D, Cattaneo L, Mandalà M. Targeting the PD1/PD‐L1 axis in melanoma: biological rationale, clinical challenges and opportunities. Crit Rev Oncol Hematol. 2013;89(1):140‐165. [DOI] [PubMed] [Google Scholar]
- 15. Wang S, Li J, Xie J, et al. Programmed death ligand 1 promotes lymph node metastasis and glucose metabolism in cervical cancer by activating integrin β4/SNAI1/SIRT3 signaling pathway. Oncogene. 2018;37(30):4164‐4180. [DOI] [PubMed] [Google Scholar]
- 16. Lu SY, Zuo T, Zhang N, et al. High throughput sequencing analysis reveals amelioration of intestinal dysbiosis by squid ink polysaccharide. J Funct Foods. 2016;20:506‐515. [Google Scholar]
- 17. Kim JS, Kang CG, Kim SH, Lee EO. Rhapontigenin suppresses cell migration and invasion by inhibiting the PI3K‐dependent Rac1 signaling pathway in MDA‐MB‐231 human breast cancer cells. J Nat Prod. 2014;77(5):1135‐1139. [DOI] [PubMed] [Google Scholar]
- 18. Birchmeier C, Birchmeier W, Gherardi E, Vande Woude GF. Met, metastasis, motility and more. Nat Rev Mol Cell Biol. 2003;4:915‐925. [DOI] [PubMed] [Google Scholar]
- 19. Garcia‐Diaz A, Shin DS, Moreno BH, et al. Interferon receptor signaling pathways regulating PD‐L1 and PD‐L2 expression. Cell Rep. 2017;19(6):1189‐1201. [DOI] [PMC free article] [PubMed] [Google Scholar]
- 20. Sangwan V, Paliouras GN, Abella JV, et al. Regulation of the Met receptor‐tyrosine kinase by the protein‐tyrosine phosphatase 1B and T‐cell phosphatase. J Biol Chem. 2008;283(49):34374‐34383. [DOI] [PMC free article] [PubMed] [Google Scholar]
- 21. Lu KV, Chang JP, Parachoniak CA, et al. VEGF inhibits tumor cell invasion and mesenchymal transition through a MET/VEGFR2 complex. Cancer Cell. 2012;22(1):21‐35. [DOI] [PMC free article] [PubMed] [Google Scholar]
- 22. Morgillo F, Della Corte CM, Fasano M, Ciardiello F. Mechanisms of resistance to EGFR‐targeted drugs: lung cancer. ESMO Open. 2016;1(3):e000060. [DOI] [PMC free article] [PubMed] [Google Scholar]
- 23. Cipriani NA, Abidoye OO, Vokes E, Salgia R. MET as a target for treatment of chest tumors. Lung Cancer. 2009;63(2):169‐179. [DOI] [PMC free article] [PubMed] [Google Scholar]
- 24. Corso S, Comoglio PM, Giordano S. Cancer therapy: can the challenge be MET? Trends Mol Med. 2005;11(6):284‐292. [DOI] [PubMed] [Google Scholar]
- 25. Engelman JA, Zejnullahu K, Mitsudomi T, et al. MET amplification leads to Gefitinib resistance in lung cancer by activating ERBB3 signaling. Science (Washington D C). 2007;316(5827):1039‐1043. [DOI] [PubMed] [Google Scholar]
- 26. Matsumoto K, Umitsu M, De Silva DM, Roy A, Bottaro DP. Hepatocyte growth factor/MET in cancer progression and biomarker discovery. Cancer Sci. 2017;108(3):296‐307. [DOI] [PMC free article] [PubMed] [Google Scholar]
- 27. Abella JV, Peschard P, Naujokas MA, et al. Met/Hepatocyte growth factor receptor ubiquitination suppresses transformation and is required for Hrs phosphorylation. Mol Cell Biol. 2005;25(21):9632‐9645. [DOI] [PMC free article] [PubMed] [Google Scholar]
- 28. Li H, Li CW, Li X, et al. MET inhibitors promote liver tumor evasion of the immune response by stabilizing PDL1. Gastroenterology. 2019;156(6):1849‐1861. [DOI] [PMC free article] [PubMed] [Google Scholar]
- 29. Peng S, Wang R, Zhang X, et al. EGFR‐TKI resistance promotes immune escape in lung cancer via increased PD‐L1 expression. Mol Cancer. 2019;18(1):165. [DOI] [PMC free article] [PubMed] [Google Scholar]
- 30. Kim JY, Lee KH, Kang J, Borcoman E, Saada‐Bouzid E, Kronbichler A. Hyperprogressive disease during Anti‐PD‐1 (PDCD1) / PD‐L1 (CD274) therapy. A systematic review and meta‐analysis. Cancers (Basel). 2019;11(11):1699. [DOI] [PMC free article] [PubMed] [Google Scholar]
- 31. Lo Russo G, Moro M, Sommariva M, et al. Antibody‐Fc/FcR interaction on macrophages as a mechanism for hyperprogressive disease in non‐small cell lung cancer subsequent to PD‐1/PD‐L1 blockade. Clin Cancer Res. 2019;25(3):989‐999. [DOI] [PubMed] [Google Scholar]
- 32. Gang C, Huang AC, Wei Z, et al. Exosomal pd‐l1 contributes to immunosuppression and is associated with anti‐pd‐1 response. Nature. 2018;560(7718):382‐438. [DOI] [PMC free article] [PubMed] [Google Scholar]
- 33. Haj FG, Markova B, Klaman LD, Bohmer FD, Neel BG. Regulation of receptor tyrosine kinase signaling by protein tyrosine phosphatase‐1B. J Biol Chem. 2003;278(2):739‐744. [DOI] [PubMed] [Google Scholar]
- 34. Yip SC, Saha S, Chernoff J. PTP1B: a double agent in metabolism and oncogenesis. Trends Biochem Sci. 2010;35(8):442‐449. [DOI] [PMC free article] [PubMed] [Google Scholar]
Associated Data
This section collects any data citations, data availability statements, or supplementary materials included in this article.
Supplementary Materials
Fig S1
Fig S2
Fig S3
Supplementary Material
Supplementary Material


