

Abstract
Background
The geriatric nutritional risk index (GNRI) is a simple and useful marker for predicting prognosis and treatment efficacy among patients with various cancers. However, to the best of our knowledge, there are no previous reports regarding the prognostic value of GNRI among patients with non‐small cell lung cancer (NSCLC) who were treated with immune checkpoint inhibitors (ICIs).
Methods
We retrospectively evaluated 85 patients with previously treated advanced NSCLC who were administered ICIs at Shinshu University Hospital between February 2016 and October 2020. Progression‐free survival (PFS) and overall survival (OS) were compared between groups with high (≥89.5) and low (<89.5) GNRI values. We used univariate and multivariate Cox regression analyses to identify prognostic factors that were associated with PFS and OS.
Results
The high and low GNRI groups included 61 and 24 patients, respectively. Relative to the low GNRI group, the high GNRI group had significantly longer median PFS (3.7 vs. 2.4 months, p = 0.041) and significantly longer median OS (14.2 vs. 6.1 months, p = 0.008). Multivariate analyses revealed that independent predictors of favorable OS were high GNRI, performance status of 0–1, and age of ≥70 years. The high GNRI group was significantly more likely to undergo subsequent therapy after immunotherapy (68.6 vs. 33.3%, p = 0.008).
Conclusions
The present study revealed that high GNRI was associated with good outcomes among patients with previously treated NSCLC who were treated with ICIs.
Keywords: geriatric nutritional risk index, immunotherapy, non‐small cell lung cancer, prognostic factor
This retrospective study evaluated the prognostic value of the geriatric nutritional risk index (GNRI) among patients with previously treated advanced non‐small cell lung cancer (NSCLC) who subsequently underwent immunotherapy. A high GNRI was associated with good outcome among patients with NSCLC. These results can be applied in clinical practice to evaluate patient prognosis and response to therapy.
INTRODUCTION
Lung cancer is the leading cause of cancer‐related death and is classified as non‐small cell lung cancer (NSCLC) or small cell lung cancer (SCLC). Approximately 83% of lung cancer cases involve NSCLC, and 40% of NSCLC cases are diagnosed at stage IV. 1 The current treatments for advanced NSCLC include mainly cytotoxic anticancer agents, targeted tyrosine kinase inhibitors, and immune checkpoint inhibitors (ICIs). Recently, the treatment of advanced NSCLC has evolved dramatically because of the introduction of anti‐programmed cell death protein 1 (PD‐1) treatments, such as nivolumab and pembrolizumab, and anti‐programmed cell death ligand 1 (PD‐L1) treatments, such as atezolizumab. Randomized phase III trials in patients with previously treated NSCLC revealed that, relative to docetaxel, ICI treatment provided good survival outcomes. 2 , 3 , 4 One of the biomarkers for predicting ICI treatment efficacy is PD‐L1 expression, and patients with previously treated advanced NSCLC and high PD‐L1 expression who were administered pembrolizumab treatment had a median overall survival (OS) of 17.1 months, which was an extremely good outcome. 3 However, some patients with high PD‐L1 expression still experience poor outcomes after undergoing ICI treatment, and it remains important to identify a simple and reliable prognostic biomarker.
Systemic nutritional and inflammatory statuses can be used to predict the patient's cancer‐related prognosis 5 and several studies have examined prognostic biomarkers among NSCLC patients who were treated with ICIs. Well known biomarkers include neutrophil‐to‐lymphocyte ratio (NLR), platelet‐lymphocyte ratio (PLR), prognostic nutritional index (PNI), lung immune prognostic index (LIPI), and controlling nutritional status (COUNT) index. 6 , 7 , 8 , 9 These biomarkers evaluate serum albumin (Alb) and total cholesterol concentrations to determine nutritional status, although body mass index (BMI) is another important index, and several studies have indicated that BMI is associated with immunotherapy efficacy. 10 , 11 Bouillanne et al. reported the geriatric nutritional risk index (GNRI) as a new tool for evaluating nutritional status, 12 and this index is a simple and objective biomarker based on albumin (Alb), height, and bodyweight. The GNRI has been used as a prognostic biomarker in patients with hemodialysis and chronic heart failure. 13 , 14 Recent reports have also indicated that the GNRI was found to be a useful prognostic indicator for various cancers, especially in surgically treated cases, and low GNRI was associated with poor outcomes among patients who underwent surgery for NSCLC, gastric cancer, and pancreatic ductal adenocarcinoma. 15 , 16 , 17 However, we are not aware of any studies regarding the clinical utility of the GNRI in NSCLC patients who were treated with ICIs and it remains unclear whether the GNRI is associated with the response to immunotherapy. Therefore, the present study investigated whether the GNRI could predict progression‐free survival (PFS) and OS among patients with previously treated advanced NSCLC who underwent immunotherapy, as well as whether the GNRI was associated with subsequent treatment after immunotherapy.
METHODS
Patient selection
We retrospectively identified patients with previously treated advanced NSCLC who underwent ICI treatment at Shinshu University Hospital between February 2016 and October 2020. This study's retrospective protocol was approved by the Research Ethics Review Board of Shinshu University School of Medicine (4772). The relevant data were extracted from electronic medical records in accordance with the principles of the Declaration of Helsinki. Our institution used a form on its website to allow patients to opt out of the research use of their data, and written informed consent was not obtained. All patient data in this report were anonymized.
Data collection and variables
Physical findings, laboratory findings, and Eastern Cooperative Oncology Group Performance status (PS) were evaluated at the start of ICI treatment. The best objective response to immunotherapy was assessed using the Response Evaluation Criteria in Solid Tumors (version 1.1). 18 The GNRI was calculated as: 1.489 × Alb (g/dl) + 41.7 × actual bodyweight/ideal bodyweight. The ideal bodyweight was defined as height × height × 22. Youden's index maximizes the sum of the sensitivity and specificity from the receiver operating characteristic (ROC) curve, and was used to determine that the optimal GNRI cutoff value was 89.5 (area under the ROC curve: 0.59). Analyses were performed according to age (<70 vs. >70 years), sex (male vs. female), PS (0–1 vs. 2–3), smoking history (never vs. current/former), lines of immunotherapy (second vs. third/later), and GNRI (high [≥89.5] vs. low [<89.5]).
Data analysis
The objective response rate (ORR) was defined as the complete response (CR) rate plus the partial response (PR) rate. The disease control rate (DCR) was defined as the ORR plus the stable disease (SD) rate. The PFS and OS intervals were calculated from the start of immunotherapy to the date of progressive disease (PD) and to the date of death or the last follow‐up visit. Patient characteristics, PFS, OS, and subsequent treatment were compared between patients with high and low GNRI values.
Statistical analysis
The data cutoff date was November 10, 2020. Categorical variables were compared between the high and low GNRI groups using Fisher's exact test. We analyzed PFS and OS using the Kaplan–Meier method and log‐rank test. The Cox proportional hazards model was used for univariate and multivariate analyses of prognostic factors. Age, sex, PS, smoking history, lines of chemotherapy, and GNRI were included in the univariate analyses, and significant factors (p < 0.05) were included in the multivariate analysis. All statistical analyses were performed using IBM SPSS Statistics software (version 26; IBM Corp.).
RESULTS
Patient characteristics and immunotherapy efficacy
The study included 85 patients with pretreated advanced NSCLC who were administered ICIs between February 2016 and October 2020. The high GNRI group included 61 (71.8%) and the low GNRI group included 24 patients (28.2%). The ICI treatments involved nivolumab for 62 (72.9%), pembrolizumab for 15 (17.6%), and atezolizumab for eight patients (9.4%). The patient characteristics and immunotherapy efficacy parameters are summarized in Table 1. The high GNRI group had a significantly higher proportion of patients with a good PS (0–1) than the low GNRI group (90.2 vs. 66.7%, p = 0.009), although there were no other significant differences between the two groups in terms of patient characteristics or treatment.
TABLE 1.
Patient characteristics and immunotherapy efficacy
| Category | All patients, N (%) | High GNRI group. N (%) | Low GNRI group, N (%) | p‐value |
|---|---|---|---|---|
| Patients, (N) | 85 | 61 | 24 | |
| Age, years | ||||
| <70/≥70 | 46 (54.1)/39 (45.9) | 33 (54.1)/28 (45.9) | 13 (54.2)/11 (45.8) | 1.000 |
| Gender | ||||
| Male/female | 68 (80.0)/17 (20.0) | 49 (80.3)/12 (19.7) | 19 (79.2)/5 (20.8) | 0.904 |
| ECOG performance status | ||||
| 0–1/2–3 | 71 (83.5)/14 (16.5) | 55 (90.2)/6 (9.8) | 16 (66.7)/8 (33.3) | 0.009 |
| Smoking history | ||||
| Current plus former/never | 66 (77.6)/19 (22.4) | 47 (77.0)/14 (23.0) | 19 (79.2)/5 (20.8) | 1.000 |
| Line of immunotherapy | ||||
| Second/third or later | 46 (54.1)/39 (45.9) | 34 (55.7)/27 (44.3) | 12 (50.0)/12 (50.0) | 0.639 |
| Histological subtype | ||||
| Adenocarcinoma | 47 (55.3) | 33 (54.1) | 14 (58.3) | 0.811 |
| Squamous | 29 (34.1) | 22 (36.1) | 7 (29.2) | 0.618 |
| Adenosquamous | 3 (3.5) | 2 (3.3) | 1 (4.2) | 0.842 |
| Other | 6 (7.1) | 4 (6.6) | 2 (8.3) | 0.774 |
| Immunotherapy treatment | ||||
| Nivolumab | 62 (72.9) | 44 (72.1) | 18 (75.0) | 0.597 |
| Pembrolizumab | 15 (17.6) | 11 (18.0) | 4 (16.7) | 0.882 |
| Atezolizumab | 8 (9.4) | 6 (9.8) | 2 (8.3) | 0.831 |
| Best overall response | ||||
| Complete response (CR) | 1 (1.2) | 1 (1.6) | 0 (0.0) | |
| Partial response (PR) | 14 (16.5) | 12 (19.7) | 2 (8.3) | |
| Stable disease (SD) | 26 (30.6) | 20 (32.8) | 6 (25.0) | |
| Progressive disease (PD) | 40 (47.1) | 24 (39.3) | 16 (66.7) | |
| Not evaluable (NE) | 4 (4.7) | 4 (6.6) | 0 (0.0) | |
| CR or PR/SD or PD | 15 (18.5)/66 (81.5) | 13 (22.8)/44 (77.2) | 2 (8.3)/22 (91.7) | 0.126 |
| CR or PR or SD/PD | 41 (51.3)/40 (48.7) | 33 (57.9)/24 (42.1) | 8 (33.3)/16 (66.7) | 0.054 |
| ORR, % (95% CI) | 18.5 (10.0–27.0) | 22.8 (11.8–33.8) | 8.3 (0.0–19.6) | |
| DCR, % (95% CI) | 50.6 (39.7–61.6) | 57.9 (45.0–70.8) | 33.3 (14.1–52.6) |
Abbreviations: CI, confidence interval; DCR, disease control rate; ECOG, Eastern Cooperative Oncology Group; GNRI, geriatric nutritional risk index; ORR, overall response rate.
The ORR values were 18.5% among all patients (95% confidence interval [CI]: 10.0%–27.0%), 22.8% in the high GNRI group (95% CI: 11.8%–33.8%), and 8.3% in the low GNRI group (95% CI: 0.0%–19.6%). The DCR values were 50.6% among all patients (95% CI: 39.7%–61.6%), 57.9% in the high GNRI group (95% CI: 45.0%–70.8%), and 33.3% in the low GNRI group (95% CI: 14.1%–52.6%). There were no significant differences between the low and high GNRI groups in terms of the ORR (p = 0.126) and the DCR (p = 0.054).
PFS and OS among patients with high and low GNRI
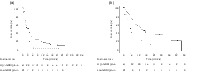
The PFS and OS outcomes for the high and low GNRI groups are shown in Figure 1. The high GNRI group had significantly longer median PFS than the low GNRI group in the univariate analysis (3.7 months [95% CI: 1.9–5.5] vs. 2.4 months [95% CI: 1.5–3.2], p = 0.041). The high GNRI group also had significantly longer median OS than the low GNRI group in the univariate analysis (14.2 months [95% CI: 7.7–20.7] vs. 6.1 months [95% CI: 4.3–7.9], p = 0.008).
FIGURE 1.

Kaplan–Meier survival curves in patients with geriatric nutritional risk index (GNRI) values that were classified as high (≥89.5) or low (<89.5). (a) The median progression‐free survival (PFS) in patients with high GNRI is significantly longer than that in patients with low GNRI (3.7 vs. 2.4 months, p = 0.041). (b) The median overall survival (OS) in patients with high GNRI is significantly longer than that in patients with low GNRI (14.2 vs. 6.1 months, p = 0.008).  High GNRI group;
  Low GNRI group
Factors associated with PFS and OS among NSCLC patients treated with ICIs
Table 2 shows the results of the univariate and multivariate analyses of factors that were potentially associated with PFS. The multivariate analyses revealed that favorable PFS outcomes were independently predicted by age of ≥70 years (hazard ratio [HR]: 0.61, 95% CI: 0.38–0.97, p = 0.038) and a PS of 0–1 (HR: 2.42, 95% CI: 1.23–4.75, p = 0.01). However, there was no significant difference in PFS between the high and low GNRI groups (HR: 1.32, 95% CI: 0.76–2.32, p = 0.325).
TABLE 2.
Univariate and multivariate Cox hazard analyses of factors associated with progression‐free survival
| Category | PFS (months) | Univariate | Multivariate | ||||
|---|---|---|---|---|---|---|---|
| HR | 95% CI | p‐value | HR | 95% CI | p‐value | ||
| Age, years | |||||||
| <70 vs. ≥70 | 2.2 vs. 3.7 | 0.62 | 0.39–0.98 | 0.043 | 0.61 | 0.38–0.97 | 0.038 |
| Gender | |||||||
| Male vs. female | 2.8 vs. 2.6 | 1.74 | 0.97–3.11 | 0.065 | |||
| ECOG performance status | |||||||
| 0–1 vs. 2–3 | 2.9 vs. 1.6 | 2.70 | 1.45–5.00 | 0.002 | 2.42 | 1.23–4.75 | 0.010 |
| Smoking history | |||||||
| Never vs. current plus former | 2.1 vs. 2.8 | 0.80 | 0.46–1.40 | 0.437 | |||
| Lines of immunotherapy | |||||||
| Second vs. third or later | 2.6 vs. 2.9 | 1.09 | 0.69–1.73 | 0.704 | |||
| GNRI | |||||||
| High (≥ 89.5) vs. low (< 89.5) | 3.7 vs. 2.4 | 1.68 | 1.01–2.79 | 0.041 | 1.32 | 0.76–2.32 | 0.325 |
Abbreviations: CI, confidence Interval; ECOG, Eastern Cooperative Oncology Group; GNRI, geriatric nutritional risk index; HR, hazard ratio; PFS, progression‐free survival.
Table 3 shows the results of the univariate and multivariate analyses of factors that were potentially associated with OS. The multivariate analyses revealed that favorable OS outcomes were independently predicted by age of ≥70 years (HR: 0.45, 95% CI: 0.25–0.81, p = 0.008), a PS of 0–1 (HR: 2.78, 95% CI: 1.33–5.83, p = 0.007), and a high GNRI (≥89.5) (HR: 1.97, 95% CI: 1.04–3.73, p = 0.036).
TABLE 3.
Univariate and multivariate Cox hazard analyses of factors associated with overall survival
| Category | OS (months) | Univariate | Multivariate | ||||
|---|---|---|---|---|---|---|---|
| HR | 95% CI | p‐value | HR | 95% CI | p‐value | ||
| Age, years | |||||||
| <70 vs. ≥70 | 7.5 vs. 15.8 | 0.47 | 0.26–0.84 | 0.010 | 0.45 | 0.25–0.81 | 0.008 |
| Gender | |||||||
| Male vs. female | 11.2 vs. 8.2 | 1.20 | 0.60–2.39 | 0.615 | |||
| ECOG performance status | |||||||
| 0–1 vs. 2–3 | 14.0 vs. 5.6 | 3.58 | 1.76–7.27 | < 0.001 | 2.78 | 1.33–5.83 | 0.007 |
| Smoking history | |||||||
| Never vs. current plus former | 9.6 vs. 11.2 | 1.23 | 0.60–2.54 | 0.563 | |||
| Lines of immunotherapy | |||||||
| Second vs. third or later | 13.7 vs. 11.2 | 1.25 | 0.72–2.17 | 0.428 | |||
| GNRI | |||||||
| High (≥89.5) vs. low (<89.5) | 14.2 vs. 6.1 | 2.20 | 1.21–3.97 | 0.008 | 1.97 | 1.04–3.73 | 0.036 |
Abbreviations: CI, confidence interval; ECOG, Eastern Cooperative Oncology Group; GNRI, geriatric nutritional risk index; HR, hazard ratio; OS, overall survival.
Subsequent treatment after immunotherapy
Table 4 lists the subsequent treatments after immunotherapy. The most commonly selected treatments were chemotherapy in the high GNRI group (51.8%) and best supportive care in the low GNRI group (58.3%). Subsequent therapy was significantly more common in the high GNRI group than in the low GNRI group (68.6 vs. 33.3%, p = 0.008).
TABLE 4.
Subsequent treatments after immunotherapy
| Category | High GNRI group, N (%) | Low GNRI group, N (%) | p‐value |
|---|---|---|---|
| Patients (N) | 61 | 24 | |
| Chemotherapy | 31 (50.8) | 6 (25.0) | |
| EGFR‐TKI | 3 (4.9) | 0 (0.0) | |
| Another ICI | 1 (1.6) | 1 (4.2) | |
| Best supportive care | 16 (26.2) | 14 (58.3) | |
| Continuing the ICI | 6 (9.8) | 3 (12.5) | |
| Unknown | 4 (6.6) | 0 (0.0) | |
| Rate of subsequent therapy | 68.6% | 33.3% | 0.008 |
Abbreviations: EGFR‐TKI, epidermal growth factor receptor‐tyrosine kinase inhibitor; GNRI, geriatric nutritional risk index; ICI, immune checkpoint inhibitor.
DISCUSSION
This study revealed that the GNRI had prognostic value among patients with previously treated advanced NSCLC who received ICIs, as high GNRI was associated with favorable OS in this setting. The association between nutritional status and survival outcomes among cancer patients is an important topic, and previous studies have indicated that Alb and BMI (factors used to calculate the GNRI) were important prognostic factors in cases of lung cancer. A low Alb concentration, which is an indicator of malnutrition, is associated with immune dysfunction, and contributes to tumor progression and poor outcomes. 19 Nakanishi et al. reported that, relative to patients with a low albumin‐globulin ratio (AGR, <1.17), those with a high AGR (≥1.17) who underwent anti‐PD‐1 treatment had significantly longer PFS (310 vs. 67 days, p = 0.008) and OS (not reached vs. 304 days, p = 0.002). 20 Malnutrition is a typical cause of cachexia, which is defined as the loss of ≥5% of bodyweight during the previous six months, and Roch et al. reported that the OS in NSCLC patients with cachexia who were administered ICIs was significantly shorter than that in patients without cachexia (HR: 6.26, 95% CI: 2.23–17.57). 21 A large multicenter retrospective study also revealed that, relative to a low BMI group (<25 kg/m2), a high BMI group (>25 kg/m2) of patients with cancer (including NSCLC) who were administered ICIs had significantly longer PFS (11.7 vs. 3.7 months, HR: 0.46, 95% CI: 0.39–0.54, p < 0.0001) and OS (26.6 vs. 6.6 months, HR: 0.33, 95% CI: 0.28–0.41, p < 0.0001). 22 Furthermore, Ichihara et al. reported that, relative to a low BMI group (<22 kg/m2), a high BMI group (≥22 kg/m2) of patients with previously treated NSCLC who were administered ICIs had significantly longer PFS (3.7 vs. 2.8 months, HR: 0.79, 95% CI: 0.64–0.97, p = 0.036) and OS (15.4 vs. 13.4 months, HR: 0.73, 95% CI: 0.57–0.95, p = 0.021). 10 Given the previously reported relationships between ICI‐related outcomes and Alb and BMI, as well as our findings, it seems plausible that the GNRI has a value for predicting outcomes among patients who are treated with ICIs for NSCLC. In the previous study, GNRI cutoff values of <82, 82 to <92, 92 to <98, and ≥98 were classified as having major, moderate, low, and no‐nutrition‐related risk, respectively. 12 In the present study, the ROC curve of PFS was used to determine the cutoff value (89.5) used to measure the correlation between the effectiveness of ICIs and the GNRI.
The present study revealed that the significantly shortened OS in the low GNRI group might be related to that group having significantly lower mean Alb values (2.8 g/dL [range: 1.1–3.7] vs. 3.9 g/dL [range: 3.0–4.9], p < 0.001) and significantly lower mean BMI values (18.8 kg/m2 [range: 14.9–24.4] vs. 22.2 kg/m2 [range: 16.3–30.0], p < 0.001). Thus, the low GNRI group had greater systemic inflammation, which might suggest more noticeable cachexia. In addition, the rate of subsequent therapy was significantly higher in the high GNRI group, and the pronounced difference in chemotherapy use after immunotherapy (high GNRI: 50.0 vs. low GNRI: 25.0%) might have affected the survival outcomes. Several studies have indicated that previous treatment with immunotherapy improved the efficacy of subsequent chemotherapy, and a multicenter retrospective study revealed that the median values were 4.1 months for PFS (95% CI: 3.4–4.8), 6.8 months for OS (95% CI: 5.5–8.1), and 22.8% for ORR among 342 NSCLC patients who underwent salvage chemotherapy after immunotherapy (SCAI). 23 Park et al. also compared the ORRs between SCAI and the last chemotherapy administered before immunotherapy (LCBI), which revealed that SCAI was associated with a significantly higher ORR (53.4 vs. 34.9%, p = 0.03). 24 Thus, the longer OS in the high GNRI group might also be explained by its high rate of SCAI, relative to the low GNRI group.
The high GNRI group had significantly longer PFS than the low GNRI group, although a high GNRI was not an independent prognostic factor in the multivariate Cox hazard analysis (HR: 1.32, 95% CI: 0.76–2.32, p = 0.325). This may be because PS strongly influences PFS, as Adachi et al. 25 reported that the median PFS among patients with NSCLC who were administered nivolumab was significantly longer in patients with good PS (PS 0–1) than in those with poor PS (PS 2–4) (3.7 months [95% CI: 3.0–4.9] vs. 1.2 months [95% CI: 1.0–1.8], p < 0.001). Poor PS was also an independent predictor of poor PFS in the multivariate Cox hazard analysis (HR: 1.62, 95% CI: 1.19–2.20, p = 0.002). 25 The present study also revealed that the low GNRI group had significantly more patients with poor PS than the high GNRI group (p = 0.009), and PS was also an independent prognostic factor in the multivariate Cox hazard analysis. Having a good PS was the most important prognostic factor in the present study. Thus, although the GNRI was not independently associated with PFS, it may still be an important indicator for predicting the efficacy of ICIs. For example, the ORR and DCR values tended to be higher, albeit not significantly in the high GNRI group, which might suggest that a significant difference could emerge if additional cases were added to the analyses.
The present study revealed that older age (≥70 years) independently predicted favorable PFS and OS outcomes. Although this might be coincidence, these results at least suggest that the older group experienced immunotherapy efficacy that was comparable to that in the younger group. Galli et al. also reported that, among patients who underwent immunotherapy for NSCLC, there were no significant differences between the 180 patients who were <70 years old and the 94 patients who were 70–79 years old in terms of PFS (2.8 vs. 3.5 months) or OS (11.3 vs. 9.6 months). 26 Lichtenstein et al. also reported that, among patients who underwent immunotherapy for NSCLC, there were no significant differences between the 64 patients who were < 60 years old and the 76 NSCLC patients who were 70–79 years old in terms of PFS (1.81 vs. 3.75 months) or OS (13.01 vs. 12.92 months). 27 Thus, the efficacy of ICI treatment for NSCLC might be more strongly related to PS, nutritional status, and systemic inflammation, rather than age.
The present study has several limitations. First, this was a retrospective single‐center study, which is prone to bias. Second, PD‐L1 expression was not measured for 33 patients (38.8%), which made it impossible to investigate the association between the GNRI and PD‐L1 expression as a known predictor of ICI efficacy. Third, the ICIs were selected at the discretion of the attending physicians. Fourth, we did not have access to detailed data regarding the subsequent therapy regimens and their effects. Fifth, the study did not evaluate the incidence of toxicity. Thus, we could not evaluate how toxicity affected the prognosis.
In conclusion, high GNRI was associated with good outcomes among patients with previously treated NSCLC who were administered ICIs. This result suggests that systemic inflammation and nutritional status play important roles in tumor progression and the response to immunotherapy. However, these results must be validated in a prospective study.
CONFLICT OF INTEREST
The authors confirm that there are no conflicts of interest.
ACKNOWLEDGMENTS
This research did not receive any specific grant from funding agencies in the public, commercial, or not‐for‐profit sectors.
Sonehara K, Tateishi K, Araki T, Komatsu M, Yamamoto H, Hanaoka M. Prognostic value of the geriatric nutritional risk index among patients with previously treated advanced non‐small cell lung cancer who subsequently underwent immunotherapy. Thorac Cancer. 2021;12:1366–1372. 10.1111/1759-7714.13909
REFERENCES
- 1. Miller KD, Nogueira L, Mariotto AB, Rowland JH, Yabroff KR, Alfano CM, et al. Cancer treatment and survivorship statistics, 2019. CA Cancer J Clin. 2019;69:363–85. 10.3322/caac.21565. [DOI] [PubMed] [Google Scholar]
- 2. Antonia SJ, Borghaei H, Ramalingam SS, Horn L, de Castro Carpeño J, Pluzanski A, et al. Four‐year survival with nivolumab in patients with previously treated advanced non‐small‐cell lung cancer: a pooled analysis. Lancet Oncol. 2019;20:1395–408. 10.1016/S1470-2045(19)30407-3. [DOI] [PMC free article] [PubMed] [Google Scholar]
- 3. Herbst RS, Baas P, Perez‐Gracia JL, Felip E, Kim DW, Han JY, et al. Use of archival versus newly collected tumor samples for assessing PD‐L1 expression and overall survival: an updated analysis of KEYNOTE‐010 trial. Ann Oncol. 2019;30:281–9. 10.1093/annonc/mdy545. [DOI] [PMC free article] [PubMed] [Google Scholar]
- 4. Pawel JV, Bordoni R, Satouchi M, Fehrenbacher L, Cobo M, Han JY, et al. Long‐term survival in patients with advanced non‐small‐cell lung cancer treated with atezolizumab versus docetaxel: results from the randomised phase III OAK study. Eur J Cancer. 2019;107:124–32. 10.1016/j.ejca.2018.11.020. [DOI] [PubMed] [Google Scholar]
- 5. Alifano M, Mansuet‐Lupo A, Lococo F, Roche N, Bobbio A, Canny E, et al. Systemic inflammation, nutritional status and tumor immune microenvironment determine outcome of resected non‐small cell lung cancer. PLoS One. 2014;9:e106914. 10.1371/journal.pone.0106914. [DOI] [PMC free article] [PubMed] [Google Scholar]
- 6. Zhang N, Jiang J, Tang S, Sun G. Predictive value of neutrophil‐lymphocyte ratio and platelet‐lymphocyte ratio in non‐small cell lung cancer patients treated with immune checkpoint inhibitors: a meta‐analysis. Int Immunopharmacol. 2020;85:106677. 10.1016/j.intimp.2020.106677. [DOI] [PubMed] [Google Scholar]
- 7. Shoji F, Takeoka H, Kozuma Y, Toyokawa G, Yamazaki K, Ichiki M, et al. Pretreatment prognostic nutritional index as a novel biomarker in non‐small cell lung cancer patients treated with immune checkpoint inhibitors. Lung Cancer. 2019;136:45–51. 10.1016/j.lungcan.2019.08.006. [DOI] [PubMed] [Google Scholar]
- 8. Mezquita L, Auclin E, Ferrara R, Charrier M, Remon J, Planchard D, et al. Association of the lung immune prognostic index with immune checkpoint inhibitor outcomes in patients with advanced non‐small cell lung cancer. JAMA Oncol. 2018;4:351–7. 10.1001/jamaoncol.2017.4771. [DOI] [PMC free article] [PubMed] [Google Scholar]
- 9. Ohba T, Takamori S, Toyozawa R, Nosaki K, Umeyama Y, Haratake N, et al. Prognostic impact of the controlling nutritional status score in patients with non‐small cell lung cancer treated with pembrolizumab. J Thorac Dis. 2019;11:3757–68. 10.21037/jtd.2019.09.29. [DOI] [PMC free article] [PubMed] [Google Scholar]
- 10. Ichihara E, Harada D, Inoue K, Sato K, Hosokawa S, Kishino D, et al. The impact of body mass index on the efficacy of anti‐PD‐1/PD‐L1 antibodies in patients with non‐small cell lung cancer. Lung Cancer. 2020;139:140–5. 10.1016/j.lungcan.2019.11.011. [DOI] [PubMed] [Google Scholar]
- 11. Cortellini A, Ricciuti B, Tiseo M, Bria E, Banna GL, Aerts JGJV, et al. Baseline BMI and BMI variation during first line pembrolizumab in NSCLC patients with a PD‐L1 expression ≥ 50%: a multicenter study with external validation. J Immunother Cancer. 2020;8:e001403. 10.1136/jitc-2020-001403. [DOI] [PMC free article] [PubMed] [Google Scholar]
- 12. Bouillanne O, Morineau G, Dupont C, Coulombel I, Vincent JP, Nicolis I, et al. Geriatric nutritional risk index: a new index for evaluating at‐risk elderly medical patients. Am J Clin Nutr. 2005;82:777–83. 10.1093/ajcn/82.4.777. [DOI] [PubMed] [Google Scholar]
- 13. Xiong J, Wang M, Zhang Y, Nie L, He T, Wang Y, et al. Association of Geriatric Nutritional Risk Index with mortality in hemodialysis patients: a meta‐analysis of cohort studies. Kidney Blood Press Res. 2018;43:1878–89. 10.1159/000495999. [DOI] [PubMed] [Google Scholar]
- 14. Kinugasa Y, Kato M, Sugihara S, Hirai M, Yamada K, Yanagihara K, et al. Geriatric nutritional risk index predicts functional dependency and mortality in patients with heart failure with preserved ejection fraction. Circ J. 2013;77:705–11. 10.1253/circj.cj-12-1091. [DOI] [PubMed] [Google Scholar]
- 15. Shoji F, Matsubara T, Kozuma Y, Haratake N, Akamine T, Takamori S, et al. Preoperative geriatric nutritional risk index: a predictive and prognostic factor in patients with pathological stage I non‐small cell lung cancer. Surg Oncol. 2017;26:483–8. 10.1016/j.suronc.2017.09.006. [DOI] [PubMed] [Google Scholar]
- 16. Hirahara N, Matshubara T, Fujii Y, Kaji S, Hyakudomi R, Yamamoto T, et al. Preoperative geriatric nutritional risk index is a useful prognostic indicator in elderly patients with gastric cancer. Oncotarget. 2020;11:2345–56. 10.18632/oncotarget.27635. [DOI] [PMC free article] [PubMed] [Google Scholar]
- 17. Hu S, Chen L, Lin C, et al. The prognostic value of preoperative geriatric nutritional risk index in patients with pancreatic ductal adenocarcinoma. Cancer Manage Res. 2020;12:385–95. 10.2147/CMAR.S229341. [DOI] [PMC free article] [PubMed] [Google Scholar]
- 18. Eisenhauer EA, Therasse P, Bogaerts J, Schwartz LH, Sargent D, Ford R, et al. New response evaluation criteria in solid tumours: revised RECIST guideline (version 1.1). Eur J Cancer. 2009;45:228–47. 10.1016/j.ejca.2008.10.026. [DOI] [PubMed] [Google Scholar]
- 19. Ikeda S, Yoshioka H, Ikeo S, Morita M, Sone N, Niwa T, et al. Serum albumin level as a potential marker for deciding chemotherapy or best supportive care in elderly, advanced non‐small cell lung cancer patients with poor performance status. BMC Cancer. 2017;17:797. 10.1186/s12885-017-3814-3. [DOI] [PMC free article] [PubMed] [Google Scholar]
- 20. Nakanishi Y, Masuda T, Yamaguchi K, Sakamoto S, Horimasu Y, Mimae T, et al. Albumin‐globulin ratio is a predictive biomarker of antitumor effect of anti‐PD‐1 antibody in patients with non‐small cell lung cancer. Int J Clin Oncol. 2020;25:74–81. 10.1007/s10147-019-01539-2. [DOI] [PubMed] [Google Scholar]
- 21. Roch B, Coffy A, Jean‐Baptiste S, Palaysi E, Daures JP, Pujol JL, et al. Cachexia ‐ sarcopenia as a determinant of disease control rate and survival in non‐small lung cancer patients receiving immune‐checkpoint inhibitors. Lung Cancer. 2020;143:19–26. [DOI] [PubMed] [Google Scholar]
- 22. Cortellini A, Bersanelli M, Buti S, Cannita K, Santini D, Perrone F, et al. A multicenter study of body mass index in cancer patients treated with anti‐PD‐1/PD‐L1 immune checkpoint inhibitors: when overweight becomes favorable. J Immunother Cancer.. 2019;7(57):57. 10.1186/s40425-019-0527-y. [DOI] [PMC free article] [PubMed] [Google Scholar]
- 23. Bersanelli M, Buti S, Giannarelli D, Leonetti A, Cortellini A, Russo GL, et al. Chemotherapy in non‐small cell lung cancer patients after prior immunotherapy: the multicenter retrospective CLARITY study. Lung Cancer. 2020;150:123–31. 10.1016/j.lungcan.2020.10.008. [DOI] [PubMed] [Google Scholar]
- 24. Park SE, Lee SH, Ahn JS, Ahn MJ, Park K, Sun JM. Increased response rates to salvage chemotherapy administered after PD‐1/PD‐L1 inhibitors in patients with non‐small cell lung cancer. J Thorac Oncol. 2018;13:106–11. 10.1016/j.jtho.2017.10.011. [DOI] [PubMed] [Google Scholar]
- 25. Adachi Y, Tamiya A, Taniguchi Y, Enomoto T, Azuma K, Kouno S, et al. Predictive factors for progression‐free survival in non‐small cell lung cancer patients receiving nivolumab based on performance status. Cancer Med. 2020;9:1383–91. 10.1002/cam4.2807. [DOI] [PMC free article] [PubMed] [Google Scholar]
- 26. Galli G, Toma AD, Pagani F, Randon G, Trevisan B, Prelaj A, et al. Efficacy and safety of immunotherapy in elderly patients with non‐small cell lung cancer. Lung Cancer. 2019;137:38–42. 10.1016/j.lungcan.2019.08.030. [DOI] [PubMed] [Google Scholar]
- 27. Lichtenstein MR, Nipp RD, Muzikanssky A, Goodwin K, Anderson D, Newcomb RA, et al. Impact of age on outcomes with immunotherapy in patients with non‐small cell lung cancer. J Thorac Oncol. 2019;14:547–52. 10.1016/j.jtho.2018.11.011. [DOI] [PubMed] [Google Scholar]