

Abstract
Aims/Introduction
β‐Cell dysfunction is a hallmark of type 2 diabetes. In a previous pilot study, we identified an association between genetic variants within the human DACH1 gene and young‐onset type 2 diabetes. Here, we characterized the function of dachb, the only dach homologue to be expressed in the pancreas, in developing zebrafish embryos.
Materials and Methods
We injected one‐cell stage embryos with a dachb‐morpholino (MO) or with the dachb‐MO and dachb messenger ribonucleic acid, and determined the effect on the development of the pancreatic islet. We also carried out quantitative polymerase chain reaction and ribonucleic acid sequencing on the dachb‐MO group to determine the effect of dachb knockdown on gene expression.
Results
MO‐mediated dachb knockdown resulted in impaired islet cell development, with a significant decrease in both the β‐cell and islet cell numbers. This islet developmental defect was rescued when embryos were co‐injected with dachb‐MO and dachb messenger ribonucleic acid. Knockdown of dachb was associated with a significant downregulation of the β‐cell specific marker gene, insa, and the somatostatin cell marker, sst2, as well as regulators of pancreas development, ptf1a, neuroD, pax6a and nkx6.1, and the cell cycle gene, insm1a. Furthermore, ribonucleic sequencing analysis showed an upregulation of genes enriched in the forkhead box O and mitogen‐activated protein kinase signaling pathways in the dachb‐MO group, when compared with the control groups.
Conclusions
Together, our results suggest the possible role of dachb in islet development in zebrafish.
Keywords: dachshund b, Pancreatic islet development, Zebrafish
Morpholino (MO)‐mediated knock‐down of dachb resulted in impaired islet cell development, with a significant decrease in both the β‐cell and islet cell numbers in zebrafish. Embryos co‐injected with dachb mRNA and dachb‐MO expressed a similar phenotype as the uninjected control groups, indicating rescue of the islet developmental defect. The studies highlight the role of dachb in islet development in zebrafish.
Introduction
In clinical studies, β‐cell dysfunction is one of the main determinants for progression to type 2 diabetes in humans 1 , 2 . Most of the genetic loci found to be associated with type 2 diabetes and gestational diabetes appear to be related to β‐cell function, highlighting the key role of these cells in determining the susceptibility to type 2 diabetes in the setting of different metabolic challenges.
In a previous pilot genome‐wide association study of diabetes, the T allele of rs1408888 in intron 1 of DACH1 was found to be associated with young‐onset type 2 diabetes in Chinese iindividuals 3 . In the dachshund family of proteins, the N‐terminal domain is structurally similar to the winged‐helix/forkhead deoxyribonucleic acid (DNA)‐binding motif 4 . Indeed, in Drosophila, the dachshund (dac) mutant shows a lack of eye development and exhibits leg truncations 5 . In addition, dac regulates Drosophila insulin‐peptide 5 (dilp5) and is haplo‐insufficient with respect to dilp5 levels; however, the dac overexpression in insulin‐producing cells causes a severe reduction of dilp5 expression 6 . In mice, knocking out Dach1 (or Dach2) alone, yields no gross abnormalities in eye, limb or brain development 7 . However, Dach1 mutants show postnatal lethality 7 , and although the endocrine cells still cluster into islet structures, aggregate size and islet cell proliferation are both reduced 8 . Although these previous studies suggest that dachshund might play a role in the development of the β‐cells and pancreatic islets, this has not been studied in detail.
Although the mouse remains the main animal model for studying metabolic diseases, such as diabetes, zebrafish (Danio rerio) have also become more popular for investigating the development of the pancreas 9 , 10 , 11 , 12 , as well as the pathologies associated with diabetes 13 , 14 , 15 , 16 . Zebrafish adults breed year‐round, and the embryos develop ex utero and are transparent, which means that they are ideal for imaging 17 , 18 , 19 . Furthermore, zebrafish embryos develop relatively rapidly, and so the molecular, genetic and morphological aspects of organogenesis can be readily investigated 20 . In addition, the cellular structure of the zebrafish pancreas is fundamentally comparable to that of mammals. It comprises both exocrine and endocrine compartments, and the latter contains insulin‐producing β‐cells together with α‐, δ‐, ε‐ and PP‐cells, which produce glucagon, somatostatin, ghrelin and pancreatic polypeptide, respectively 10 , 20 , 21 . Furthermore, transcription factors, such as pax6, pdx1, ptf1a, nkx6.1 and isl1, which are known to be involved in the development of the pancreas in the mouse and human 22 , 23 , are also expressed in zebrafish 20 , 24 , 25 , 26 . Like mammals, the zebrafish pancreas forms from dorsal and ventral pancreatic buds, which arise from a region of endoderm expressing pdx1 27 . The dorsal bud develops first, with a small islet forming by ~24 h post‐fertilization (hpf), whereas the ventral bud forms in a more anterior location by ~32 hpf 24 , 28 . The dorsal bud contains many of the endocrine cells of the pancreas, whereas the ventral bud gives rise mainly to the exocrine tissues of the gland and the pancreatic ducts 20 , 24 , 28 . By ~48 hpf, the first islet is organized in a similar manner as in mammals, such that α‐ and δ‐cells surround a core of β‐cells 20 .
Zebrafish also express four dachshund gene homologues, dacha, dachb, dachc and dachd 8 , 29 , although only dachb is expressed in the developing pancreas 8 . Here, we utilized the zebrafish to investigate the role of dachb in the development of the pancreatic islet and β‐cells. dachb expression was knocked down by injecting a splice‐blocking morpholino oligonucleotide (MO) into embryos at the one‐cell stage. The effect of dachb knockdown on pancreas development was investigated through immunohistochemistry with antibodies to insulin and islet 1 and 2 to label the β‐cells and islet cells, respectively, whereas its effect on gene expression was investigated by quantitative polymerase chain reaction (qPCR) and ribonucleic acid sequencing (RNA‐seq). Our data suggest that dachb plays a role in the development of the pancreatic islet in zebrafish. These findings are similar to those reported when Dach1 was deleted in mice 8 .
Materials and Methods
Zebrafish husbandry and embryo collection
Wild‐type AB zebrafish were obtained from the Zebrafish International Resource Center (University of Oregon, Eugene, OR, USA). The adults were maintained, their eggs collected and the embryos incubated in Danieau’s solution at ~28°C, as previously described 30 , 31 , 32 . All the procedures used in the present study were carried out in accordance with the guidelines and regulations set out by the Animal Ethics Committee of the HKUST and by the Department of Health, Hong Kong.
Whole‐mount dual‐immunolabeling of the pancreatic islet and β‐cells
Embryos at ~24, ~30 and ~ 48 hpf were dechorionated either manually 32 or with pronase 31 . They were then anesthetized on ice and fixed overnight at ~4°C in phosphate‐buffered saline containing 4% paraformaldehyde and 4% sucrose, after which they were washed with phosphate‐buffered saline. The pigmentation of the ~30 and ~48 hpf embryos was bleached by incubation with phosphate‐buffered saline containing 0.5% KOH and 1% H2O2 for ~15 min. All the embryos were then manually de‐yolked using a 21‐G needle (Becton, Dickinson and Company, Franklin Lakes, NJ, USA) and a pair of watchmaker’s forceps, after which the pancreatic β‐cells and islet were whole‐mount double‐immunolabeled with a guinea pig anti‐insulin antibody (A0564, Dako; diluted 1:500), and the 39.4D5 mouse anti‐islet‐1 and −2 homeobox antibody(Developmental Studies Hybridoma Bank; diluted 1:20), respectively, using methods described previously 33 . The secondary antibodies were AlexaFluor® 488‐conjugated goat anti‐guinea pig immunoglobulin G (A‐11073; ThermoFisher Scientific, Waltham, MA, USA; at 1:1000); and AlexaFluor® 546‐conjugated goat anti‐mouse immunoglobulin G (A‐11030; ThermoFisher; at 1:200). Finally, embryos were mounted under ProLong® Gold mountant containing 4′,6‐diamidino‐2‐phenylindole 4′,6‐diamidino‐2‐phenylindole (ThermoFisher).
Imaging the fluorescently labeled embryos
Confocal microscopy was carried out using a Leica TCS SP5 II (Leica Microsystems, Wetzlar, Germany) confocal module mounted on a Leica DMI6000 microscope equipped with multi‐photon excitation capability. Images were obtained using HC PL APO/20x and HCX PL APO/63x objective lenses. AlexaFluor® 488 and AlexaFluor® 546 fluorescence was observed using 488 nm excitation/500–550 nm emission, and 561 nm excitation/>570 nm emission, respectively, whereas 4′,6‐diamidino‐2‐phenylindole was visualized using 780 nm excitation/432–482 nm detection through a BP 460/50 filter cube and a Hamamatsu/Leica non‐descanned detector.
Design and injection of MOs
MOs (Gene Tools, LLC, Philomath, OR, USA) were prepared at a stock concentration of 1 mmol/L in Milli‐Q water and kept at room temperature. The expression of dachb was attenuated using a splice‐blocking MO (dachb‐MO‐S) 8 or a translation‐blocking MO (dachb‐MO‐T). The dachb‐MO‐S blocked the dachb pre‐messenger RNA (mRNA) splice site at the intersection of exon2 and intron2 (Figure S1ai), whereas the dachb‐MO‐T targeted the translational start‐site of the dachb mRNA (Figure S1 aii). To alleviate off‐target effects, each dachb‐MO was co‐injected with a p53‐MO at a ratio of ~1:1 34 , 35 . In addition, p53‐MO alone was injected into embryos as a p53‐control, and the standard control MO supplied by Gene Tools was used as a specificity control 36 . Embryos at the one‐ to two‐cell stage were microinjected with ~1.5 nL to 2 nL of the stock MO to reach a final dose of ~1 ng to ~8 ng. Details regarding the microinjection methods used are described previously 37 . The oligo sequences for the two dachb‐MOs, the p53‐MO and the standard control MO, are below:
dachb‐MO‐S: 5'‐CTCAATGAGGGTTTACCTGTGGGTG‐3'.
dachb‐MO‐T: 5'‐GCCATAGTGGTCATTGAACTTAAAG‐3'.
p53‐MO: 5'‐GCGCCATTGCTTTGCAAGAATTG‐3'.
Standard control MO: 5'‐CCTCTTACCTCAGTTACAATTTATA‐3'.
In vitro transcription and purification of dachb mRNA
The dachb fragments were cloned from the complementary DNA (cDNA) library of zebrafish embryos at ~30 hpf by PCR, using the High Fidelity Platinum® Taq DNA Polymerase (ThermoFisher Scientific) with the following primers:
Forward primer: 5'‐CCGGAATTCGCCACCATGGCCGTTCCCGCGACTCTT‐3'.
Reverse primer: 5'‐CGCGGATCCTTAGTATATGATTGGATTTTTCGTATATGT‐3'.
The sequence was then cloned into the pBlueScriptII KS (+) vector with a T3 promoter and an EcoRV cutting site sequence at the 5'‐end, and a T7 promoter and a BamHI cutting site sequence at the 3'‐end (Figure S1b). This allowed the generation of a linear template whether by PCR or by digestion, and gave the correct template for subsequent in vitro transcription (when using mMESSAGE mMACHINE®T3 Transcription Kit; ThermoFisher Scientific) of dachb mRNA. The mRNA transcript was purified by phenol–chloroform extraction and isopropanol precipitation following the manufacturer’s instructions. The mRNA product generated was then dissolved in RNase‐free water to a concentration of 200 ng/µL and stored at −80°C in 2 µL aliquots. During rescue experiments, a mixture of dachb‐MO‐S and p53‐MO was first injected into the yolk of embryos at the one‐cell stage, then ~50 pg dachb mRNA was immediately injected into the blastodisc.
Primer design and qPCR
Total RNA samples were prepared from pools of 30 embryos at ~30 hpf using TRIzol Reagent (10296010, ThermoFisher Scientific). In brief, embryos were immersed in TRIzol Reagent and then triturated several times with a 200‐µL tip until the embryonic tissues were disrupted. cDNA was then prepared using the High Capacity cDNA Reverse Transcription kit (Applied Biosystems, Foster City, CA, USA). The FastStart SYBR Green Master mix (Roche, Basel, Switzerland) was used for qPCR reactions run with a LightCycler 480 II Real‐Time System and a LightCycler® 480 Multiwell plate 384 (both Roche). All reactions were carried out on three biological samples, each with three technical replicates. The primers were designed using the “Serial Cloner” software (Serial Basics) and were all of Danio rerio origin (Table 1).
Table 1.
Primer pairs used to amplify the target genes in zebrafish
| Gene | Forward primer | Reverse primer | |
|---|---|---|---|
| 1 | zf‐arxa | acaaccgaagtcacctccaa | cttgaggcgcttggctga |
| 2 | zf‐cdkn1a | catattgtcacaatggcggc | ctagtggtttctcagacgca |
| 3 | zf‐cdkn1bb | gtgcccggtttctacagc | acgatgagtcgagacagga |
| 4 | zf‐cyclinD1 | actgaagatatggagcacca | cttcacagacctcgagcat |
| 5 | zf‐dacha | gtgaaccggtgcaaactcat | tgtcagtcctgttggtgaca |
| 6 | zf‐dachb | ccaggacgcccacctaagcg | tgtaccggcgttagagttca |
| 7 | zf‐dachc | gcgattcagcctggagtca | ctgttaggccagtgtgagac |
| 8 | zf‐dachd | gtcaaccgctgcaaactca | tgcagctgtgaggcctgt |
| 9 | zf‐gcga | acctggagaccagaagagca | actctggtttgggttgtccg |
| 10 | zf‐insa | ctcatctggtcgatgccctt | gtggcagcactgctctacaa |
| 11 | zf‐insb1 | actcttcacagactctgctc | acagatgctgggatggagaa |
| 12 | zf‐insb2 | catgtcctcagtctgtgtcc | gagcaaagccagcaaggtct |
| 13 | zf‐insm1a | cgactgaagtgcctttcagc | acatagcccggtagactgtc |
| 14 | zf‐insm1b | ccagtcagcaaggatcatga | cttttggctccggtctggat |
| 15 | zf‐isl1 | aagcccattacatccggcga | ctgctctttcatgagggcgt |
| 16 | zf‐mnx1 | tgatgctaacagagacgcaggtg | tactgcgcttccatttcatgcg |
| 17 | zf‐neuroD | ctttcaacacaccctagagttccg | gcatcatgctttcctcgctgtatg |
| 18 | zf‐ngn3 | caagcagacagcgtggaaat | caaagtttctgacaacgccca |
| 19 | zf‐nkx6.1 | agcccgactagcctactctt | ttcatcgtccgagtttgggt |
| 20 | zf‐nkx6.2 | ccgtttctagataccccaaac | tctccagtgcgaaaatctgc |
| 21 | zf‐pax6a | cacccgagatcagttggaaa | gttcactccactgtgactgt |
| 22 | zf‐pax6b | cagcgcaagggcttgaaac | cgtgggttggttatggtattc |
| 23 | zf‐pdx1 | cgcatggaaaggacagtgga | gtcggttctgaaaccagatc |
| 24 | zf‐ptf1a | gaactggtgcagtcggacat | ccagactttcgctgtccgaa |
| 25 | zf‐p53 | gaggtcggcaaaatcaattc | atggctgaggctgttcttc |
| 26 | zf‐rad51 | actcctgcagggaggaat | agaccataccgttcagcca |
| 27 | zf‐ripply3 | gcagtgtggatgatgctg | atctgggcagaaacagcc |
| 28 | zf‐sst2 | gcacttctgcggatgaagagatac | tgtagcgatcccagagatgagc |
| 29 | zf‐trysin | accagctgtctgatctctggatgg | cagacggcttgggtaattgcttc |
zf, zebrafish.
RNA isolation and mRNA‐seq
Total RNA was extracted and processed with DNase I (New England Biolabs, Ipswich, MA, USA), and an RNA integrity number of ≥9.7 was achieved. Ribosomal RNA depleted samples were sequenced by Macrogen Inc. (Seoul, Korea) using the Illumina TruSeq directional RNA‐seq library protocol and HiSeq 2500 (Illumina, San Diego, CA, USA), generating ~62–80 million 101 bp paired‐end reads per sample.
RNA‐Seq quality control and processing
To ensure reliable results, raw sequencing reads were inspected using FastQC (v0.11.5) 38 . After trimming the adapters and low‐quality bases (Q < 20 in 4 bp sliding window) using Trimmomatic (v0.33) 39 , RNA‐Seq reads were mapped to the zebrafish genome from the Genome Reference Consortium (GRCz10) using STAR aligner in 2‐pass mode (v2.4.2a) 40 . The HTseq‐count software (v0.6.0) 41 was used to count reads overlapping with gene annotations in Ensembl release 84. Ambiguous reads that could be mapped to multiple genomic locations were discarded. Differential gene expression analysis was carried out using the DESeq2 R/Bioconductor package (v1.6.3) 42 , which is based on the negative binomial distribution model of read counts. The fragments per kilobase of transcript per million mapped reads for each gene was also calculated by the DESeq2 package. In addition, using regularized‐logarithm‐transformed count data, a principal component analysis was carried out for the 500 most variable genes.
Gene ontology and Kyoto Encyclopedia of Genes and Genomes (KEGG) pathway enrichment analysis
The enrichment of gene ontology terms and KEGG 43 pathways were carried out using DAVID 6.8 44 , 45 . Significantly enriched gene ontology terms and pathways were defined as P < 0.05 and false discovery rate <0.2 46 .
Bioinformatics analysis for functional predictions
AnimalTFDB 3.0 47 was used to explore potential binding between dachb and the promoter regions of other key genes for endocrine differentiation of pancreatic progenitors including ptf1a, neuroD, pax6a or nkx6.
Statistical analysis
Imaging data were analyzed using ImageJ (National Institutes of Health, Bethesda, MD, USA; https://imagej.net/) and Imaris (Bitplane AG, Zurich, Switzerland). ImageJ was used to count the numbers of β‐cells and islet cells, as well as to quantify the shape and the area of the pancreatic islets. Imaris was used to calculate the β‐cell and islet cell volumes. To count the cell numbers, a z‐stack of optical sections was acquired through each islet, individual cells in each optical section were then marked in their center, and the number of cells was quantified from the number of marks. Graphs were prepared using GraphPad Prism 5 (GraphPad Prism, La Jolla, CA, USA) and data were presented as mean ± standard error of the mean. Statistical analyses were carried out with Minitab v19 (Minitab LLC., State College, PA, USA). When the data followed a Normal distribution, one‐way ANOVA followed by the Tukey’s test or the Student’s t‐test was carried out depending on whether multiple groups or just two groups were being compared, respectively. When the data did not follow a normal distribution, then the Mann–Whitney U‐test was used to compare different groups. P < 0.05 was considered to be statistically significant.
Data archiving
The RNA‐seq data for the eight samples were deposited in the Sequence Read Archive of the National Center for Biotechnology Information. The project accession number for the sequences is PRJNA527366.
Results
Development of the pancreatic islet and β‐cells in zebrafish during embryonic development
Zebrafish were dual‐immunolabeled at ~24, ~30 and ~48 hpf with antibodies to islet 1 and 2 and insulin (Figure 1). At each time point, the expression of islet 1 and 2 and insulin was found in the developing pancreas. The immunolabeling data also provided information regarding the changing shape/volume of the developing pancreas. For example, at ~24 hpf, the early pancreas was a long and narrow structure, located ventral to somites (S) 2–4 (Figure 1, 2, 3, 4, 5, 6, 7, 8, 9ii). At ~30 hpf, the cells began aggregating to form a nascent islet, which was ellipsoid in shape and ventral to S4 and S5 (Figure 1, 2, 3, 4, 5, 6, 7, 8, 9ii). By ~48 hpf, the β‐cells and islet cells had clustered into a more spherical shape, and were located adjacent to S5 (Figure 1, 2, 3, 4, 5, 6, 7, 8, 9ii).
Figure 1.
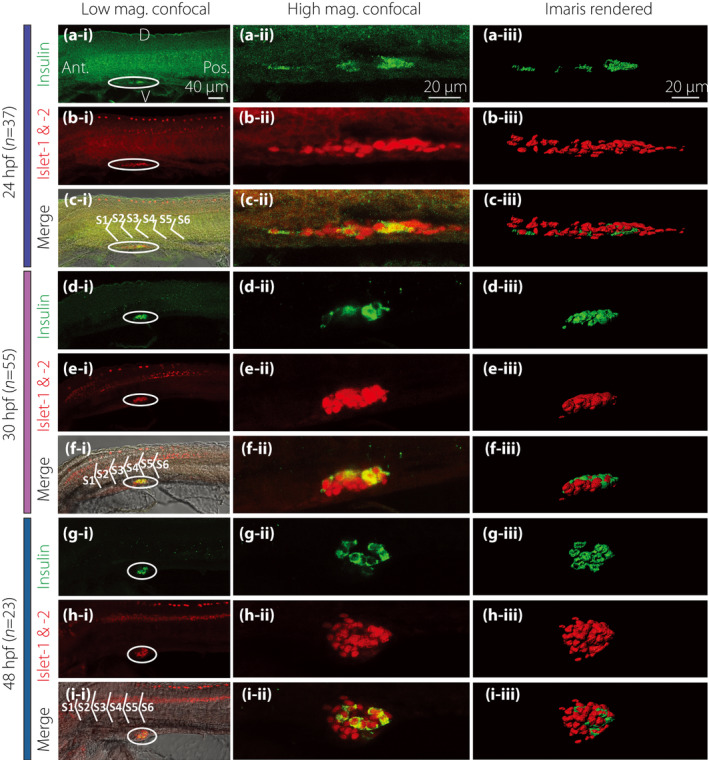
Morphology of the pancreatic islet and β‐cells at 24, 30 and 48 h post‐fertilization (hpf). Embryos were fixed at (a–c) 24 hpf (n = 37), (d–f) 30 hpf (n = 55) and (g–i) 48 hpf (n = 23). They were then de‐yolked and whole‐mount double‐immunolabeled with antibodies against insulin (green) and islet 1 and 2 (red) to show the localization of the β‐cells and islet cells in the endocrine pancreas, respectively. All images were acquired with the Leica TCS SP5 II laser scanning confocal system. The images shown in panels a‐i to i‐i were acquired at low magnification (i.e., with a ×20 HC PL APO objective lens), whereas those shown in panels a‐ii to i‐ii were acquired at a higher magnification (i.e., with a ×63 HCX PL APO water‐dipping objective lens). These are all single optical sections taken through the middle of the pancreatic islet. The images shown in panels a‐iii to i‐iii are stacks of optical images rendered as 3‐D images by the image analysis software, Imaris. (a,d,g) The localization of insulin‐positive β‐cells (in green). (b,e,h) The localization of the islet cells (in red). (c‐i,f‐i,i‐i) The co‐localization of insulin, islet 1 and 2 and bright‐field image. (c‐ii,f‐ii,i‐ii) The co‐localization of insulin and islet 1 and 2. D, dorsal; Ant., anterior; Pos., posterior; S, somite; V, ventral.
Figure 2.
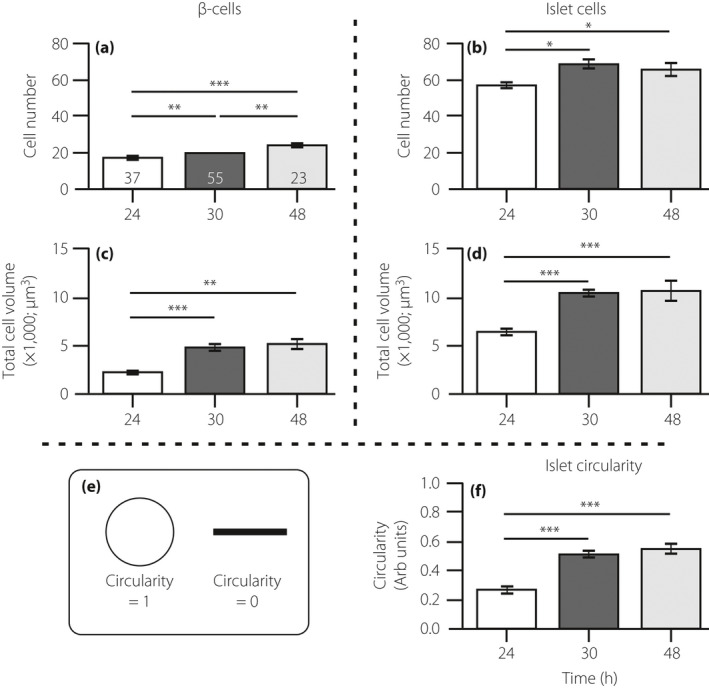
Quantification of the immunolabeling results. Embryos were fixed at 24, 30 and 48 h post‐fertilization (hpf), after which the β‐cells and islet cells were dual‐immunolabeled with an insulin antibody and islet 1 and 2 antibody, respectively. These bar graphs show the number of (a) β‐cells and (b) islet cells; the volume of cells expressing (c) insulin and (d) islet 1 and 2; and (e,f) the circularity of the islet, such that a more rounded islet has a circularity value approaching 1, whereas a more elongated islet has a circularity value near to 0. The data are shown as the mean ± standard error of n = 37, n = 55 and n = 23, at 24 hpf, 30 hpf and 48 hpf, respectively, as shown in the bars in (a). The asterisks indicate the significance difference at P < 0.05*, P < 0.01** or P < 0.001*** using the Mann–Whitney U‐test.
Figure 3.
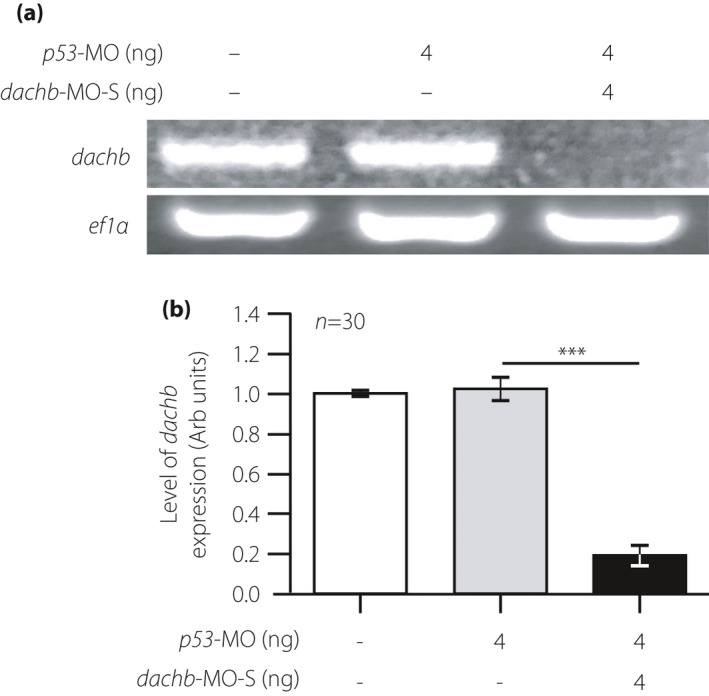
Confirming the knockdown ability of the splice‐blocking dachb‐morpholino (dachb‐MO‐S). (a) Reverse transcription polymerase chain reaction and (b) quantitative reverse transcription polymerase chain reaction showing the expression of dachb relative to ef1α in embryos at 30 h post‐fertilization, after injection at the single‐cell stage with either the p53‐MO or the dachb‐MO‐S. ef1α was used as an internal control. (b) The data are shown as the mean ± standard error of n = ~30 embryos (acquired on four different occasions) for each of the three experimental conditions used. The asterisks indicate that after injection with the dachb‐MO‐S, the level of dachb express+ion was significantly reduced (at P < 0.001***; ANOVA Tukey’s test) when compared with that in the p53‐MO‐injected group.
Figure 4.
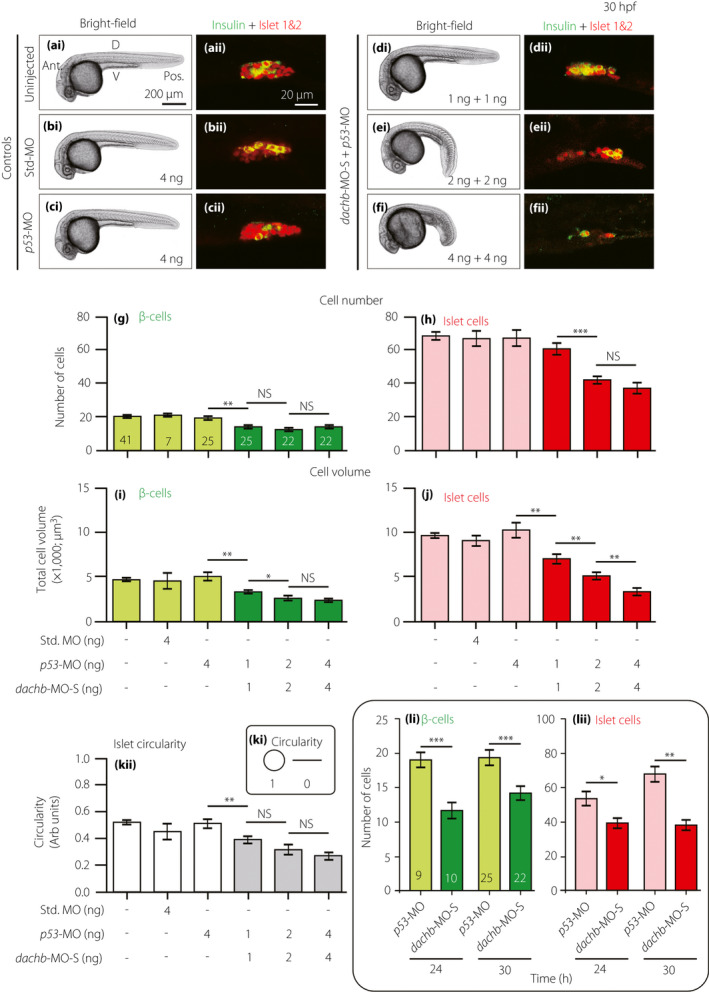
Splice‐blocking dachb‐morpholino (dachb‐MO‐S) knockdown inhibits the development of the pancreatic islet‐ and β‐cells. Embryos were (a) uninjected (control) or injected at the one‐cell stage with (b) 4 ng standard MO (Std. MO; control), (c) 4 ng p53‐MO (control) or (d,e,f) a combination of p53‐MO and dachb‐MO‐S at (d) 1 ng + 1ng, (e) 2 ng + 2 ng or (f) 4 ng + 4 ng. (ai‐fi) Bright‐field images were acquired at 30 h post‐fertilization (hpf), after which the embryos were whole‐mount double‐immunolabeled with antibodies to insulin (green) and islet 1 and 2 (red) to show the localization of the β‐cells and islet cells in the endocrine pancreas, respectively. (aii–fii) These are all single optical sections taken through the middle of pancreatic islet. (g–h) The number of (g) β‐cells and (h) islet cells, and (i,j) the volume of (i) β‐cells and (j) islet cells. (k) The circularity of the pancreatic islet. (l) Bar charts showing the numbers of (li) β‐cells and (lii) islet cells in embryos at 24 hpf and 30 hpf after they were injected at the one‐cell stage with either p53‐MO (controls) or p53‐MO and dachb‐MO‐S (at the amounts described above). The data are presented as the mean ± standard error of the mean of n = 7 to 41 embryos, such that the number is shown in the respective bars in panel (g). The asterisks indicate significant differences at P < 0.05*, P < 0.01** or P < 0.001*** using the Mann–Whitney U‐test. Ant., anterior; D, dorsal; NS, not significant; Pos. posterior; V, ventral.
Figure 5.
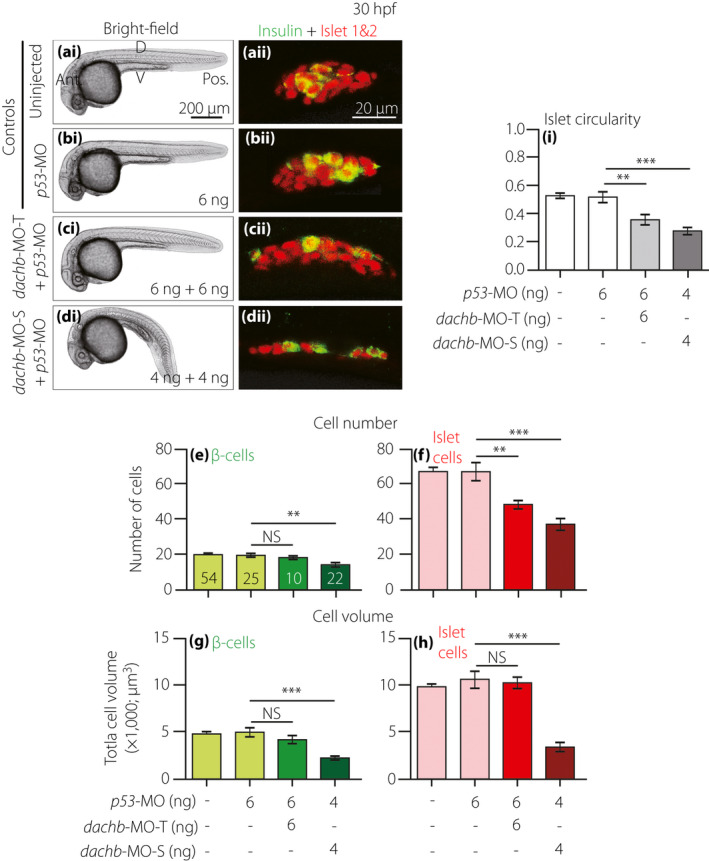
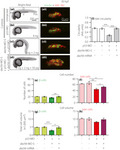
Comparison of dachb knockdown with translation‐blocking morpholino (dachb‐MO‐T) and splice‐blocking dachb‐MO (dachb‐MO‐S) on the development of the pancreatic islet. Embryos were (a) uninjected (control) or they were injected at the one‐cell stage with (b) 6 ng p53‐MO (control), (c) 6 ng dachb‐MO‐T + 6 ng p53‐MO or (d) 4 ng dachb‐MO‐S + 4 ng p53‐MO. (ai–di) Bright‐field images were acquired at 30 hpf, after which the embryos were whole‐mount double‐immunolabeled with antibodies to insulin (green) and islet 1 and 2 (red) to show the localization of the β‐cells and islet cells in the endocrine pancreas, respectively. (aii–dii) These are all single optical sections taken through the middle of the pancreatic islet. (e,f) The number of (e) β‐cells and (f) islet cells, and (g,h) the volume of (g) β‐cells and (h) islet cells. (i) The circularity of the pancreatic islet. The data are presented as the mean ± standard error of n = 10 to 54 embryos, such that the number is shown in the respective bars in panel (e). The asterisks indicate significant differences at P < 0.01** or P < 0.001*** using the Mann–Whitney U‐test. Ant., anterior; D, dorsal; NS, not significant; Pos. posterior; V, ventral.
Figure 6.
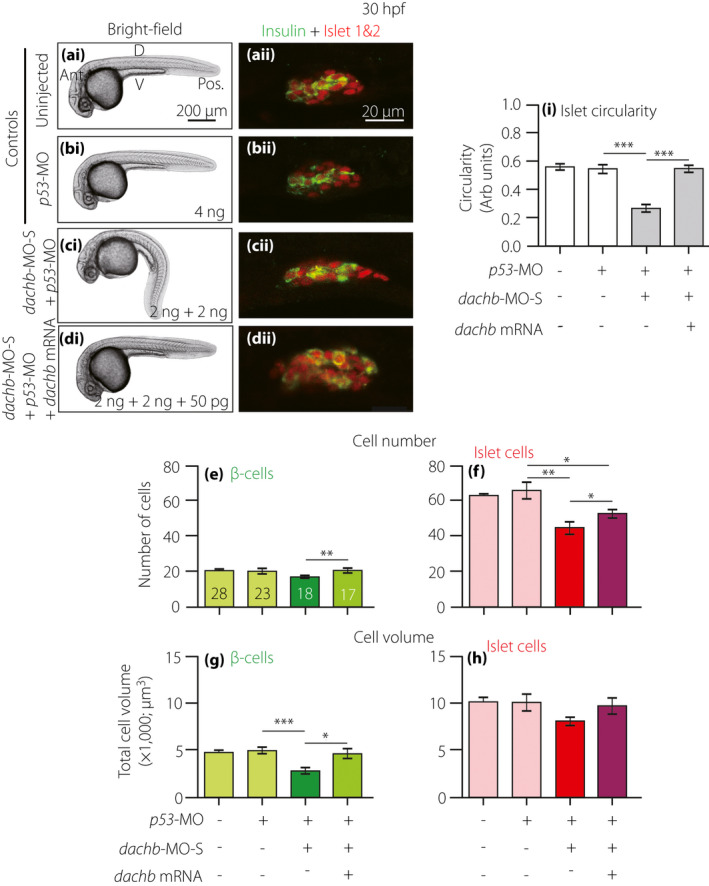
Injection of dachb messenger ribonucleic acid (mRNA) rescues the effect of splice‐blocking dachb‐morpholino (dachb‐MO‐S) on the development of the pancreatic islet in embryos at 30 h post‐fertilization (hpf). Embryos were (a) uninjected (control) or they were injected at the one‐cell stage with (b) p53‐MO (control), (c) 2 ng dachb‐MO‐S + 2 ng p53‐MO or (d) 2 ng dachb‐MO‐S + 2 ng p53‐MO + 50 pg dachb mRNA. (ai–di) Bright‐field images were acquired at 30 hpf, after which the embryos were whole‐mount double‐immunolabeled with antibodies to insulin (green) and islet 1 and 2 (red) to show the localization of the β‐cells and islet cells in the endocrine pancreas, respectively. (aii–dii) These are all single optical sections taken through the middle of pancreatic islet. (e,f) The number of (e) β‐cells and (f) islet cells, and (g,h) the volume of (g) β‐cells and (h) islet cells. (i) The circularity of the pancreatic islet. The data are presented as the mean ± standard error of n = 10 to 28 embryos, such that the number is shown in the respective bars in panel (e). The asterisks indicate significant differences at P < 0.05*, P < 0.01** or P < 0.001*** using the Mann–Whitney U‐test. Ant., anterior; D, dorsal; NS, not significant; Pos. posterior; V, ventral.
Figure 7.
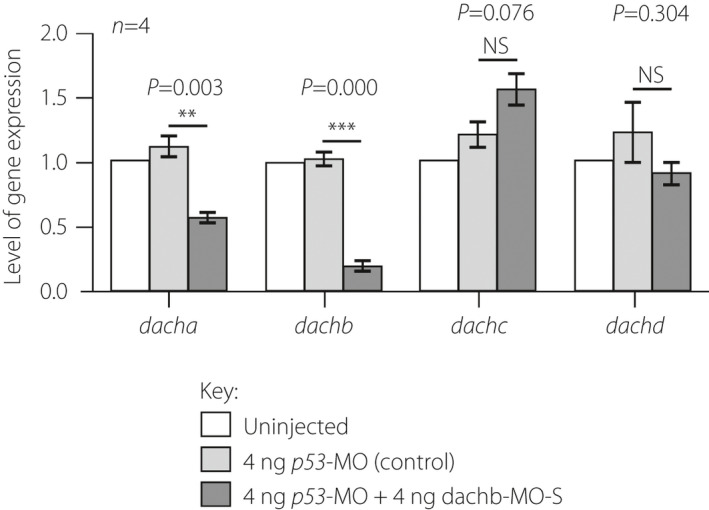
Effect of dachb knockdown on the expression of dach genes. Embryos were either uninjected or they were injected with 4 ng p53‐MO or with 4 ng splice‐blocking dachb‐morpholino (dachb‐MO‐S) + 4 ng p53‐MO and then the reverse transcription polymerase chain reaction was carried out to determine any changes in the expression of dacha, dachb, dachc and dachd. As expected, the expression of dachb was downregulated significantly in the p53‐MO + dachb‐MO group when compared with the two control groups. There was also a significant reduction of dacha expression compared with the control groups. The data are presented as the mean ± standard error of four experiments per treatment. The asterisks indicate p53‐MO + dachb‐MO data that are significantly different from the p53‐MO alone injected controls for each of the four genes at P < 0.01** or P < 0.001*** using the Student’s t‐test. NS, not significant.
Figure 8.
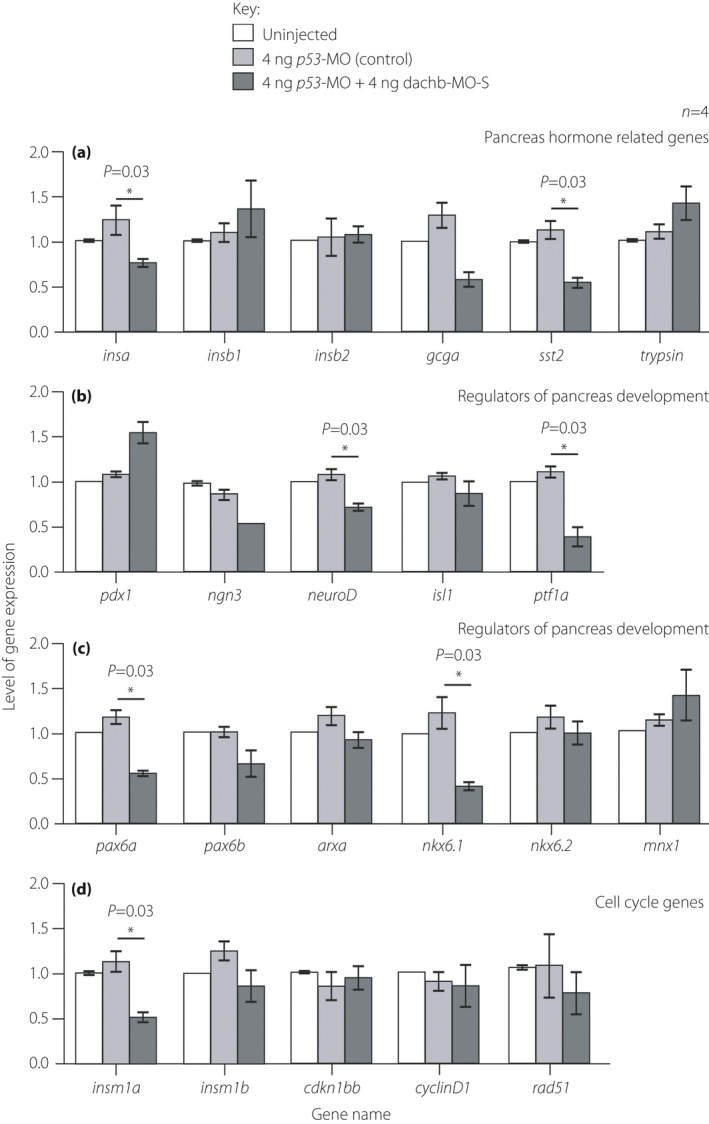
Zebrafish embryos that were co‐injected with 4 ng splice‐blocking dachb‐morpholino (dachb‐MO‐S) + 4 ng p53‐MO showed an altered expression of a number of other genes at 30 h post‐fertilization. Embryos were either uninjected or else they were injected with 4 ng p53‐MO or with 4 ng dachb‐MO‐S + 4 ng p53‐MO and then the reverse transcription polymerase chain reaction was carried out to determine any changes in the expression of various (a) pancreas hormone‐related genes; (b,c) regulators of pancreas development; and (c) cell cycle genes.The data are presented as the mean ± standard error of four experiments conducted per treatment. The asterisks indicate p53‐MO + dachb‐MO data that are significantly different from the p53‐MO alone injected controls at P < 0.05* using the Mann–Whitney U‐test.
Figure 9.
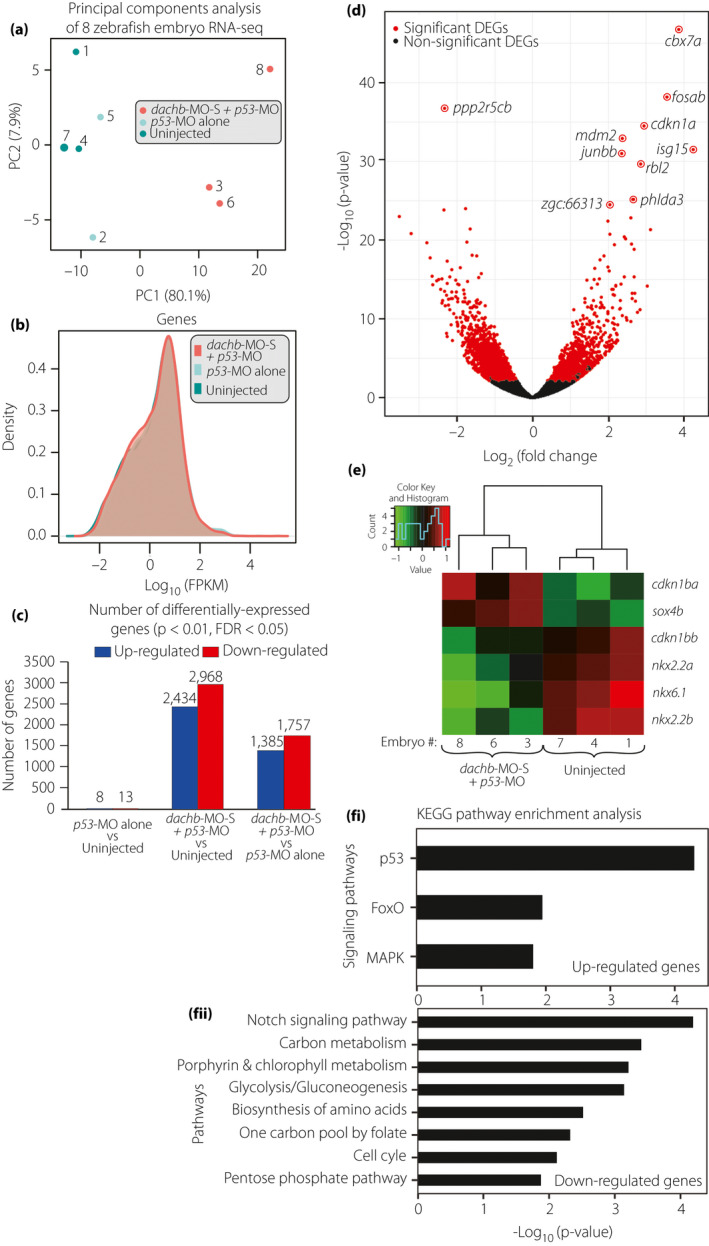
dachb knockdown changed the messenger ribonucleic acid (RNA) transcriptome profile of zebrafish embryos at 30 h post‐fertilization. (a) Principal components analysis of the RNA sequencing (RNA‐Seq) datasets. Each data point represents a zebrafish RNA‐Seq sample and the color represents the sample group: splice‐blocking dachb‐morpholino (dachb‐MO‐S) + p53‐MO (red), p53‐MO alone (light cyan) and uninjected control (dark cyan). (b) Density distribution plots of log expression level (fragments per kilobase of transcript per million) for all genes in the dachb‐MO‐S + p53‐MO (red), p53‐MO alone (light cyan) and uninjected control (dark cyan) groups. (c) Number of differentially expressed genes (P < 0.01, false discovery rate <0.05) in the three comparison groups. (d) Volcano plot of log2(Fold Change) versus –log10(P‐value) for all 27,957 genes in the dachb‐MO‐S + p53‐MO versus p53‐MO alone groups. Differentially expressed genes are in red (P < 0.01, false discovery rate <0.05). The 10 most significant differentially expressed genes in terms of P‐value are labeled. (e) Comparison of the level of expression of genes known to be involved in pancreas development after injection with dachb‐MO‐S + p53‐MO, compared with uninjected controls. (f) Significantly enriched KEGG pathways (P < 0.05, false discovery rate <0.2) of (fi) up‐ and (fii) downregulated genes in the dachb‐MO‐S + p53‐MO versus p53‐MO alone groups.
Various parameters about the β‐cells and islet cells were quantified from the immunolabeling data (Figure 2). The data showed that there was a significant increase in the number of β‐cells from ~24 to 30 hpf and from ~30 to 48 hpf (both P < 0.01; Figure 2a). There was also a significant increase in the number of islet cells between ~24 and ~30 hpf (P < 0.05; Figure 2b). Furthermore, at each time point, there were approximately threefold more islet cells than there were β‐cells (compare Figure 2a,b). As expected, with the increase in the numbers of these two cell populations, there was a corresponding increase in the β‐cell and islet volume especially between ~24 and ~30 hpf (Figure 2c,d). Quantification of the shape of the pancreatic islet (Figure 2e) showed that it was significantly more circular by ~30 hpf (P < 0.001) when compared with its more elongated appearance at ~24 hpf (Figure 2f).
Knockdown of dachb resulted in impaired islet cell development
To explore the potential role of dachb in islet development, MOs targeting dachb were utilized. The function of dachb in the development of the zebrafish pancreas was initially studied with an anti‐sense MO targeting the exon 2–intron 2 splice boundary of dachb (dachb‐MO‐S). This splice‐blocking dachb‐MO has previously been reported to knockdown dachb expression in zebrafish embryos 8 , and we confirmed its efficacy in knocking down the expression of dachb by both reverse transcription PCR and quantitative reverse transcription PCR (Figure 3a,b).
Some MOs are known to cause off‐targeting effects, such as cell death in the eyes, brain ventricles and somites 34 . This is believed to be due to the ectopic upregulation of the p53 apoptosis pathway 35 . However, co‐injection of the p53‐MO with the MO under investigation has been shown to reduce these non‐specific apoptosis effects 35 . Indeed, zebrafish embryos injected with 4 ng dachb‐MO‐S alone developed with severe morphological defects and a high level of apoptosis throughout the embryo; however, both were alleviated when embryos were co‐injected with dachb‐MO‐S and p53‐MO (Figure S2). These results suggest that dachb‐MO‐S has several off‐target effects on zebrafish embryos, but these can be ameliorated by co‐injection with p53‐MO.
Effect of knockdown of dachb on the pancreatic β‐cells and islet cells
Embryos were either kept uninjected (Figure 4a), or else they were injected at the one‐cell stage with standard control morpholino (Std‐MO; Figure 4b), 4 ng p53‐MO (Figure 4c) or with the dachb‐MO‐S + p53‐MO at 1 + 1 ng (Figure 4d), 2 + 2 ng (Figure 4e) or 4 + 4 ng (Figure 4f). The embryos were then fixed at ~30 hpf and immunolabeled with the insulin and islet 1 and 2 antibodies. Quantification of Imaris‐rendered images of the immunolabeled regions showed that the development of the pancreatic β‐cells and islet cells was significantly affected after co‐injection of embryos with the dachb‐MO‐S + p53‐MO, when compared with the uninjected, Std‐MO‐injected or p53‐MO‐injected control embryos (compare Figure 4dii–fii with Figure 4aii–cii). In some instances, there was a dose‐dependent effect as the amount of dachb‐MO‐S + p53‐MO was increased from 1 + 1 ng to 4 + 4 ng. Such an effect was observed for the volume of β‐cells and islet cells (Figure 4i,j), as both decreased significantly in a dose‐dependent manner with the increase in the amount of MOs injected. When comparing the numbers of β‐cells and islet cells, however, such a dose‐dependent effect was not obvious, although there was a significant decrease (P < 0.01) in the β‐cell number when comparing dachb‐MO‐S + p53‐MO at 1 ng with the p‐53‐MO control (Figure 4g), and there was a significant decrease (P < 0.001) in the islet cell number when comparing dachb‐MO‐S + p53‐MO at 1 ng with that at 2 ng (Figure 4h). The effect of dachb‐MO‐S + p53‐MO on the shape of the pancreatic islet was also shown (Figure 4ki), such that there was a significant (P < 0.01) reduction in the ‘circularity value’ when comparing dachb‐MO‐S + p53‐MO at 1 ng with the p‐53‐MO control (Figure 4kii). Injection of dachb‐MO‐S + p53‐MO also significantly reduced the numbers of β‐cells and islet cells at 24 hpf (Figure 4li, lii). A terminal deoxynucleotidyl transferase dUTP nick end labeling assay confirmed that the changes in the pancreatic islet observed on injection of dachb‐MO‐S + p53‐MO was not due to apoptosis in the pancreas (Figure S3).
Comparison of dachb knockdown with splice‐blocking and translation‐blocking MOs
To verify the effects observed by the dachb‐MO‐S, a second MO, designed to target the translational start site of dachb (dachb‐MO‐T), was utilized (Figure 5). Embryos were either kept uninjected (Figure 5a), or else they were injected at the one‐cell stage with 6 ng p53‐MO (Figure 5b), 6 ng dachb‐MO‐T + 6 ng p53‐MO (Figure 5c) or 4 ng dachb‐MO‐S + 4 ng p53‐MO (as a positive control; Figure 5d). The embryos were then fixed at ~30 hpf and immunolabeled with the antibodies described earlier. We showed that co‐injection of dachb‐MO‐T + p53‐MO had no gross morphological effect on embryos, although the pancreas was more elongated than the controls (compare Figure 5ci with Figure 5ai,bi, and Figure 5cii with Figure 5aii,bii). However, it was not as extended as the pancreas in the embryos co‐injected with 4 ng dachb‐MO‐S + 4 ng p53‐MO (compare Figure 5cii with Figure 5dii). In addition, the pancreatic islet of dachb‐MO‐T‐injected embryos developed with somewhat similar β‐cell numbers (Figure 5e) and β‐cell and islet cell volumes (Figure 5g,h) as the controls, although there was a significant (P < 0.01) reduction in the number of islet cells (Figure 5f). In addition, the shape of the pancreatic islet was significantly different (P < 0.01) in the dachb‐MO‐T group, when compared with the controls (Figure 5i). Injecting dachb‐MO‐T at 4 ng (i.e., the amount of dachb‐MO‐S injected) had no effect on the development of the pancreatic islet, whereas increasing the dose above 6 ng was associated with reduced survival of embryos to 30 hpf (data not shown).
Co‐injection with dachb mRNA restores normal development of the islet and pancreatic β‐cells
To investigate if the effects of dachb‐MO‐S were specific, embryos were co‐injected with dachb‐MO‐S and wild‐type dachb mRNA (cloned from the cDNA library of wild‐type AB zebrafish embryos at 24 hpf), in an attempt to rescue the morphant phenotype (Figure 6). Thus, embryos were either kept uninjected (Figure 6a) or they were injected with 4 ng p53‐MO (Figure 6b); 2 ng dachb‐MO‐S + 2 ng p53‐MO (Figure 6c) or 2 ng dachb‐MO‐S + 2 ng p53‐MO + 50 pg dachb mRNA (Figure 6d). The MOs were injected into the yolk and the mRNA was injected into the blastodisc of embryos at the one‐cell stage. The bright‐field images show that the embryos injected with dachb mRNA exhibited a similar phenotype as the controls (compare Figure 6di with Figure 6ai,bi). In addition, as demonstrated in the previous results (Figures 4,5), embryos injected with dachb‐MO‐S + p53‐MO showed incomplete tail straightening (Figure 6ci). The immunolabeling results showed that the embryos injected with dachb‐MO‐S + p53‐MO developed a longer and narrower pancreatic islet (Figure 6cii). However, after co‐injection of dachb‐MO‐S + p53‐MO with dachb mRNA, ~60% of embryos showed complete tail straightening (Figure 6di), and the immunolabeling results showed that the normal pancreatic β‐cell and islet morphology was preserved (Figure 6dii).
When the cell numbers and islet volume and shape were quantified, the β‐cell number (Figure 6e) and islet cell volume (Figure 6h) were both reduced slightly, but not significantly in the dachb‐MO‐S + p53‐MO group, when compared with the p53‐MO controls, whereas the islet cell number (Figure 6f) and β‐cell volume (Figure 6g) were significantly decreased. In addition, the circularity value was significantly lower in the dachb‐MO‐S + p53‐MO group, indicating a more elongated morphology (Figure 6i). Co‐injection of dachb‐MO‐S + p53‐MO with dachb mRNA resulted in the pancreatic β‐cell number and volume, and the islet cell number increasing significantly, when compared with the dachb‐MO‐S + p53‐MO‐injected group (Figure 6e–g). However, although the pancreatic islet cell volume appeared to be greater in the dachb mRNA injected group, the data were not significantly different from the MO‐alone‐injected embryos (Figure 6h). The circularity value of the pancreatic islet in the dachb mRNA injected group was significantly increased (P < 0.001) such that it was almost the same as that in the control groups, showing a more rounded (mature) morphology (Figure 6i).
Effect of dachb knockdown on expression of dachb and other dach genes
The expression of the various dach family genes after knockdown of dachb was examined (Figure 7). mRNA was collected at 30 hpf from uninjected embryos (controls) and embryos injected with 4 ng dachb‐MO‐S alone or with 4 ng dachb‐MO‐S + 4 ng p53‐MO. As expected, injection of embryos with dachb‐MO‐S + p53‐MO was associated with a significant (P < 0.001) downregulation of dachb. In addition, dacha expression was also significantly decreased (P < 0.01), but dachc and dachd were not significantly affected (Figure 7).
Knockdown of dachb resulted in the downregulation of a number of genes implicated in islet development
The expression of various genes reported to play a role in islet development was also examined after dachb knockdown (Figure 8). In line with our observation that dachb gene knockdown resulted in a reduction in the number of β‐cells and islet cells, we also showed that this was associated with a downregulation of the β‐cell specific marker gene insa, but not insb1 and insb2 (Figure 8a). There was also significant downregulation of the expression of the somatostatin cell marker gene, sst2. However, there was no significant change in the expression of the exocrine acinar cell marker gene, trypsin (Figure 8a).
The expression level of genes related to pancreas development was also evaluated after dachb knockdown (Figure 8b,c). The expression of ptf1a, a marker of exocrine pancreas development, and neuroD, a marker of early pancreas development (similar to ptf1a), were both significantly downregulated when dachb was knocked down (Figure 8b). The expression of the α‐cell differentiation marker pax6a was also significantly decreased, but pax6b and arxa were not affected (Figure 8c). Furthermore, the expression of nkx6.1, a gene thought to be required for specifying the endocrine α‐cells and β‐cells, was significantly decreased, but the level of expression of nkx6.2 and mnx1 were not affected (Figure 8c).
The expression level of genes involved in the cell cycle were also investigated (Figure 8d). The expression of insm1a was significantly decreased, when compared with the control group, but insm1b was not affected. In addition, the expression levels of cdkn1bb, cyclinD1 and red51 were also not affected.
Taken together, dachb knockdown in zebrafish embryos appeared to reduce the expression of several genes related to endocrine pancreas development, endocrine cell proliferation and endocrine hormone production.
AnimalTFDB 3.0 was used to explore binding between dachb and the promoter regions of ptf1a, neuroD, pax6a or nkx6. Although dachb was not among the transcription factors predicted to bind to the promoter regions of the four genes, another related gene on the list, pdx1, has been shown to co‐localize with dach1 protein in the mouse model 8 . Like dachb in zebrafish, dach1 is the main dach variant found in the pancreas in mice. In addition, in human studies, the transcriptional activation of DACH1 was reported to involve CREB‐binding protein 48 , which is another transcription factor predicted to bind to the promoter region of the four genes. Taken together, dachb might act on ptf1a, neuroD, pax6a or nkx6.1 through the actions of pdx1 and/or crebbp.
Transcriptome profiling and identification of novel targets of dachb through RNA‐seq
Three zebrafish embryos that had been injected with dachb‐MO‐S + p53‐MO, two embryos that had been injected with p53‐MO alone (control), and three embryos that were kept uninjected (control) were subjected to RNA‐seq (Figure 9). On average ~94% of the reads remained after quality trimming. The trimmed reads were mapped to the zebrafish reference genome (GRCz10), and 87–88% of these reads were shown to be uniquely mapped. Additional RNA‐seq alignment statistics are presented in (Table 2). Gene expression quantification showed that 18,446–18,951 out of 27,957 genes (65.98–67.79%) in the Ensembl gene annotations release 84 were detected with a mean fragments per kilobase of transcript per million value >0.5 (Table 2). A principal component analysis of the gene expression levels showed clear segregation of the dachb‐MO‐S + p53‐MO samples from the two control groups along the first principal component; this might explain 80.1% of the variance (Figure 9a).
Table 2.
Summary statistics of ribonucleic acid sequencing alignment
| Sample name | No. raw/trimmed read pairs | Trimmed reads (%) | Uniquely mapped reads (%) | Multiple‐mapped reads (%) | Unmapped reads (%) | mRNA bases (%) | Intronic bases (%) | Intergenic bases (%) | Ribosomal bases (%) | FPKM value >0.5 (%) |
|---|---|---|---|---|---|---|---|---|---|---|
| 1 | 31,953,308/29,688,353 | 92.91 | 87.94 | 7.31 | 4.75 | 51.29 | 19.71 | 9.89 | 19.16 | 67.17 |
| 2 | 39,224,318/37,169,741 | 94.76 | 87.96 | 5.81 | 6.24 | 65.13 | 14.35 | 7.72 | 12.88 | 66.46 |
| 3 | 35,482,230/33,083,450 | 93.24 | 87.71 | 6.64 | 5.64 | 53.56 | 17.58 | 9.32 | 19.61 | 66.88 |
| 4 | 38,272,230/36,277,063 | 94.79 | 88.17 | 5.39 | 6.44 | 61.79 | 14.70 | 7.71 | 15.89 | 65.98 |
| 5 | 31,033,904/28,950,940 | 93.29 | 88.74 | 5.97 | 5.29 | 51.94 | 19.83 | 8.93 | 19.35 | 67.02 |
| 6 | 37,381,919/35,302,991 | 94.44 | 87.44 | 5.34 | 7.22 | 57.62 | 15.43 | 8.38 | 18.37 | 66.87 |
| 7 | 39,875,759/37,609,218 | 94.32 | 88.64 | 5.53 | 5.83 | 60.88 | 16.66 | 8.35 | 14.18 | 66.94 |
| 8 | 38,469,136/35,834,990 | 93.15 | 87.25 | 7.28 | 5.45 | 45.07 | 23.41 | 12.14 | 19.43 | 67.79 |
FPKM, fragments per kilobase of transcript per million; mRNA, messenger ribonucleic acid.
A comparison of the dachb‐MO‐S + p53‐MO group versus the p53‐MO alone control group showed 1,385 and 1,757 significantly up‐ and downregulated genes, respectively (P < 0.01; false discovery rate <0.05; Figure 9b). In addition, 2,434 and 2,968 genes were significantly up‐ and downregulated when comparing the dachb‐MO‐S + p53‐MO group with the untreated control group (Figure 9c). The two control groups showed much less expression difference, as just 21 genes were detected as being significant differentially expressed genes (DEGs; Figure 9c). For this reason, we compared the dachb‐MO‐S + p53‐MO and the p53‐MO alone control groups for the rest of the RNA‐seq analysis.
The top 10 most significant DEGs in terms of P‐value were cbx7a, fosab, ppp2r5cb, cdkn1a, mdm2, isg15, junbb, rbl2, phlda3 and zgc:66313 (Figure 9d). Among these, isg15 and cbx7a showed the largest absolute change in expression levels, with 4.23‐ and 3.86‐log2‐fold upregulation, respectively, after dachb knockdown. Furthermore, ppp2r5cb was identified as the most significantly downregulated gene, showing 2.33‐log2‐fold lower expression after dachb knockdown (Figure 9d, Table S1 48 ). RNA‐seq analysis confirmed the expression changes in key genes observed initially by qPCR. These included the downregulation of pax6, as well as the ~3‐fold increase in cdkn1a expression after dachb knockdown (Table S1 49 ).
A KEGG pathway and gene ontology enrichment analysis in the dachb‐MO‐S + p53‐MO group versus the uninjected control group are provided in Table S2 50 , and a heat‐map of expression profile highlighting the altered expression of genes related to pancreas development is shown in Figure 9e. A KEGG pathway enrichment analysis was independently carried out for the significantly up‐ or downregulated genes (P < 0.05; false discovery rate <0.2; Figure 9f, Table S2 50 ). After dachb knockdown, the upregulated genes were found to be enriched in the p53, forkhead box O (FoxO), and mitogen‐activated protein kinase signaling pathways (Figure 9fi), whereas the downregulated genes were enriched in eight pathways, including the notch signaling, carbon metabolism, and porphyrin and chlorophyll metabolism pathways (Figure 9fii). The upregulation of the p53 signaling pathway is not surprising, as although the co‐injection of p53‐MO can largely ameliorate the induction of the p53 pathway after dachb‐MO injection, it might not eliminate this effect completely 34 . In line with our qPCR results, the FoxO signaling pathway was identified as one of the most significantly enriched pathways among the upregulated genes (Figure 9fi). Indeed, among the top 10 most significant DEGs, cdkn1a, mdm2 and rbl2 belong to the FoxO signaling pathway. In zebrafish, foxo3b plays a central role in this pathway, and foxo3b expression was increased 1.64 log2‐fold after dachb knockdown. Other FoxO signaling pathway members, including bcl2l11, cdkn1ba, gadd45aa, gadd45ba, gadd45bb, gadd45ga, irs1, map2k1, pik3r3a, plk2a, plk2b, prkaa1 and stat3 also showed 0.70–2.94 log2‐fold upregulation (see Table S1 49 ).
A gene ontology enrichment analysis was also carried out for the DEGs to determine the biological processes involved. We showed that the significantly upregulated genes were involved in several developmental processes, including cilium movement, determination of left/right symmetry and notochord development. In addition, the downregulated genes were shown to be involved in processes, such as nucleosome assembly, membrane disruption (in other organisms) and DNA‐templated regulation of transcription (see Table S2 50 ).
Discussion
In the present study, we explored the role of dachb in the development of the zebrafish pancreatic islet and its β‐cells. We concentrated our efforts on dachb alone, because it has previously been reported that in zebrafish, dacha, dachc and dachd are not expressed in the developing pancreas 8 . The present data showed that dachb knockdown with the dachb‐MO‐S significantly decreased the number and volume of both pancreatic β‐cells and islet cells (Figure 4g‐4j). This effect of the dachb‐MO‐S was observed at 24 hpf (Figure 4l), when a small islet is known to form in the dorsal bud, as well as at 30 hpf when the ventral bud is forming 24 , 28 . There was also reduced pancreatic islet circularity, which might indicate a more immature islet (Figure 4kii). Indeed, we showed that between ~24 and 30 hpf during normal pancreatic development, the islet changed from a more elongated to a more spherical shape (Figure 3f). Such a change in shape during normal islet development has also been reported previously 51 . However, we showed that knockdown of dachb generated pancreatic islets at ~30 hpf that were elongated to a somewhat similar level as the untreated ~24 hpf islets (compare Figure 4kii with Figure 3f). To a certain extent, these effects were also observed by the injection of dachb‐MO‐T. The knockdown effects caused by dachb‐MO‐S were partially rescued by the co‐injection of wild‐type dachb mRNA, which suggests a high degree of specificity with respect to the action of the dachb‐MO‐S. In addition, the terminal deoxynucleotidyl transferase dUTP nick end labeling assay did not show increased apoptosis after dachb knockdown (Figure S2), which suggests that there is likely to be impaired growth with reduced cell proliferation in the pancreas of these morphants. Our reverse transcription PCR data (Figure 7) showed that in addition to knocking down the expression of dachb, the dachb‐MO‐S also attenuated the expression of dacha. However, previous studies showed that dacha is expressed in the brain, spinal cord, eye and otic vesicle of developing zebrafish embryos 29 , but it is not expressed in the pancreatic islet 8 . Thus, taken together, the present data suggest that in zebrafish, dachb might play a role in the development of the β‐cells and that of the pancreatic islet as a whole.
It has been previously reported that in zebrafish, dachb expression peaks at ~24 hpf, and it persists until ~30 hpf (which is coincident with the formation of the dorsal pancreatic bud), after which it is dramatically reduced 8 . The present data showed that at ~30 hpf after dachb knockdown there was a significant decrease in the number of β‐cells when compared with the controls. A similar effect was observed with the pancreatic islet cell number. These results suggest a possible link between dachb expression and β‐cell and islet development. Interestingly, we also showed that the expression level of some endocrine hormone genes (insa and sst2), were also significantly downregulated in the dachb‐MO‐S injected group, when compared with the control groups, whereas the expression of the exocrine pancreas marker, trypsin, remained unchanged.
Our new data suggest that dachb expression in the developing zebrafish pancreas might represent part of an evolutionarily conserved genetic network governing the formation of insulin‐producing cells, and other hormone secreting cells, through the regulation of the cell cycle 8 , 52 , 53 . Our gene expression data support this view in that insm1a, which encodes a protein to promote the transition of ductal progenitor cells to committed endocrine cells through the activation of cellular proliferation control genes, was downregulated significantly in the dachb‐MO‐S injected groups. Furthermore, it has been reported that insm1a can bind to the neuroD/β2 promoter, resulting in the recruitment of cyclin D1 53 , a key regulator of cell cycle progression.
Our RNA‐sequencing analysis was carried out with whole embryos rather than with isolated pancreatic islets and so, as such, we cannot identify the specific cell types that account for the altered gene expression found. We propose that future RNA‐sequencing analysis after FACS‐based cell separation could be carried out to identify the specific cell types involved. However, our data identified FoxO signaling as one the main pathways affected by the pan‐embryonic knockdown of dachb. DACH1 is reported to attenuate forkhead‐dependent transcriptional activity in human embryonic kidney 293T cells, including a FoxO family member, FOXO1 54 . In addition, Dach1 knockdown in a β‐cell‐derived rat insulinoma cell line resulted in reduced levels of insulin 8 , 54 , whereas insulin activated phosphoinositide dependent kinase 1 and protein kinase B through insulin receptor substrate, inhibiting FoxO transcriptional activity as a result 55 . We report that in zebrafish, there was no significant change in the expression level of ins and insr after dachb knockdown (data not shown). Thus, as has previously been suggested 56 , dachb might regulate FoxO signaling in an insulin‐independent manner. Of note, the FoxO pathway is also known to be a key pathway regulating β‐cell dedifferentiation and β‐cell mass 56 .
The endocrine cell marker gene, neuroD, and the exocrine cell maker gene ptf1a were both downregulated in the dachb‐MO‐S‐injected group. NeuroD is a downstream effector of Ngn3 and has been found to be essential for pancreatic islet development, especially the development of β‐cells 57 , 58 . As reported from previous studies, the inability of ptf1a to bind the vertebrate suppressor of hairless prevents the secondary transition (early pancreatic development requires the vertebrate suppressor of hairless in the ptf1 bHLH complex), although early endocrine cells can be found in the ptf1a‐null mouse. Nevertheless, ptf1a knockout mice develop pancreatic hypoplasia and permanent neonatal diabetes 59 , 60 . We also showed that pax6a and nkx6.1, which are associated with the maturation of β‐cells and α‐cells, respectively, were significantly downregulated as a result of dachb knockdown. Interestingly, the downregulated genes identified are all downstream targets of neuroD. Taken together, these results suggest that dachb might also downregulate the expression of genes (neuroD, ptf1a, pax6a and nkx6.1) involved in pancreatic islet development. It should be noted that a key role of PAX6 in β‐cell development, β‐cell identity, glucose sensing and insulin secretion has also been shown in mice 61 .
In conclusion, in the present study, we suggest a role for dachb in the development of islet‐ and β‐cells in zebrafish. The findings of these animal‐based studies might also support the possible causal nature of the risk association of DACH1 with type 2 diabetes in humans, which was first discovered in Asian individuals 3 . Strategies that modulate the expression and activity of dachb in zebrafish might therefore provide a novel approach for the future design and development of new treatments for diabetes in humans.
Disclosure
JCNC and RCWM hold a US patent for using DACH1 as a biomarker for diabetes. They are also founding members of GEMVCARE, a genetic testing and biotech company established through a Hong Kong Government grant. The other authors report no conflict of interest.
Supporting information
Figure S1. p53 knock‐down ameliorated the neural cell death induced by the off target effect of MO in zebrafish embryos at 30 hpf.
Figure S2. Dachb knock‐down does not induce apoptosis in the pancreas.
Figure S3. Schematics showing the (ai) splice‐blocking (MO‐S) and (aii) translation‐blocking (MO‐T) MOs used, and (b) the structure of the pBlueScriptII KS (+) vector containing the zebrafish dachb gene.
Table S1. Changes in gene expression in dachb knock‐down strain.
Table S2. Results of Gene ontology and KEGG pathway enrichment analysis.
Acknowledgments
RCWM and JCNC were partially supported by a Research Grants Council (RGC) Theme‐based Research Scheme grant (T12‐402/13N). NJ and TFC were partially supported by an RGC General Research Fund (GRF) grant (14102014) and an Area of Excellence Scheme grant (AoE/M‐403/16). ALM and SEW were partially supported by RGC GRF grants (16100115 and 16100719) and the Hong Kong Innovation and Technology Commission (ITCPD/17‐9).
J Diabetes Investig 2021; 12: 710–727
Andrew L Miller and Ronald CW Ma jointly supervised the work.
Lingling Yang and Sarah E Webb are joint first authors.
Contributor Information
Andrew L Miller, Email: almiller@ust.hk.
Ronald CW Ma, Email: rcwma@cuhk.edu.hk.
References
- 1. Tabak AG, Jokela M, Akbaraly TN, et al. Trajectories of glycaemia, insulin sensitivity, and insulin secretion before diagnosis of type 2 diabetes: an analysis from the Whitehall II study. Lancet 2009; 373: 2215–2221. [DOI] [PMC free article] [PubMed] [Google Scholar]
- 2. Ohn JH, Kwak SH, Cho YM, et al. 10‐year trajectory of β‐cell function and insulin sensitivity in the development of type 2 diabetes: a community‐based prospective cohort study. Lancet Diabetes Endocrinol 2016; 4: 27–34. [DOI] [PubMed] [Google Scholar]
- 3. Ma RC, Lee HM, Lam VK, et al. Familial young‐onset diabetes, pre‐diabetes and cardiovascular disease are associated with genetic variants of DACH1 in Chinese. PLoS One 2014; 9: e84770. [DOI] [PMC free article] [PubMed] [Google Scholar]
- 4. Kim SK, MacDonald RJ. Signaling and transcriptional control of pancreatic organogenesis. Curr Opin Genet Dev 2001; 12: 540–547. [DOI] [PubMed] [Google Scholar]
- 5. Mardon G, Solomon NM, Rubin GM. dachshund encodes a nuclear protein required for normal eye and leg development in Drosophila . Development 1994; 120: 3473–3486. [DOI] [PubMed] [Google Scholar]
- 6. Clements J, Hens K, Francis C, et al. Conserved role for the Drosophila Pax6 homolog Eyeless in differentiation and function of insulin‐producing neurons. Proc Natl Acad Sci USA 2008; 105: 16183–16188. [DOI] [PMC free article] [PubMed] [Google Scholar]
- 7. Davis RJ, Pesah YI, Harding M, et al. Mouse Dach2 mutants do not exhibit gross defects in eye development or brain function. Genesis 2006; 44: 84–92. [DOI] [PubMed] [Google Scholar]
- 8. Kalousova A, Mavropoulos A, Adams BA, et al. Dachshund homologues play a conserved role in islet cell development. Dev Biol 2010; 348: 143–152. [DOI] [PMC free article] [PubMed] [Google Scholar]
- 9. Pack M, Solnica‐Krezel L, Malicki J, et al. Mutations affecting development of zebrafish digestive organs. Development 1996; 123: 321–328. [DOI] [PubMed] [Google Scholar]
- 10. Argenton F, Zecchin E, Bortolussi M. Early appearance of pancreatic hormone‐expressing cells in the zebrafish embryo. Mech Dev 1999; 87: 217–221. [DOI] [PubMed] [Google Scholar]
- 11. Gnügge L, Meyer D, Driever W. Pancreas development in zebrafish. Meth Cell Biol 2004; 76: 531–551. [DOI] [PubMed] [Google Scholar]
- 12. Prince VE, Anderson RM, Dalgin G. Zebrafish pancreas development and regeneration: Fishing for diabetes therapies. Curr Top Dev Biol 2017; 124: 235–276. [DOI] [PubMed] [Google Scholar]
- 13. Kinkel MD, Prince VE. On the diabetic menu: Zebrafish as a model for pancreas development and function. BioEssays 2009; 31: 139–152. [DOI] [PMC free article] [PubMed] [Google Scholar]
- 14. Olsen AS, Sarras MP Jr, Intine RV. Limb regeneration is impaired in an adult zebrafish model of diabetes mellitus. Wound Repair Regen 2010; 18: 532–542. [DOI] [PMC free article] [PubMed] [Google Scholar]
- 15. Zang L, Shimada Y, Nishimura N. Development of a novel zebrafish model for Type 2 diabetes mellitus. Sci Rep 2017; 7: 1461. [DOI] [PMC free article] [PubMed] [Google Scholar]
- 16. Zang L, Maddison LA, Chen W. Zebrafish as a model for obesity and diabetes. Front Cell Dev Biol 2018; 6: 91. [DOI] [PMC free article] [PubMed] [Google Scholar]
- 17. King A. Researchers find their Nemo. Cell 2009; 139: 843–846. [DOI] [PubMed] [Google Scholar]
- 18. Godinho L. Live imaging of zebrafish development. Cold Spring Harb Protoc 2011; 2011: pdb.top119. [DOI] [PubMed] [Google Scholar]
- 19. Meyers JR. Zebrafish: Development of a vertebrate model organism. Curr Prot Ess Lab Tech 2018; e19. [Google Scholar]
- 20. Tiso N, Moro E, Argenton F. Zebrafish pancreas development. Mol Cell Endocrinol 2009; 312: 24–30. [DOI] [PubMed] [Google Scholar]
- 21. Li Z, Wen C, Peng J, et al. Generation of living color transgenic zebrafish to trace somatostatin‐expressing cells and endocrine pancreas organisation. Differentiation 2009; 77: 128–134. [DOI] [PubMed] [Google Scholar]
- 22. Dassaye R, Naidoo S, Cerf ME. Transcription factor regulation of pancreatic organogenesis, differentiation and maturation. ISLETS 2016; 8: 13–34. [DOI] [PMC free article] [PubMed] [Google Scholar]
- 23. Peterson MBK, Azad A, Ingvorsen C, et al. Single‐cell gene expression analysis of a human ESC model of pancreatic endocrine development reveals different paths to β‐cell differentiation. Stem Cell Rep 2017; 9: 1246–1261. [DOI] [PMC free article] [PubMed] [Google Scholar]
- 24. Biemar F, Argenton F, Schmidtke R, et al. Pancreas development in zebrafish: Early dispersed appearance of endocrine hormone expressing cells and their convergence to form the definitive islet. Dev Biol 2001; 230: 189–203. [DOI] [PubMed] [Google Scholar]
- 25. Binot A‐C, Manfroid I, Flasse L, et al. Nkx6.1 and nkx6.2 regulate α‐ and β‐cell formation in zebrafish by acting on pancreatic endocrine progenitor cells. Dev Biol 2010; 340: 397–407. [DOI] [PubMed] [Google Scholar]
- 26. Wilfinger A, Arkhipova V, Meyer D. Cell type and tissue specific function of islet genes in zebrafish pancreas development. Dev Biol 2013; 378: 25–37. [DOI] [PMC free article] [PubMed] [Google Scholar]
- 27. Yee NS, Yusuff S, Pack M. Zebrafish pdx1 morphant displays defects in pancreas development and digestive organ chirality, and potentially identifies a multipotent pancreas progenitor cell. Genesis 2001; 30: 137–140. [DOI] [PubMed] [Google Scholar]
- 28. Field HA, Dong PDS, Beis D, et al. Formation of the digestive system in zebrafish. II. Pancreas morphogenesis. Dev Biol 2003; 261: 197–208. [DOI] [PubMed] [Google Scholar]
- 29. Hammond KL, Hill RE, Whitfield TT, et al. Isolation of three zebrafish dachshund homologues and their expression in sensory organs, the central nervous system and pectoral fin buds. Mech Dev 2002; 112: 183–189. [DOI] [PubMed] [Google Scholar]
- 30. Westerfield M. The Zebrafish Book: a guide for the laboratory use of zebrafish (Danio rerio). University of Oregon Press, Eugene, 2000. [Google Scholar]
- 31. Webb SE, Lee KW, Karplus E, et al. Localized calcium transients accompany furrow positioning, propagation, and deepening during the early cleavage period of zebrafish embryos. Dev Biol 1997; 192: 78–92. [DOI] [PubMed] [Google Scholar]
- 32. Cheung CY, Webb SE, Love DR, et al. Visualization, characterization and modulation of calcium signaling during the development of slow muscle cells in intact zebrafish embryos. Int J Dev Biol 2011; 55: 153–174. [DOI] [PubMed] [Google Scholar]
- 33. Kelu JJ, Chan HL, Webb SE, et al. Two‐Pore Channel 2 activity is required for slow muscle cell‐generated Ca2+ signaling during myogenesis in intact zebrafish. Int J Dev Biol 2015; 59: 313–325. [DOI] [PMC free article] [PubMed] [Google Scholar]
- 34. Robu ME, Larson JD, Nasevicius A, et al. p53 activation by knockdown technologies. PLoS Genet 2007; 3: e78. [DOI] [PMC free article] [PubMed] [Google Scholar]
- 35. Bill BR, Petzold AM, Clark KJ, et al. A primer for morpholino use in zebrafish. Zebrafish 2009; 6: 69–77. [DOI] [PMC free article] [PubMed] [Google Scholar]
- 36. Eisen JS, Smith JC. Controlling morpholino experiments: don't stop making antisense. Development 2008; 135: 1735–1743. [DOI] [PubMed] [Google Scholar]
- 37. Webb SE, Miller AL. Microinjecting holo‐aequorin into dechorionated and intact zebrafish embryos. Cold Spring Harb Protoc 2013; 2013: pdb.prot072967. [DOI] [PubMed] [Google Scholar]
- 38. FastQC AS.A quality control tool for high throughput sequence data. http://www.bioinformatics.babraham.ac.uk/projects/fastqc/ Key: citeulike:11583827 2000.
- 39. Bolger AM, Lohse M, Usadel B. Trimmomatic: a flexible trimmer for Illumina sequence data. Bioinformatics 2014; 30: 2114–2120. [DOI] [PMC free article] [PubMed] [Google Scholar]
- 40. Dobin A, Davis CA, Schlesinger F, et al. STAR: ultrafast universal RNA‐seq aligner. Bioinformatics 2013; 29: 15–21. [DOI] [PMC free article] [PubMed] [Google Scholar]
- 41. Anders S, Pyl PT, Huber W. HTSeq–a Python framework to work with high‐throughput sequencing data. Bioinformatics 2015; 31: 166–169. [DOI] [PMC free article] [PubMed] [Google Scholar]
- 42. Love MI, Huber W, Anders S. Moderated estimation of fold change and dispersion for RNA‐seq data with DESeq2. Genome Biol 2014; 15: 550. [DOI] [PMC free article] [PubMed] [Google Scholar]
- 43. Kanehisa M, Furumichi M, Tanabe M, et al. KEGG: new perspectives on genomes, pathways, diseases and drugs. Nucleic Acids Res 2017; 45: D353–D361. [DOI] [PMC free article] [PubMed] [Google Scholar]
- 44. Dennis G Jr, Sherman BT, Hosack DA, et al. DAVID: Database for annotation, visualization, and integrated discovery. Genome Biol 2003; 4: R60. [PubMed] [Google Scholar]
- 45. Huang DW, Sherman BT, Lempicki RA. Systematic and integrative analysis of large gene lists using DAVID bioinformatics resources. Nat Protoc 2009; 4: 44–57. [DOI] [PubMed] [Google Scholar]
- 46. Menashe I, Maeder D, Garcia‐Closas M, et al. Pathway analysis of breast cancer genome‐wide association study highlights three pathways and one canonical signaling cascade. Cancer Res 2010; 70: 4453–4459. [DOI] [PMC free article] [PubMed] [Google Scholar]
- 47. Hu H, Miao YR, Jia LH, et al. AnimalTFDB 3.0: A comprehensive resource for annotation and prediction of animal transcription factors. Nucleic Acids Res 2019; 47: D33–D38. [DOI] [PMC free article] [PubMed] [Google Scholar]
- 48. Popov VM, Wu K, Zhou J, et al. The Dachshund gene in development and hormone‐responsive tumorigenesis. Trends Endocrinol Metab 2010; 21: 41–49. [DOI] [PMC free article] [PubMed] [Google Scholar]
- 49. Yang L, Webb SE, Jin N, et al. Data from: Characterization of the key role of dachshund b in the development of the pancreatic islet in zebrafish (Danio rerio). Figshare Repository. Deposited 20 March 2019. doi.org/10.6084/m9.figshare.7802030.v1.
- 50. Yang L, Webb SE, Jin N, et al. Data from: Characterization of the key role of dachshund b in the development of the pancreatic islet in zebrafish (Danio rerio). Figshare Repository. Deposited 20 March 2019. doi.org/10.6084/m9.figshare.7802033.v1.
- 51. Toselli CM, Wilkinson BM, Paterson J, et al. Vegfa/vegfr2 signaling is necessary for zebrafish islet vessel development, but it is dispensable for beta‐cell and alpha‐cell formation. Sci Rep 2019; 9: 3594. [DOI] [PMC free article] [PubMed] [Google Scholar]
- 52. Matsuda H. Zebrafish as a model for studying functional pancreatic β cells development and regeneration. Dev Growth Diff 2018; 60: 393–399. [DOI] [PubMed] [Google Scholar]
- 53. Liu WD, Wang HW, Muguira M, et al. INSM1 functions as a transcriptional repressor of the neuroD/β2 gene through the recruitment of cyclin D1 and histone deacetylases. Biochem J 2006; 397: 169–177. [DOI] [PMC free article] [PubMed] [Google Scholar]
- 54. Zhou J, Liu Y, Zhang W, et al. Transcription elongation regulator 1 is a co‐integrator of the cell fate determination factor Dachshund homolog 1. J Biol Chem 2010; 285: 40342–40350. [DOI] [PMC free article] [PubMed] [Google Scholar]
- 55. Eijkelenboom A, Burgering BM. FOXOs: signalling integrators for homeostasis maintenance. Nat Rev Mol Cell Biol 2013; 14: 83–97. [DOI] [PubMed] [Google Scholar]
- 56. Kim‐Muller JY, Zhao S, Srivastava S, et al. Metabolic inflexibility impairs insulin secretion and results in MODY‐like diabetes in triple FoxO‐deficient mice. Cell Metab 2014; 20: 593–602. [DOI] [PMC free article] [PubMed] [Google Scholar]
- 57. Gu C, Stein G, Pan N, et al. Pancreatic β‐cells require NeuroD to achieve and maintain functional maturity. Cell Metab 2010; 11: 298–310. [DOI] [PMC free article] [PubMed] [Google Scholar]
- 58. Dalgin G, Prince VE. Differential levels of Neurod establish zebrafish endocrine pancreas cell fates. Dev Biol 2015; 402: 81–97. [DOI] [PMC free article] [PubMed] [Google Scholar]
- 59. Ahlgren U, Jonsson J, Jonsson L, et al. β‐cell‐specific inactivation of the mouse Ipf1/Pdx1 gene results in loss of the β‐cell phenotype and maturity onset diabetes. Genes Dev 1998; 12: 1763–1768. [DOI] [PMC free article] [PubMed] [Google Scholar]
- 60. Fukuda A, Kawaguchi Y, Furuyama K, et al. Reduction of Ptf1a gene dosage causes pancreatic hypoplasia and diabetes in mice. Diabetes 2008; 57: 2421–2431. [DOI] [PMC free article] [PubMed] [Google Scholar]
- 61. Mitchell RK, Nguyen‐Tu MS, Chabosseau P, et al. The transcription factor Pax6 is required for pancreatic β cell identity, glucose‐regulated ATP synthesis, and Ca2+ dynamics in adult mice. J Biol Chem 2017; 292: 8892–8906. [DOI] [PMC free article] [PubMed] [Google Scholar]
Associated Data
This section collects any data citations, data availability statements, or supplementary materials included in this article.
Supplementary Materials
Figure S1. p53 knock‐down ameliorated the neural cell death induced by the off target effect of MO in zebrafish embryos at 30 hpf.
Figure S2. Dachb knock‐down does not induce apoptosis in the pancreas.
Figure S3. Schematics showing the (ai) splice‐blocking (MO‐S) and (aii) translation‐blocking (MO‐T) MOs used, and (b) the structure of the pBlueScriptII KS (+) vector containing the zebrafish dachb gene.
Table S1. Changes in gene expression in dachb knock‐down strain.
Table S2. Results of Gene ontology and KEGG pathway enrichment analysis.
Data Availability Statement
The RNA‐seq data for the eight samples were deposited in the Sequence Read Archive of the National Center for Biotechnology Information. The project accession number for the sequences is PRJNA527366.