Abstract
Aims/Introduction
Tubulointerstitial fibrosis is a hallmark of diabetic nephropathy and is associated with an epithelial‐to‐mesenchymal transition (EMT) program and aberrant glycolysis. Dimeric pyruvate kinase (PK) M2 (PKM2) acts as a key protein kinase in aberrant glycolysis by promoting the accumulation of hypoxia‐inducible factor (HIF)‐1α, while tetrameric PKM2 functions as a pyruvate kinase in oxidative phosphorylation. The aim of the research is to study the effect of PKM2 tetramer activation on preventing kidney fibrosis via suppression of aberrant glycolysis and the EMT program.
Materials and methods
In vivo: Streptozotocin (STZ) was utilized to induce diabetes in 8‐week‐old CD‐1 mice; 4 weeks after diabetes induction, proteinuria‐induced kidney fibrosis was developed by intraperitoneal injection of bovine serum albumin (BSA: 0.3 g/30 g BW) for 14 days; The PKM2 activator TEPP‐46 was also administered orally simultaneously. In vitro: HK2 cells were co‐treated with high‐glucose media or/and TGF‐β1 and TEPP46 for 48 h, cellular protein was extracted for evaluation.
Results
Diabetic mice developed kidney fibrosis associated with aberrant glycolysis and EMT; BSA injection accelerated kidney fibrosis in both the control and diabetic mice; TEPP‐46 rescued the kidney fibrosis. In HK2 cells, TEPP‐46 suppressed the EMT program induced by TGF‐β1 and/or high‐glucose incubation. TEPP‐46‐induced PKM2 tetramer formation and PK activity resulted in suppression of HIF‐1α and lactate accumulation. Specific siRNA‐mediated knockdown of HIF‐1α expression diminished high glucose‐induced mesenchymal protein levels.
Conclusion
PKM2 activation could restore the tubular phenotype via suppression of the EMT program and aberrant glycolysis, providing an alternative target to mitigate fibrosis in diabetic kidneys.
Keywords: Diabetic nephropathy, EMT, Glycolysis
Diabetic kidney disease displayed kidney fibrosis associated with aberrant glycolysis and EMT program, these alterations were related to the increased level of dimeric‐PKM2 formation, PKM2 activation by TEPP46 rescued the kidney fibrosis by promoting PKM2 tetramer formation, and inhibiting dimeric‐PKM2 which directly interacted with HIF‐1α and promoted its transcription.

INTRODUCTION
As a complication of diabetes, diabetic kidney disease (DKD) is highly concerning because of its worldwide incidence and poor prognosis 1 . The presence of albuminuria is a clinical hallmark of kidney damage 2 . In patients with diabetes, the incidence of end‐stage renal disease (ESRD) is higher among individuals with overt albuminuria than among those with normal albumin levels 3 . These clinical observations suggest that hyperglycemia and associated metabolic defects interact with proteinuria to aggravate kidney damage in overt nephropathy; however, the molecular mechanisms have not been elucidated completely.
Proteinuria has been recognized as a risk factor for tubulointerstitial damage. We previously reported that bovine serum albumin (BSA) overload induced overt albuminuria in diabetic mice and produced significant induction of the transforming growth factor (TGF)‐β signaling pathway in tubule cells and that TGF‐β stimulated the tubular epithelial cell transformation program to convert these cells into extracellular matrix‐producing cells through an epithelial‐to‐mesenchymal transition (EMT) process 4 . The EMT in cancer cells has been shown to be associated with aberrant glycolysis, known as the Warburg effect 5 . Such aberrant glycolysis, which is characterized by the accumulation of hypoxia‐inducible factor‐1α (HIF‐1α), signal transducer and activator of transcription 3 (STAT3) phosphorylation and pyruvate kinase (PK) M2 (PKM2) dimer formation, plays pathogenic roles in cancer metastasis 5 , 6 , 7 . TGF‐β signaling is also a known stimulator of glycolysis. Recently, we showed that TGF‐β signaling in tubule cells was responsible for the induction of aberrant glycolysis in the EMT phenotype of fibrotic kidney in diabetic mice 8 , 9 . Furthermore, very recently, we showed that such aberrant glycolysis could be a therapeutic target of sodium‐glucose cotransporter‐2 inhibitor therapy 9 . Not only diabetes, but also aberrant glycolysis, played essential pathogenic roles in a unilateral ureteral obstruction (UUO) model of kidney fibrosis in mice and in polycystic kidney disease mouse models 10 , 11 .
PKM2, the critical enzyme in glycolysis, aggregates and can be found as monomers, dimers, or tetramers, each of which displays distinct pathophysiological functions 12 , 13 . Tetrameric PKM2 exhibits high pyruvate kinase (PK) activity. TEPP‐46 is a small‐molecule activator that induces the formation of the PKM2 tetramer by stabilizing PKM2 subunit interactions and increasing PK activity 14 , 15 . Investigators at Joslin reported previously that the diabetes‐mediated reduction in PKM2 activity plays a vital pathogenic role in glomerular injury. They elegantly showed that the activation of PKM2 by TEPP‐46 suppressed fibronectin, type I collagen α3, and TGF‐β1 expression levels in the tubular lesions of diabetic mice 16 . Independent of its PK activity, dimeric PKM2 accumulates in the nucleus and acts as a protein kinase. The PKM2 dimer directly interacts with HIF‐1α, promoting HIF‐1α transactivation and expression of its downstream glycolytic genes GLUT1, LDH, PKF‐1, and HK1 17 , 18 , whereas activation of PKM2 using the small molecules TEPP‐46 and DASA‐58 promotes tetrameric PKM2 formation, and inhibits LPS‐induced HIF‐1α accumulation 19 . The PKM2 dimer also activates the STAT3 transcription factor through the phosphorylation of Y705 20 . STAT3 accelerates HIF‐1α accumulation 21 , and STAT3 activation has been shown to be associated with the EMT program 22 . STAT3 also induces glycolysis by targeting hexokinase 2 in hepatocellular carcinoma cells 11 .
Here, we hypothesized that activation of PKM2 may suppress fibrosis in diabetic kidneys damaged by massive proteinuria via inhibition of EMT and aberrant glycolysis.
MATERIALS AND METHODS
Animal experiments
Eight‐week‐old male CD‐1 mice (Sankyo Lab Service, Tokyo, Japan) were used in our experiment. The mice received one intraperitoneal injection of streptozotocin (STZ) (200 mg/kg body weight) to induce diabetes. Blood glucose levels were measured 2 weeks later, and the establishment of diabetes was defined as a blood glucose level of > 220 mg/dL. One month after the diabetes induction, the mice received oral gavage with TEPP‐46 (30 mg/kg, MedChemExpress, USA) or vehicle for 2 weeks; at the same time, the mice received an intraperitoneal injection of bovine serum albumin (BSA) (0.3 g/30 g, Sigma‐Aldrich, USA). All mice were killed at 14 weeks. Before killing, blood pressure and blood glucose levels were measured, and all samples were stored at −80°C until use.
The animal experiment was approved by the IACUC of Kanazawa Medical University (protocol number 2019‐25).
Immunohistochemistry
Mouse kidney sections were utilized for immunohistochemistry staining. We used a Vectastain ABC kit (Vector Laboratories, Burlingame, CA, USA). After deparaffinization and dehydration, primary antibodies were diluted according to the manufacturer’s instructions (α‐SMA, 1:100). For negative controls, primary antibodies were replaced with blocking buffer.
Immunofluorescence staining
Sections of mouse kidneys were fixed in 4% paraformaldehyde, incubated with a primary antibody at room temperature for 1 h, a secondary antibody (1:200) was then added and incubated for 30 min at room temperature, and then mounted with a medium containing DAPI.
Histopathology
All samples were fixed in fresh 10% formaldehyde and embedded in paraffin, and 5 µm thick sections were used for MTS and Sirius red staining. Sirius red staining was performed using a picrosirius red staining kit (Cosmo Bio Co., Ltd, Philadelphia). All MTS and Sirius red staining images were analyzed with ImageJ.
Cell culture and treatment
Human proximal tubule cells (HK‐2 cells, ATCC CRL‐2190) were cultured in keratinocyte‐SFM (1×) medium (Life Technologies, NY, Green Island). The cells were exposed to 30 mM glucose and/or 10 ng/mL recombinant human TGF‐β1 (Perotech, USA) for 48 h with or without TEPP‐46/DASA‐58 then harvested for western blot analysis.
Pyruvate kinase (PK) activity assays
Pyruvate kinase activity was measured following a method described previously 23 . In kidney samples, 10 µL of 1 µg/µL protein was used to test PK activity following the assay protocol. In HK2 cells, the cell numbers were counted, the PK activity was measured with a pyruvate kinase activity colorimetric/fluorometric assay kit (BioVision, USA).
Cross‐linking PKM2 to evaluate the formation of tetramers, dimers, and monomers
We followed a method described previously 16 . In brief, in the kidney cross‐linking assay, protein was prepared as indicated by the protocol, and 250 µM disuccinimidyl suberate (DSS) (Thermo Scientific) was used to cross‐link the samples for 30 min at room temperature. An equal amount of protein was lysed in 2X Bolt LDS sample buffer (Invitrogen) and boiled for 5 min. In HK2 cells, the cell numbers were counted, 5 mM DSS was used for cross‐linking. Samples were separated by 5% to 20% SDS‐polyacrylamide gel electrophoresis.
Dual luciferase assay
We followed the manufacturer to transfect HK2 cells with pGL4.42[luc2P/HRE/Hygro] vector (a–c) (Promega, E400A), a concentration of 10 ng total DNA/µL in Opti‐MEM was used in our study. After transfection, the cells were exposed to a high‐glucose medium with or without TEPP‐46 for 48 h. The HRE activity was measured with a dual‐luciferase reporter assay (E1910, Promega). The data were obtained as the ratio between firefly luciferase activity and Renilla luciferase activity and then analyzed.
Transfection
HK2 cells were incubated with Lipofectamine 2000 (Invitrogen) and HIF‐1α‐specific siRNA (Thermo Fisher Scientific), in serum‐free medium for 6 h, the medium was then replaced with keratinocyte‐SFM (1×) medium, and incubated with 30 mM glucose for the next 48 h, cellular protein was harvested for the next analysis.
Immunoprecipitation
The HK2 cells were exposed to 30 mM glucose for 48 h with or without rapamycin (20 nM), then we performed the immunoprecipitation as described in our previous study 4 .
Western blot analysis
RIPA lysis buffer (Santa Cruz Biotechnology) was used when the proteins were harvested, and the protein concentration was determined by a BCA assay. Protein lysates were boiled with SDS sample buffer at 94°C for 5 min and then separated on SDS‐polyacrylamide gels. After transferring the protein to the PVDF membranes and blocking, the membranes were incubated with a primary antibody overnight at 4°C. A peroxidase‐conjugated secondary antibody was added and the blots were visualized by using a chemiluminescence detection system, the results were then analyzed with ImageJ.
Reagents
We purchased the following primary antibody from Cell Signaling Technology: PKM2 (1:1,000), snail (1:500), E‐Cadherin (1:500), HK1 (1:1,000), p‐STAT3 (Tyr705) (1:1,000), STAT3 (1:1,000), HK2 (1:1,000); vimentin (1:2,000), α‐SMA (1:1,000), SM22α (1:800), SMAD3 (1:500), p‐SMAD3 (1:500) were from Abcam, HIF‐1α (1:200) was purchased from Novus Biologicals.
Statistical analysis
Data are expressed as the mean ± SEM. Unpaired t‐test or ANOVA followed by Tukey’s analysis was used to determine significance, which was defined as P < 0.05 if not otherwise indicated. GraphPad Prism software (version 7.0) was used for statistical analysis.
RESULTS
TEPP‐46 suppressed kidney fibrosis associated with EMT and aberrant glycolysis induced by diabetes and/or BSA
After the induction of diabetes, BSA was injected intraperitoneally to promote proteinuria, and the PKM2 activator TEPP‐46 was administered at the same time. At the end of the experiment, we analyzed the following six groups: control mice, streptozotocin (STZ) mice, BSA‐injected mice, BSA + TEPP‐46‐treated mice, STZ + BSA‐co‐treated mice, and STZ + BSA+TEPP‐46‐treated mice (Figure S1). First, we performed a histological analysis of kidney samples by Masson’s trichrome staining (MTS) and picrosirius red (SR) staining. Compared with the control mice, the STZ‐induced diabetic (STZ) mice and BSA‐injected nondiabetic (control) mice exhibited significant kidney fibrosis (Figure 1a–c,e–h,j). The STZ + BSA‐co‐treated mice displayed even more marked kidney fibrosis (Figure 1d,e,i,j). Then, we analyzed the EMT program by multiplex immunofluorescence staining for epithelial marker E‐cadherin and mesenchymal marker vimentin. The STZ mice and BSA‐injected nondiabetic mice exhibited more E‐cadherin+/vimentin+ cells than the control mice, indicating that the EMT program was activated, the STZ + BSA‐co‐treated mice displayed even stronger EMT activation (Figure 1k–n). A similar result was observed when we employed immunohistochemical staining to evaluate the expression of another mesenchymal marker, α‐SMA (Figure 1o–r). To further confirm our data, we performed western blotting to analyze EMT in kidney samples. When compared with the control mice, the STZ mice and BSA‐injected control mice expressed higher levels of α‐SMA and SM‐22 α; the STZ + BSA‐co‐treated mice displayed marked increases in the expression of these mesenchymal markers (Figure 1s, Figure S2A). The expression of hexokinase (HXK)1 and HXK2 was greater in the STZ mice and BSA‐injected STZ mice than in the control mice, which indicated that aberrant glycolysis was excessively induced by diabetes; consistent with the high expression of HXK1 and HXK2 observed, our cross‐linking analysis showed abundant monomeric and dimeric PKM2 expression in diabetic mice, and BSA led to moderately aberrant glycolysis (Figure 1s,t, Figure S2B).
Figure 1.
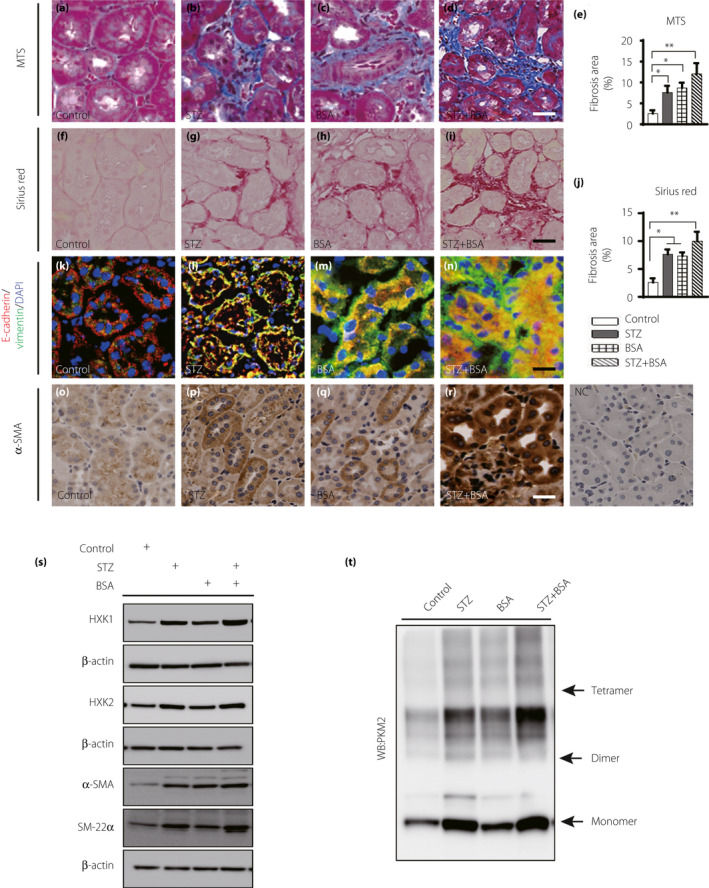
BSA induced kidney fibrosis in both nondiabetic and diabetic mice. (a–d, e) MTS staining of the kidney samples, control, n = 5 mice; STZ, n = 8 mice; BSA, n = 6 mice; STZ + BSA, n = 9 mice, scale bar 25 µm. (f–i, j) Sirius Red staining for fibrosis in the kidney samples, n = 5 mice/group. Seven visual fields of each sample were calculated by using ImageJ software to analyze fibrosis areas, scale bar 25 µm. (k–n) the EMT program was analyzed by immunofluoresence. E‐cadherin+/vimentin+ cells were recognized as cells undergoing the EMT. For each group, n = 5 mice. Scale bar: 50 µm. (o–r) α‐SAM expression was analyzed by immunohistochemical (IHC) staining from kidney. (s) Representative western blotting images of mesenchymal markers and glycolysis markers of mice kidney samples. (t) Representative images of cross‐link analysis of kidney sample. All data in this picture were analyzed by one‐way ANOVA. The data are expressed as the mean ± SEM in the graph. P < 0.05 was recognized as significant. *P < 0.05, **P < 0.01.
To rescue kidney fibrosis in diabetic mice with proteinuria, we employed the PKM2 activator TEPP‐46. After 2 weeks of oral gavage with TEPP‐46, kidney fibrosis was significantly ameliorated in BSA‐injected control and diabetic mice (Figure 2a–j). The number of E‐cadherin+/vimentin+ cells and the level of α‐SMA expression in tubule cells were decreased by TEPP‐46 intervention in BSA‐injected control and diabetic mice, suggesting suppression of the EMT program (Figure 2k–r). Our western blot analysis revealed that TEPP‐46 intervention reduced mesenchymal marker levels significantly in BSA‐injected control and diabetic mice (Figure 2s,t). TEPP‐46 suppressed the aberrant expression of the glycolysis markers HXK1 and HXK2 in BSA‐injected control and diabetic mice (Figure 2s,t).
Figure 2.
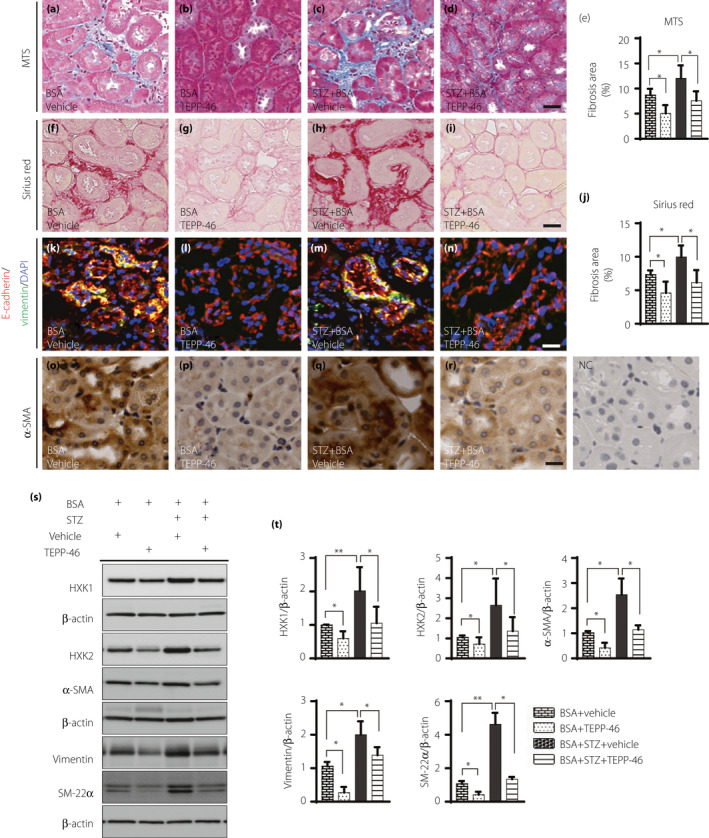
TEPP‐46 suppressed kidney fibrosis associated with EMT program induced by BSA in nondiabetic and diabetic mice. Histology analysis of fibrosis in the kidney samples by (a–d) MTS staining and (f–i) Sirius Red staining, scale bar 25 µm. (e, j) using Image J software to analyze the fibrosis area. BSA, n = 5 mice; BSA + TEPP‐46, n = 6 mice; STZ + BSA, n = 7 mice; STZ + BSA+TEPP‐46, n = 7 mice. (k–n) EMT program was analyzed, E‐cadherin+(epithelial marker)/vimentin+ (mesenchymal marker) cells were recognized as EMT activation. n = 5mice/group. Scale bar: 50 µm. (o–r) Mesenchymal marker α‐SMA expression was analyzed by IHC staining in kidney samples. (s) Representative images of mesenchymal markers vimentin, SM‐22α, and α‐SAM, and glycolysis markers HXK1 and HXK2. (t) Protein levels were calculated by being normalized to β‐actin when densitometric analysis was done. BSA, n = 5 mice; BSA + TEPP‐46, n = 5 mice; STZ + BSA, n = 6 mice; STZ + BSA+TEPP‐46, n = 6 mice. Unpaired two‐tailed t‐test. The data are expressed as the mean ± SEM in the graph. P < 0.05 was recognized as significant. *P < 0.05, **P < 0.01.
TEPP‐46 treatment did not influence the blood glucose levels of STZ mice or affect the body weight or the kidney/body weight ratio (Figure 3a–c). Lactate accumulation was observed in STZ mice, and there was also a trend toward increased accumulation in BSA‐injected control mice. TEPP‐46 suppressed lactate levels to basal levels (Figure 3d), which was consistent with the hexokinase expression patterns observed (Figure 2s,t). The STZ mice developed a significantly higher albuminuria‐creatinine ratio (ACR), as evaluated by a mouse‐specific ELISA for albumin, than the control mice, and this elevated ACR was augmented by BSA injection; TEPP‐46 treatment suppressed the ACR in BSA‐injected control or diabetic mice (Figure 3e). Bovine‐specific albumin excretion was not altered by TEPP‐46 intervention (Figure S3).
Figure 3.
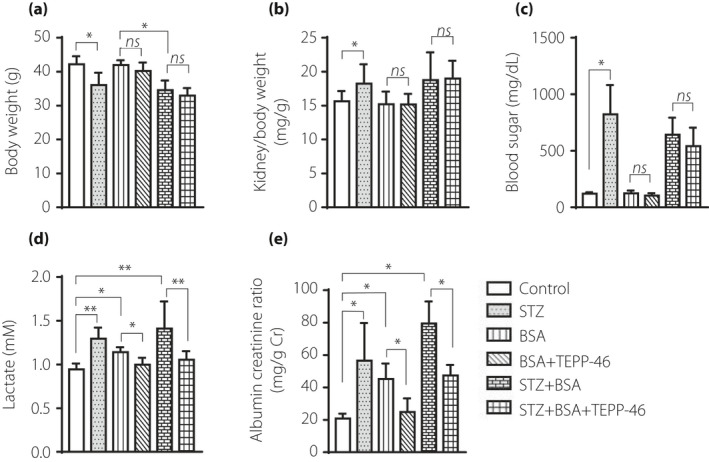
TEPP‐46 had no effect on diabetic mice blood glucose, but ameliorated kidney function. (a) Analysis of body weight in the indicated group. (b) Analysis of kidney weight/body weight ratio. (c) Analysis of blood glucose in mice. (d) Analysis of lactate in mice plasma. (e) Analysis of ACR in mice. Control, n = 7 mice; STZ, n = 8 mice; BSA, n = 5 mice; BSA + TEPP‐46, n = 6 mice; STZ + BSA, n = 9 mice; STZ + BSA+TEPP‐46, n = 7 mice, the data were analyzed by unpaired two tail t‐test. The data are expressed as the mean ± SEM in the graph. P < 0.05 was recognized as significant. *P < 0.05, **P < 0.01.
TEPP‐46 promoted PKM2 tetramer formation and increased pyruvate kinase (PK) activity
A disuccinimidyl suberate (DSS)‐based cross‐linking analysis indicated that TEPP‐46‐treated mice exhibited a higher PKM2 tetramer/dimer + monomer ratio than non‐TEPP‐46‐treated mice (Figure 4a,b). The pyruvate kinase activity was suppressed in diabetic mice and/or BSA‐injected mice compared with the control mice (Figure S4). In agreement with the high tetramer/dimer + monomer ratio, elevated PK activity was also observed in the TEPP‐46‐treated mice compared with the non‐TEPP‐46‐treated mice (Figure 4c). The PK activity was suppressed with high‐glucose medium incubation compared with osmotic control mannitol incubation, while TEPP‐46 restored the PK activity levels similar to those of the control (Figure 4d). Immunocytochemical analysis revealed that high‐glucose medium either with or without TGF‐β1 stimulated PKM2 nuclear localization; monomeric‐PKM2 translocated into the nucleus, aggravating dimeric‐PKM2 formation to promote the Warburg effect 13 , 24 , and TEPP‐46 restored normal PKM2 cellular localization (Figure 4e).
Figure 4.
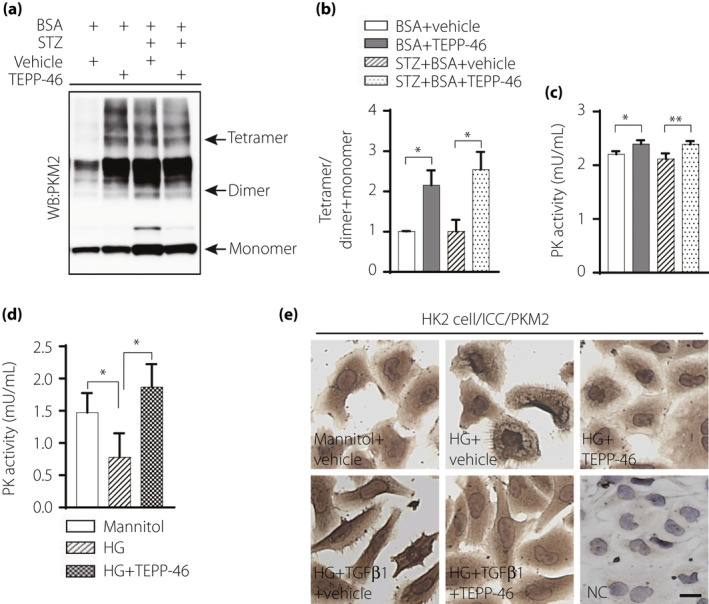
PKM2 activator TEPP‐46 increased PK activity, suppressed PKM2 nuclear location. (a) Representative blot image of cross‐linked mice kidney samples to show PKM2 monomer, dimer, and tetramer. (b) The ratio between tetramer and dimer + monomer of PKM2 in kidney samples, n = 5/group. (c) Analysis of pyruvate kinase (PK) activity in mice kidney samples, BSA, n = 5 mice; BSA + TEPP‐46, n = 6 mice; STZ + BSA, n = 8 mice; STZ + BSA+TEPP‐46, n = 7 mice. (d) HK2 cell treated by high‐glucose (30 mM) with TEPP‐46 for 48 h to analysis PK activity, n = 7 independent experiments. (e) Immunocytochemical analysis of PKM2 location in HK2 cell. (b, c) analyzed using unpaired two tail t‐test, (d) used one‐way ANOVA. The data are expressed as the mean ± SEM in the graph. P < 0.05 was recognized as significant. *P < 0.05, **P < 0.01. HG: high glucose.
TEPP‐46 inhibited the high‐glucose‐induced EMT program with or without TGF‐β1 in human proximal tubule (HK2) cells
Incubation of HK2 cells with TGF‐β1 inhibited E‐cadherin expression and promoted vimentin, FSP‐1, α‐SMA, snail and SM‐22α expression compared with the control incubation, indicating EMT program activation. TEPP‐46 treatment restored the E‐cadherin level, suppressed mesenchymal proteins expression, and impeded the EMT program induced by TGF‐β1 (Figure 5a–k). We also confirmed that another PKM2 activator, DASA‐58, displayed similar effects to TEPP‐46 (Figure S5). TEPP‐46 also decreased TGF‐β1‐activated p‐smad3 expression (Figure 5j,k). Cross‐linking analysis revealed that TGF‐β1 treatment inhibited tetrameric PKM2 formation compared with control treatment and TEPP‐46 reversed the effects of TGF‐β1 (Figure 5l, Figure S6). Compared with the osmotic control, high‐glucose medium induced EMT; TEPP‐46 treatment reversed the EMT‐related alterations (Figure 5m,n). Co‐incubation with TGF‐β1 in high‐glucose medium produced further induction of EMT, and TEPP‐46 failed to restore E‐cadherin expression but suppressed mesenchymal markers expression (Figure 5m,n).
Figure 5.
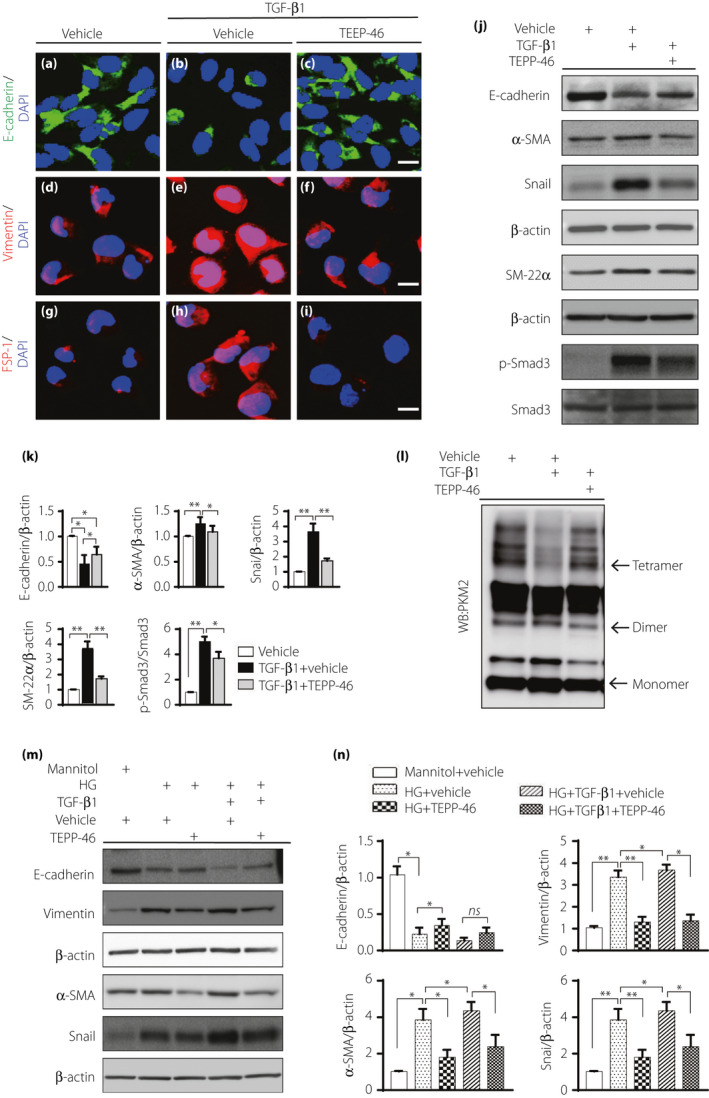
TEPP‐46 suppressed EMT program induced by high glucose with or without TGF‐β1 in HK2 cells. HK2 cell was exposed to 10 ng/mL TGF‐β1 with or without TEPP‐46 (10 μM) for 48 hours. (a–i) Immunofluoresence images to display EMT program in HK2 cell, E‐cadherin is the epithelia marker, vimentin and FSP1 are mesenchymal markers. (j) Representative western blot images analysis of EMT markers. (k) Protein levels were calculated by normalized to β‐actin when densitometric analysis was done, n = 9 independent experiments. (l) Representative images of cross‐linking analysis of HK2 cell. (m) HK2 cell incubated in high glucose medium (30 mM) with or without TEPP‐46 in the presence of TGF‐β1 or not for 48 h, western blot images of EMT. (n) Protein levels were calculated by normalized to β‐actin when densitometric analysis was done, n = 6 independent experiments. The data are expressed as the mean ± SEM in the graph. P < 0.05 was recognized as significant. *P < 0.05, **P < 0.01. HG: high glucose.
TEPP‐46 inhibited aberrant glycolysis associated with the EMT program, possibly through the HIF‐1α‐STAT3‐PKM2 axis
Our in vivo study indicated that TEPP‐46 inhibited the molecular signature of aberrant glycolysis in the diabetic mouse kidneys (Figures 2s,t and 3d). Similar to the observation in vivo, high glucose levels induced HIF1‐α accumulation and HXK2, p‐STAT3, and p‐mTOR induction compared with the osmotic control, and TEPP‐46 restored all these alterations to the normal level (Figure 6a,b). High‐glucose incubation increased lactate levels, and TEPP‐46 reduced lactate accumulation (Figure 6c). The EMT program induced with high‐glucose medium is associated with an accumulation of HIF1‐α and aberrant glycolysis 8 , 9 . Additionally, mTOR activation has been shown to induce aberrant glycolysis associated with HIF‐1α accumulation 25 . To reveal the functional relation between PKM2 activation and HIF‐1α in vitro, we used a hypoxia response element (HRE) luciferase reporter assay and found that high‐glucose incubation increased HRE activity compared with the control incubation, while TEPP‐46 decreased luciferase activity, indicating that TEPP‐46 inhibited HRE transcriptional activity (Figure 6d). In the HK2 cells, the expression of mesenchymal phenotypic markers, such as vimentin, α‐SMA and snail, was increased with high‐glucose medium compared with the osmotic control; HIF‐1α knockdown reduced these alterations (Figure 6e,f). Suppression of prolyl hydroxylase domain‐containing protein 2 (PHD2) by EGLN1‐specific siRNA induced HIF‐1α accumulation, mesenchymal phenotype and aberrant glycolysis; TEPP‐46 restored all alterations to normal (Figure S7A,B). The anti‐EMT and anti‐glycolysis effects of TEPP‐46 were also observed in TSC1‐ knockdown HK2 cells (Figure S7C,D). To analyze whether the kinase activity of PKM2 directly induces mTOR phosphorylation, we performed immunoprecipitation of PKM2 and mTOR but found no direct interaction between these two molecules (Figure S8). The TEPP‐46 intervention also suppressed HIF‐1α induced EMT activation in an hypoxic environment (Figure S9).
Figure 6.
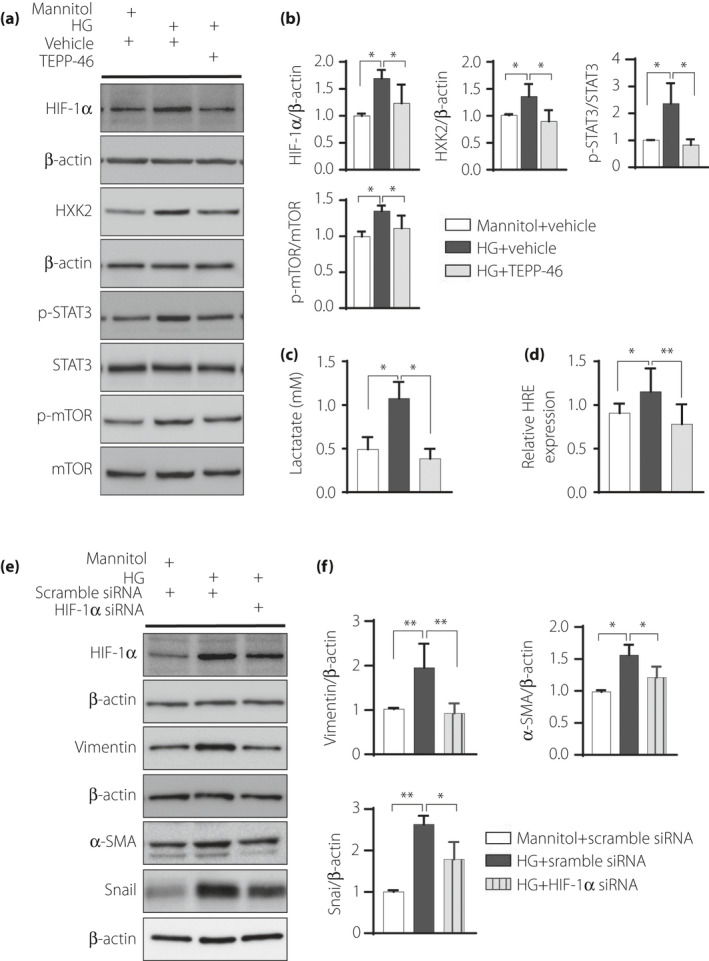
TEPP46 may inhibit EMT program through HIF‐1α‐STAT3 –PKM2 axis. (a) Representative western blot images; HK2 cell incubated in high‐glucose with or without TEPP‐46. (b) Protein levels were calculated by normalized to β‐actin when densitometric analysis was done, n = 7 independent experiments. (c) Analysis of lactate accumulation, n = 10 independent experiments. (d) Dual luciferase analysis of HRE activity in high glucose medium treated HK2 cell, n = 9 independent experiments. (e) Representative western blot images in HIF‐1α knock‐down HK2 cell exposed in high‐glucose medium for 48 h. (f) Protein levels were calculated by normalized to β‐actin when densitometric analysis was done, n = 7 independent experiments. The data are expressed as the mean ± SEM in the graph. P < 0.05 was recognized as significant. *P < 0.05, **P < 0.01. HG: high glucose.
DISCUSSION
We have shown that diabetic CD‐1 mice exhibited severe kidney fibrosis and such fibrosis was associated with aberrant glycolysis 8 ; this aberrant glycolysis was a therapeutic target of SGLT2 inhibitor 9 . Here, we concluded that aberrant glycolysis in tubule cells, characterized by PKM2 dimer accumulation, in the diabetic kidneys was associated with the EMT program. Patients with diabetes with proteinuria are at higher risk of developing end stage renal disease; strategies to halt the disease progression are limited. Therefore, to investigate whether aberrant glycolysis is a therapeutic target in a highly proteinuric diabetic kidney disease model, we utilized diabetic mice with BSA injection‐induced proteinuria, being a remarkable kidney damage model associated with EMT 4 . Employing the PKM2 activator TEPP46, we found that (1) diabetic mice treated with BSA injection displayed EMT associated with an increased level of PKM2 dimers and TEPP‐46 inhibited kidney fibrosis and the EMT program, with suppression of the PKM2 dimer level. (2) In the HK2 cell line, TEPP‐46 inhibited the EMT program induced by high‐glucose medium with or without TGF‐β1 treatment. (3) TEPP‐46 also promoted tetrameric PKM2 formation and PK activity and decreased both HIF‐1α accumulation and lactate production. (4) Such effects of TEPP‐46 were associated with suppression of potent glycolysis markers such as HXK2, p‐STAT3 and p‐mTOR. Overall, PKM2 activation by TEPP‐46 exhibited an antifibrotic effect via inhibition of aberrant glycolysis and the EMT program.
We have shown that BSA injection in diabetic mice exaggerates TGF‐β1/smad3 signaling and subsequently induces fibrogenic interactions between DPP‐4 and integrinβ1 followed by EMT 4 , 26 . TGF‐β signaling is also a well‐established inducer of glycolysis in diverse types of cells 27 . Therefore, the EMT program in our BSA‐injected diabetic mice is a reasonable cause of aberrant glycolysis mediated by activation of the TGF‐β signaling pathway.
In diabetes, glucose metabolism is dependent on the organs, with an increase in glycolysis in the diabetic kidneys and a decrease in the nerves 28 . In chronic kidney disease, aggravation of aberrant glycolysis has been observed 29 . The metabolic shift from oxidative phosphorylation to aerobic glycolysis was observed in a UUO mouse model and was associated with PKM2 phosphorylation 11 . Chinmayee et al.30 reported that the PKM2‐mediated activation of transglutaminase 2 plays a vital role in high glucose‐induced fibrogenesis 30 . These reports indicate that aberrant glycolysis is essential for meeting the metabolic requirement for the homeostasis of the EMT phenotype in the tubule cells of the diabetic kidneys.
In our analysis, all mice treated with BSA alone, STZ alone, or STZ with BSA and all cells exposed to high‐glucose conditions in vitro displayed suppression of pyruvate kinase activity. The PK activity of PKM2 was regulated by endogenous and exogenous activators. Fructose 1,6‐bisphosphate (FBP) is an endogenous factor 12 . TEPP‐46 mimics the function of FBP by binding the monomeric PKM2 subunit to form a tetramer that has higher PK activity 15 . Qi et al.16 elegantly demonstrated the restoration of PKM2 activity by TEPP‐46 inhibited fibronectin, type I collagen α3, and TGF‐β1 expression in tubular lesions; on the other hand, TEPP‐46 minimally influenced the glomeruli of experimental animals 16 . In contrast to the findings of that study, the total PKM2 activity itself was not suppressed in our short‐term diabetic mice treated with BSA injection compared with nondiabetic mice, and the lactate levels were significantly elevated in diabetic mice compared with nondiabetic mice with or without BSA injection, suggesting that the increased aerobic glycolytic flux was induced in the diabetic kidneys by the PKM2 dimer. The increased PK activity induced by TEPP‐46 rescued the kidney phenotypes and suppressed lactate in the diabetic kidneys. Tubule‐derived lactate has been shown to contribute to fibroblast activation in an acute kidney injury model 31 . These data demonstrated that increased PKM2 activity with PKM2 dimer suppression by TEPP‐46 could rescue the kidney phenotype in diabetic mice by providing mitochondrial pyruvate for energy production in tubule cells and inhibiting lactate production, contributing to fibroblast activation (Figure 7).
Figure 7.
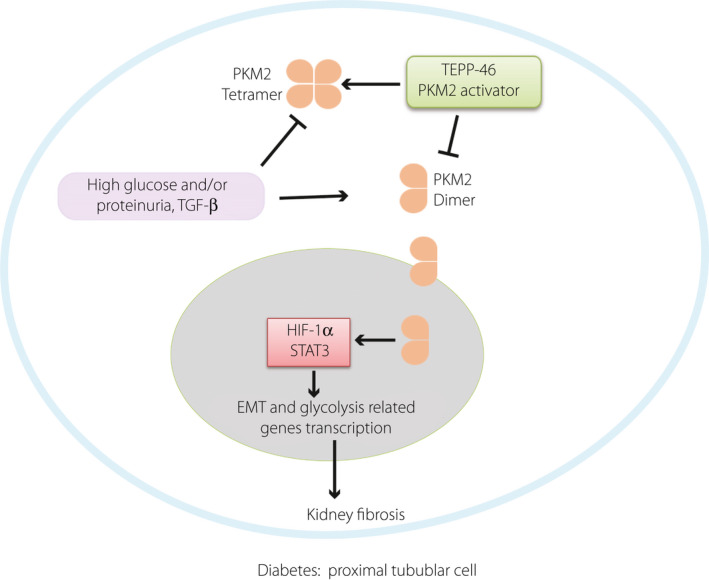
In diabetes, dimer PKM2 interacted with HIF‐1α, STAT3 and promoted their downstream fibrosis and expression of glycolysis related genes, TEPP46 promoted PKM2 tetramer formation, and inhibited HIF‐1α and STAT3 accumulation by decreasing the dimer PKM2.
Unlike tetrameric PKM2, dimeric PKM2 translocates into the nucleus and interacts with HIF‐1α directly as a transcriptional activator, promoting HIF‐1α expression and upregulating transcription of related glycolysis‐associated genes 17 , 29 , 32 , Furthermore, nuclear PKM2, directly phosphorylates STAT3, and PKM2‐phosphorylated STAT3 activates the transcription of several STAT3‐targeted genes 33 . STAT3, a downstream transcription factor activated by mTOR signaling, contributes to glycolysis by targeting hexokinase 2 in cancer cells 11 . Furthermore, PKM2 acts as a kinase to stimulate numerous transcription factors relevant to glycolysis and fibrosis 32 . HIF‐1α, STAT3, mTOR, etc. are all essential players activated by PKM2, suggesting that the PKM2 dimer is key for inducing the intracellular switch to induce both EMT and glycolysis. In our in vivo study it was demonstrated PKM2 activity was suppressed in all disease models to a similar extent but with a different magnitude of kidney fibrosis; the PKM2 monomer/dimer level itself, but not the ratio to the tetramer, would play much more significant pathogenic roles by inducing fibrogenic programs, and PKM2 activity measurements are not sensitive enough to detect such organ damage associated aberrant glycolytic signaling.
There were limitations to our study. It is well known that BSA injection induces immune system‐mediated nephritis associated with glomerular damage 34 . In our analysis, mouse‐specific urine albumin levels were increased in BSA‐injected diabetic mice, and TEPP‐46 restored the urine albumin levels to normal, suggesting that the kidney‐damaging effects of BSA are not solely mediated through tubule cell damage but rather through nephritis‐induced alterations in the glomeruli. As aberrant glycolysis is a known contributor to inflammation, it is possible that TEPP‐46 inhibited inflammation‐induced glomerular damage. Nevertheless, even though mouse‐specific urine albumin levels were reduced by TEPP‐46, the large amounts of injection‐derived BSA (compared with the levels of mouse‐specific albumin) in the urine were not altered by TEPP‐46, which could partially support the dominant role of urine albumin on tubular damage. To directly explore this issue, cell‐specific activation of PKM2 must be used, and further study is warranted.
In conclusion, by analyzing the tubular damage model induced by BSA injection into diabetic mice, we demonstrated TEPP‐46‐mediated activation of PKM2 catalytic activity, together with the suppression of dimeric PKM2, the potential kinase involved in both EMT and glycolysis via activation of essential transcription factors, which restored the structural integrity of the kidney. These data clearly suggest that aberrant glycolysis is a therapeutic target in diabetic kidney disease with severe proteinuria, suggesting a novel therapeutic strategy to combat diabetic kidney disease by focusing on the Warburg effect in kidney tubules.
DISCLOSURE
The authors declare no interest conflict.
Supporting information
Figure S1 | Animal protocol.
Figure S2 | (a) Quantification of Figure 1S, protein levels were calculated by normalized to β‐actin when densitometric analysis was done. Control, n = 5 mice; STZ, n = 7 mice; BSA, n = 5 mice; STZ+BSA, n = 6 mice. (b) Quantification of Figure 1T n = 5 mice/group. The data are expressed as the mean ± SEM in the graph. P < 0.05 was recognized as significant.
Figure S3 | Analysis of BSA/creatine ratio in mice urine.
Figure S4 | PK activity in mice kidney samples.
Figure S5 | HK2 cell co‐incubation with DASA‐58 and TGF‐β1 for 48 hours.
Figure S6 | Quantification of Figure 5L n = 5 independent experiments.
Figure S7 | HK2 cells were incubated with PHD2 siRNA or TSC1 siRNA with or without TEPP‐46 for 48 h.
Figure S8 | Immunoprecitation analysis of PKM2 and mTOR interaction, HK2 cell exposed to high‐medium with or without rapamycin for 48 h.
Figure S9 | HK2 cell exposed to normal oxygen and hypoxic statement with or without TEPP‐46.
Acknowledgment
This study was partially supported by grants from the Japan Society for the Promotion of Science awarded to KK (23790381, 26460403), DK (25282028, 25670414), and YT (18K16214). This study was partially supported by a Grant for Promoted Research awarded to KK (S2016‐3, S2017‐1) and a Grant for Assist KAKEN awarded to YT (K2017‐16) from Kanazawa Medical University. The in vitro experiments were supported by funds provided by a contract research agreement from Taisho Pharmaceutical Co., Ltd, Saitama, Japan, to evaluate the renal effects of PKM2 inhibitor (to KK). KK and DK received lecture honoraria from Taisho Pharmaceutical. KK is also currently collaborating with Taisho Pharmaceutical with a related project.
J Diabetes Investig 2021; 12: 697–709
Contributor Information
Keizo Kanasaki, Email: kkanasak@med.shimane-u.ac.jp.
Daisuke Koya, Email: koya0516@kanazawa-med.ac.jp.
References
- 1. Lim A. Diabetic nephropathy – complications and treatment. Int J Nephrol Renovasc Dis 2014; 15: 361–381. [DOI] [PMC free article] [PubMed] [Google Scholar]
- 2. Halbesma N, Kuiken DS, Brantsma AH, et al. Macroalbuminuria is a better risk marker than low estimated GFR to identify individuals at risk for accelerated GFR loss in population screening. J Am Soc Nephrol 2006; 17: 2582–2590. [DOI] [PubMed] [Google Scholar]
- 3. Berhane AM, Weil EJ, Knowler WC, et al. Albuminuria and estimated glomerular filtration rate as predictors of diabetic end‐stage renal disease and death. Clin J Am Soc Nephrol 2011; 6: 2444–2451. [DOI] [PMC free article] [PubMed] [Google Scholar]
- 4. Takagaki Y, Shi S, Katoh M, et al. Dipeptidyl peptidase‐4 plays a pathogenic role in BSA‐induced kidney injury in diabetic mice. Sci Rep 2019; 9: 7519. [DOI] [PMC free article] [PubMed] [Google Scholar]
- 5. Nieto MA, Huang RY, Jackson RA, et al. EMT: 2016. Cell 2016; 166: 21–45. [DOI] [PubMed] [Google Scholar]
- 6. Nomoto H, Pei L, Montemurro C, et al. Activation of the HIF1alpha/PFKFB3 stress response pathway in beta cells in type 1 diabetes. Diabetologia 2020; 63: 149–161. [DOI] [PMC free article] [PubMed] [Google Scholar]
- 7. Blantz RC. Phenotypic characteristics of diabetic kidney involvement. Kidney Int 2014; 86: 7–9. [DOI] [PMC free article] [PubMed] [Google Scholar]
- 8. Srivastava SP, Li J, Kitada M, et al. SIRT3 deficiency leads to induction of abnormal glycolysis in diabetic kidney with fibrosis. Cell Death Dis 2018; 9: 997. [DOI] [PMC free article] [PubMed] [Google Scholar]
- 9. Li J, Liu H, Takagi S, et al. Renal protective effects of empagliflozin via inhibition of EMT and aberrant glycolysis in proximal tubules. JCI Insight 2020; 5: e129034. [DOI] [PMC free article] [PubMed] [Google Scholar]
- 10. Rowe I, Chiaravalli M, Mannella V, et al. Defective glucose metabolism in polycystic kidney disease identifies a new therapeutic strategy. Nat Med 2013; 19: 488–493. [DOI] [PMC free article] [PubMed] [Google Scholar]
- 11. Li M, Jin R, Wang W, et al. STAT3 regulates glycolysis via targeting hexokinase 2 in hepatocellular carcinoma cells. Oncotarget 2017; 8: 24777–24784. [DOI] [PMC free article] [PubMed] [Google Scholar]
- 12. Ashizawa K, Willingham MC, Liang CM, et al. In vivo regulation of monomer‐tetramer conversion of pyruvate kinase subtype M2 by glucose is mediated via fructose 1,6‐bisphosphate. J Biol Chem 1991; 266: 16842–16846. [PubMed] [Google Scholar]
- 13. Zhang Z, Deng X, Liu Y, et al. PKM2, function and expression and regulation. Cell Biosci 2019; 9: 52. [DOI] [PMC free article] [PubMed] [Google Scholar]
- 14. Wang P, Sun C, Zhu T, et al. Structural insight into mechanisms for dynamic regulation of PKM2. Protein Cell 2015; 6: 275–287. [DOI] [PMC free article] [PubMed] [Google Scholar]
- 15. Anastasiou D, Yu Y, Israelsen WJ, et al. Pyruvate kinase M2 activators promote tetramer formation and suppress tumorigenesis. Nat Chem Biol 2012; 8: 839–847. [DOI] [PMC free article] [PubMed] [Google Scholar]
- 16. Qi W, Keenan HA, Li Q, et al. Pyruvate kinase M2 activation may protect against the progression of diabetic glomerular pathology and mitochondrial dysfunction. Nat Med 2017; 23: 753–762. [DOI] [PMC free article] [PubMed] [Google Scholar]
- 17. Luo W, Hu H, Chang R, et al. Pyruvate kinase M2 is a PHD3‐stimulated coactivator for hypoxia‐inducible factor 1. Cell 2011; 145: 732–744. [DOI] [PMC free article] [PubMed] [Google Scholar]
- 18. Sizemore ST, Zhang M, Cho JH, et al. Pyruvate kinase M2 regulates homologous recombination‐mediated DNA double‐strand break repair. Cell Res 2018; 28: 1090–1102. [DOI] [PMC free article] [PubMed] [Google Scholar]
- 19. Palsson‐McDermott EM, Curtis AM, Goel G, et al. Pyruvate kinase M2 regulates Hif‐1alpha activity and IL‐1beta induction and is a critical determinant of the Warburg effect in LPS‐activated macrophages. Cell Metab 2015; 21: 347. [DOI] [PubMed] [Google Scholar]
- 20. Gao X, Wang H, Yang JJ, et al. Pyruvate kinase M2 regulates gene transcription by acting as a protein kinase. Mol Cell 2012; 45: 598–609. [DOI] [PMC free article] [PubMed] [Google Scholar]
- 21. Jung JE, Lee HG, Cho IH, et al. STAT3 is a potential modulator of HIF‐1‐mediated VEGF expression in human renal carcinoma cells. FASEB J 2005; 19: 1296–1298. [DOI] [PubMed] [Google Scholar]
- 22. Zhang CH, Guo FL, Xu GL, et al. STAT3 activation mediates epithelial‐to‐mesenchymal transition in human hepatocellular carcinoma cells. Hepatogastroenterology 2014; 61: 1082–1089. [PubMed] [Google Scholar]
- 23. Zhou HL, Zhang R, Anand P, et al. Metabolic reprogramming by the S‐nitroso‐CoA Reductase system protects from kidney injury. Nature 2019; 565: 96–100. [DOI] [PMC free article] [PubMed] [Google Scholar]
- 24. Yang W, Lu Z. Nuclear PKM2 regulates the Warburg effect. Cell Cycle (Georgetown, Tex) 2013; 12: 3154–3158. [DOI] [PMC free article] [PubMed] [Google Scholar]
- 25. Weng ML, Chen WK. Fasting inhibits aerobic glycolysis and proliferation in colorectal cancer via the Fdft1‐mediated AKT/mTOR/HIF1α pathway suppression. Nat Commun 2020; 11: 1869. [DOI] [PMC free article] [PubMed] [Google Scholar]
- 26. Takagaki Y, Koya D, Kanasaki K. Dipeptidyl peptidase‐4 inhibition and renoprotection: the role of antifibrotic effects. Curr Opin Nephrol Hypertens 2017; 26: 56–66. [DOI] [PubMed] [Google Scholar]
- 27. Hua W, Ten Dijke P. TGFβ‐induced metabolic reprogramming during epithelial‐to‐mesenchymal transition in cancer. Cell Mol Life Sci 2019; 7: 2103–2123. [DOI] [PMC free article] [PubMed] [Google Scholar]
- 28. Sas KM, Kayampilly P, Byun J, et al. Tissue‐specific metabolic reprogramming drives nutrient flux in diabetic complications. JCI Insight 2016; 1: e86976. [DOI] [PMC free article] [PubMed] [Google Scholar]
- 29. Ouyang X, Han SN, Zhang JY, et al. Digoxin suppresses pyruvate kinase M2‐promoted HIF‐1alpha transactivation in steatohepatitis. Cell Metab 2018; 27: 339–350.e3. [DOI] [PMC free article] [PubMed] [Google Scholar]
- 30. Bhedi CD, Nasirova S, Toksoz D, et al. Glycolysis regulated transglutaminase 2 activation in cardiopulmonary fibrogenic remodeling. FASEB J 2020; 34: 930–944. [DOI] [PMC free article] [PubMed] [Google Scholar]
- 31. Shen Y, Jiang L, Wen P, et al. Tubule‐derived lactate is required for fibroblast activation in acute kidney injury. Am J Physiol Renal Physiol 2020; 318: F689–F701. [DOI] [PubMed] [Google Scholar]
- 32. Pan Y, Wang W, Huang S, et al. Beta‐elemene inhibits breast cancer metastasis through blocking pyruvate kinase M2 dimerization and nuclear translocation. J Cell Mol Med 2019; 23: 6846–6858. [DOI] [PMC free article] [PubMed] [Google Scholar]
- 33. Demaria M, Poli V. PKM2, STAT3 and HIF‐1α: The Warburg’s vicious circle. Jak‐Stat 2012; 1: 194–196. [DOI] [PMC free article] [PubMed] [Google Scholar]
- 34. Yamamoto T, Miyazaki S, Kawasaki K, et al. Rat bovine serum albumin (BSA) nephritis. VI. The influence of chemically altered antigen. Clin Exp Immunol 1986; 65: 51–56. [PMC free article] [PubMed] [Google Scholar]
Associated Data
This section collects any data citations, data availability statements, or supplementary materials included in this article.
Supplementary Materials
Figure S1 | Animal protocol.
Figure S2 | (a) Quantification of Figure 1S, protein levels were calculated by normalized to β‐actin when densitometric analysis was done. Control, n = 5 mice; STZ, n = 7 mice; BSA, n = 5 mice; STZ+BSA, n = 6 mice. (b) Quantification of Figure 1T n = 5 mice/group. The data are expressed as the mean ± SEM in the graph. P < 0.05 was recognized as significant.
Figure S3 | Analysis of BSA/creatine ratio in mice urine.
Figure S4 | PK activity in mice kidney samples.
Figure S5 | HK2 cell co‐incubation with DASA‐58 and TGF‐β1 for 48 hours.
Figure S6 | Quantification of Figure 5L n = 5 independent experiments.
Figure S7 | HK2 cells were incubated with PHD2 siRNA or TSC1 siRNA with or without TEPP‐46 for 48 h.
Figure S8 | Immunoprecitation analysis of PKM2 and mTOR interaction, HK2 cell exposed to high‐medium with or without rapamycin for 48 h.
Figure S9 | HK2 cell exposed to normal oxygen and hypoxic statement with or without TEPP‐46.


