Abstract
Purpose
Due to the adverse effects of antidiabetic drugs, nowadays, nutraceuticals have been of much interest to investigators. Therefore, the present study aimed to explore the potential effects of enteral nutritional (EN) formulas on the gut microbiota and metabolic regulation of type 2 diabetes mellitus (T2DM) mice and compare the differences between whey protein and soy protein.
Methods
EN formulas made of whey protein or soy protein were administered for five weeks and then mice tissue samples were obtained to examine the metabolic parameters and histopathology of the pancreas, liver, jejunum and colon. 16S rRNA V3-V4 region gene sequencing was used to analyze the changes in the gut microbiota.
Results
After the five-week intervention, the alpha diversity had recovered slightly, and the soy protein group (SPG) achieved a better effect than the whey protein group (LPG). The overall composition of gut microbiota was regulated. The abundance of Bacteroidetes and TM7 had raised significantly and the abundance of Firmicutes and Deferribacteres had declined after treatment, with no significant difference between the LPG and SPG. The types of beneficial bacteria were increased at the genus and species level. The level of hexokinase (HK) and pyruvate kinase (PK) had significantly recovered and inhibited the level of α-glucosidase. In addition, the EN formulas treatment reduced the levels of inflammatory factor (TNF-α) in liver and muscle. The level of glucose transporter type 2 (GLUT-2) levels in the liver and intestine also significantly increased. Moreover, the metabolism regulation of the SPG was better than that of the LPG. The EN formulas treatment improved the pancreas, liver, jejunum and colon histology.
Conclusion
The EN formulas regulated the overall structure of the gut microbiota and improved the metabolic level in streptozotocin/high-fat diet (STZ/HFD) diabetic mice. Therefore, EN formula may potentially become an effective nutritional adjunctive therapy for T2DM.
Keywords: type 2 diabetes mellitus, gut microbiota, enteral nutritional formula, soy protein, whey protein, 16S rRNA gene sequencing
Introduction
Type 2 diabetes mellitus (T2DM) is a nutritional metabolic disorder, characterized by high blood glucose levels, abnormal metabolism of carbohydrates, fats and proteins, and insulin resistance.1,2 The prevalence of T2DM is similar to epidemic proportions worldwide.1 At present, among the 392 million diabetic patients worldwide, the incidence of T2DM is 85%–95%.3 Diabetes has become a disease seriously impairing people’s health and raising their economic burdens.
Gut microbiota plays an extremely important role in maintaining a healthy body.4–6 Recent studies have shown that there is a close interaction between obesity, diabetes, and gut microbiota disorder.7–11 Disordered gut microbiota seems to affect the host’s metabolism by using nutrients and metabolites, increasing the sensitivity to metabolic disorders, such as insulin resistance and metabolic syndrome.12,13 There are pieces of evidence showing that the composition of the adult gut microbiota between those diabetic patients and control groups had significant differences,14,15 and indicating that the composition of gut microbiota may affect the energy intake and utilization, intestinal permeability, transport rate, mucosal immunity, and systemic inflammation.16,17
The complex interaction between genetics and external factors, such as stress, diet, and infection, may lead to T2DM.18,19 The rate-limiting enzymes involved in the process of glucose metabolism are essential for T2DM; for instance, hexokinase (HK) and pyruvate kinase (PK) are responsible for glycolysis.20 Glucose transporter proteins (GLUTs) mediate glucose intake and utilization.21 According to previous research, hyperglycemia is associated with glucose transporter type 2 (GLUT2).22 Diabetes can lead to the abnormal expression and production of inflammatory cytokines such as tumor necrosis factor, causing chronic low-level inflammation.18
Enteral nutritional (EN) formulas are applicable to patients with food or nutritional intake problems or abnormal metabolism; or with special medical nutritional needs whose dietary management is difficult to achieve by adjusting to an ordinary diet.23,24 The role of EN formulas in diabetic patients is to provide the required macro- and micronutrients, including part or all of the carbohydrates, proteins, fats, vitamins and minerals needed, which could reduce the risk of malnutrition or overnutrition in diabetic patients.25,26 It is generally believed that EN formulas are beneficial to health because they improve glycemic control, prevent intestinal barrier dysfunction, and maintain the integrity of mucosal functioning.27 Whey protein can reduce blood glucose and improve oxidative stress, anti-inflammatory and immune regulation.28,29 It has been reported that the intake of plant proteins increases energy metabolism and reduces energy intake.30 Studies have shown that soy protein can reduce the risk of T2DM and lower cholesterol.31,32 Nilsson pointed out that different proteins have different abilities to stimulate insulin release.33 Recently, many studies have focused on revealing how gut microbiota influences the host metabolism and have investigated how to promote the development of diabetes and its related complications. Therefore, in this study, two different EN formulas containing whey or soy protein, respectively, were made according to the standards of the Chinese “General Rules for Formulated Foods for Special Medical Purposes” (GB 29922-2013) and Abbott Glucerna slow-release powder.34,35 The nutritional effects of EN formulas were revealed by detecting the biochemical and histopathological indicators and gut microbiota changes in diabetic conditions induced by streptozotocin/high-fat diet (STZ/HFD) in mice and by comparing the differences between whey and soy protein.
Materials and Methods
Preparation of the Diet and Chemicals
The whey (lactalbumin) and soy protein were added as 23% (w/w) to the EN formulas separately. The rest of each formula was made up of 20% fat, 43.5% carbohydrates, 10% dietary fiber, and 3.3% various vitamins and mineral elements (Table 1). All the raw materials used in the formulas were of food-grade quality and purchased from Henan Jianjiu Industrial Co. Ltd. (Zhengzhou, Henan, China). The high-fat diet (HFD, 47.3 kcal/100 g, 45% fat, 35% carbohydrate, and 20% protein) was obtained from Suzhou Shuangshi Experimental Animal Feed Technology Co. Ltd., (Suzhou, Jiangsu, China). The normal diet (20 kJ/kg, 5% fat, 54% carbohydrate, and 18% protein) was purchased from Shanghai Jiesijie Experimental Animal Co. Ltd., (Shanghai, China). Abbott Glucerna slow-release powder was used as a positive control to compare the effect of the designed formulas. The proximate composition of Abbott Glucerna was protein (21.15%: Casein, soy protein), fats (15.38%: sunflower seed oil, soy oil), and carbohydrates (55.9%). Tableting of the EN formulas was carried out using a tablet machine (Mini PRESS-IISF, India).
Table 1.
Design of the Enteral Nutritional Formulas
| Nutrient Component | Content (g/100g) | ||
|---|---|---|---|
| SPG | LPG | ||
| Protein | Soy protein30 | 0.00 | 23.00±2% |
| Whey protein29 | 23.00±2% | 0.00 | |
| Fat | Fish oil | 5.00±1% | 5.00±1% |
| Olive oil | 15.00±1% | 15.00±1% | |
| Carbohydrate | Tapioca starch | 17.50±1% | 17.50±2% |
| Isomaltulose | 5.00±2% | 5.00±2% | |
| Oligosaccharide fructose | 9.00±2% | 9.00±2% | |
| Corn starch | 12.00±2% | 12.00±2% | |
| Dietary fiber | 10.00±1% | 10.00±1% | |
| Vitamin and Mineral | 3.30±1% | 3.30±1% | |
| Essence | 2.00×10⁻¹ | 2.00×10⁻¹ | |
Streptozotocin (STZ) was purchased from Sigma Chemical (St. Louis, MO, USA). Citric acid, sodium citrate, chloral hydrate and sterilized saline were purchased from Sinopharm Chemical Reagent Co. Ltd (Shanghai, China). Enzyme-linked immunosorbent assay (ELISA) kits were procured from Nanjing Jiancheng Bioengineering Institute (Shanghai, China).
Animals
Six-weeks-old male specific-pathogen-free (SPF) CD–1® (ICR) IGS mice (20–23 g) were obtained from Beijing Vital River Laboratory Animal Technology Company Ltd. The mice were fed a normal diet or an HFD in separate cages. The animal room was kept at 50 ± 15% humidity and 25 ± 4°C under a 12 h light and dark cycle. The mice had free access to a normal diet and water for the first acclimatization week. All animal procedures were approved by the Institutional Animal Care and Use Committee (IACUC), Shanghai Ocean University Center for Animal Experiments and complied with the Animal Research: Reporting in Vivo Experiments guidelines.
Induction of T2DM and Grouping
Based on previous studies, STZ can induce diabetes better in male mice than in female mice,36,37 so male mice were selected for this study. Moreover, intraperitoneal (i.p.) injection of STZ can induce diabetes. The diabetes groups were given HFD diet for eight weeks. After eight weeks on their diet, HFD-feed mice were intraperitoneally given an injection 55 mg/kg of STZ five times. STZ powder was dissolved immediately into 0.1 mol/L citrate acid buffer (pH 4.5) in an ice bath and administered within 20 min. The standard for the success of model making was 3, 7 and 14 days of blood glucose greater than 16.7 mmol/L and 6 h fasting blood glucose (FBG) greater than 11.1 mmol/L after the last injection. The levels of FBG were measured once a week. Blood glucose was measured at 1, 8, 11, and 13 weeks. The blood samples were collected from the tail vein and measured using a glucometer (Sannuo GA-3 type, Changsha, Hunan, China).
The mice were randomly divided into five groups with six animals in each group as shown in Table 2. Normal food and three different EN formulas were given to mice. The treatment started five weeks after successful induction of diabetes.
Table 2.
Grouping Information
| Abbreviation | Groups | Nutrition Support | Animals |
|---|---|---|---|
| CG | Control group | Normal food | Normal mice |
| BG | Black group | Normal food | Diabetic mice |
| PG | Positive control group | Abbott Glucerna slow-release powder | Diabetic mice |
| LPG | Whey protein group | LPG EN formula | Diabetic mice |
| SPG | Soy protein group | SPG EN formula | Diabetic mice |
Biochemical Analysis
After the five-week treatment, the mice were fasted for 12 h and then anesthetized with 5 mg/100 g body weight of chloral hydrate and sacrificed. Then, the livers, muscles and intestines were excised from all mice. The tissues were stored at −80°C in a refrigerator until evaluated. All of the colorimetric assay and enzyme-linked immunosorbent assay (ELISA) kits were obtained from Nanjing Jiancheng Bioengineering Institute (Shanghai, China) unless specified otherwise.
Enzymes Related to the Glucose Metabolism Assay
Six mice from each group were used to detect the enzymes related to glucose metabolism. First, 0.1 g of liver tissue was homogenized with 1 mL of physiological saline. After centrifugation at 12,000 rpm for 20 min at 4°C, the supernatant was collected and measured for HK and PK using colorimetric assay kits. Then, 0.1 g of liver tissue was homogenized with 9 mL of physiological saline. After centrifugation at 12,000 rpm for 20 min at 4°C, the supernatant was collected and measured for α-glucosidase levels using ELISA kits following the manufacturer’s instructions. All the operating procedures were performed on ice.
Inflammatory Cytokines Assay
Six mice from each group were used to detect the inflammatory cytokines. The tissue samples from each mouse were tested separately. In particular, 0.1 g of liver and muscle tissues was homogenized with 9 mL of physiological saline. All the operating procedures were performed on ice. After centrifugation at 12,000 rpm for 20 min at 4°C, the supernatant was collected and the TNF-α level was measured using an ELISA kit.
Glucose Transporter Assay
The pretreatment and determination of the intestine tissue were the same as for the inflammatory cytokines assay. Briefly, 0.1 g of each intestine tissue was homogenized with 9 mL of physiological saline. Subsequent processing and determination of the intestine tissues were the same as for the liver tissues.
Histopathological Study
At the end of the five–week treatment, the pancreas, liver, colon and jejunum tissues of the mice were harvested and fixed in 10% formalin buffer for 48 h and then embedded in paraffin. Tissues sections were sliced on glass slides to a thickness of 5 μm and sections were deparaffinized with xylene, then gradually rehydrated by decreasing the concentration of ethanol for staining. The sections were stained with hematoxylin and eosin (ie, HE staining) and mounted under a cover glass, and then observed under a light microscope.38
Fecal Microbiota Sampling
Feces for DNA extraction were collected in a thoroughly cleaned room after changing the litter. Serial mice litter was procured from Suzhou Shuangshi Experimental Animal Feed Technology Co. Ltd. (Suzhou, Jiangsu, China). Fecal collection was undertaken for three mice per group using serial tweezers after defecation during weeks 1, 8 and 15. The samples were frozen in liquid nitrogen immediately upon collection and then stored at − 80°C in refrigerators until DNA extraction and sequencing.
DNA Extraction and 16S rRNA Sequencing
Fecal DNA was extracted from 0.1 g of feces using QIAmp powerfecal DNA kit (Qiagen, Hilden, Germany, 12830-50) following the manufacturer’s instructions.39
The extracted DNA was firstly checked using an Agilent 2100 Bioanalyzer. To be considered qualified, the samples had to have no pigmentation, no degradation or slight degradation, a volume between 1.5 and 100 μL, and a concentration between 6 and 100 ng/μL. The V3-V4 region of the 16S rRNA gene was amplified using primer 341F (ACTCCTACGGGAGGCAGCAG) attached and reverse primer 806F (GGACTACHVGGGTWTCTAAT). Then, 30 ng of qualified genomic DNA sample and the corresponding fusion primers were taken to configure the PCR reaction system, and the PCR reaction parameters were set for PCR amplification. The PCR amplification product was purified and dissolved in elution buffer using Agencourt AMPure XP magnetic beads, then it was labeled, and a library was successfully made. The fragment range and concentration of the library were tested using an Agilent 2100 Bioanalyzer. Qualified libraries were selected based on the size of the insert. The HiSeq2500 platform was used for sequencing and the sequencing type was PE300.
After filtering the downloaded data, the remaining high-quality clean data were used for post-analysis. The reads were stitched together into tags by the overlapping relationship between reads. Then, the tags were clustered into OTUs and compared to databases before carrying out species annotations. The samples were grouped by grouping information.
Statistical Analysis
Metabolic Parameters
Statistical analysis was performed using Origin 8.5 and GraphPad Prism 8.0® software. One-way ANOVA with Tukey’s post-hoc test or Student’s t-test was used to test the statistical significance. All data were expressed as the mean ± standard error of the mean (S.E.M.). The values were considered to be significantly different at p < 0.05.
Fecal Gut Microbiota
Sample species complexity analysis and species differences between groups were carried out based on OUTs and annotation results. The alpha diversity analysis, including the Shannon index, observed species, good coverage, the chao1 index, the ACE index, and the Simpson index, was calculated. The Wilcox test was used for comparison between the two groups, and Kruskal test was used for comparison between the three and the over three groups. Principal Components Analysis (PCA) was performed with the R software (v3.1.1) of the ade4 package. Partial least-squares discrimination analysis (PLS-DA) was analyzed using the R software (v3.2.1) of the mix Omics package. All reads were classified using a Bayesian classifier. Species with an abundance of less than 0.5% in all samples were combined.
Results
Enteral Nutritional Formulas Regulate the Gut Microbiota of Type 2 Diabetes Mice
EN Formulas Recover the Overall Structure of Gut Microbiota in T2DM Mice
Since the composition of the gut microbiota is related to T2DM,40 the gut microbiota composition was analyzed using 16s rRNA V3-V4 gene sequencing analysis on a HiSeq 2500 platform for 45 fecal samples from 15 mice at three time points (weeks 1, 8, and 13) during the experiment to reveal the effects of the EN formulas.
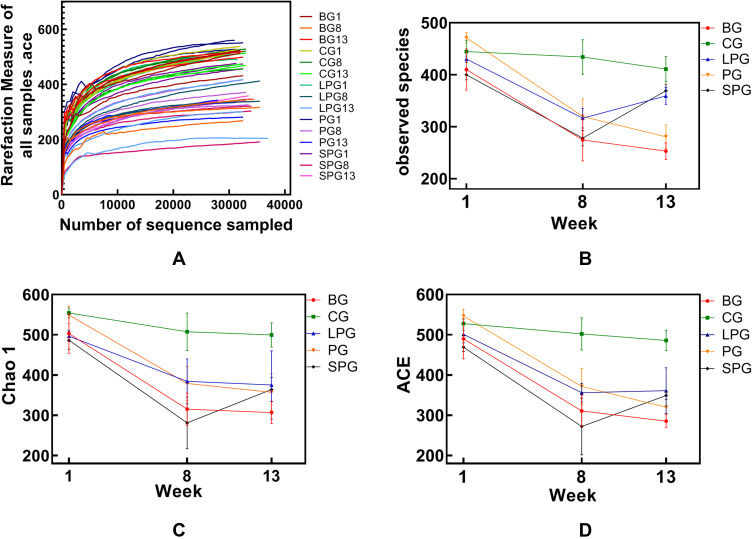
The dilution curve tends to be flat, and it is believed that the sequencing depth has basically covered all species in the sample (Figure 1A). The alpha diversity refers to the analysis of species diversity, including the observed index, the chao1 index, and the ACE index, which reflect the community richness of the sample. A higher richness is directly proportional to a higher diversity. The alpha diversity analysis identified the indexes of the observed species, and for the Chao1 and ACE index, there was basically no change in CG during the feeding period. The observed species, the Chao1 index, and the ACE index of each group did not differ significantly in the first week (Figure 1B–D). The α-diversity in T2DM mice declined significantly (p < 0.05) after successful T2DM modeling, and it was significantly different from CG (p < 0.05). The observed species index of the LPG and the SPG recovered by 13.59% and 32.85%, respectively. The Chao1 index was decreased in the LPG by 2.38%, and increased in SPG by 15.82%. The LPG’s ACE index was recovered by 1.45%, and that of the SPG increased by 14.32%. Thus, although the α-diversity index of the LPG and the SPG did not differ significantly after treatment, the changes in the SPG were greater than those in the LPG.
Figure 1.
Alpha diversity analysis and the rarefaction curve of the alpha diversity at the OUT level calculated based on the detected sequences of the mice’s fecal gut microbiota at three time-points (group names combined with 1 refer to mice in the first week, combined with 8 means type 2 diabetes models were successfully made, and combined with 13 means after the five-week intervention). (A) The rarefaction of all samples; (B) Observed species index; (C) Chao 1 index; (D) ACE index.
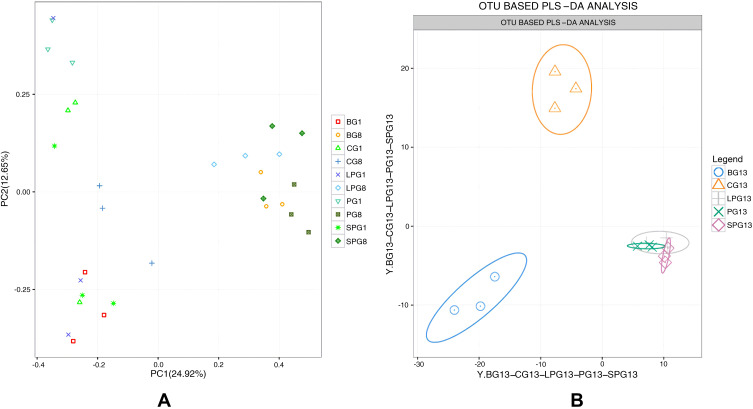
The overall composition of the gut microbiota in the different groups was clustered using PCA at the OTU level (Figure 2), which was obtained from the sequences with an OUT level higher than 97%. The PCA showed a significant difference in the eighth week, which illustrated that T2DM mice had a unique fecal gut microbiota composition that was different from CG (Figure 2A). The PLS-DA analysis demonstrated that the fecal gut microbiota communities of the treatment group (PG, LPG, and SPG) were more closely related to the CG than the BG after five weeks of EN formulas consumption, and there was no significant difference between the LPG and the SPG (Figure 2B). Therefore, each of the EN formulas regulated the overall structure of T2DM-induced fecal gut microbiota dysbiosis toward normal. However, the overall composition of the gut microbiota could not completely return to a healthy level.
Figure 2.
Beta-diversity by group-time. Based on the OUT abundance of the 45 samples, principal component analysis (PCA) and partial least-squares discrimination analysis (PLS-DA) were used to cluster the composition of the gut microbiota. The percentage change in the plotted principal coordinates is indicated on the axes. Points of different colors and shapes represent different groups. (A) PCA of 15 samples in the eighth week, (B) OUT abundance based on the PLS-DA analysis demonstrating the effect of the EN formulas on T2DM.
EN Formula Increased the Gut Microbiota Community Richness and Diversity in T2DM
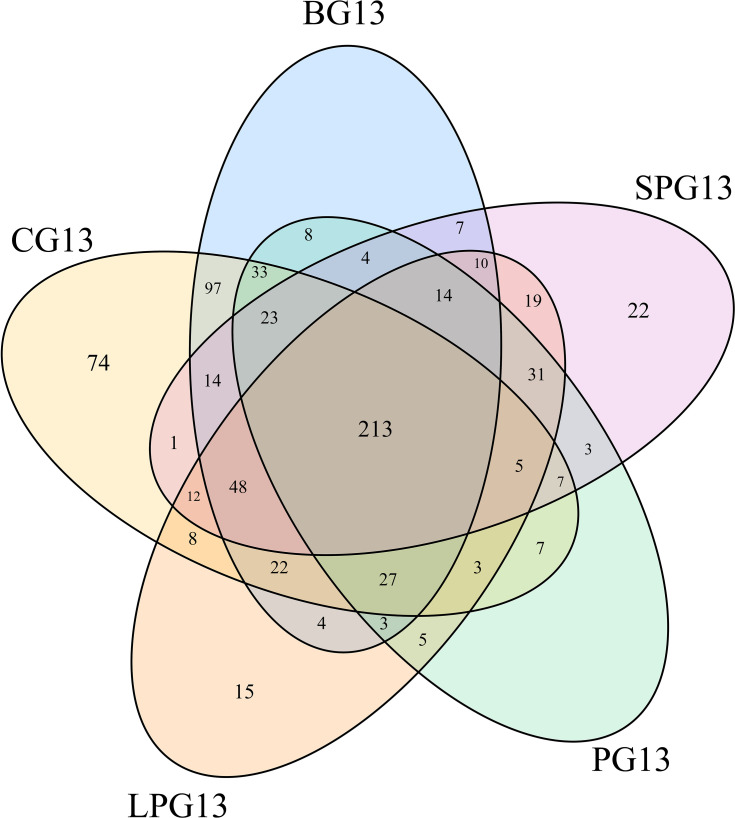
A total of 809 OTUs were detected. Figure 3 shows the common and unique OTUs in the different groups and the number of unique OTUs in the diabetic mice increased prior to the EN formulas; however, the number of unique OTUs decreased in LPG, PG and SPG after the EN formulas treatment.
Figure 3.
Venn diagram showing the number of common and unique OTUs in the different groups.
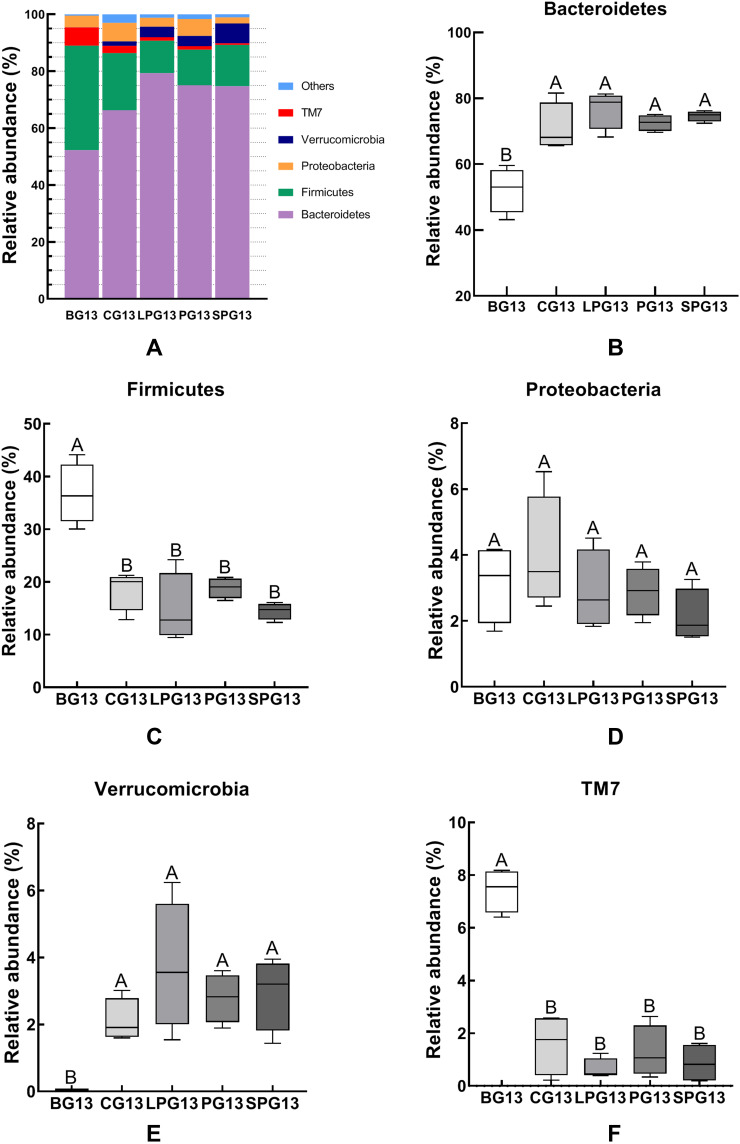
The relative abundance of a phylum had significant differences between BG, CG and three treatment groups in the mice gut microbiota after the five-week treatment with EN formulas. Thus, five predominant phyla, which accounted for 98% of the total gut microbiota, including Bacteroidetes, Firmicutes, Proteobacteria, TM7 and Verrucomicrobia (Figure 4), were selected to observe the changes in the gut microbiota at the phylum level. Figure 4A shows that Bacteroidetes and Firmicutes accounted for the majority of the microbiota in the 13th week. Compared with the BG mice, the CG mice had a higher abundance of Bacteroidetes and Verrucomicrobia, while they had a lower abundance of Firmicutes and TM7. After the EN formulas treatment, the abundance of Bacteroidetes and Verrucomicrobia experienced significant growth and the abundance of Firmicutes and TM7 (p < 0.05) declined in all treatment groups (Figure 4B–F). But there was no significant difference in Proteobacteria among all groups. There was no significant difference between the LPG and the SPG.
Figure 4.
The relative abundance of the different species in the microbiota of the five-week EN formulas intervention on the gut microbiota at the phylum level (A). The relative abundance of Bacteroidetes (B), Firmicutes (C), Proteobacteria (D), Verrucomicrobia (E), and Deferribacteres (F) in the different groups. All data with different superscript letters were significantly different (p < 0 05) according to a post-hoc one-way ANOVA.
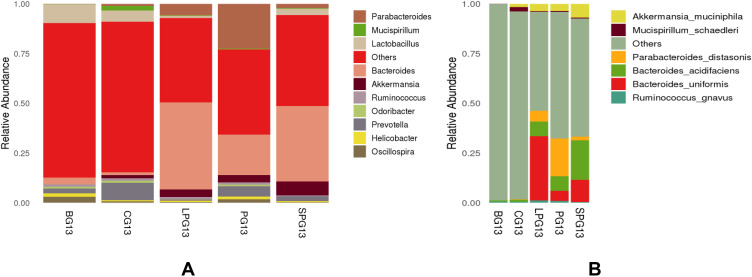
At the genus level (Figure 5A), the gut microbiota was mainly composed of Parabacteroides, Mucispirillum, Lactobacillus, Bacteroides, Akkermansia and Prevotella. Compared with the BG, the CG had a higher abundance of Lactobacillus, Oscillospira and Bacteroides, while it had a lower abundance of Akkermansia and Prevotella. After the EN formulas treatment, the abundance of Bacteroides, Akkermansia and Parabacteroides increased and the abundance Lactobacillus declined in all treatment groups.
Figure 5.
Relative abundance of the different species in the microbiota of five-week EN formulas intervention on the gut microbiota at genus (A) and species (B) level.
At the species level (Figure 5B), Akkermansia muciniphila, Mucispirillum schaedler, Parabacteroides distasonis, Bacteroides acidifaciens, Bacteroides uniformis and Ruminococcus gnavus had higher relative abundances. After the five-week intervention, the relative abundance of Akkermansia muciniphila, Parabacteroides distasonis, Bacteroides acidifaciens, Bacteroides uniformis and Ruminococcus gnavus in the treatment group increased. There was a clear gap in the diversity of beneficial gut microbiota at the species level. Six beneficial species in the LPG, the PG, and the SPG treatment groups were identified, which were close to the four species of CG and significantly more than the two species of the BG. The BG contained only one kind of acid-producing Bacteroides. In particular, Bacteroides acidifaciens, which produces beneficial bacteria such as butyric acid, increased significantly in the treatment group. The relative abundances of Bacteroides acidifaciens in the LPG, the PG, and the SPG were 7.38%, 7.31%, and 19.96%, respectively. EN formulas changed the structure of the gut microbiota at the species level.
This indicates that the EN formulas had a certain effect on the changes in the composition and structure of gut microbiota in the diabetic mice.
Enteral Nutritional Formula Treatment Attenuate the Features of Metabolic Syndrome
Effects of the EN Formulas on Glucose Metabolism
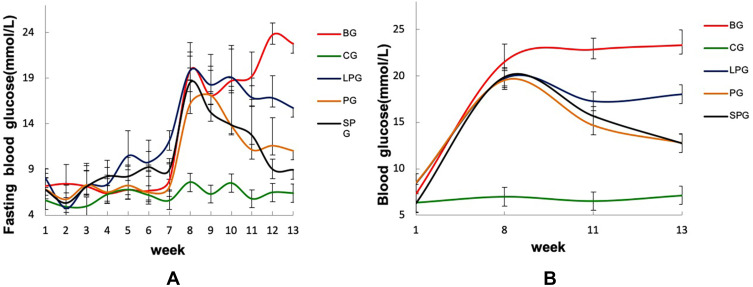
The changes in the FBG and blood glucose during the experiment are shown in Figure 6. Before the eighth week, the levels of FBG and blood glucose of all groups except the CG increased, and reached the highest at the eighth week, which provided strong evidence for the success of T2DM modeling. After the five-week treatment, the FBG and blood glucose levels of all the treatment groups decreased. Among them, the FBG of the PG and the SPG were reduced by 31.49% and 51.60%, and the blood glucose was reduced by 34.75% and 35.98%, respectively. The effect of the LPG on lowering FBG and blood glucose was not obvious, reducing by 14.75% and 8.69%, respectively. The results indicated that the EN formulas could reduce the blood glucose level in T2DM mice.
Figure 6.
Changes in the fasting blood glucose (A) and blood glucose (B) of the mice.
Effects of the EN Formulas on the Enzymes Linked to Glucose Metabolism
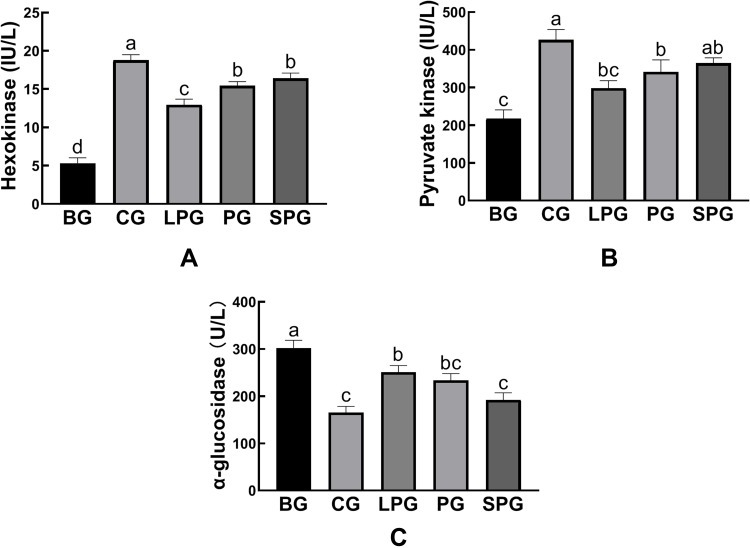
Figure 7 reveals the effects of the EN formulas on liver hexokinase (HK), pyruvate kinase (PK), and α-glucosidase levels after five-week treatment in mice. Compared with CG (18.79 ± 0.40 IU/L and 426.80 ± 15.67 IU/L, respectively), the contents of HK and PK in the liver of the BG (5.32 ± 0.41 IU/L, 217.80 ± 13.30 IU/L, respectively) were significantly reduced (p < 0.05). After treated with the EN formulas for five weeks, the contents of hepatic HK and PK were significantly recovered (p < 0.05). The HK levels of the LPG, PG and SPG were restored to 12.96 ± 0.43, 15.43 ± 0.31, 16.42 ± 0.39 IU/L, respectively. The PK levels of LPG, PG and SPG were restored to 298 ± 11.40, 341.47 ± 18.46, 364.56 ± 8.22 IU/L, respectively. Among all the treatment groups, the SPG achieved the best effect, although it did not recover to normal levels.
Figure 7.
The level of hexokinase (A), pyruvate kinase (B), α-glucosidase (C) in the liver. Data represented as mean ± S.E.M. Data with different superscript letters are significantly different (p < 0 05) according to a post-hoc one-way ANOVA. a,b,cBars with symbols at each group having different superscripts are significantly different (P < 0.05) using one-way ANOVA analysis.
Figure 7C shows that the amount of α-glucosidase was elevated significantly (p < 0.05) in the BG (302.22 ± 9.48 U/L) compared to the CG (165.75 ± 7.30 U/L). After the intervention, the α-glucosidase levels of the LPG, PG and SPG were reduced to 251.19 ± 7.96, 233.74 ± 8.21, and 192.29 ± 8.69 U/L, respectively. Compared to the BG, the treatment groups reduced the amount of α-glucosidase significantly (p < 0.05). The treatment had a better curative effect on the SPG than on the LPG.
Effects of the EN Formulas on Inflammatory Cytokines
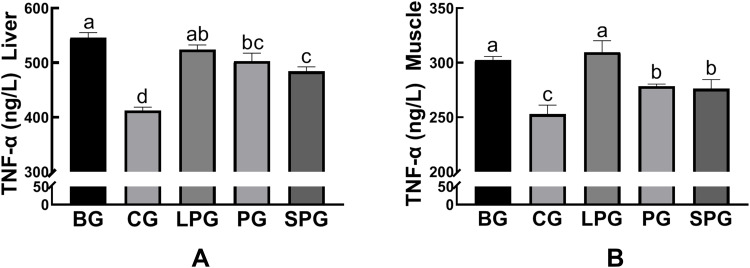
The amounts of inflammatory cytokines (TNF-α) in liver and muscle were significantly increased (p < 0.05) in the BG mice (545.75 ± 5.44 ng/L) compared to the CG mice (412.29 ± 3.61 ng/L). After the intervention, the amounts of TNF-α of the LPG, PG and SPG were reduced to 524.23 ± 4.80, 503.02 ± 8.31, and 484.39 ± 4.59 ng/L, respectively. The amounts of TNF-α had a significant decrease (p < 0.05) in the PG and SPG compared to the BG, but the LPG was not visibly reduced (Figure 8A). The amounts of TNF-α in muscle had a significant decrease (p < 0.05) in the PG (278.38 ± 1.15 ng/L) and the SPG (26.16 ± 4.79 ng/L) compared to the BG, but the LPG (309.65 ± 6.04 ng/L) did not visibly reduce (Figure 8B). The results showed that the EN formulas had an anti-inflammatory effect. Among the treatment groups, the SPG experienced a better anti-inflammatory effect than the LPG.
Figure 8.
The level of TNF-α in liver (A), muscle (B) in the different groups. Data represented as the mean ± S.E.M. Data with different superscript letters are significantly different (p < 0 05) according to a post-hoc one-way ANOVA. a,b,c,dBars with symbols at each group having different superscripts are significantly different (P < 0.05) using one-way ANOVA analysis.
Effects of the EN Formulas on Glucose Transport 2
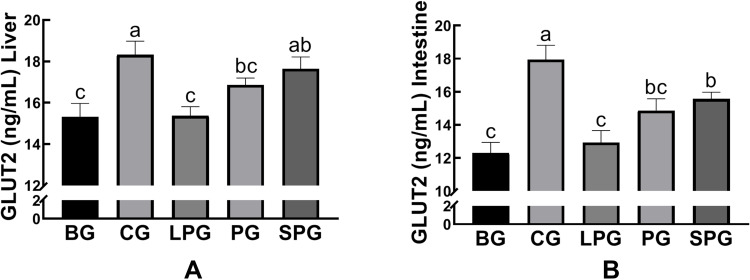
As shown in Figure 9, the levels of GLUT-2 in liver and intestine were reduced significantly (p < 0.05, both) in the BG (15.32 ± 0.37 and 12.29± 0.37 ng/mL, respectively) compared to the CG (18.32 ± 0.38 and 17.94 ± 0.50 ng/mL, respectively). After the five-week intervention, the GLUT2 levels of liver and intestine in the LPG (15.37 ± 0.26 and 12.93 ± 0.42 ng/mL, respectively) did not significantly alter in comparison to the CG. The SPG had raised the levels of GLUT-2 in the liver (17.64 ± 0.33 ng/mL) and intestine (15.57 ± 0.23 ng/mL), which had a greater extent than in the LPG (p < 0.05).
Figure 9.
The level of glucose transporter type 2 (GLUT 2) in the liver (A), and intestine (B). Data represented as the mean ± S.E.M. Data with different superscript letters are statistically significant (p < 0.05) according to a post-hoc one-way ANOVA. a,b,cBars with symbols at each group having different superscripts are significantly different (P < 0.05) using one-way ANOVA analysis.
Histopathological Changes in the Pancreas, Liver, Jejunum and Colon
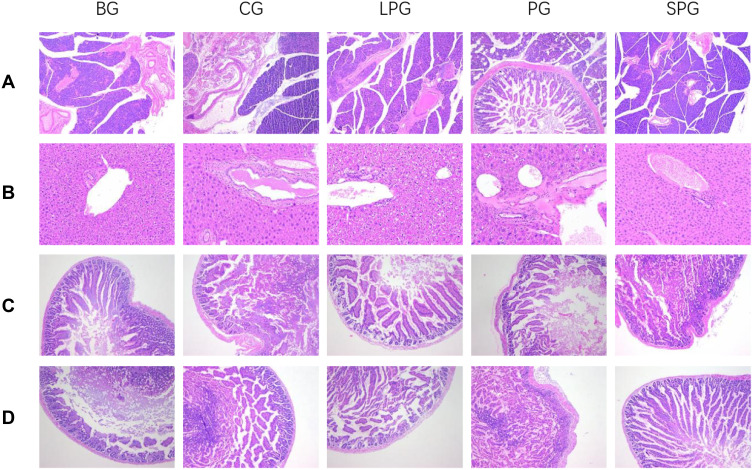
It was observed from the pancreatic tissue section in Figure 10A that the BG islets were atrophic. The number and volume of cells were reduced and the arrangement was disordered, and obvious vacuoles were observed. The EN formulas intervention for five weeks reduced the pancreatic damage compared to the BG.
Figure 10.
Histopathological representation of pancreas (×100) (A), liver (×200) (B), jejunum (×100) (C), and colon (×100) (D).
As shown in Figure 10B, the liver structure of the CG mice was clear and complete. The liver sections showed neatly arranged hepatocytes. The arrangement of hepatocytes was irregular, a blur of the hepatic lobe and the cell cytoplasm was vacuolated, which was opposite to the CG and EN formulas intervention groups.
The HE staining results of the CG mice showed that the jejunum and colon mucosa were intact, the villi were arranged neatly and the structure was complete (Figure 10C and D); the villi of the BG mice were broken and disordered. The jejunum and colon tissue morphology of the EN formulas intervention groups were significantly improved.
Discussion
Drug control therapy for T2DM has certain limitations, so it is necessary to explore adjuvant treatment methods. Nutritional therapy is a prerequisite for other treatment methods. Approximately 30% of diabetics use nutritional supplements.41 Therefore, the enteral nutritional formulas had presented a nutrition therapeutic strategy to manage patients with T2DM.
T2DM significantly alters the fecal gut microbiota of humans and rodents.42,43 T2DM induced by obesity and a high-fat diet is significantly related to N imbalance of the gut microbiota.44 The EN formulas increased the diversity of the gut microbiota, in which soy protein was better than whey protein. The EN formulas treatment increased the relative abundance of Bacteroidetes and decreased the relative abundance of Firmicutes at the phylum level in the gut microbiota, which was the same as previously reported.45,46 Soy protein and whey protein had a slight effect at the phylum level. In rodent research, obesity is associated with decreased levels of Bacteroides.47 An increase in the relative abundance of Bacteroides and a decrease in the relative abundance of Firmicutes help to improve energy extraction in diabetic mice.48 Akkermansia could protect the intestinal mucosal barrier from the erosion of pathogens. Studies have been reported that the abundance of Akkermansia is significantly reduced in the high-fat models, which is consistent with this study.49,50 Short-chain fatty acids (SCFAs) could regulate hepatic gluconeogenesis and accelerate the metabolism of liver lipids and carbohydrates.51 The relative abundance of SCFAs-producing bacteria, such as Bacteroides, Ruminococcus, and Odoribacter, was reduced, which affects the organism metabolism.52 In conclusion, the EN formulas increased the growth of beneficial bacteria. This study confirmed that soy protein had a better regulatory effect on regulating the gut microbiota. In addition, previous studies have shown that diet can regulate the intestinal function and can affect the body metabolism, regulating the secretion of hormones from enteroendocrine cells through influencing the fermentation products of gut microbiota.53–55 The gut microbiota is closely related to health and disease, partly due to the complex metabolic interactions between a host and a microorganism.7 It has been reported that there is a negative correlation between Akkermansia and metabolic disorder markers, while Bacteroide and Bifidobacteria are largely positively correlated with glucose tolerance.56,57 Spearman correlation analysis showed that the level of the FBG was positively correlated with the relative abundance of Bacteroides, Ruminococcus, Oscillospira, and Odoribacter, while negatively related to the relative abundance of Prevotella and Akkermansia (Table S1).
The liver is an important organ involved in metabolism and plays a key role in the metabolic pathways of glycolysis and gluconeogenesis.58 Liver function is highly regulated by the gut microbiota.59,60 Gut microbiota is considered a regulator of T2DM through the “gut-liver axis”.61 It is believed that changes in hepatic enzyme activity are related to alterations in gut microbiota.62 Insulin resistance is closely related to a decrease in glucose utilization. HK and PK are the key rate-limiting enzymes in the glycolysis pathway, which are essential for glucose homeostasis and for improving glucose utilization.63,64 Therefore, increasing the glucose utilization rate by increasing the activity of HK and PK could reduce insulin resistance. It has been reported that there is decreased HK and PK activity in diabetic animals.58,65 Herein, the contents of hepatic HK and PK were decreased in the diabetic mice, while they were increased slightly in the mice treated with the EN formulas. This result confirmed that the EN formulas could directly or indirectly affect hepatic enzyme activity, and soy protein had a greater impact than whey protein.
Alpha-glucosidase has a potential effect to downregulate glucose absorption in diabetics, so it is an essential drug target for the treatment of T2DM.66 Inhibiting the activity of α-glucosidase could slow down the rise of blood glucose.67 Alpha-glucosidase helps to break down carbohydrates (that are not easily absorbed in the diet) into simple sugars (easily absorbed by the small intestine), including invertase, glucoamylase, maltase and dextrinase, so α-Glucosidase inhibitors can reduce an increased concentration of glucose in the lower parts of the gut.68 In this study, the content of α-glucosidase increased in diabetic mice, however, the content of α-glucosidase was reduced after the EN formulas intervention. The SPG experienced restoration of their health levels, while the α-Glucosidase level of the LPG had also decreased but was significantly different from that of the healthy mice. The regulatory effect of soy protein on α-glucosidase was also better than that of whey protein.
Recently, it was reported that a decrease in TNF-α improves systemic inflammation in T2DM rats.69,70 Studies have shown that cytokine-mediated low-grade chronic inflammation plays an important role in the pathogenesis of T2DM.71 Increased levels of TNF-α are associated with the development of insulin resistance and T2DM.72 TNF-α can activate downstream NF-κB and MAPKs family proteins, which induces the organism inflammation.73 It has been shown that prebiotics can reduce low-grade intestinal inflammation by regulating the disordered gut microbiota.74,75 In this study, the EN formulas intervention reduced the levels of pro-inflammatory cytokine (i e TNF-α). As shown in the previous research, an increase in beneficial bacteria in the gut microbiota decreases TNF-α expression.76 Interestingly, the EN formulas herein showed an anti-inflammatory effect. The SPG experienced a better regulatory effect on inflammatory factors than the LPG. Thus, the anti-inflammatory effect of soy protein was better than that of whey protein.
The transport of glucose in the liver and intestine is mainly undertaken by GLUT2,35,77 facilitating the passage of dietary sugars, glucose, fructose, and galactose towards the bloodstream.78 Thus, GLUT2 deletion causes glucose malabsorption.79 In this study, the level of GLUT-2 was reduced in the liver and intestine of the T2DM mice, and the EN formulas treatment groups had increased the level of GLUT-2 in the liver and intestine to accelerate glucose transport. The SPG had raised the levels of GLUT-2 in the liver and intestine to a greater extent than those in the LPG. This result supports our previous finding that the regulatory effect of soy protein in diabetic mice was better than that of whey protein.
Conclusions
In this study, the changes in the gut microbiota of the diabetic mice during enteral nutritional formula treatment and the effects on the metabolic level were explored. The results showed that the EN formulas restored glucose homeostasis, alleviated gut microbiota disturbance and decreased organ damage. These effects could be due to the nutritional regulation of the EN formulas adjusting the α-diversity, optimizing the structure of the gut microbiota, and then regulating the liver’s nutritional metabolism level, namely, increasing the levels of HK, PK, and GLUT2, inhibiting the activity of α-glucosidase, and reducing the inflammatory factors TNF-α. In this study, it was found, for the first time, that soy protein has a prominent regulatory effect on T2DM than whey protein. In conclusion, the experimental results provide evidence that EN formulas can improve HFD-induced T2DM metabolic syndrome by regulating the overall structure of the gut microbiota. It is speculated that the hepato-enteric circulation is not only involved in material metabolism but may also be involved in the transformation of gut microbiota. The EN formulas may become a helpful nutritional adjunctive therapy for dietary intervention to manipulate type 2 diabetes mellitus.
Acknowledgments
This research was funded by Science and Technology Commission of Shanghai Municipality: 1749074222500, National Natural Science Foundation of China: 81502955; 81750110548.
Disclosure
The authors report no conflicts of interest in this work.
References
- 1.Vu BG, Stach CS, Kulhankova K, Salgado-Pabon W, Klingelhutz AJ, Schlievert PM. Chronic superantigen exposure induces systemic inflammation, elevated bloodstream endotoxin, and abnormal glucose tolerance in rabbits: possible role in diabetes. Mbio. 2015;6(2):e02554–e02514. doi: 10.1128/mBio.02554-14 [DOI] [PMC free article] [PubMed] [Google Scholar]
- 2.Kuai M, Li Y, Sun X, et al. A novel formula Sang-Tong-Jian improves glycometabolism and ameliorates insulin resistance by activating PI3K/AKT pathway in type 2 diabetic KKAy mice. Biomed Pharmacother. 2016;84:1585–1594. doi: 10.1016/j.biopha.2016.10.101 [DOI] [PubMed] [Google Scholar]
- 3.Sun Z, Sun X, Li J, et al. Using probiotics for type 2 diabetes mellitus intervention: advances, questions, and potential. Crit Rev Food Sci Nutr. 2020;60(4):670–683. doi: 10.1080/10408398.2018.1547268 [DOI] [PubMed] [Google Scholar]
- 4.Aggeletopoulou I, Konstantakis C, Assimakopoulos SF, Triantos C. The role of the gut microbiota in the treatment of inflammatory bowel diseases. Microb Pathog. 2019;137:103774. doi: 10.1016/j.micpath.2019.103774 [DOI] [PubMed] [Google Scholar]
- 5.Chen R, Xu Y, Wu P, et al. Transplantation of fecal microbiota rich in short chain fatty acids and butyric acid treat cerebral ischemic stroke by regulating gut microbiota. Pharmacol Res. 2019;148:104403. doi: 10.1016/j.phrs.2019.104403 [DOI] [PubMed] [Google Scholar]
- 6.Shamoon M, Martin NM, O’Brien CL. Recent advances in gut microbiota mediated therapeutic targets in inflammatory bowel diseases: emerging modalities for future pharmacological implications. Pharmacol Res. 2019;148:104344. doi: 10.1016/j.phrs.2019.104344 [DOI] [PubMed] [Google Scholar]
- 7.Miller AW, Orr T, Dearing D, Monga M. Loss of function dysbiosis associated with antibiotics and high fat, high sugar diet. Isme J. 2019;13(6):1379–1390. doi: 10.1038/s41396-019-0357-4 [DOI] [PMC free article] [PubMed] [Google Scholar]
- 8.Gholizadeh P, Mahallei M, Pormohammad A, et al. Microbial balance in the intestinal microbiota and its association with diabetes, obesity and allergic disease. Microb Pathog. 2019;127:48–55. doi: 10.1016/j.micpath.2018.11.031 [DOI] [PubMed] [Google Scholar]
- 9.Pascale A, Marchesi N, Govoni S, Coppola A, Gazzaruso C. The role of gut microbiota in obesity, diabetes mellitus, and effect of metformin: new insights into old diseases. Curr Opin Pharmacol. 2019;49:1–5. doi: 10.1016/j.coph.2019.03.011 [DOI] [PubMed] [Google Scholar]
- 10.Mojsak P, Rey-Stolle F, Parfieniuk E, Kretowski A, Ciborowski M. The role of gut microbiota (GM) and GM-related metabolites in diabetes and obesity. A review of analytical methods used to measure GM-related metabolites in fecal samples with a focus on metabolites’ derivatization step. J Pharm Biomed Anal. 2020;191:113617. doi: 10.1016/j.jpba.2020.113617 [DOI] [PubMed] [Google Scholar]
- 11.Nakamura A, Yokoyama Y, Tanaka K, et al. Asperuloside improves obesity and type 2 diabetes through modulation of gut microbiota and metabolic signaling. iScience. 2020;23(9):101522. doi: 10.1016/j.isci.2020.101522 [DOI] [PMC free article] [PubMed] [Google Scholar]
- 12.Cani PD, Amar J, Iglesias MA, et al. Metabolic endotoxemia initiates obesity and insulin resistance. Diabetes. 2007;56(7):1761–1772. doi: 10.2337/db06-1491 [DOI] [PubMed] [Google Scholar]
- 13.Petruzzelli M, Moschetta A. Intestinal ecology in the metabolic syndrome. Cell Metab. 2010;11(5):345–346. doi: 10.1016/j.cmet.2010.04.012 [DOI] [PubMed] [Google Scholar]
- 14.Qin J, Li Y, Cai Z, et al. A metagenome-wide association study of gut microbiota in type 2 diabetes. Nature. 2012;490(7418):55–60. doi: 10.1038/nature11450 [DOI] [PubMed] [Google Scholar]
- 15.Larsen N, Vogensen FK, van den Berg FWJ, et al. Gut microbiota in human adults with type 2 diabetes differs from non-diabetic adults. PLoS One. 2010;5(2):e9085. doi: 10.1371/journal.pone.0009085 [DOI] [PMC free article] [PubMed] [Google Scholar]
- 16.Cani PD, Delzenne NM. Gut microflora as a target for energy and metabolic homeostasis. Curr Opin Clin Nutr Metab Care. 2007;10(6):729–734. doi: 10.1097/MCO.0b013e3282efdebb [DOI] [PubMed] [Google Scholar]
- 17.Backhed F, Ding H, Wang T, et al. The gut microbiota as an environmental factor that regulates fat storage. Proc Natl Acad Sci U S A. 2004;101(44):15718–15723. doi: 10.1073/pnas.0407076101 [DOI] [PMC free article] [PubMed] [Google Scholar]
- 18.Wellen KE, Hotamisligil GS. Inflammation, stress, and diabetes. J Clin Invest. 2005;115(5):1111–1119. doi: 10.1172/JCI25102 [DOI] [PMC free article] [PubMed] [Google Scholar]
- 19.Astrup A. Healthy lifestyles in Europe: prevention of obesity and type II diabetes by diet and physical activity. Public Health Nutr. 2001;4(2B):499–515. doi: 10.1079/PHN2001136 [DOI] [PubMed] [Google Scholar]
- 20.Kwon SJ, Hwang SJ, Jung Y, et al. A synthetic Nitraria alkaloid, isonitramine protects pancreatic beta-cell and attenuates postprandial hyperglycemia. Metab Clin Exp. 2017;70:107–115. doi: 10.1016/j.metabol.2017.02.002 [DOI] [PubMed] [Google Scholar]
- 21.Harada N, Inagaki N. Role of sodium-glucose transporters in glucose uptake of the intestine and kidney. J Diabetes Investig. 2012;3(4):352–353. doi: 10.1111/j.2040-1124.2012.00227.x [DOI] [PMC free article] [PubMed] [Google Scholar]
- 22.Hansen HH, Jelsing J, Hansen CF, et al. The sodium glucose cotransporter type 2 inhibitor empagliflozin preserves beta-cell mass and restores glucose homeostasis in the male Zucker diabetic fatty rat. J Pharmacol Exp Ther. 2014;350(3):657–664. doi: 10.1124/jpet.114.213454 [DOI] [PubMed] [Google Scholar]
- 23.Elia M, Ceriello A, Laube H, Sinclair AJ, Engfer M, Stratton RJ. Enteral nutritional support and use of diabetes-specific formulas for patients with diabetes: a systematic review and meta-analysis. Diabetes Care. 2005;28(9):2267–2279. doi: 10.2337/diacare.28.9.2267 [DOI] [PubMed] [Google Scholar]
- 24.Devitt A, Oliver J, Hegazi R, Mustad V. Glycemia targeted specialized nutrition (GTSN) improves postprandial glycemia and GLP-1 with similar appetitive responses compared to a healthful whole food breakfast in persons with type 2 diabetes: a randomized, controlled trial. J Diabetes Res Clin Metab. 2012;1(1):20. doi: 10.7243/2050-0866-1-20 [DOI] [Google Scholar]
- 25.Ojo O, Brooke J. Evaluation of the role of enteral nutrition in managing patients with diabetes: a systematic review. Nutrients. 2014;6(11):5142–5152. doi: 10.3390/nu6115142 [DOI] [PMC free article] [PubMed] [Google Scholar]
- 26.Wu R, Tang X, Kang X, et al. Effect of a Chinese medical nutrition therapy diet on gut microbiota and short chain fatty acids in the simulator of the human intestinal microbial ecosystem (SHIME). J Funct Foods. 2019;62:103555. doi: 10.1016/j.jff.2019.103555 [DOI] [Google Scholar]
- 27.McKenzie SJL, Premkumar R, Askelund KJ, et al. The effect of enteral nutrition on adipokines in patients with acute pancreatitis. J Nutr Sci. 2015;4:e33–e33. doi: 10.1017/jns.2015.20 [DOI] [PMC free article] [PubMed] [Google Scholar]
- 28.Derosa G, D’Angelo A, Maffioli P. Change of some oxidative stress parameters after supplementation with whey protein isolate in patients with type 2 diabetes. Nutrition. 2020;73:110700. doi: 10.1016/j.nut.2019.110700 [DOI] [PubMed] [Google Scholar]
- 29.Zhao C, Ashaolu TJ. Bioactivity and safety of whey peptides. LWT. 2020;134:109935. doi: 10.1016/j.lwt.2020.109935 [DOI] [Google Scholar]
- 30.Nepocatych S, Melson CE, Madzima TA, Balilionis G. Comparison of the effects of a liquid breakfast meal with varying doses of plant-based soy protein on appetite profile, energy metabolism and intake. Appetite. 2019;141:104322. doi: 10.1016/j.appet.2019.104322 [DOI] [PubMed] [Google Scholar]
- 31.Li W, Ruan W, Peng Y, Wang D. Soy and the risk of type 2 diabetes mellitus: a systematic review and meta-analysis of observational studies. Diabetes Res Clin Pract. 2018;137:190–199. doi: 10.1016/j.diabres.2018.01.010 [DOI] [PubMed] [Google Scholar]
- 32.Shukla A, Brandsch C, Bettzieche A, Hirche F, Stangl GI, Eder K. Isoflavone-poor soy protein alters the lipid metabolism of rats by SREBP-mediated down-regulation of hepatic genes. J Nutr Biochem. 2007;18(5):313–321. doi: 10.1016/j.jnutbio.2006.05.007 [DOI] [PubMed] [Google Scholar]
- 33.Nilsson M, Stenberg M, Frid AH, Holst JJ, Björck IM. Glycemia and insulinemia in healthy subjects after lactose-equivalent meals of milk and other food proteins: the role of plasma amino acids and incretins. Am J Clin Nutr. 2004;80(5):1246–1253. doi: 10.1093/ajcn/80.5.1246 [DOI] [PubMed] [Google Scholar]
- 34.National food safety standard general rules for formulas for special medical purposes. In: Vol GB 29922-2013. National Health and Family Planning Commission of the People’s Republic of China. 2013:16. [Google Scholar]
- 35.Freitas HS, Schaan BDA, Seraphim PM, Nunes MT, Machado UF. Acute and short-term insulin-induced molecular adaptations of GLUT2 gene expression in the renal cortex of diabetic rats. Mol Cell Endocrinol. 2005;237(1–2):49–57. doi: 10.1016/j.mce.2005.03.005 [DOI] [PubMed] [Google Scholar]
- 36.Sun H, Ma X, Zhang S, Zhao D, Liu X. Resistant starch produces antidiabetic effects by enhancing glucose metabolism and ameliorating pancreatic dysfunction in type 2 diabetic rats. Int J Biol Macromol. 2018;110:276–284. doi: 10.1016/j.ijbiomac.2017.11.162 [DOI] [PubMed] [Google Scholar]
- 37.Tamiru W, Engidawork E, Asres K. Evaluation of the effects of 80% methanolic leaf extract of Caylusea abyssinica (fresen.) fisch & Mey. on glucose handling in normal, glucose loaded and diabetic rodents. BMC Complement Altern Med. 2012;12(1). doi: 10.1186/1472-6882-12-151 [DOI] [PMC free article] [PubMed] [Google Scholar]
- 38.Culling C. Handbook of Histopathological Techniques (Including Museum Technique). SERBIULA (sistema Librum 20). Journal of the American Medical Association; 1957. [Google Scholar]
- 39.Ma C, Sun Z, Zeng B, et al. Cow-to-mouse fecal transplantations suggest intestinal microbiome as one cause of mastitis. Microbiome. 2018;6(1). doi: 10.1186/s40168-018-0578-1 [DOI] [PMC free article] [PubMed] [Google Scholar]
- 40.Forslund K, Hildebrand F, Nielsen T, et al. Disentangling type 2 diabetes and metformin treatment signatures in the human gut microbiota. Nature. 2015;528(7581):262. doi: 10.1038/nature15766 [DOI] [PMC free article] [PubMed] [Google Scholar]
- 41.Shewamene Z, Abdelwuhab M, Birhanu Z. Methanolic leaf extract of Otostegia integrifolia Benth reduces blood glucose levels in diabetic, glucose loaded and normal rodents. BMC Complement Altern Med. 2015;15(1). doi: 10.1186/s12906-015-0535-5 [DOI] [PMC free article] [PubMed] [Google Scholar]
- 42.Zhang Q, Pan Y, Zeng B, et al. Intestinal lysozyme liberates Nod1 ligands from microbes to direct insulin trafficking in pancreatic beta cells. Cell Res. 2019;29(7):516–532. doi: 10.1038/s41422-019-0190-3 [DOI] [PMC free article] [PubMed] [Google Scholar]
- 43.Tremaroli V, Bäckhed F. Functional interactions between the gut microbiota and host metabolism. Nature. 2012;489(7415):242–249. doi: 10.1038/nature11552 [DOI] [PubMed] [Google Scholar]
- 44.Zheng J, Li H, Zhang X, et al. Prebiotic mannan-oligosaccharides augment the hypoglycemic effects of metformin in correlation with modulating gut microbiota. J Agric Food Chem. 2018;66(23):5821–5831. doi: 10.1021/acs.jafc.8b00829 [DOI] [PubMed] [Google Scholar]
- 45.Ley RE, Turnbaugh PJ, Klein S, Gordon JI. Microbial ecology: human gut microbes associated with obesity. Nature. 2006;444(7122):1022–1023. doi: 10.1038/4441022a [DOI] [PubMed] [Google Scholar]
- 46.Vrieze A, Holleman F, Zoetendal EG, Vos WMD, Hoekstra JBL, Nieuwdorp M. The environment within: how gut microbiota may influence metabolism and body composition. Diabetologia. 2010;53(4):606–613. doi: 10.1007/s00125-010-1662-7 [DOI] [PMC free article] [PubMed] [Google Scholar]
- 47.Venema K. Role of gut microbiota in the control of energy and carbohydrate metabolism. Curr Opin Clin Nutr Metab Care. 2010;13(4):432–438. doi: 10.1097/MCO.0b013e32833a8b60 [DOI] [PubMed] [Google Scholar]
- 48.Louis P, Young P, Holtrop G, Flint H. Diversity of human colonic butyrate-producing bacteria revealed by analysis of the butyryl-CoA: acetateCoA-transferase gene. Environ Microbiol. 2010;12(2):304–314. doi: 10.1111/j.1462-2920.2009.02066.x [DOI] [PubMed] [Google Scholar]
- 49.Everard A, Belzer C, Geurts L, et al. Cross-talk between Akkermansia muciniphila and intestinal epithelium controls diet-induced obesity. Proc Natl Acad Sci U S A. 2013;110(22):9066–9071. doi: 10.1073/pnas.1219451110 [DOI] [PMC free article] [PubMed] [Google Scholar]
- 50.Hänninen A, Toivonen R, Pöysti S, et al. Akkermansia muciniphila induces gut microbiota remodelling and controls islet autoimmunity in NOD mice. Gut. 2018;67(8):1445–1453. doi: 10.1136/gutjnl-2017-314508 [DOI] [PubMed] [Google Scholar]
- 51.Ma Q, Li Y, Li P, et al. Research progress in the relationship between type 2 diabetes mellitus and intestinal flora. Biomed Pharmacother. 2019;117:109138. doi: 10.1016/j.biopha.2019.109138 [DOI] [PubMed] [Google Scholar]
- 52.Santos-Marcos JA, Perez-Jimenez F, Camargo A. The role of diet and intestinal microbiota in the development of metabolic syndrome. J Nutr Biochem. 2019;70:1–27. doi: 10.1016/j.jnutbio.2019.03.017 [DOI] [PubMed] [Google Scholar]
- 53.Duca FA, Swartz TD, Sakar Y, Covasa M. Increased oral detection, but decreased intestinal signaling for fats in mice lacking gut microbiota. PLoS One. 2012;7(6):e39748. doi: 10.1371/journal.pone.0039748 [DOI] [PMC free article] [PubMed] [Google Scholar]
- 54.Liu G, Liang L, Yu G, Li Q. Pumpkin polysaccharide modifies the gut microbiota during alleviation of type 2 diabetes in rats. Int J Biol Macromol. 2018;115:711–717. doi: 10.1016/j.ijbiomac.2018.04.127 [DOI] [PubMed] [Google Scholar]
- 55.El-Salhy M, Hatlebakk JG, Hausken T. Diet in irritable bowel syndrome (IBS): interaction with gut microbiota and gut hormones. Nutrients. 2019;11(8). doi: 10.3390/nu11081824 [DOI] [PMC free article] [PubMed] [Google Scholar]
- 56.Remely M, Tesar I, Hippe B, Gnauer S, Rust P, Haslberger A. Gut microbiota composition correlates with changes in body fat content due to weight loss. Benef Microbes. 2015;1. [DOI] [PubMed] [Google Scholar]
- 57.Cani PD, Neyrinck AM, Fava F, et al. Selective increases of bifidobacteria in gut microflora improve high-fat-diet-induced diabetes in mice through a mechanism associated with endotoxaemia. Diabetologia. 2007;50(11):2374–2383. doi: 10.1007/s00125-007-0791-0 [DOI] [PubMed] [Google Scholar]
- 58.Devi Bala S, Saravanan R. Bacoside-A diminishes liver functional enzymes and improves carbohydrate metabolic key enzymes in streptozotocin a rat model of T2DM. Biocatal Agric Biotechnol. 2019;21:101331. doi: 10.1016/j.bcab.2019.101331 [DOI] [Google Scholar]
- 59.Chou C, Membrez M, Blancher F. Gut decontamination with norfloxacin and ampicillin enhances insulin sensitivity in mice. Nestle Nutr Workshop Ser Pediatr Program. 2008;62(4):127–137. doi: 10.1159/000146256 [DOI] [PubMed] [Google Scholar]
- 60.Canfora EE, Meex RCR, Venema K, Blaak EE. Gut microbial metabolites in obesity, NAFLD and T2DM. Nat Rev Endocrinol. 2019;15(5):261–273. doi: 10.1038/s41574-019-0156-z [DOI] [PubMed] [Google Scholar]
- 61.Tripathi A, Debelius J, Brenner DA, et al. The gut-liver axis and the intersection with the microbiome. Nat Rev Gastroenterol Hepatol. 2018;15(7):397–411. [DOI] [PMC free article] [PubMed] [Google Scholar]
- 62.Björkholm B, Bok CM, Lundin A, Rafter J, Hibberd ML, Pettersson S. Intestinal microbiota regulate xenobiotic metabolism in the liver. PLoS One. 2009;4(9):e6958. doi: 10.1371/journal.pone.0006958 [DOI] [PMC free article] [PubMed] [Google Scholar]
- 63.Liu W, Zheng Y, Zhang Z, Yao W, Gao X. Hypoglycemic, hypolipidemic and antioxidant effects of Sarcandra glabra polysaccharide in type 2 diabetic mice. Food Funct. 2014;5(11):2850–2860. doi: 10.1039/C4FO00430B [DOI] [PubMed] [Google Scholar]
- 64.Zhu J, Liu W, Yu J, et al. Characterization and hypoglycemic effect of a polysaccharide extracted from the fruit of Lycium barbarum L. Carbohydr Polym. 2013;98(1):8–16. doi: 10.1016/j.carbpol.2013.04.057 [DOI] [PubMed] [Google Scholar]
- 65.Long X-S, Liao S-T, Wen P, et al. Superior hypoglycemic activity of mulberry lacking monosaccharides is accompanied by better activation of the PI3K/Akt and AMPK signaling pathways. Food Funct. 2020;11(5):4249–4258. doi: 10.1039/D0FO00427H [DOI] [PubMed] [Google Scholar]
- 66.He J-H, Chen L-X, Li H. Progress in the discovery of naturally occurring anti-diabetic drugs and in the identification of their molecular targets. Fitoterapia. 2019;134:270–289. [DOI] [PubMed] [Google Scholar]
- 67.Watanabe J, Kawabata J, Kurihara H, Niki R. Isolation and identification of alpha-glucosidase inhibitors from tochu-cha (Eucommia ulmoides). Biosci Biotechnol Biochem. 1997;61(1):177–178. doi: 10.1271/bbb.61.177 [DOI] [PubMed] [Google Scholar]
- 68.Wang K, Bao L, Zhou N, et al. Structural modification of natural product ganomycin I leading to discovery of a a-glucosidase and HMG-CoA reductase dual inhibitor improving obesity and metabolic dysfunction in vivo. J Med Chem. 2018;61(8):3609–3625. doi: 10.1021/acs.jmedchem.8b00107 [DOI] [PubMed] [Google Scholar]
- 69.Luo C, Yang H, Tang C, et al. Kaempferol alleviates insulin resistance via hepatic IKK/NF-κB signal in type 2 diabetic rats. Int Immunopharmacol. 2015;28(1):744–750. doi: 10.1016/j.intimp.2015.07.018 [DOI] [PubMed] [Google Scholar]
- 70.Han LP, Li CJ, Sun B, Xie Y, Chen LM. Protective effects of celastrol on diabetic liver injury via TLR4/MyD88/NF-κB signaling pathway in type 2 diabetic rats. J Diabetes Res. 2016;2016:1–10. doi: 10.1155/2016/2641248 [DOI] [PMC free article] [PubMed] [Google Scholar]
- 71.Snel M, van Diepen JA, Stijnen T, et al. Immediate and long-term effects of addition of exercise to a 16-week very low calorie diet on low-grade inflammation in obese, insulin-dependent type 2 diabetic patients. Food Chem Toxicol. 2011;49(12):3104–3111. doi: 10.1016/j.fct.2011.09.032 [DOI] [PubMed] [Google Scholar]
- 72.Arner P. The adipocyte in insulin resistance: key molecules and the impact of the thiazolidinediones. Trends Endocrinol Metab. 2003;14(3):137–145. doi: 10.1016/S1043-2760(03)00024-9 [DOI] [PubMed] [Google Scholar]
- 73.Wu L, Sun J, Liu L, et al. Anti-toll-like receptor 2 antibody ameliorates hepatic injury, inflammation, fibrosis and steatosis in obesity-related metabolic disorder rats via regulating MAPK and NF-κB pathways. Int Immunopharmacol. 2020;82:106368. doi: 10.1016/j.intimp.2020.106368 [DOI] [PubMed] [Google Scholar]
- 74.Everard A, Lazarevic V, Derrien M, et al. Responses of gut microbiota and glucose and lipid metabolism to prebiotics in genetic obese and diet-induced leptin-resistant mice. Diabetes. 2011;60(11):2775–2786. doi: 10.2337/db11-0227 [DOI] [PMC free article] [PubMed] [Google Scholar]
- 75.He M, Shi B. Gut microbiota as a potential target of metabolic syndrome: the role of probiotics and prebiotics. Cell Biosci. 2017;7(1):54. doi: 10.1186/s13578-017-0183-1 [DOI] [PMC free article] [PubMed] [Google Scholar]
- 76.Wang J, Tang H, Zhang C, et al. Modulation of gut microbiota during probiotic-mediated attenuation of metabolic syndrome in high fat diet-fed mice. Isme J. 2015;9(1):1–15. doi: 10.1038/ismej.2014.99 [DOI] [PMC free article] [PubMed] [Google Scholar]
- 77.Burcelin R, Dolci W, Thorens B. Glucose sensing by the hepatoportal sensor is GLUT2-dependent: in vivo analysis in GLUT2-null mice. Diabetes. 2000;49(10):1643–1648. doi: 10.2337/diabetes.49.10.1643 [DOI] [PubMed] [Google Scholar]
- 78.Thorens B. GLUT2, glucose sensing and glucose homeostasis. Diabetologia. 2015;58(2):221–232. doi: 10.1007/s00125-014-3451-1 [DOI] [PubMed] [Google Scholar]
- 79.Schmitt CC, Aranias T, Viel T, et al. Intestinal invalidation of the glucose transporter GLUT2 delays tissue distribution of glucose and reveals an unexpected role in gut homeostasis. Mol Metab. 2016;6(1):61–72. doi: 10.1016/j.molmet.2016.10.008 [DOI] [PMC free article] [PubMed] [Google Scholar]


