

Abstract
A large body of molecular and neurophysiological evidence connects synaptic plasticity to specific functions and energy metabolism in particular areas of the brain. Furthermore, altered plasticity and energy regulation has been associated with a number of neuropsychiatric disorders. A favourable approach enabling the modulation of neuronal excitability and energy in humans is to stimulate the brain using transcranial direct current stimulation (tDCS) and then to observe the effect on neurometabolites using magnetic resonance spectroscopy (MRS). In this way, a well‐defined modulation of brain energy and excitability can be achieved using a dedicated tDCS protocol to a predetermined brain region. This systematic review was guided by the preferred reporting items for systematic reviews and meta‐analysis and summarises recent literature studying the effect of tDCS on neurometabolites in the human brain as measured by proton or phosphorus MRS. Limitations and recommendations are discussed for future research. The findings of this review provide clear evidence for the potential of using tDCS and MRS to examine and understand the effect of neurometabolites in the in vivo human brain.
Keywords: brain, MRS, neurometabolites, neuroscience, transcranial direct current stimulation
This review aims to provide useful guidance for potential investigators. Based on the studies identified, we explore previous efforts to unravel the transcranial direct current stimulation (tDCS) action mechanisms on the central nervous system. The findings are highlighted, along with the limitations and proposed recommendations for future research.

1. INTRODUCTION
Our brain is who we are, and our life experiences are what underpin the structural, functional, molecular and even genetic modulation of our central nervous system (CNS). The popular term for this effect is brain plasticity. Studies have shown that alterations in plasticity and energy regulation are associated with a number of neuropsychiatric disorders. In the past centuries starting with Cajal's cerebral gymnastics hypothesis (Monte Ferreira, Nogueira, & de Felipe, 2014) and Hebbian theory (Hebb, 1949), numerous scientists have investigated this fascinating property of the brain in order to open new horizons for a better understanding of its physiology and adaptation mechanisms, and, most importantly, for the development of novel treatment tactics for neuropsychiatric disorders. Technological advances have enabled neuroplasticity to be studied on multiple levels and to be artificially induced in a mostly controlled manner. One of the methods used to deliberately modulate the brain's activity is through transcranial direct current stimulation (tDCS), and this has been a key topic of extended research in recent years (see review Nitsche et al., 2008).
tDCS is a non‐invasive technique for brain stimulation that manipulates the level of cortical excitability to investigate the biochemical and physiological functions of the brain. The technique is also utilised for therapeutic purposes and is an alternative treatment strategy for depression, schizophrenia, epilepsy, stroke‐induced aphasia or Parkinson's motor symptoms (Benninger & Hallett, 2015; Brunelin et al., 2012; Brunoni et al., 2016; Regner et al., 2018; Stagg & Johansen‐Berg, 2013). In these cases, the use of tDCS has shown huge potential due to its advantage of having almost no side effects, unlike the default pharmacological interventions. Moreover, tDCS can also be used in the ethically challenging field of human biological enhancement, where it has been reported to be able to modulate motor learning, memory and even creativity (Mancuso, Ilieva, Hamilton, & Farah, 2016; Mayseless & Shamay‐Tsoory, 2015; Nitsche et al., 2003). Note that the tDCS devices found in this review were used for investigational purposes only and the majority were CE‐certified.
However, prior to discussing applications of tDCS, the modus operandi and the resultant biochemical and physiological alterations in the brain need to be taken into consideration. Given that, by constantly generating electrical impulses for informational exchange between neurons, the human brain coordinates the entire CNS and the whole body, including its behaviour, there can be no wonder that an externally applied electrical current will interfere with the internal circuitry of the brain. Consequently, it is of great importance to understand the way of the interference, the response mechanisms and the controlled variables. Previous scientists concerned with this topic have built a solid foundation based on investigating the effects of the direct current (DC) on cell cultures, animals and humans to understand the underlying mechanisms of the brain (Creutzfeldt, Fromm, & Kapp, 1962; Priori, Berardelli, Rona, Accornero, & Manfredi, 1998; Purpura & McMurtry, 1965; Terzuolo & Bullock, 1956). More recently, interest in tDCS has been revived by the work of Nitsche and Paulus, which shows its capability of lasting motor cortex excitability via non‐invasive DC modulation. In this way, the research has demonstrated the importance of the polarity, intensity and the duration of tDCS (Nitsche & Paulus, 2000).
In order for the brain to be stimulated using tDCS, a weak DC (~1 or 2 mA) is typically applied on the scalp between two electrodes. Based on the location of the electrodes, different areas of the brain can be influenced. To date, several studies have been carried out to investigate the effect of tDCS on changes in metabolites in the brain which could be determined by various factors: (a) the size, polarity and position of these electrodes; (b) the employed current intensity, repetition and duration of stimulation and (c) tissue properties in the stimulated area. Furthermore, a tailor‐designed tDCS montage can modulate neurometabolites to a status of excitation (by anodal) or inhibition (by cathodal) and its effect can be investigated (Foerster et al., 2015; Krause, Márquez‐Ruiz, & Cohen Kadosh, 2013). In this review, the anodal (or anodal tDCS) refers to the current flow from the anodal to the reference, and the cathodal means the opposite flow of the current, that is, from the reference to the cathodal. The most common montage is the motor cortex (M1)—contralateral supraorbital ridge montage, although various other montages have also been introduced (da Silva, Volz, Bikson, & Fregni, 2011). One of the newest montages is called high‐definition (HD)—using one electrode surrounded by several electrodes with the opposite polarity in a ring manner and the major advantage is to provide a more localised effect to the target region, compared to conventional montages (Bikson et al., 2019). Apart from the technical parameters of the method itself, the effect of tDCS is also dependent on the brain state and neuronal morphology (Bikson & Rahman, 2013; Giordano et al., 2017).
tDCS exerts acute or primary effects on the brain during the stimulation followed by a secondary or after‐effect, which lasts even when the stimulation ceases (Bikson et al., 2019). The physics of electrical stimulation, pre‐exciting synaptic activity level and neuronal membrane properties are important elements to explain the response of the brain to tDCS in the acute phase (Bikson et al., 2004). Excitatory and inhibitory neurotransmitters, as well as neuromodulators are reported to play a crucial role during the after‐effect period (Stagg & Nitsche, 2011). Although the current understanding of tDCS involves the shift in resting membrane potentials, according to a recent review, tDCS mechanisms have been challenged (Polania, Nitsche, & Ruff, 2018). Stimulating the anodal electrode causes membrane depolarisation, resulting in the resting membrane potential being shifted towards positive values. Conversely, stimulating the cathodal electrode hyperpolarises the membrane (Rahman et al., 2013). This does not involve synaptic mechanisms but rather depends on voltage‐gated ion channels being influenced by the electric field produced between the anodal and cathodal electrodes, which according to the computational simulations, peaks somewhere between these electrodes. However, in vivo studies indicate that the effect of tDCS is still at maximum below the stimulating electrode (Polania et al., 2018). It should be noted that tDCS itself does not trigger an action potential but modulates a readiness for it (Paulus, 2011). No matter which polarity of tDCS is used, some parts of the neuronal membranes are depolarised, and the others are hyperpolarised based on the cell morphology and their orientation towards the stimulating electrode (Radman, Ramos, Brumberg, & Bikson, 2009). However, there is a distinct difference in the mechanisms elaborated in the aftereffects and especially underneath the anodal and cathodal electrodes (Polania et al., 2018). The after‐effects of tDCS on the synaptic efficacy can last for an hour and even up to 46 days with carefully designed modulation time, intensity, repetition and in combination with a task or a test (Nitsche & Paulus, 2001; O'Shea et al., 2017). This is similar to exerting a long‐term potentiation (LTP) and long‐term depression (LTD) like activity (Stagg & Nitsche, 2011). As in LTP and LTD, intracellular calcium levels, brain‐derived neurotrophic factor and most importantly, major excitatory and inhibitory neurotransmitters—glutamate (Glu) and γ‐aminobutyric acid (GABA) have been reported to be involved in tDCS secondary effects (Fritsch et al., 2010; Stagg et al., 2009). For instance, few studies have shown that GABA is involved in the anodal tDCS after‐effects, while both GABA and Glu concentrations have been modulated following cathodal stimulation (also, shown in the review by Polania et al., 2018). Unravelling the temporal path of these neurotransmitters' concentration modulation and understanding their dependency on the tDCS parameters is of uttermost interest as it is this information which can be used for therapeutic purposes. The use of magnetic resonance spectroscopy (MRS) is extremely well suited to examining the effect of tDCS on neurotransmitter levels non‐invasively and, thus, the use of tDCS together with MRS has gradually increased.
Proton MRS is a well‐established technique used to sensitively quantify the concentrations of various metabolites at the cellular level in the brain in vivo, for example, GABA, glutamine (Gln), Glu, N‐acetyl aspartate (NAA), choline‐containing compounds (Cho), creatine (Cr) and myo‐inositol (mI) (Henning, 2018). Analysing changes in metabolite concentrations and their ratios enables information complementary to that acquired using anatomical MR imaging (MRI) to be obtained. In addition to the proton, phosphorus‐31 (31P) is also an important nucleus in the human brain and plays a crucial role in tissue energy metabolism and membrane synthesis (Du et al., 2008; Lei, Zhu, Zhang, Ugurbil, & Chen, 2003; Ren, Sherry, & Malloy, 2015). Exploring 31P using non‐invasive MRS provides unique insight into the dynamic aspects of metabolites. In a 31P spectrum acquired by 31P‐MRS, various spectral peaks of key metabolites are displayed with a relatively large chemical shift range (~30 ppm), which correspond to ɑ‐, β‐, ɣ‐adenosine triphosphate (ATP), phosphocreatine (PCr), phosphodiester (PDE), inorganic phosphate (Pi) and phosphomonoester (PME).
GABA and Glu are the main inhibitory and excitatory neurotransmitters in the brain, respectively. They play a vital role in the neurotransmitter cycle and are closely involved with physiological processes and neurological and neurodegenerative disorders (Li et al., 2016; Nava‐Mesa, Jiménez‐Díaz, Yajeya, & Navarro‐Lopez, 2014; Sheldon & Robinson, 2007). NAA represents a useful indicator for neuronal and axonal integrity and membrane turnover and reflects neuronal connections. Thus, accessing NAA provides information relating to neuronal functional loss in the brain (Salem et al., 2008). Another important role of NAA is osmoregulatory, and it is used in the removal of intracellular water, against a water gradient, from myelinated neurons (Baslow, 2003). The main roles of Cho and Cr are related to the cell membrane integrity and the oxidative metabolism, respectively (Salem et al., 2008). Cr is also frequently used as a reference to normalise the resonance intensities of other metabolites. mI is a basic compound in the brain and is involved in biochemical signalling pathways on membranes and in the synthesis of inositol containing phospholipids (Cleeland, Pipingas, Scholey, & White, 2019). The content of mI is, therefore, an important osmolyte and astrocyte marker and can be used to differentiate physiological and pathological conditions (Rango et al., 2008). As a comprehensive energy regulator in the human brain, high‐energy phosphates, such as ATP and PCr, play a fundamental role in maintaining the cerebral energy status by modulating energy needs for different cellular functions and physiological activities, for example, the sodium/potassium pump and brain energy homeostasis (Du et al., 2008).
As mentioned above, the neuroplastic effects of tDCS in the brain can be significantly influenced by the use of the different tDCS parameters (polarity, duration, current intensity, location, etc.) and can be dependent on different montages. In a similar fashion, MRS requires the precise voxel selection since the concentrations of most metabolites alter significantly in different areas of the brain (Harris et al., 2019). Moreover, it is challenging to obtain high‐quality spectra due to the low signal intensity of certain metabolites as well as J‐coupling. Some metabolite peaks, for example, Gln and Glu at 3 T, are mixed in a similar frequency range due to their small chemical shift. In order to overcome these difficulties, customised sequences have been developed, such as MEscherGArwood Point RESolved Spectroscopy (MEGA‐PRESS) (Mescher, Merkle, Kirsch, Garwood, & Gruetter, 1998; Mullins et al., 2014) and semi‐Localised by Adiabatic SElective Refocusing (semi‐LASER) (Andreychenko, Boer, de Castro, Luijten, & Klomp, 2012; Scheenen, Klomp, Wijnen, & Heerschap, 2008), which can be used to focus on a particular metabolite. Therefore, the choice of the MR sequence mainly depends on the metabolites to be investigated. Moreover, well‐established metabolite fitting algorithms, for example, LCModel (Provencher, 1993, 2001) and jMRUI (Naressi et al., 2001; Vanhamme, van den Boogaart, & van Huffel, 1997) are required for precisely quantifying metabolite concentrations. Consequently, comparison with other similar studies, especially at different sites, is more difficult (Mikkelsen et al., 2017, 2019).
In this review, we aim to systematically summarise and compare existing studies in the literature regarding the tDCS effect on the concentration of neurometabolites in the healthy human brain measured by MRS. Furthermore, we report any research using MRS to investigate the influence of tDCS on the neurochemicals in pathologies. This review aims to provide useful guidance for potential investigators. Based on the studies identified, we explore previous efforts to unravel the tDCS action mechanisms of tDCS on the CNS. The findings are highlighted, along with the limitations and proposed recommendations for future research.
2. MATERIALS AND METHODS
2.1. Protocol registration
This systematic review was carried out in accordance with the preferred reporting items for systematic reviews and meta‐analyses (PRISMA) guidance (Moher et al., 2015). For the initial step, the full search protocol, used to acquire evidence sets of items, was registered to the International Prospective Register of Systematic Reviews website with the number: CRD42020168217 (https://www.crd.york.ac.uk/prospero/display_record.php?ID=CRD42020168217).
2.2. Literature search
Electronic databases—PubMed and Web of Science—were searched for the cohort, observational, cross‐sectional or longitudinal and randomised‐control studies investigating the tDCS effect on the human brain with MRS. The research papers considered in this systematic review include all the years up until March 1, 2020. Initial keyword searches included “tDCS OR transcranial direct current stimulation OR transcranial DC stimulation” AND “MRS OR MR spectroscopy OR Magnetic resonance spectroscopy” AND “Brain.” A hand search was additionally conducted in order to screen the references to identify further potentially eligible studies in the pre‐selected articles. Two reviewers independently searched and assessed the studies for the inclusion and exclusion criteria based on the title, keywords, abstract or full‐text screening. In the case of disagreement, the whole article was read again, and the disagreement was resolved by discussions between two reviewers and, if necessary, with a third independent reviewer.
2.3. Inclusion and exclusion criteria
Studies investigating the effects of tDCS on the neurochemical concentrations in the human brain detected via MRS measurements both in the healthy and disease states were selected in this systematic review. The following inclusion criteria were applied: (a) peer‐reviewed and original research publications, (b) published in English, (c) human—as a study population and (d) studies directly investigating the tDCS effects on the neurometabolites via MRS measurements. Exclusion criteria followed: (a) review papers, (b) conference proceedings or letters to the editors and (c) studies without a clear connection between MRS and tDCS measurements. For instance, in spite of being a single study, if tDCS and MRS were conducted on two different groups the study would be excluded.
2.4. Data extraction
A single data extraction and verification approach was utilised in order to extract the relevant information from each selected paper using the PRISMA protocol. The following considerations have been employed for the data extraction:
Study design and cohort characteristics (Table 1): this includes total sample size, subgroup sample size including drop‐out, gender ratio, age (mean/SD and [range]) handedness (right or left).
tDCS protocols (Table 2): this contains information relating to the montage type (anodal, cathodal, bi‐hemispheric, sham), current, duration, repetition of stimulation, electrode dimensions, measurement location (inside or outside MRI scanner) and tDCS device manufacturer.
MR‐related information (Table 3): conducted MRI scanner (vendor, field strength, RF coil), MRS sequence, MRS parameters (repetition time [TR], echo time [TE]), voxel size, fitting software to analyse MRS data.
Studied metabolites, voxel‐of‐interest (VOI) regions and study scheme (Table 4): quantified metabolites, electrode location (anodal and cathodal), the method used to define the areas for stimulation, MRS regions and experimental scheme of tDCS and MRS.
Studies reporting tDCS induced neurometabolite modulation in healthy cohorts (Tables 5 and 6): study aim, statistical analysis including multiple comparison correction and results detected by MRS.
Studies reporting tDCS induced neurometabolite changes in pathologies (Table 7): pathology, study aim and results.
TABLE 1.
Study design and cohort characteristics
| Study | Study design | Total N | Subgroup N | Gender ratio | Age a | Handedness |
|---|---|---|---|---|---|---|
| Antonenko et al. (2019) | Randomised, counter‐balanced, single blinded, sham‐controlled, crossover | 24 | 24 anodal, 24 cathodal, 24 sham | 12M/12F | 24.6 ± 3.6 | Right‐handed |
| Antonenko et al. (2017) | Randomised, counter‐balanced, double‐blinded, sham‐controlled, crossover b | 48 | 47 anodal, 47 cathodal, 47 sham, 1 dropout | 24M/24F | 63 ± 8 [50–79] | Right‐handed |
| Auvichayapat, Keeratitanont, Janyacharoen, and Auvichayapat (2018) | Observational | 10 | 10 anodal | 10M | 32.7 ± 6.88 | Right‐handed |
| Auvichayapat et al. (2017) | Observational, double‐blinded | 10 | 10 anodal | 10 M | [8–12] | Not relevant |
| Bachtiar et al. (2018) | Counter‐balanced, single‐blinded, sham‐controlled, crossover | 12 | 12 anodal, 12 cathodal, 12 sham, 10 bi‐hemispheric (2 drop‐out) | 2M/10F | 25 [20–32] | Right‐handed |
| Bachtiar, Near, Johansen‐Berg, and Stagg (2015) | Counter‐balanced, single‐blinded, sham‐controlled, crossover | 12 | 12 anodal, 12 sham | 4M/8F | 24 [22–28] | Right‐handed |
| Barron et al. (2016) | Observational c | 53 | 21 anodal | 14M/11F | 22.7 | Not reported |
| Binkofski et al. (2011) | Randomised, single‐blinded, sham‐controlled, crossover | 15 | 15 anodal, 15 sham | 15M | 24.6 ± 0.69 | Right‐handed |
| Carlson, Ciechanski, Harris, MacMaster, and Kirton (2018) | Randomised, double‐blinded, sham‐controlled | 15 | 7 cathodal, 8 sham (all with unilateral perinatal stroke) | 11M/4F | 12.1 ± 3 [6–19] | Right‐handed |
| Clark, Coffman, Trumbo, and Gasparovic (2011) | Observational | 10 | 7 anodal (3 drop‐out) | 3M/4F | 25 ± 3.6 | Right‐handed |
| Dickler et al. (2018) | Randomised, double‐blinded, sham‐controlled, crossover | 18 | 16 bi‐hemispheric, 16 sham, 2 drop‐out (all with gambling disorder) | 9M/7F |
37.8 ± 16.6 [21–65] |
11 right‐handed, 5 left‐handed |
| Dwyer et al. (2019) | Randomised, double‐blinded, sham‐controlled, crossover | 20 | 19 anodal, 19 sham, 1 drop‐out | 10M/10F | 25 [19–32] | Right‐handed |
| Harris et al. (2019) | Randomised double‐blinded, sham‐controlled | 22 | 7 anodal, 10 sham, 5 drop‐out (all with primary progressive aphasia) | 5M/6F anodal, 6M/5F sham | 66.9 ± 7.5 | Right‐handed |
| Hone‐Blanchet, Edden, and Fecteau (2016) | Randomised, triple‐blinded, sham‐controlled, crossover | 17 | 15 bi‐hemispheric, 2 drop‐out | 8M/7F | 27 [21–41] | Right‐handed |
| Jalali, Chowdhury, Wilson, Miall, and Galea (2018) | Observational c | 17 | 17 anodal | 8M/8F | 22 ± 2 | Right‐handed |
| Jauch‐Chara et al. (2015) | Randomised, single‐blinded, sham‐controlled, crossover | 30 | 15 anodal (normal), 15 sham (normal), 15 anodal (obese), 15 sham (obese) | 15M normal, 15M obese | 24.6 ± 0.69 normal, 24.7 ± 0.66 obese | Right‐handed |
| Kim, Stephenson, Morris, and Jackson (2014) | Randomised, single‐blinded, sham‐controlled | 35 | 34 (random N of anodal, cathodal, and sham), 1 drop‐out | 20M/15F | 21.1 ± 2.8 [18–29] | Right‐handed |
| Kistenmacher et al. (2017) | Randomised, counter‐balanced, single‐blinded, sham‐controlled, crossover | 14 | 14 anodal, 14 sham | 14M | 24.8 ± 0.58 | Not controlled |
| Knechtel et al. (2014) | Randomised, counter‐balanced, single‐blinded, sham‐controlled, crossover | 16 | 12 anodal, 12 sham, 2 drop‐out | 8M/4F | 28.6 ± 6.5 | 9 right‐handed, 2 left‐handed, 1 ambidextrous |
| Koolschijn et al. (2019) | Observational c | 91 | 26 anodal, 4 drop‐out | 13M/17F | 24 | Not reported |
| Nwaroh et al. (2020) | Randomised, double‐blinded, sham‐controlled | 24 | 8 anodal, 8 HD‐tDCS, 8 sham | 11M/13F | 15.5 ± 1.7 [12–18] | Right‐handed |
| O'Shea et al. (2017) | Observational c , sham‐controlled | 69 | 10 (healthy with tDCS and MRS), 3 (patients with neglect) | 27M/39F healthy | 26.6 ± 7.5 healthy 58 patients | Right‐handed |
| Patel et al. (2019) | Randomised, single‐blinded, sham‐controlled | 32 | 16 anodal, 16 sham | 8M/8F anodal 8M/8F sham | 26 ± 4 [22–30] | Right‐handed |
| Rae, Lee, Ordidge, Alonzo, and Loo (2013) | Double‐blinded, sham‐controlled, crossover | 13 | 13 bi‐hemispheric, 13 sham | 5M/8F13 | [19–28] | Not relevant |
| Rango et al. (2008) | Randomised, double‐blinded, sham‐controlled, crossover | 10 | 5 anodal, 5 sham | 6M/4F | [22–39] |
Nine right‐handed, one left‐handed |
| Ryan et al. (2018) | Randomised, single‐blinded, sham‐controlled, crossover | 15 | 15 bi‐hemispheric, 15 sham | 6M/9F | 28 ± 10.9 [21–60] | Not reported |
| Siniatchkin et al. (2012) | Double‐blinded | 20 | 10 anodal (migraine with visual aura), 10 anodal (healthy control) | 4M/6F migraine 4M/6F controls | 19.3 ± 3.4 migraine 20.3 ± 3.2 controls | Right‐handed |
| Stagg et al. (2011) | Observational | 12 | 12 anodal | 6M/6F | 23 [21–31] | Right‐handed |
| Stagg et al. (2009) | Pseudo‐randomised, sham‐controlled, crossover, single‐blinded | 25 | Exp1: 11 anodal and cathodal, Exp. 2:7 cathodal, Exp. 3:7 anodal | Exp. 1:1M/10F Exp. 2:3M/4F Exp. 3:4M/3F | Exp. 1:27 [23–32] Exp. 2:26 [21–33] Exp. 3:23 [20–49] | Right‐handed |
| Tremblay et al. (2016) | Randomised, single‐blinded, sham‐controlled, crossover | 8 | 8 bi‐hemispheric, 8 sham | 4M/4F | 29 ± 6 [24–40] | Right‐handed |
| Tremblay et al. (2014) | Observational d | 1 | 1 bi‐hemispheric | Not relevant | Not relevant | Right‐handed |
| Wardzinski et al. (2019) | Randomised, single‐blinded, sham‐controlled, crossover | 15 | 15 anodal, 15 sham | 15M | 25.3 ± 0.76 | Not relevant |
| Wilke et al. (2017) | Randomised, single‐blinded, sham‐controlled, crossover | 39 | 17 (mTBI with tDCS and MRS), 22 (healthy controls only baseline MRS) | 15M/2F mTBI, 20M/2F controls | 24.2 ± 2.8 mTBI 26.1 ± 5.4 controls | Two left‐handed each in patients and controls |
| Zappasodi et al. (2018) | Observational | 32 | 11 (with tDCS and MRS), 21 (only tDCS) | 19M/13F | 24.1 ± 4.2 | Right‐handed |
Note: The information in italic text was not reported in the papers, but retrieved from the authors of the papers during the data extraction.
Abbreviations: F, female; HD‐tDCS, high definition transcranial direct current stimulation; M, male; MRS, magnetic resonance spectroscopy; mTBI, mild traumatic brain injury; tDCS, transcranial direct current stimulation.
Age is shown in years: mean ± SD and range in [] if reported.
Studies additionally carried out blinded MRS data analysis.
Studies regarding the main research questions are randomised or pseudo‐randomised, but not regarding the tDCS–MRS measurements.
tDCS–MRS protocol with one example.
TABLE 2.
tDCS protocols
| Study | tDCS (anodal, cathodal, bi‐hemispheric, sham) | tDCS (current, mA) | tDCS (duration a , min) | tDCS (repetition) | tDCS (electrode size, cm2) | tDCS measurement (inside scanner or outside) |
|---|---|---|---|---|---|---|
| Antonenko et al. (2019) | Anodal, cathodal, sham | 1 | Anodal: 15 (10 s/10 s), sham 30 s and off | 1 | Active: 5 × 7, ref.: 10 × 10 | Inside |
| Antonenko et al. (2017) | Anodal, cathodal, sham | 1 | Anodal: 15 (10 s/10 s), sham 30 s and off | 1 | Active: 5 × 7, ref.: 10 × 10 | Inside |
| Auvichayapat et al. (2018) | Anodal | 2 | 20 | 5 consecutive days | Active: 35, ref.: 35 | Outside |
| Auvichayapat et al. (2017) | Anodal | 1 | 20 | 5 consecutive days | Active: 35, ref.: 35 | Outside |
| Bachtiar et al. (2018) | Anodal, cathodal, bi‐hemispheric, sham | 1 | Anodal/cathodal: 10 (10 s/10 s), sham: 10 s and off | 1 | Active: 5 × 7 | Inside: During MR acquisition |
| Bachtiar et al. (2015) | Anodal, sham | 1 | Anodal: 20 (10 s/10), sham 10 s and off | 1 | Active: 5 × 7 | Inside: During MR acquisition |
| Barron et al. (2016) | Anodal | 1 | Anodal: 20 (10 s/10 s) | 1 | Active: 5 × 7 | Inside: During MR acquisition |
| Binkofski et al. (2011) | Anodal, sham | Anodal: 1, sham: 0 | Anodal and sham: 20 (8 s/8 s) | 1 | Active: 5 × 7 | Outside |
| Carlson et al. (2018) | Cathodal, sham | 1 | Cathodal: 20 (30 s/30 s), sham: 60 s and off | 10 consecutive days | 25 | Outside |
| Clark et al. (2011) | Anodal | 2 | 30 | 1 | 11 | Outside |
| Dickler et al. (2018) | Bi‐hemispheric, sham | 1 | Anodal: 30, sham 30 s and off | 1 | 35 | Inside: During MR acquisition |
| Dwyer et al. (2019) | Anodal, sham b | 2 | Anodal: 10 (24 s/24 s), sham: No current | 1 | 35 | Inside: During MR acquisition |
| Harris et al. (2019) | Anodal, sham | 2 | 20 (30 s/30 s), sham: 30 s and off | 2 | 5.08 × 5.08 | Outside |
| Hone‐Blanchet et al. (2016) | Bi‐hemispheric, sham | 1 | 30 (30 s/30 s), sham: 30 s and off | 1 | 35 | Inside: During MR acquisition |
| Jalali et al. (2018) | Anodal, sham d | 1.8 | 25 (10 s/10 s), sham 10 s ramp, 10 s on | 1 | 4 × 4 (rubber), 5 × 5 (pad) | Inside: During MR acquisition |
| Jauch‐Chara et al. (2015) | Anodal, sham | 1 | 20 (8 s/8 s), sham off | 1 | 5 × 7 | Outside |
| Kim et al. (2014) | Anodal, cathodal, sham | 1.5 | 15 (8 s/8 s), sham: 15 s and off | 1 | 5 × 7 | Outside |
| Kistenmacher et al. (2017) | Anodal, sham | 1 | 20 (8 s/8 s), sham: No current | 8 days within 2 weeks | 5 × 7 | Outside |
| Knechtel et al. (2014) | Anodal, sham | 2 | 20 (10 s/10 s), sham: 10 s and slowly off | 1 | 35 | Outside |
| Koolschijn et al. (2019) | Anodal, sham | 1 | 20 (10 s/10 s), sham (10 s/10 s, no current) | 1 | 5 × 7 | Inside: During MR acquisition |
| Nwaroh et al. (2020) | Anodal, sham | 1 | 20 (30 s/30 s), sham (30 s up and off) | Four consecutive days | 25 | Outside |
| O'Shea et al. (2017) | Anodal, sham d | 1 (2 mA for cerebellum) | 20 (10 s/10 s), sham (30 s and off) | 1 | 5 × 7, cerebellum: 5 × 5 | Inside |
| Patel et al. (2019) | Anodal, sham | 1 | 10 (10 s/10 s), sham (10 s and off) | 1 | 5 × 7 | Outside |
| Rae et al. (2013) | Bi‐hemispheric, sham | 1 | 10, sham (30 s and off) | 1 | 5 × 7 | Inside; during MR acquisition |
| Rango et al. (2008) | Anodal, sham | 1.5 | 15 (5 s/5 s), sham (15 s and off) | 1 | 35 | Outside |
| Ryan et al. (2018) | Bi‐hemispheric, sham | 2 | 20 (10 s/10 s), sham 10 s and off | 1 | 3 × 3 | Inside |
| Siniatchkin et al. (2012) | Anodal, cathodal | 1 | 10 | 1 | 35 | Inside |
| Stagg et al. (2011) | Anodal | 1 | 10 (10 s/10 s) | 1 | 5 × 7 | Inside |
| Stagg et al. (2009) | Anodal, cathodal, sham | 1 | 10 (10 s/10 s), sham 10 s and off | 1 | 5 × 7 | Inside |
| Tremblay et al. (2016) | Bi‐hemispheric, sham | 1 | 20 (15 s/15 s), sham 15 s and off | 1 | 35 cm2 | Inside |
| Tremblay et al. (2014) | Bi‐hemispheric, sham | 1 | 20 (15 s/15 s), sham 15 s and off | 1 | 5 × 7 | Inside |
| Wardzinski et al. (2019) | Anodal, sham | 1 | 20 (8 s/8 s), sham: No current | 2 c | 5 × 7 | Outside |
| Wilke et al. (2017) | Anodal, sham | 1 | 20 (10 s/10 s), sham: 30 s and off | 1 | Anodal: 5 × 7, ref: 10 × 10 | Inside |
| Zappasodi et al. (2018) | Cathodal | 2 | 20 (10 s/10 s) | 5 e | Cathodal: 7 × 10, anodal: 7 × 5 | Outside |
Note: The information in italic text was not reported in the papers, but retrieved from the authors of the papers during the data extraction.
Duration: stimulation or sham in minutes (fade‐in/fade‐out in seconds).
A sham measurement was carried out 1 hr after the anodal.
The second tDCS was performed 115 min after the first one.
There was no MRS measured in the sham groups.
The cathodal tDCS was delivered five times; first tDCS/2 hr break/second tDCS/4 hr break/third tDCS/5 hr break/fourth tDCS/14 hr break/fifth tDCS.
TABLE 3.
MR system, MRS parameters and MRS fitting software
| Study | MR system | MR spectroscopy parameters | Software to analyse MRS data | ||||
|---|---|---|---|---|---|---|---|
| MRI scanner | B0 (T) | RF coil (channels) | Sequence | TR/TE | MRS VOI (mm3) | ||
| Antonenko et al. (2019) | Siemens Verio | 3 | 32 | MEGA‐PRESS | 3 s/68 ms | 22 × 22 × 22 | LCModel |
| Antonenko et al. (2017) | Siemens Verio | 3 | 32 | MEGA‐PRESS | 3 s/68 ms | 22 × 22 × 22 | LCModel |
| Auvichayapat et al. (2018) | Philips Achieva | 3 | Not reported | PRESS | 2 s/35 ms | 20 × 20 × 20 | LCModel |
| Auvichayapat et al. (2017) | Philips Achieva | 3 | Not reported | PRESS | 2 s/35 ms | 20 × 20 × 20 | LCModel |
| Bachtiar et al. (2018) | Siemens Magnetom | 7 | 32 | sLASER, two voxels | 7 s/30 ms | 20 × 20 × 20 | LCModel |
| Bachtiar et al. (2015) | Siemens Verio | 3 | 32 | MEGA‐PRESS | 2 s/68 ms | 20 × 20 × 20 | jMRUI |
| Barron et al. (2016) | Siemens Magnetom | 7 | 32 | sLASER | 5–6 s/36 ms | 20 × 20 × 20 | LCModel |
| Binkofski et al. (2011) | Philips Achieva | 3 | Double‐tuned | 3D CSI a | 4.5 s/minimum | 60 × 50 × 30 | jMRUI |
| Carlson et al. (2018) | GE MR750w | 3 | 32 | PRESS | 2 s/30 ms | 20 × 20 × 10 | LCModel |
| Clark et al. (2011) | Siemens Trio | 3 | 12 | PRESS | 1.5 s/40 ms | 20 × 20 × 20 | LCModel |
| Dickler et al. (2018) | Philips Achieva | 3 | Not reported | MEGA‐PRESS | 2 s/68 ms | 30 × 30 × 30 | GANNET (GABA), Tarquin (Glx, NAA) |
| Dwyer et al. (2019) | GE MR750w | 3 | 8 | MEGA‐PRESS | 1.5 s/68 ms | 24 × 24 × 24 | LCModel |
| Harris et al. (2019) | Philips Achieva | 3 | 32 | MEGA‐PRESS, PRESS | 2 s/68 ms, 2 s/32 ms | 30 × 30 × 30 | GARNET, LCModel |
| Hone‐Blanchet et al. (2016) | Philips Achieva | 3 | 32 | MEGA‐PRESS | 2 s/68 ms | 30 × 30 × 30 | GANNET (GABA), Tarquin |
| Jalali et al. (2018) | Philips Achieva | 3 | 32 | MEGA‐PRESS | 2 s/68 ms | 20 × 20 × 20 | Tarquin |
| Jauch‐Chara et al. (2015) | Philips Achieva | 3 | Double‐tuned | 3D CSI a | 4.5 s/minimum | 60 × 50 × 30 | jMRUI |
| Kim et al. (2014) | Philips Achieva | 7 | 32 | STEAM | 2 s/16 ms/TM = 17 ms | 20 × 20 × 20 | LCModel |
| Kistenmacher et al. (2017) | Philips Achieva | 3 | Double‐tuned | 3D CSI a | 4.5 s/minimum | 60 × 50 × 30 | jMRUI |
| Knechtel et al. (2014) | Siemens Verio | 3 | 32 | PRESS | 2 s/30 ms | 25 × 25 × 25 | LCModel |
| Koolschijn et al. (2019) | Siemens Magnetom | 7 | 32 | sLASER | 5–6 s/36 ms | 20 × 20 × 20 | LCModel |
| Nwaroh et al. (2020) | GE | 3 | 32 | MEGA‐PRESS, PRESS | 1.8 s/68 ms, 1.8 s/35 ms | 30 × 30 × 30 | GANNET and LCModel |
| O'Shea et al. (2017) | Siemens Verio | 3 | 32 | Short TE localised | 4 s/8.5 ms | 20 × 20 × 20 | FID‐A, LCModel |
| Patel et al. (2019) | Siemens Prisma | 3 | 20 | MEGA‐PRESS | 2 s/68 ms | 30 × 30 × 30 | Turquin |
| Rae et al. (2013) | Philips Achieva | 3 | 10 cm 31P loop | FID | 2 s/minimum | Sensitive region | jMRUI |
| Rango et al. (2008) | Siemens Avanto | 1.5 | Birdcage coil | PRESS | 4 s/30 and 135 ms | 8 ml b | jMRUI |
| Ryan et al. (2018) | Siemens Magnetom | 7 | 32 | sLASER | 7.5 s/60 ms | 16 × 20 × 18 | In house fitMAN |
| Siniatchkin et al. (2012) | Philips Achieva | 3 | Standard coil | PRESS | 2 s/37 ms | 20 × 20 × 20 | Philips curve‐fitting software |
| Stagg et al. (2011) | Siemens/Varian | 3 | 4 | MEGA‐PRESS, PRESS | 3 s/68 ms | 20 × 30 × 20 | jMRUI |
| Stagg et al. (2009) | Exp. 1 and 3: Siemens/Varian Exp. 2: Philips | Exp. 1 and 3:3, Exp. 2:7 | 4 | Exp. 1: MEGA‐PRESS, Exp. 2: STEAM, Exp. 3: PRESS | 3 s/68 ms, 2 s/30 ms/TM = 24 ms, 3 s/26 ms | 20 × 20 × 20 | jMRUI |
| Tremblay et al. (2016) | Siemens Trio | 3 | 32 | MEGA‐PRESS | 3 s/68 ms | 30 × 30 × 30 | LCModel |
| Tremblay et al. (2014) | Siemens | 3 | 32 | MEGA‐PRESS | 3 s/68 ms | 30 × 30 × 30 | LCModel |
| Wardzinski et al. (2019) | Philips Achieva | 3 | Double‐tuned coil | 3D CSI a | 4.5 s/minimum | 60 × 50 × 30 | jMRUI |
| Wilke et al. (2017) | Siemens Verio | 3 | 32 | SPECIAL | 3 s/8.5 ms | 22 × 22 × 22 | LCModel |
| Zappasodi et al. (2018) | Philips Achieva | 3 | 8 | PRESS | Not reported/35 ms | 15 × 15 × 15 | jMRUI |
Note: The information in italic text was not reported in the papers, but retrieved from the authors of the papers during the data extraction.
Abbreviations: 3D CSI, three‐dimensional chemical shift imaging; Acq. Time, acquisition time; B0, main magnetic field strength; Exp., experiment; FID, free induction decay; MEGA‐PRESS, Meshcher–Garwood point resolved spectroscopy; NOE, nuclear overhauser effect; PRESS, point resolved spectroscopy; sLASER, semi‐localization by adiabatic selective refocusing; SPECIAL, spin echo full intensity acquired localised; STEAM, stimulated echo acquisition mode; TE, echo time; TM, mixing time; TR, repetition time; VOI, voxel‐of‐interest.
1H‐decoupled and NOE enhancement techniques have always been applied in line with the CSI sequence.
Centred on right M1.
TABLE 4.
Quantified metabolites, stimulated and MRS VOI regions and tDCS–MRS scheme
| Study | Quantified metabolites | Location (anodal electrode) | Location (cathodal electrode) | Method to define the areas for stimulation | Measured MRS region(s) | tDCS and MRS experimental scheme a |
|---|---|---|---|---|---|---|
| Antonenko et al. (2019) | GABA/total Cr, Glu/tCr | Left M1 | Right SR | 10–20 EEG system, verified by localizer | Left M1 | Pre/post tDCS |
| Antonenko et al. (2017) | GABA/total Cr, Glu/tCr | Left M1 | Right SR | 10–20 EEG system, verified by localizer | Left M1 | Pre/post tDCS |
| Auvichayapat et al. (2018) | NAA/Cr, Glx/Cr, Cho/Cr, mI/Cr | Left M1 | Right shoulder | Identified by TMS | Anterior cingulate cortex | Pre/post tDCS |
| Auvichayapat et al. (2017) | Metabolite concentration (NAA, Cho, mI, Glx, Cr) and metabolite ratios (NAA/Cr, NAA/Cho, NAA/mI, Cho/NAA, Cho/Cr, Cho/mI, mI/Cr, mI/Cho, mI/NAA, Glx/Cr) | Left M1 | Right shoulder | Not reported | Left M1 and left basal ganglia | Pre/post tDCS |
| Bachtiar et al. (2018) | GABA, Glu, GABA/tCr, tCr | Left M1 (ref: Contralateral SR) | Right M1 (ref: Contralateral SR) | 5 cm lateral to mid‐precentral position | Left and right M1 | Pre/during/3 post (2 voxels each) |
| Bachtiar et al. (2015) | GABA/Cr | Left M1 | Right SR | 5 cm lateral to Cz | Left M1 | 3 pre/4 during/3 post |
| Barron et al. (2016) | GABA, Glu | Right temporal cortex | Left SR | 10–20 EEG system, T6 node location | Right temporal cortex | Pre/during/post |
| Binkofski et al. (2011) | ATP/Pi, PCr/Pi | Right M1 | Left SR | Identified by TMS | Slab including left and right M1 | 1 pre/7 post |
| Carlson et al. (2018) | NAA, Cho (glycerophosphocholine + phosphocholine), Cre (creatine + phosphocreatine), Glx (Glu/Gln), mI | Lesioned M1 | Contralateral SR | tDCS—by TMS, MRS VOI—by fMRI | Where the highest BOLD effect was occurred. | Pre/post |
| Clark et al. (2011) | tNAA, tCr, tCho, Glx, mI | Right parietal cortex | Left upper arm | 10–20 EEG system | Two voxels; left and right intraparietal sulcus | Pre/post |
| Dickler et al. (2018) | GABA, Glx, NAA | Right DLPFC | Left DLPFC | 10–20 EEG system | Right DLPFC and right striatum | During |
| Dwyer et al. (2019) | GABA, Glx, NAA | Left PSTG | Right orbitofrontal cortex | 10–20 EEG system | Left PSTG | Pre/2 during/2 post |
| Harris et al. (2019) | GABA, Glx, NAA, Cho, Cr | Left IFG | Right cheek | 10–20 EEG system, fiducial marker | Left IFG and control—right M1 | Pre/2 post |
| Hone‐Blanchet et al. (2016) | Glx, NAA, GABA | Left DLPFC | Right DLPFC | 10–20 EEG system, verified using MR scan | Left DLPFC and left striatum | During/post |
| Jalali et al. (2018) | GABA, Glx | Right cerebellar cortex | Right buccinator muscle | 3 cm lateral to the inion | Cerebellum | Pre/during/post |
| Jauch‐Chara et al. (2015) | ATP/Pi, PCr/Pi | Right M1 | Left SR | Identified by TMS | Slab incl. Left and right M1 | 2 pre/8 post |
| Kim et al. (2014) | GABA, Glu, Gln, NAA | Left M1 (ref: right SR) | Left M1 (ref: right SR) | Identified by TMS | Left and right M1, posterior area of the occipital lobe centred on the mid‐sagittal plane. | Pre/8 post |
| Kistenmacher et al. (2017) | ATP, PCr | Right M1 | Left SR | Identified by TMS | Slab incl. left and right M1 | Pre/8 post |
| Knechtel et al. (2014) | Glu, Gln | Left prefrontal | Right SR | 10–20 EEG system | Left DLPFC | Post |
| Koolschijn et al. (2019) | GABA, alanine, ascorbate, aspartate, Glu, Gln, Cr, PCr, glucose, inositol, scyllo‐inositol, lactate, NAA, NAAG, taurine. All relative to Cr | Right temporal cortex | Right SR | 10–20 EEG system | Right temporal cortex | Pre/during/post |
| Nwaroh et al. (2020) | GABA, Glx, NAA, Cr, Cho—relative to Cr | Right M1 b | Left SR | Identified by TMS | Left and right sensorimotor cortices | Pre/2 post (4 days after tDCS and 6 weeks after) |
| O'Shea et al. (2017) | GABA/Cr, Glu/Cr | Left M1 | Right SR | 10–20 EEG system | Left M1 and occipital cortex | Pre/post |
| Patel et al. (2019) | GABA | Left M1 | Contralateral SR | 10–20 EEG system | Left M1 | 2 pre/10 post |
| Rae et al. (2013) | ATP, PCr, Pi, pH | Left DLPFC | F8 | 10–20 EEG system | Left DLPFC | Pre/during/post (20 min after tDCS) |
| Rango et al. (2008) | NAA, mI, Cr, Cho, Glx | Right M1 | Right shoulder | Not reported | Right M1, visual cortex | Pre/post |
| Ryan et al. (2018) | NAA, mI, Cr, Cho, Glu, GSH—relative to Cr | Right supplementary motor area | Left M1 | 10–10 EEG system | Left M1 | Post |
| Siniatchkin et al. (2012) | NAA, Cr, Glx (Glu + Gln + GABA)—relative to Cr | Ref. Cz | Visual cortex | 10–20 EEG system | Left and right visual cortex | Pre/post |
| Stagg et al. (2011) | (GABA without MM)/NAA, Glx/NAA | Left M1 | Right SR | Not reported | Left M1, visual cortex as a reference | Pre/post |
| Stagg et al. (2009) | Exp1. anodal and cathodal – GABA/NAA, Glx/NAA, NAA, Exp2. Cathodal—Glu, Gln, Cr and anodal—Cr | Left M1 | Right SR | 5 cm lateral and 2 cm anterior to Cz | Left M1 | Pre/post |
| Tremblay et al. (2016) | GABA, Glx, total NAA (NAA + NAAG), tCr (Cr‐CH3 + PCr‐CH3), mI | Left M1 | Right M1 | 10–20 EEG system | Left M1 | Pre/2 post |
| Tremblay et al. (2014) | GABA, Glx | Left M1 | Right M1 | 10–20 EEG system | Left M1 | Pre/post |
| Wardzinski et al. (2019) | ATP/Pi; PCr/Pi | Right M1 | Left SR | Identified by TMS | Right M1 | c |
| Wilke et al. (2017) | GABA | Left M1 | Right SR | 10–20 EEG system | Left M1 | Pre/post |
| Zappasodi et al. (2018) | Total NAA, Cho, Cr, Glx | Left shoulder | Left M1 | Identified by TMS | Left M1 | See Table 2 d |
Abbreviations: ATP, adenosine tri phosphate; Cho, choline; Cr, creatine; DLPFC, dorsolateral prefrontal cortex; EEG, electroencephalogram; GABA, gamma‐amino butyric acid; Glx, glutamine (Gln) + glutamate (Glu); IFG, inferior frontal gyrus; M1, motor cortex; mI, myo‐inositol; MRS, magnetic resonance spectroscopy; NAA, N‐acetyl aspartate; NAAG, N‐acetyl aspartatylglutamate; PCr, phosphocreatine; Pi, inorganic phosphate; PSTG, posterior superior temporal gyrus; RM‐ANOVA, repeated measure analysis of variance; SR, supraorbital ridge; tCr, total creatine; tDCS, transcranial direct current stimulation; TMS, transcranial magnetic stimulation.
Pre, post indicate MRS measurements in relation to the tDCS.
High‐definition tDCS.
Baseline MRS/1 tDCS/10 MRS/2 tDCS/10 MRS.
The cathodal tDCS was delivered five times;1st tDCS / 2 hours break / 2nd tDCS / 4 hours break / 3rd tDCS / 5 hours break / 4th tDCS / 14hours break / 5th tDCS.
TABLE 5.
Studies reporting tDCS‐induced neurometabolite modulation in healthy cohorts
| Study | Aim | Statistical analysis (multiple comparison correction) | Results detected by MRS |
|---|---|---|---|
| Antonenko et al. (2019) | Investigation of the anodal and cathodal tDCS neuromodulatory effects on GABA and Glu in M1 | Mixed model | GABA decreased in both anodal and cathodal tDCS compared to sham. Glutamate reduced only after cathodal stimulation compared to sham |
| Antonenko et al. (2017) | Investigation of the anodal and cathodal tDCS neuromodulatory effects on GABA and Glu in M1 of elderly cohort | Mixed model | Both anodal and cathodal tDCS caused decrease in GABA compared to sham, but only anodal reached the significance. Glutamate also showed decreasing trend after both anodal and cathodal tDCS but did not reach the significance. In older group (>63 years), GABA decrease after anodal tDCS was larger than in younger (>63 years) old group |
| Bachtiar et al. (2018) | Investigation of neuromodulatory effects of tDCS on GABA and Glu in M1 using anodal, cathodal and bi‐hemispheric montage | RM‐ANOVA | Anodal: Significant GABA reduction in both stimulated and non‐stimulated M1. Cathodal: Significant GABA reduction in non‐stimulated M1 and no significant change in stimulated M1. Bi‐hemispheric: No significant GABA change under anode, but significant GABA reduction under cathode (right M1). No significant glutamate concentration changes in any of the montage. No significant Cr concertation change in any montages. No change of any metabolites during tDCS. All results are given vs. sham |
| Bachtiar et al. (2015) | Investigation of the neuromodulatory effects on GABA during and after tDCS. Determine the duration of this effect | RM‐ANOVA | GABA levels significantly decreased after anodal tDCS compared to sham (most prominent decrease was shown ~15 min after tDCS) and the baseline. The effect lasted 30 min after the stimulation. No significant change of GABA during tDCS |
| Barron et al. (2016) | Investigation of inhibitory rebalancing via tDCS neuromodulatory effects and neurometabolite measurements | t test | GABA decreased significantly during the anodal tDCS compared to the baseline and went up after participants performed the task. Glutamate showed also a significant increase after the task, which was performed after the stimulation |
| Binkofski et al. (2011) | Investigation of tDCS effect on cerebral energy metabolism | RM‐ANOVA, t test | In both stimulated and non‐stimulated M1 high energy phosphates depicted biphasic behaviour with significant decrease in ATP and PCr concentrations after 65 min and subsequent overshoot compared to baseline and sham |
| Clark et al. (2011) | Investigation of the tDCS effect on neurometabolites | ANOVA | Glx and NAA concentration increased in the stimulated right parietal cortex after anodal tDCS compared to pre‐stimulation values, but not in the non‐stimulated contralateral area. No change in Cr, Cho and mI |
| Dwyer et al. (2019) | Investigation of tDCS effect on the neurometabolites of the pSTG | Mixed model | No significant change of GABA, NAA or Glx during or after tDCS stimulation compared to sham, as well as compared to pre‐stimulation values |
| Hone‐Blanchet et al. (2016) | Investigation of a single dose tDCS effect during and immediately after stimulation in prefrontal and striatal cortices | Wilcoxon test | During bi‐hemispheric tDCS: Significant increase of NAA and no change of Glx or GABA in the left DLPFC. Significant increase of Glx in the left striatum. After tDCS: No significant change in NAA, Glx or GABA. All results given compared to sham |
| Jalali et al. (2018) | Investigation of the neurometabolite changes in the cerebellum after tDCS | RM‐ANOVA (Bonferroni correction) | No significant change in the GABA or Glx concentrations in the right cerebellar cortex during or after anodal tDCS compared to baseline or sham |
| Kim et al. (2014) | Investigation of the effects of tDCS on GABA and glutamate in motor cortex and their role in motor learning and motor memory | Independent t test | Significant decrease in GABA after anodal tDCS in the stimulated M1. No significant change in GABA after cathodal tDCS. No change in glutamine or glutamate after neither anodal nor cathodal stimulation. All results given compared to sham and the baseline. No change in any metabolite concentration in the non‐stimulated right M1 or in the visual cortex |
| Kistenmacher et al. (2017) | Investigation of tDCS effect on the brain energy metabolism and glucose tolerance after repetitive 1‐week stimulation | ANOVA | Significant increase in ATP and PCr concentrations only after Day 1 compared to sham. No change after Day 8 |
| Knechtel et al. (2014) | Investigation of tDCS effect on Glx in association with auditory event‐related potentials in prefrontal cortex | Wilcoxon test | There was no statistically significant change in glutamate or Glx signal after anodal tDCS in the stimulated left prefrontal cortex compared to sham |
| Koolschijn et al. (2019) | Investigation of the neocortical inhibition role via tDCS‐induced GABA modulation against memory interference | t test | Significant decrease of GABA concentration during anodal tDCS in the stimulated right temporal cortex compared to baseline. Significant increase of glutamate after both stimulation and task, as well as the significant decrease in aspartate compared to pre‐stimulation. No change in alanine, ascorbate, GPC, phosphocholine, Cr, PCr, glucose, Gln, glutathione, inositol, lactate, NAA, NAAG, PEA, scyllo‐inositol and taurine |
| Nwaroh et al. (2020) | Investigation of the conventional anodal and HD tDCS‐induced modulation (paired with motor task) on GABA and Glx in right M1 in children | Mixed model (Bonferroni correction) | No significant change in GABA, Cho, NAA or Cr in both M1 after neither conventional nor high‐definition anodal tDCS compared to sham. Glx increase in the left M1 (contralateral from stimulation site) after 6 weeks follow‐up compared to baseline and the sham after high‐definition anodal tDCS |
| O'Shea et al. (2017) | Investigation of relationship between tDCS‐induced GABA modulation and the behavioural change | t test | Significant decrease of GABA in M1 compared to baseline. No change of Glu and no change of GABA in the occipital cortex |
| Patel et al. (2019) | Investigation of long‐term effects of anodal tDCS on GABA in M1 | ANOVA | Biphasic decrease of GABA in the left M1 in 25 and 66 min after the anodal tDCS compared to baseline and sham |
| Rae et al. (2013) | Investigation of brain energetic change after bi‐hemispheric tDCS | M‐ANOVA, ANOVA | Significant increase in pH and decrease in phosphomonoesters and inorganic phosphate during and after anodal tDCS in the left dorsolateral prefrontal cortex. Two groups based on the changes in ATP and PCr: Group 1 showed increase in ATP and PCr during anodal tDCS and Group 2 depicted opposite effect. All results are given compared to both baseline and sham |
| Rango et al. (2008) | Investigation of tDCS effect on the neurometabolites in the frontal lobe | Parametric and non‐parametric ANOVA, t test (Bonferroni correction) | Significant increase of mI in the right motor cortex, measured in 30 min after anodal stimulation compared to baseline and sham. No change in NAA, Cr, Cho or Glx |
| Ryan et al. (2018) | Investigation of neurometabolite change after bi‐hemispheric tDCS in M1 | RM‐ANOVA, t test | No significant change in any of the measured metabolites: NAA, Cho, mI, glutamate or glutathione compared to sham. Strong association between the absolute changes of NAA and total creatine |
| Stagg et al. (2011) | Investigation of the GABA responsiveness on tDCS and relationship to motor learning | t test | GABA decreased in the left motor cortex after anodal tDCS compared to baseline. Higher degree of change in GABA lead to faster motor learning |
| Stagg et al. (2009) | Investigation of polarity specific neurometabolite concentration change after tDCS | ANOVA, t test | NAA and Cr did not change nether after anodal or cathodal stimulation (3 T and 7 T). GABA decreased in both anodal and cathodal. Glx and Glu decreased only after cathodal tDCS. The effect was stable during 20 min. All results are given compared to both baseline and sham |
| Tremblay et al. (2016) | Investigation of the neuromodulatory effects of the bi‐hemispheric tDCS on M1 | RM‐ANOVA (Bonferroni correction) | No significant change in GABA, Glx, mI, total Cr or total NAA compared to baseline and the sham. High inter‐individual variability |
| Tremblay et al. (2014) | Demonstration of tDCS and MRS protocols | Not relevant, 1 example | GABA decrease in bi‐hemispheric anodal stimulation (Post 1). Glx increase in bi‐hemispheric cathodal (Post 2). All results are given compared to both baseline and sham |
| Wardzinski et al. (2019) | Investigation of the neuro‐energetics after double anodal tDCS | RM‐ANOVA | Biphasic behaviour of ATP with an initial drop after 10 min of the first tDCS and then increase in 40 min. No biphasic behaviour of ATP or PCr after second tDCS. Significantly higher ATP/Pi and PCr/Pi after both tDCS sessions. All results are given compared to both baseline and sham |
| Zappasodi et al. (2018) | Investigation of safety and the effects of five cathodal tDCS on M1 | Friedman test | No significant change in total Cho, Cr, NAA or Glx compared to baseline |
Abbreviations: ATP, adenosine tri phosphate; Cho, choline; Cr, creatine; DLPFC, dorsolateral prefrontal cortex; GABA, gamma‐amino butyric acid; Glx, glutamine (Gln) + glutamate (Glu); GPC, glycerophosphocholine; HD, high‐definition; mI, myo‐inositol; MRS, magnetic resonance spectroscopy; M1, motor cortex; NAA, N‐acetyl aspartate; NAAG, N‐acetyl aspartatylglutamate; PCr, phosphocreatine; PEA, phosphoethanolamine; Pi, inorganic phosphate; pSTG, posterior superior temporal gyrus; RM‐ANOVA, repeated measure analysis of variance; tDCS, transcranial direct current stimulation.
TABLE 6.
Symbolised neurometabolite concentration changes in the different areas of brain in the healthy subjects measured by MRS
| Area | tDCS polarity | GABA | Glx | Glu | Gln | GSH | NAA | Cho | Cr | mI | ATP | PCr | Pi | Asp |
|---|---|---|---|---|---|---|---|---|---|---|---|---|---|---|
| Right M1 | Anodal | ⇩⟺*⟺↔ | ↔ ↔ | ⟺ ⟺ ⟺* | ⟺ | ↔ ↔ | ↔ ↔ | ⟺ ↔ ⟺* ↔ | ↑ | ⇵ ⇵ ↑ | ⇵ ↑↑ | |||
| Cathodal | ⇩ ⟺* ⟺ | ⟺ ⟺ ⟺* | ⟺ | ⟺ ⟺* | ||||||||||
| Bi‐hemispheric under cathode | ↓ ↔ * | ↔ ↔ * | ↔ ↔ * | |||||||||||
| Left M1 | Anodal | ↓ ↓ ↓ ↓ ↓ ↓ ↓ ↓ ↓ ⟺ ↔ * ↔ * | ⇧#↔ ↔ ⟺ |
↔ ↔ ↔ ↔ ↔ ↔ ↔ * |
↔ |
↔ ↔ ⟺ |
⟺ | ↔ ↔ ↔ * ⟺ | ⇩⇧ | ⇩⇧ | ||||
| Cathodal |
↓ ↓ ↔ ↔ ↔ ↔ * |
↓ ↔ |
↓ ↓ ↔ ↔ ↔ ↔ * |
↔ | ↔ ↔ ↔ | ↔ | ↔ ↔ ↔ ↔ * | |||||||
| Bi‐hemispheric under anode | ↓ ↔ ↔ ↔ * | ↔ ↔ | ↔ ↔ * | ↔ | ↔ ↔ ↔ * | ↔ | ||||||||
| Bi‐hemispheric under cathode | ↔ ↔ | ↑ ↔ | ↔ | ↔ | ↔ ↔ | ↔ | ↔ ↔ | ↔ ↔ | ||||||
| Left DLPFC | Anodal | ↔ | ↔ | |||||||||||
| Bi‐hemispheric under anode | ↔ ↔ * | ↔ ↔ * | ↑* ↔ | ↔ * ↔ | ↔ * ↔ | ↓* ↓ | ||||||||
| Left striatum | Bi‐hemispheric Left and right DLPFC | ⟺ ⟺* | ⇧* ⟺ | ⟺⟺* | ||||||||||
| Right temporal cortex | Anodal | ↓* ↓*↔ | ↑↑ ↔ * | ↔ * ↔ | ↔ * ↔ | ↔ * ↔ | ↔ * ↔ | ↔ * ↔ | ↔ * ↓ | |||||
| Left pSTG | Anodal | ↔ ↔ * | ↔ ↔ * | ↔ ↔ * | ||||||||||
| Right IPS | Anodal | ↑ | ↑ | ↔ | ↔ | ↔ | ||||||||
| Left IPS | Anodal | ⟺ | ⟺ | ⟺ | ⟺ | ⟺ | ||||||||
| Visual cortex | Anodal | ⟺ ⟺⟺ | ⟺ ⟺ | ⟺⟺ | ⟺ | ⟺⟺ | ⟺ | ⟺ | ⟺ | |||||
| Right cerebellum | Anodal | ↔ ↔ * | ↔ ↔ * |
Note: Each sign represents one experiment, ↑ = significant increase measured in the stimulated region; ↓ = significant decrease measured in the stimulated region; ↔ = no significant change measured in the stimulated region; ⇧ = significant increase measured in the non‐stimulated region; ⇩ = significant decrease measured in the non‐stimulated region; ⟺ = no significant change measured in the non‐stimulated region; ⇵ = biphasic change with decrease and concomitant increase in the stimulated region; ⇩⇧ = biphasic change with decrease and concomitant increase in the non‐stimulated region; * = changes measured during tDCS; # = 6 weeks follow‐up in children.
Abbreviations: DLPFC, dorsolateral prefrontal cortex; IPS, intraparietal sulcus; M1, motor cortex; MRS, magnetic resonance spectroscopy; pSTG, posterior superior temporal gyrus; tDCS, transcranial DC stimulation.
TABLE 7.
Studies reporting tDCS‐induced neurometabolite changes in pathologies
| Study | Pathology | Aim | Results |
|---|---|---|---|
| Auvichayapat et al. (2018) | Bilateral, medication‐resistant, neuropathic pain caused by traumatic spinal cord injury | Detection of tDCS‐treatment‐related brain metabolite changes in the anterior cingulate cortex of the patients as a measure of tDCS pain intensity decreasing effect | Glx/Cr and NAA/Cr increased significantly in anterior cingulate cortex after tDCS compared to baseline measures and were associated with anodal tDCS‐treatment‐related decrease in the pain intensity. No change in mI/Cr and Cho |
| Auvichayapat et al. (2017) | Spastic cerebral palsy with upper right limb spasticity | Detection of the tDCS‐treatment‐related neurometabolite changes in the left M1 and basal ganglia after anodal stimulation | Glx/Cr increased in left M1, while NAA/Cr, Cho/Cr and mI/Cr significantly increased in the left basal ganglia following tDCS. Metabolite ratio increase was correlated to the spasticity improvement after tDCS |
| Carlson et al. (2018) | Unilateral perinatal stroke syndrome with symptomatic hemiparetic cerebral palsy | Detection of the neurometabolite changes in the M1 after cathodal tDCS and investigate the correlation with the clinical function | Glx and Cr decreased in contralesional M1 after cathodal tDCS, but they could not explain the change in the clinical function |
| Dickler et al. (2018) | Gambling disorder | Investigation of the tDCS effect on the brain metabolites in gambling disorder | Significant increase of GABA levels and no significant changes in Glx or NAA in the right DLPFC after stimulation |
| Harris et al. (2019) | Primary progressive aphasia | Providing the evidence of the specific GABA modulation in the left frontal operculum after tDCS in combination with language therapy | Significant decrease of GABA in the inferior frontal gyrus after its stimulation with anodal tDCS and significantly greater language improvement compared to sham. No change in GABA, Glx, NAA, Cr or Cho in the right sensory M1 region |
| Jauch‐Chara et al. (2015) | Obesity | Examination of the tDCS effect on the neuro‐energetics and the glucose‐intolerance improvement in obese men | No significant change in ATP, PCr or ATP/Pi and PCr/Pi after anodal tDCS in obese individuals. Only delayed drop in PCr/Pi, indicating rigid neuro‐energetic response. Normal‐weight men showed biphasic behaviour of ATP and PCr after tDCS depicting decreases and then rises over the baseline |
| Siniatchkin et al. (2012) | Migraine with visual aura | Investigation of the homeostatic‐like plasticity, as well as the visual cortex excitability and the metabolite concentrations with the help of tDCS, photic stimulation and MRS in migraine patients | No effect of tDCS on NAA/Cr or Cr and no significant difference in the baseline levels of these metabolites between healthy and migrainous individuals. Higher baseline Glx/Cr in patients. Increase in Glx/Cr was observed after anodal and the opposite effect after cathodal tDCS in the healthy subjects, while in patients only cathodal stimulation caused Glx/Cr decrease |
| Wilke et al. (2017) | Recurrent mild traumatic brain injury | Comparison of the GABA concentration in the motor cortex and cognitive performance between healthy individuals and traumatic patients. Investigation of the GABA modulatory effect of tDCS in this cohort | No significant difference in the baseline GABA concentrations between the healthy and TBI groups. No significant effect of tDCS in either group. Only positive correlation between the number of head traumas and the GABA concentration |
Abbreviations: ATP, adenosine tri phosphate; Cho, choline; Cr, creatine; DLPF, dorsolateral prefrontal cortex; GABA, gamma‐amino butyric acid; Glx, glutamine + glutamate; mI, myo‐inositol; MRS, magnetic resonance spectroscopy; M1, motor cortex; NAA, N‐acetyl aspartate; PCr, phosphocreatine; Pi, inorganic phosphate; TBI, traumatic brain injury; tDCS, transcranial direct current stimulation.
If data extraction could not be achieved, important missing data were first requested from the corresponding author of the studies. In total, 14 corresponding authors covering 19 studies were contacted, and responses were received from 10 corresponding authors for 13 studies. We did not set a specific time frame for responses, but most were very supportive and responded within a reasonable time, that is, within 1 week. We did not make any further contact with those authors who did not respond to us. The information that was not reported in the papers but was provided by the authors is marked in italic in the tables.
2.5. Risk of bias
Due to the heterogeneity of the study designs, it was not possible to use the pre‐existing quality assessment tools. Thus, according to the categories considered relevant by the authors, the risk of bias (ROB) for the included studies was assessed based on the combination of quality assessment measures suggested in the Cochrane Handbook (Higgins et al., 2019) and categories used in the recent systematic review articles on MRS or on tDCS (Archibald et al., 2020; Shiozawa et al., 2014). In total, 10 categories were used: (a) clear research question; (b) adequately described inclusion/exclusion criteria; (c) adequality reported demographics of the included study participants; (d) study randomisation; (e) at least single‐blinding; (f) control condition (sham group); (g) evidence of reported tDCS protocol; (h) evidence of reported MR acquisition parameter; (i) quality criteria metrics for MRS (e.g., signal‐to‐noise ratio [SNR], Cramer Rao lower bounds [CRLB]) and (j) clearly reported outcome.
2.6. Outcomes
The primary outcome measure is a concentration change of the neurometabolites as a function of the tDCS effect, taking into account the tDCS polarity and the affected brain region in the healthy individuals. The same outcome measure is reported separately in the investigated pathologies.
3. RESULTS
3.1. Search results
The initial literature search retrieved 59 publications from PubMed and 113 publications from Web of Science. The abstracts of all reports were scanned and 34 publications (Antonenko et al., 2017, 2019; Auvichayapat et al., 2017, 2018; Bachtiar et al., 2015, 2018; Barron et al., 2016; Binkofski et al., 2011; Carlson et al., 2018; Clark et al., 2011; Dickler et al., 2018; Dwyer et al., 2019; Harris et al., 2019; Hone‐Blanchet et al., 2016; Jalali et al., 2018; Jauch‐Chara et al., 2015; Kim et al., 2014; Kistenmacher et al., 2017; Knechtel et al., 2014; Koolschijn et al., 2019; Nwaroh et al., 2020; O'Shea et al., 2017; Patel et al., 2019; Rae et al., 2013; Rango et al., 2008; Ryan et al., 2018; Siniatchkin et al., 2012; Stagg et al., 2011; Tremblay et al., 2014, 2016; Wardzinski et al., 2019; Wilke et al., 2017; Zappasodi et al., 2018) dealing with human subjects were selected for the review. Figure 1 is a flow diagram summarising the inclusion process of the studies.
FIGURE 1.
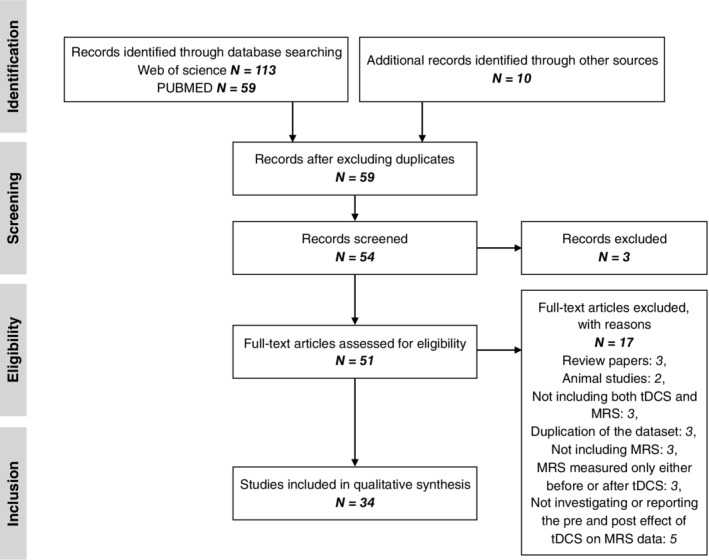
Flow diagram of study selection
3.2. ROB results
Nineteen studies (out of 34 studies in total) complied with all 10 ROB criteria while three studies (Rae et al., 2013; Ryan et al., 2018; Siniatchkin et al., 2012) failed to satisfy one criterion, two studies (Auvichayapat et al., 2017; O'Shea et al., 2017) two criteria. Three studies (Barron et al., 2016; Koolschijn et al., 2019; Tremblay et al., 2014) failed to fulfil four criteria, and five studies (Auvichayapat et al., 2018; Clark et al., 2011; Jalali et al., 2018; Stagg et al., 2011; Zappasodi et al., 2018) failed to fulfil three criteria. Figure 2 shows a traffic light plot and summary plot for ROB analysis generated using an online R‐based tool, Robvis (McGuinness and Higgins, 2020).
FIGURE 2.
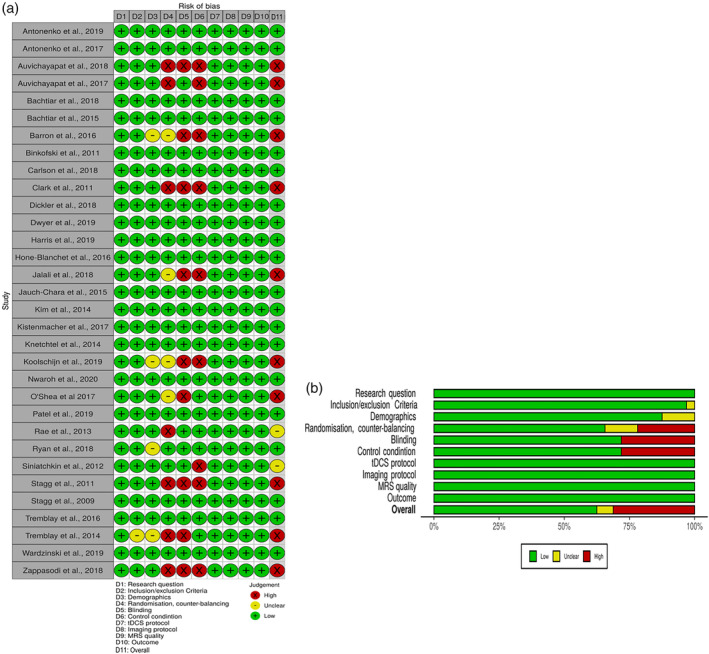
Risk of bias analysis traffic light plot (a) and summary plot (b) for included studies
3.3. Study characteristics
3.3.1. Study design and cohort characteristics
As shown in Table 1, the majority of these studies used randomised, single‐ (participants only) or double‐blinded (both participants and the experiment conductor(s) or both data analyser(s) and experiment conductor(s)), sham‐controlled and crossover designs. Additionally, six studies used a counter‐balanced design, one study used a longitudinal design, 11 studies used an observational design and one study used a triple‐blinded trial.
All volunteers participated in either both active and sham experiments (14 studies) or in either an active or a sham experiment (20 studies). One study was conducted on a cohort of children (~14 years old) and one on an elderly cohort (~65 years old). All other participants were young adults (around 25 years old).
Anodal tDCS was predominantly used in the studies selected for this review. Here, the anodal tDCS refers to the current flow from the anodal electrode placed on the area of interest to be stimulated, for example, M1, towards the reference electrode (in this case, the cathodal electrode) which is mostly placed on the contralateral supraorbital ridge or somewhere outside the brain. Seven studies (Bachtiar et al., 2018; Dickler et al., 2018; Hone‐Blanchet et al., 2016; Rae et al., 2013; Ryan et al., 2018; Tremblay et al., 2014, 2016) used bi‐hemispheric stimulation (current flow from the anodal to the cathodal electrode when one electrode is placed on one region of interest in the brain and the other on the same region but on the contralateral side) and two studies used (Carlson et al., 2018; Zappasodi et al., 2018) cathodal only stimulation (current flow to the cathodal from the reference electrode). Note that the term “bi‐hemispheric” rather than “bilateral” is used as the electrodes were not always placed in the identical region of both hemispheres, for example, M1 and on the contralateral supplementary motor region (e.g., Ryan et al., 2018).
3.3.2. tDCS protocols
Table 2 shows a summary of the tDCS protocols used in this review. An applied current of 1 mA was used in 24 studies. Then, 2 and 1.5 mA were used for nine and two studies, respectively. Among the nine studies using 2 mA, one study used 1.8 mA due to a technical issue (high impedance). Although there were variations in the duration of active tDCS, most studies used a stimulation time of 20‐min for active tDCS. Seven studies used 10 min, four studies used 15 min, one study used 25 min and two studies used 30 min. Seven studies reported repetition of stimulation. Moreover, 19 studies stated the tDCS was performed inside (16 studies) or outside (three studies) an MRI scanner, but 15 studies did not report this information. Note that the tDCS devices found in this review were mostly used for investigational purpose only and the majority were CE‐certified.
3.3.3. MR system, MRS parameters and MRS fitting software
The details relating to the MR system, MRS parameters and MRS fitting software are listed in Table 3. The vast majority of MRS studies were performed at 3 T using the MEGA‐PRESS sequence with 2 s TR and 68 ms TE. Six studies were conducted at ultra‐high field (7 T) using either the semi‐LASER (four studies) or STEAM (two studies) sequence. One study was conducted at 1.5 T. Most MRS studies used 1H and only five studies (in the same group) focused on 31P using the 3D CSI sequence. A voxel size of 20 × 20 × 20 mm3 was used for most 1H‐MRS studies and 60 × 50 × 30 mm3 was used for all 31P‐MRS studies. LCModel and jMRUI were predominantly used for MRS fitting and as processing software for 1H and 31P studies, respectively.
3.3.4. Stimulated and MRS VOI regions, quantified metabolites and tDCS–MRS scheme
Figure 3 displays the brain regions where tDCS was applied. One can see that most evidence has been acquired from stimulation of the M1 area; 13 studies from the left M1 and 9 studies from the right M1. Furthermore, three studies were carried out in a bi‐hemispherical manner on both the left and right dorsolateral prefrontal cortex (DLPFC). Two studies obtained data from the right temporal cortex region. In addition, studies in each of the left inferior frontal gyrus, left posterior superior temporal gyrus, visual cortex, right cerebellum, right parietal cortex and right supplementary motor cortex were performed. One study had multiple voxels for MRS measurements (Bachtiar et al., 2018) and the stimulating areas for tDCS electrodes were mostly defined using a 10–20 EEG system set‐up and/or TMS.
FIGURE 3.
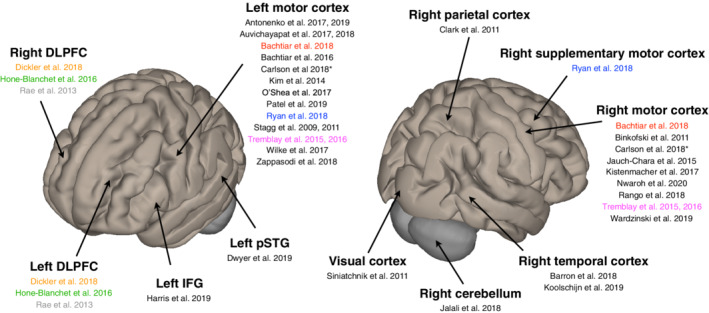
Brain regions where tDCS was applied with their corresponding published articles and literature included in this review. Colour coding indicates one study per colour, which used the bi‐hemispheric stimulation. DLPFC, dorsolateral prefrontal cortex; IFG, inferior frontal gyrus; pSTG, posterior superior temporal gyrus. The brain images were generated using CONN software (Whitfield‐Gabrieli & Nieto‐Castanon, 2012)
Quantified metabolites from the respective brain regions measured by MRS are summarised and visualised in Figure 4. In the case of 1H, GABA (19 studies), Glx (Glu + Gln) (17 studies), NAA (17 studies), Cho (nine studies), mI (eight studies), Glu and Gln (nine studies) were measured using MRS and the collected data were quantified. ATP, PCr and Pi were always chosen for the analysis of 31P data. One study had additionally conducted pH measurements.
FIGURE 4.
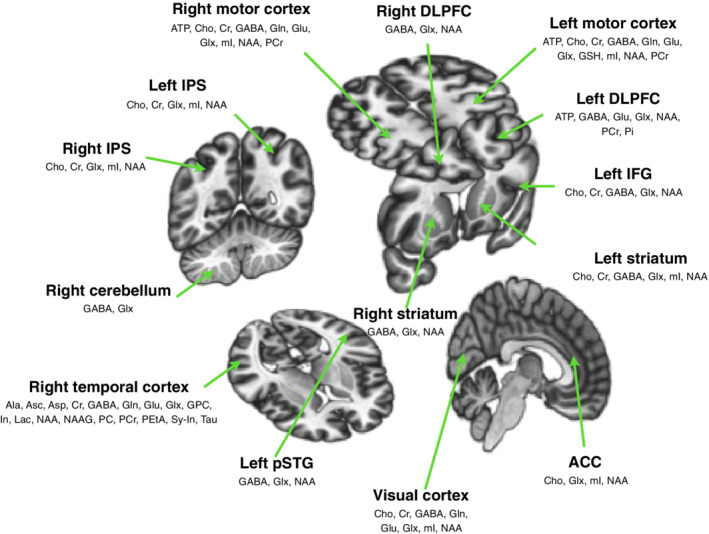
All neurometabolites of interest measured by MRS in the investigated studies in different brain regions used for the current review. ACC, anterior cingulate cortex; DLPFC, dorsolateral prefrontal cortex; IFG, inferior frontal gyrus; IPS, intraparietal sulcus; pSTG, posterior superior temporal gyrus. The brain images were generated using CONN software (Whitfield‐Gabrieli & Nieto‐Castanon, 2012)
Nearly all tDCS–MRS acquisition schemes were followed as a pre‐measurement prior to tDCS and a post‐measurement after tDCS. In addition, nine studies included a “during” measurement step and three studies included more than one pre‐measurement and 12 studies included more than one post‐measurement.
3.3.5. Studies reporting tDCS‐induced neurometabolite modulation in healthy cohorts
Twenty‐six studies investigated healthy volunteers and have been reported as listed in Table 5. Eight studies investigated the effect of anodal tDCS on GABA and Glx/Glu/Gln simultaneously in the adult left M1. Two studies reported only GABA measurements. Two studies conducted MRS on 7 T scanners and the rest were conducted at 3 T. In addition, 9 out of 10 studies showed a decrease in GABA after the stimulation, while none of them reported changes in Glx, Glu or Gln. In two studies, an apparent decrease in GABA in the right temporal cortex during anodal tDCS, returning to its baseline following stimulation, has been reported. One study investigated the same effect in elderly participants and one study investigated the effect in children. In the study with children, the right M1 was stimulated using both anodal conventional and HD tDCS. The only significant change was observed in Glx (increase) in the non‐stimulated left M1 after HD anodal tDCS in the 6 weeks follow‐up measurement. In the study on elderly participants, changes were found to be similar to those in the adult participants, albeit with a higher degree of GABA reduction in the elderly participants (>63 years) following anodal tDCS. Four studies investigated the concentration change of high energy phosphates in the right M1 and the left temporo‐frontal region after anodal tDCS. No study reported any significant change in Cho and Cr concentration following any of the tDCS montages. Among the four studies measuring mI, only one reported its increase in the right M1 after anodal tDCS. Two investigations reported an increase in NAA values in the left DLPFC and right parietal cortex after anodal tDCS. ATP/Pi and PCr/Pi exerted biphasic behaviour (decrease and then increase) in the concentration before returning to the baseline values. Table 6 shows a symbolised neurometabolite concentration modulation of all neurometabolites in the different areas of the brain in the healthy subjects measured following tDCS.
3.3.6. Studies reporting tDCS‐induced neurometabolite changes in pathologies
Eight studies investigated the effect of tDCS and concomitant neurometabolite changes in different pathologies. Two studies, conducted on a cohort of children, investigated the potential for tDCS as a treatment for spasticity improvement in cerebral palsy and motor rehabilitation in perinatal stroke syndrome. After five consecutive days of anodal stimulation, one stimulation per day was applied for 5 days in series, spasticity improved with a correlated increase in Glx in the left M1 and NAA, Cho and mI in the left basal ganglia. Following 10 consecutive days of cathodal tDCS of the lesioned M1; here, the stimulation was generated by flowing the current to the cathodal (the contralesional M1) from the reference (the contralateral supraorbital area), the motor function in perinatal stroke patients was improved, and Glx and Cr levels were decreased. However, the neurometabolite change and motor performance scores were not correlated. The remaining pathologies in the adult population included medication resistant neuropathic pain after traumatic spinal cord injury, primary progressive aphasia, recurrent traumatic brain injury, migraine, obesity and gambling disorder. Among these, three studies investigated different clinical conditions in comparison to the reference data acquired from healthy volunteers (Jauch‐Chara et al., 2015; Siniatchkin et al., 2012; Wilke et al., 2017) and found clear differences between both parties. Jauch‐Chara et al. studied patients with obesity by monitoring ATP, PCr level changes and found out that the bipolar behaviour of ATP/Pi and PCr/Pi was not observed in the patient group following anodal tDCS, whereas it was seen in the healthy group (Jauch‐Chara et al., 2015). Siniatchkin et al. observed that Glx/Cr increased after anodal tDCS and decreased after cathodal tDCS in healthy subjects. However, in a migraine with visual aura patient group only Glx/Cr decreased following cathodal tDCS, and no changes occurred following anodal tDCS (Siniatchkin et al., 2012). Wilke et al. investigated mild traumatic brain injury using anodal tDCS on the left M1 and reported that no GABA changes were found in either patient or healthy control groups (Wilke et al., 2017). A detailed summary of the study goals and outcomes is also reported in Table 7.
4. DISCUSSION
The aim of this current systematic review was to summarise and to explore evidence from the literature investigating the relationship between tDCS protocols and the effect on neurometabolite concentrations, determined by the MRS measurements and analyses. In this review, we identified a number of previous works, which were all carried out and published before March 1, 2020. Overall, 34 studies were included, providing an overview of neurometabolite changes in the healthy human brain, as well as in different pathologies.
4.1. Risk of bias
The overall ROB was low in most studies and the source of high ROB was caused most frequently due to the absence of either randomisation/counterbalancing or blinding. Even though four studies were randomised and counterbalanced for their main research question, they still did not meet the criterion regarding the measurement of the outcome in our systematic review (Barron et al., 2016; Jalali et al., 2018; Koolschijn et al., 2019; O'Shea et al., 2017). Thus, they have been rated as having an unclear ROB in this domain. Overall, eight studies did not report handedness, which was part of our demographics criterion. Among them, handedness for five studies was irrelevant for their study aims (Auvichayapat et al., 2017; Binkofski et al., 2011; Kistenmacher et al., 2017; Rae et al., 2013; Wardzinski et al., 2019). Four studies investigated the influence of the tDCS on the energy metabolism as measured by ATP and PCr, and one study used the tDCS modulation on the contra‐lesional side of the brain. Thus, it was not considered to have any influence on the ROB analysis. Two studies investigated the influence of tDCS on the metabolites in the temporal cortex (Barron et al., 2016; Koolschijn et al., 2019). Even though it has been reported in the literature that handedness has an influence on the functional differences in the memory processes (Cuzzocreo et al., 2009), as well as on the anatomical asymmetry of the language‐related temporal cortex (Steinmetz, Volkmann, Jäncke, & Freund, 1991), it is not clear whether handedness plays a role in the influence of tDCS on the temporal cortex. Hence, we evaluated the ROB domain as being unclear. One study (Ryan et al., 2018) used bi‐hemispheric stimulation, and it is unclear if handedness would have any influence on the results in this montage. Tremblay et al., 2014 only reported results from one volunteer, as the major purpose of this paper was to report the protocol for the combined tDCS and MRS studies. The information retrieved from the authors about whether tDCS was measured inside or outside and about the handedness actually improved the ROB for 14 studies. If the studies had a high or unclear ROB in two or more domains, they were considered as having a high overall ROB. If studies had one high ROB, they were rated as having an unclear ROB overall, and if they had one unclear bias in one domain, not including blinding, then they were rated as having a low ROB.
4.2. Information on neurometabolites and stimulated regions in the brain
GABA and Glx (Glu and Gln) for 1H, and ATP and PCr for 31P were reported as the most frequently investigated neurometabolites. As Glu and GABA are the major excitatory and inhibitory neurotransmitters, it is intuitive that most of the studies concentrated on these metabolites. Nowadays, the majority of the research is still carried out on 3 T MRI scanners, where overlapping Glu and Gln peaks are observed due to the narrow chemical shift. Therefore, the Glx reported here represents these chemicals together. Furthermore, synaptic activity in the brain is closely associated with the increased energy demand. Investigating the modulation of high‐energy phosphate concentration using tDCS can provide additional information relating to its action mechanism. Nevertheless, to better understand the coupling between the energy demand and the synaptic plasticity, it is strongly advisable to simultaneously investigate the metabolites involved.
It was found that the majority of studies examining the effects of tDCS on the neurochemicals in the brain were carried out in the left and right motor cortex regions. The preference towards examining these regions might be explained by the fact that there was already pre‐existing information relating to the direct association between motor evoked potentials and the motor cortex modulation using transcranial magnetic stimulation (di Lazzaro & Ziemann, 2013). Although tDCS exerts a huge potential for the treatment of neuropsychiatric disorders, especially for depression, there is very little research investigating the underlying neurometabolite changes in the prefrontal cortices—known to be an affected region in these pathologies (Kalu, Sexton, Loo, & Ebmeier, 2012).
4.3. Neurometabolite changes by the tDCS settings
4.3.1. Montage
All studies used conventional pad‐based montages between two electrodes. Among them, one study additionally used an HD montage with one electrode in the middle and four surrounding electrodes (ring‐montage). As the motor cortex was the most investigated region in the reviewed papers, the M1—contralateral supraorbital ridge montage was most frequently selected by researchers. The cheek and the shoulder were also reported as the locations for the extracerebral electrode. Bi‐hemispheric montage for the motor and frontal cortices have also been utilised. As ensuring localised brain stimulation is particularly challenging using the traditional montage, which generates a wide electrical field between the two electrodes (Esmaeilpour et al., 2018), the montage selection and brain region interconnection should be carefully considered to achieve reliable and consistent results.
4.3.2. Current, duration and repetition
The, 1 mA is the most frequently used current strength, followed by 2 mA. The preferred duration of the stimulation is 20 min. However, in previous behaviour studies, a current of 0.6 mA and 3 min of stimulation has been reported as being the minimum requirement for the initiation of cellular membrane excitation (Nitsche & Paulus, 2000). The effect of anodal tDCS tends to be bigger when the applied current strength and duration increases until a point where the LTP‐like activation might turn into the LTD‐like inhibition, or vice versa (Monte‐Silva et al., 2013). To date, the roof effect has not been reported and further studies are required to explore whether the threshold of the tDCS parameters may provide warranted information.
Most of the experiments in the reviewed studies were conducted in a single day. Three studies investigating the pathologic conditions performed the stimulation for 5 and 10 consecutive days, presenting positive results with regard to symptomatic improvement and metabolite changes (Auvichayapat et al., 2017; Carlson et al., 2018). In the healthy cohort, the tDCS repetition showed an opposite effect and blunted the neurochemical changes (Kistenmacher et al., 2017; Nwaroh et al., 2020) The possible explanation for this might be that in the healthy individuals, tDCS is reaching “saturation in the modulation” (Nwaroh et al., 2020), while in pathologies; the window is larger due to the neurochemical imbalance.
4.3.3. MRS and tDCS experimental scheme
Most studies carried out one baseline MRS measurement prior to the stimulation using tDCS and one post MRS measurement in order to compare the tDCS effect on a target metabolite. These measurements are the absolute minimum requirement. However, although a longer experimental time is necessary, in order to increase the acquired data reliability and minimise the potential drop‐out rate, at least two MRS measurements are recommended in each session.
4.4. Effect on neurometabolites by MR‐related parameters
4.4.1. MR system field strength
Ultra‐high field, such as 7 T, offers various benefits for MRS measurements, including increased SNR and larger chemical shift. The higher SNR allows improvements in MRS data fitting accuracy and shortens the overall MRS acquisition time while giving a similar VOI size as at 1.5 or 3 T, therefore, enabling multiple acquisitions (more baseline and post‐stimulation scans before/after tDCS) for better temporal resolution. This is particularly advantageous for 31P‐MRS due to its intrinsically low natural abundance compared to the proton. Having an increased chemical shift enables metabolites to be isolated from each other. For example, the Glx peak in the proton MR spectrum represents the combined peak of Glu and Gln at 3 T or a lower field strength. In contrast, at 7 T, the peaks of Glu and Gln can be separated allowing analysis of the functions of the glutamate–glutamine system and also increases the specificity towards understanding the synaptic plasticity via separate investigation of the major excitatory neurotransmitter.
4.4.2. MR sequence and sequence parameters
MR sequence parameters, and particularly the editing pulse, which is closely related to TE, are more or less standardised for each vendor, scanner and target metabolites. Parameter optimisation can be assisted by previous MRS only studies (Mikkelsen et al., 2017, 2019) which focus on only one metabolite; GABA. With the benefits of ultra‐high field MRI, smaller voxel size can be chosen and the brain region of interest can be more precisely selected and examined with less contamination from unwanted areas.
4.4.3. Fitting and statistical analysis program
Unless using home‐programmed software, the fitting program used for MRS data analysis is standardised. LCModel and jMRUI are mostly used for 1H and 31P metabolites quantification, respectively. Although these are well‐established and easy to use, in order to avoid obtaining biased and skewed information, users should pay special attention to setting the fitting software up, particularly in terms of prior knowledge, boundary and pre‐/post‐processing. In addition, it is highly recommended that authors report the MRS data quality showing, for example, the CRLB values, which provide the lowest possible SDs of the fitting error.
4.5. tDCS effects on neurometabolites in healthy participants
As mentioned above, the effect of DC modulation has most frequently been investigated as changes in GABA concentration and on Glx/Gln/Glu. In the majority of cases, these were measured in the left M1. Considering that all the studies except one (Tremblay et al., 2014) report GABA decrease and no change in Glx/Gln/Glu in the left M1 after anodal modulation, it is very likely that the LTP‐like effect of tDCS are driven by a reduction in the inhibitory tone (Antonenko et al., 2017, 2019; Auvichayapat et al., 2018; Bachtiar et al., 2018; Kim et al., 2014; O'Shea et al., 2017; Patel et al., 2019; Stagg et al., 2009; Stagg et al., 2011; Tremblay et al., 2014). Similarly, the LTD‐like effect of the cathodal modulation might be caused by reduced levels of the excitatory neurotransmitter as Glx/Gln/Glu decrease has been reported following cathodal tDCS with a concomitant reduction in GABA (Antonenko et al., 2019; Stagg et al., 2009). Stagg et al. (2009) also explained that GABA decreases secondary to reduced Glu levels, as the latter is GABA's precursor. However, this effect should be interpreted more cautiously, as only a few studies have conducted investigations using cathodal tDCS, and, on the whole, no significant concentration change of Glx/Gln/Glu was shown in these studies (Bachtiar et al., 2018; Kim et al., 2014).
The effect of tDCS on the GABA and Glx/Gln/Glu levels has also been investigated in other regions of the brain. No concentration change was observed, except in the right M1, temporal cortex and intraparietal sulcus, where GABA decreased and the Glx/Glu increased (Bachtiar et al., 2018; Barron et al., 2016; Clark et al., 2011; Koolschijn et al., 2019).
Moreover, the effects of tDCS have been inspected on NAA, Cr, Cho and mI levels in different regions of the brain, as measured by MRS. No change in either Cr or Cho has been shown in any of the areas (Bachtiar et al., 2018; Clark et al., 2011; Nwaroh et al., 2020). However, NAA increased in the left DLPFC during anodal tDCS (Hone‐Blanchet et al., 2016) and in the right intraparietal sulcus following the stimulation (Clark et al., 2011). The mI levels increased after anodal stimulation only in the right M1 (Rango et al., 2008). As Cr and NAA are commonly used as a reference to analyse the ratio of metabolites after MRS, it is important to measure and report the concentration change of these chemicals in order to avoid any erroneous results. One study in particular has reported increased NAA during bi‐hemispheric tDCS in the left DLPF under the anodal electrode (Hone‐Blanchet et al., 2016). Two studies (Stagg et al., 2009, 2011) have used NAA and seven studies (Antonenko et al., 2017, 2019; Bachtiar et al., 2015, 2018; Nwaroh et al., 2020; O'Shea et al., 2017; Ryan et al., 2018) chose Cr as a reference in a healthy cohort where no change of NAA or Cr was depicted. In MRS, it is often challenging to acquire absolute concentration without the reference, since the signal intensity of spectra is not only proportional to the metabolic concentration but is also influenced by a variety of factors, including pulse sequence parameters and HW imperfection (e.g., Rx coil sensitivity and eddy current). Therefore, if we analyse the levels of metabolites as a ratio, one assumes the removal of these unplanned factors, consequently, it is important to select a stable metabolite as a reference.
Seven studies presented the neurochemical concentration in the healthy cohort during the anodal tDCS measured by 1H MRS, but, to some extent, the results obtained are counterintuitive (Bachtiar et al., 2015, 2018; Barron et al., 2016; Dwyer et al., 2019; Hone‐Blanchet et al., 2016; Jalali et al., 2018; Koolschijn et al., 2019). For example, two studies (Barron et al., 2016; Koolschijn et al., 2019) reported that GABA decreased in the temporal cortex compared to baseline, while one study (Dwyer et al., 2019) showed no change in the GABA level during the stimulation in the temporal cortex when compared to baseline. It should be noted that the target area for tDCS stimulation was different; the GABA concentrations measured in the first two studies were in the right temporal cortex, whereas the other conducted the experiment on the left side. However, we could not find any explanation as to how this could have influenced the results. Furthermore, four studies, two investigating GABA concentration in the left M1 (Bachtiar et al., 2015, 2018), one in the left DLPFC (Hone‐Blanchet et al., 2016) and one in the right cerebellum (Jalali et al., 2018) also showed no concentration change in GABA during the stimulation. One study (Hone‐Blanchet et al., 2016) showed increased NAA in the left DLPFC and increased Glx in the left striatum, while the other studies demonstrated no change in either Glx and Glu (Bachtiar et al., 2018; Barron et al., 2016; Dwyer et al., 2019; Jalali et al., 2018; Koolschijn et al., 2019) or in NAA (Dwyer et al., 2019; Koolschijn et al., 2019). Again, the location of the stimulation was different, for example, temporal cortex for NAA and Glx as well as M1 for Glx, suggesting that the metabolite change observed during the tDCS stimulation might also be location dependent.
Four studies explored the effect caused by anodal tDCS on the high energy phosphates in the right M1 and left DLPFC. As expected, the response of ATP and PCr levels in M1 followed the biphasic pattern; it decreased immediately after tDCS and increased after a certain time (Binkofski et al., 2011; Wardzinski et al., 2019). However, not all of the studies reported the biphasic behaviour. Kistenmacher et al. showed the significantly higher ATP and PCr after anodal tDCS of the right M1 compared to the sham measurement after Day 1 and showed that this effect disappeared after Day 8 (Kistenmacher et al., 2017). Furthermore, both PMEs and inorganic phosphate decreased in the left DLPFC. While with reference to ATP and PCr, two groups emerged, one with the concentration decreased and another with its increase predicted by the baseline pH and ATP levels (Kim et al., 2014). In order to ensure neurochemical concentration changes in the temporal domain, acquiring not one but several post‐stimulation measurements is recommended.
A range of studies have investigated the effects of tDCS on neurometabolites which extended beyond the regions of tDCS application. For example, with the exception of one study showing GABA reduction after anodal tDCS in the right M1 (Bachtiar et al., 2018; Clark et al., 2011; Kim et al., 2014; Nwaroh et al., 2020), measuring GABA and Glx/Gln/Glu in the contralateral M1 or in the vicinity of intraparietal sulcus of the stimulation depicted no concentration change. The other regions included the left striatum and visual cortex, with no change in any of the metabolites except Glx during anodal tDCS in the left striatum (Hone‐Blanchet et al., 2016; Kim et al., 2014; Stagg et al., 2011). Only one study investigated the extended effect of the neuromodulation on the high energy phosphates and described both ATP and PCr decrease in the left M1 contralateral to the stimulated area (Binkofski et al., 2011).
4.6. tDCS effects on neurometabolites in pathologies
While the use of tDCS together with MRS has shown a huge potential in respect to the treatment of neuropsychiatric diseases, it is surprising that not many studies investigating its modulatory effects on the neurometabolites in different pathologies have been conducted. In our search of the literature, we only found eight cases. A few of the studies examining tDCS effects measured by MRS in child‐related pathologies reported neurochemical concentration modulation after tDCS (Auvichayapat et al., 2017; Carlson et al., 2018). However, the only paper that investigated the same effect in healthy children did not record any changes in brain metabolites after conventional tDCS (Nwaroh et al., 2020). Auvichaypatat et al. also demonstrated increased Glx in the left M1 and decreased NAA, Cho and mI levels in the left basal ganglia of the children with spastic cerebral palsy. The left M1 was stimulated for a duration of 20 min using 1 mA anodal tDCS for five consecutive days (Auvichayapat et al., 2017). Nwaroh et al. found no changes in Glx, NAA, GABA, Cho or Cr in the healthy cohort of children after 20 min of 1 mA anodal tDCS on four successive days. However, high Glx levels were detected in the left M1, contralateral to stimulation after HD tDCS in a 6‐week follow‐up (Nwaroh et al., 2020). They concluded that the brains of the healthy children might already be in “plastic state” and hyperexcitable and therefore, tDCS had no effect. On the other hand, this condition can be disrupted in pathologies where neurochemical concentration can be out of balance. That is when tDCS can make a difference.
In the neuropathic pain and primary progressive aphasia, tDCS exerted the same directional effect on the neurometabolites as in the healthy adult cohort. Additionally, changes in the neurochemicals were correlated to an improvement in symptoms (Auvichayapat et al., 2018; Harris et al., 2019). In the group where participants suffered from a gambling disorder, GABA increased in the right DLPFC, and this result was opposite to what was seen in the motor cortex of the healthy individuals (e.g., Antonenko et al., 2019; Bachtiar et al., 2018; Stagg et al., 2011). It was observed that Glx did not change in migraine patients following anodal tDCS but decreased in the healthy control group. However, it was shown to decrease in both patients and controls following cathodal tDCS (Siniatchkin et al., 2012). In a recurrent TBI study, anodal tDCS had no effect on GABA in either the patient group or the healthy subjects (Wilke et al., 2017). In studies investigating obesity, anodal tDCS showed a blunted effect on high energy phosphate concentration, as there was only delayed drop in PCr values to be notified compared to the biphasic behaviour of the ATP and PCr in the lean individuals after anodal tDCS (Jauch‐Chara et al., 2015).
Although studies investigating the effects of tDCS on neurometabolites and their correlation to symptom improvement in different diseases is scarce, it is still clear that brain stimulation has potential as a new treatment strategy and/or a tool to profoundly understand pathological mechanisms in the brain. The discrepancies or no effects of tDCS on the brain's metabolite concentration in different disorders compared to the findings in the healthy population should be carefully interpreted due to the diversity of the datasets. Special attention should also be paid to the careful selection of the reference metabolite, that is, Cr or NAA, especially in the clinical population since the tDCS modulatory effects on these reference metabolites have been observed in some pathological conditions (Rackayova, Cudalbu, Pouwels, & Braissant, 2017), including one study (Carlson et al., 2018) cited in this paper. Thus, in the study by Carlson et al., metabolite levels were not reported using Cr as a reference because Cr levels are thought not to be stable in perinatal stroke syndrome patients, and the practice of using Cr as an internal reference to calculate the concentration ratios of metabolites is of questionable reliability (Rae, 2014). Furthermore, it is also known that some pathologies themselves influence the concentration levels of these metabolites (Chiappelli et al.,2019; Dezortova et al., 2008). In the case of examining patients, particularly when comparing the data from different pathologies to the healthy state, the use of water concentration as an internal reference may be an alternative since it could eliminate possible bias due to the changes in Cr concentration (Rackayova et al., 2017). Therefore, more stratified research is desirable with a larger sample size in the future.
4.7. Side effects of tDCS
Majority of the studies have not mentioned the side effects of tDCS and only nine studies accessed in this review refer to side effects relating to tDCS (Auvichayapat et al., 2018; Dickler et al., 2018; Harris et al., 2019; Hone‐Blanchet et al., 2016; Kistenmacher et al., 2017; Nwaroh et al., 2020; O'Shea et al., 2017; Tremblay et al., 2014; Zappasodi et al., 2018). Three of them reported that there were no adverse effects or no significant differences between active and sham tDCS conditions (Dickler et al., 2018; Harris et al., 2019; Hone‐Blanchet et al., 2016). Nwaroh et al. and Kistenmacher et al. refer only to “low side effects” in the introduction and discussions sections of their papers. Auvichayapat et al. reported that four participants showed evidence of erythematous rashes where the cathodal electrode was placed over their right shoulders during treatment. However, all of these rashes resolved within 2 hr. O'Shea et al. observed that side effects were restricted to a transient itch or tingling sensation under one or both electrodes during current ramp‐up but dissipated over time (O'Shea et al., 2017). Tremblay et al. stated the most reported side effects were mild tingling (70.6%), moderate fatigue (35.3%), a slight sensation of itching under the electrodes (30.4%), and slight burning sensation (21.6%) (Tremblay et al., 2014). Finally, Zappasodi et al. presented an absence of serious adverse side effects, although all subjects reported mild to moderate tingling or a burning sensation under the cephalic electrode. This lasted during the entire stimulations in 10 (31%) subjects. Reversible mild scalp erythema, not requiring medical intervention, was observed in 5 (16%) subjects (Zappasodi et al., 2018). According to Bikson et al., research on the side effects of tDCS is ongoing, but so far, the only established side effects are minor, for example, temporary skin redness, itching and tingling, and these are restricted to the electrode location (Bikson, Grossman, Thomas, et al., 2016). Brunoni et al. also reported headache, nausea and dizziness as side effects, but also emphasised that these side effects have been illustrated to occur at nearly the same rate as in sham stimulations (Brunoni et al., 2011).
4.8. Limitation
The main limitation of the current systematic review is its heterogeneous characteristic according to the key parameters: tDCS polarity, stimulation duration, repetition, current strength, MRS sequence parameters or pre‐/post‐processing, the time window in which to acquire MRS data, stimulated brain regions and the monitored metabolites, which makes it unreasonable to conduct a meta‐analysis. Furthermore, since the studies combining both tDCS and MRS are relatively new, the sample size of each study is rather small—some of them did not even include a sham control group and judged the effects of tDCS on neurometabolite concentration changes based on the results of pre‐ and post‐measurements. Additionally, due to the heterogeneity of the data, it was not easy to carry on the direct comparison between healthy and clinical populations.
4.9. Current challenges and future directions
The combination of tDCS with MRS is a comparatively new and emerging method. Therefore, the number of studies performing investigations on neurometabolites is still limited. Future research on this topic is encouraged, albeit with careful consideration of the aforementioned pitfalls and existing gaps. To facilitate ease of comparison between studies, it is also highly recommended that the following information should be clearly described—study design: randomised, counter‐balanced, double‐blinded, sham‐controlled, crossover; tDCS current, duration, repetition, location of electrodes, type (inside/outside MR scanner); MR field strength, sequence, TR/TE, VOI size, fitting tool, statistics, measured MRS regions, tDCS–MRS experimental scheme; quantified metabolites; subjects' health; responses of metabolites. Moreover, the optimisation and standardisation of both tDCS and MRS methods to enable multi‐centre studies with a large sample size are also required. The development of advanced multi‐functional MRS sequences, such as allowing multi‐voxel selection, fast acquisition sequence, capability of multinuclear acquisition, and so forth would also be advantageous.
The traditional tDCS montage currently used lacks the precise spatial resolution with regard to the stimulated brain region as the produced electric field is diffuse and flows between the electrodes (Esmaeilpour et al., 2018). To overcome this issue, HD tDCS using the small electrode array configuration has been recently proposed (Datta et al., 2008; Dmochowski, Datta, Bikson, Su, & Parra, 2011; Edwards et al., 2013). This method showed improvement in stimulation localisation, resulting in a more focused current and thus increasing the specificity of the modulated brain region (Edwards et al., 2013; Kuo et al., 2013). In this review, only one study using this HD tDCS was identified. Therefore, exploring the effects of the HD tDCS montage on the neurochemical changes is highly encouraged in future research.
It would also be valuable to further investigate the effect of tDCS on the neurometabolites with respect to the therapeutic purposes in different neurological and psychiatric diseases (Datta, Baker, Bikson, & Fridriksson, 2011; Fregni & Pascual‐Leone, 2007; Kuo, Paulus, & Nitsche, 2014; Nitsche, Boggio, Fregni, & Pascual‐Leone, 2009). As seen in the reviewed studies, the neurochemical modulation signature may be different in pathologies compared to the healthy population, as well as in children and the elderly.
Studying the brain functions, behaviour and brain glucose uptake using tDCS in combination with simultaneously operating, multi‐imaging modalities, such as MR‐PET, is also of great interest and importance for the future (Fonteneau et al., 2018; Fukai et al., 2019; Kraus et al., 2020; Sanches et al., 2019).
5. CONCLUSIONS
In conclusion, this systematic review includes studies investigating the tDCS neuromodulatory effects on human neurometabolites, as measured by MRS, in different regions of the human brain. We began by thoroughly discussing the methodological structure of the tDCS and MRS protocols, and reported the results as a function of each parameter, for example, the montage of tDCS or stimulated target brain regions. Based on this work, we reviewed the existing knowledge, as well as the pitfalls and the gaps highlighted by studies using a combination of tDCS and MRS to understand the underlying biochemical and physiological mechanism of the human brain.
In relation to the anodal and cathodal effects, the majority of studies were carried out using anodal tDCS placed on the left M1 and investigated GABA changes and energy metabolism (via ATP and PCr). The results of the studies showed a trend towards decreased GABA concentration and bipolar behaviour (decrease and increase) for ATP and PCr following stimulation. It is generally assumed that the decreased GABA concentration goes along with the increased firing rate of neurons and readiness of plastic changes. Despite being based on results from a single or limited study in a healthy cohort, the following effects on other neurometabolites have also been observed: the mI level increased with anodal tDCS applied on the right M1, Glu and Glx also increased under anodal stimulation of the right temporal cortex and right IPS. Pi measured in the left DLPFC was also shown to be decreased. Unlike the anodal tDCS, only a small number of studies have been conducted showing that not only the cathodal tDCS can reduce GABA in the left M1, but also it did not influence GABA and remained the same. Based on the results from the literature outlined in this review paper, cathodal tDCS produced no other significant effects in healthy subjects. However, it should be noted that the results associated with the effects of cathodal tDCS require further investigation due to the paucity of published data.
Due to the heterogeneity of the data (e.g., different pathological conditions, stimulated regions and metabolites being investigated), a direct comparison between healthy and clinical populations was not possible. Nevertheless, independent from the results stated above, we also compared our collection of results relating to the healthy cohorts used in this review paper to the patient group. Based on this, we were able to abstract the following conclusions. Some pathologies, such as neuropathic pain and cerebral palsy are likely to follow a trend of decreased GABA and increased Glx/Cr (Auvichayapat et al., 2017, 2018) as a result of the anodal tDCS modulation (left M1), whereas, in our database of healthy volunteers, Glx concentration in most studies remained unchanged after anodal modulation. Conversely, in other pathologies, such as obesity and migraine, tDCS modulation was blunted, compared to the healthy cohorts. Therefore, we recommend that carefully designed tDCS and MRS protocols be used for future studies, and that neurometabolites in different brain regions should be investigated—ideally simultaneously. We believe this could further inform our understanding of dedicated brain functions and neural processes.
CONFLICT OF INTEREST
The authors declare no conflicts of interest.
ACKNOWLEDGMENT
The authors thank the corresponding authors of studies used in this review for providing missing data and Ms Rick for English proofreading. Open Access funding enabled and organized by Projekt DEAL.
Choi C‐H, Iordanishvili E, Shah NJ, Binkofski F. Magnetic resonance spectroscopy with transcranial direct current stimulation to explore the underlying biochemical and physiological mechanism of the human brain: A systematic review. Hum Brain Mapp. 2021;42:2642–2671. 10.1002/hbm.25388
Chang‐Hoon Choi and Elene Iordanishvili contributed equally to this work as a first author.
Contributor Information
Elene Iordanishvili, Email: eiordanishvi@ukaachen.de.
Ferdinand Binkofski, Email: fbinkofski@ukaachen.de.
DATA AVAILABILITY STATEMENT
Data sharing is not applicable to this article as no new data were created or analyzed in this study.
REFERENCES
- Andreychenko, A. , Boer, V. O. , de Castro, C. S. A. , Luijten, P. R. , & Klomp, D. W. J. (2012). Efficient spectral editing at 7 T: GABA detection with MEGA‐sLASER. Magnetic Resonance in Medicine, 68, 1018–1025. [DOI] [PubMed] [Google Scholar]
- Antonenko, D. , Schubert, F. , Bohm, F. , Ittermann, B. , Aydin, S. , Hayek, D. , … Flöel, A. (2017). tDCS‐induced modulation of GABA levels and resting‐state functional connectivity in older adults. The Journal of Neuroscience, 37, 4065–4073. [DOI] [PMC free article] [PubMed] [Google Scholar]
- Antonenko, D. , Thielscher, A. , Saturnino, G. B. , Aydin, S. , Ittermann, B. , Grittner, U. , & Flöel, A. (2019). Towards precise brain stimulation: Is electric field simulation related to neuromodulation? Brain Stimulation, 12, 1159–1168. [DOI] [PubMed] [Google Scholar]
- Archibald, J. , MacMillan, E. L. , Enzler, A. , Jutzeler, C. R. , Schweinhardt, P. , & Kramer, J. L. K. (2020). Excitatory and inhibitory responses in the brain to experimental pain: A systematic review of MR spectroscopy studies. NeuroImage, 215, 116794. [DOI] [PubMed] [Google Scholar]
- Auvichayapat, P. , Aree‐Uea, B. , Auvichayapat, N. , Phuttharak, W. , Janyacharoen, T. , Tunkamnerdthai, O. , … Keeratitanont, K. (2017). Transient changes in brain metabolites after transcranial direct current stimulation in spastic cerebral palsy: A pilot study. Frontiers in Neurology, 8, 366. [DOI] [PMC free article] [PubMed] [Google Scholar]
- Auvichayapat, P. , Keeratitanont, K. , Janyacharoen, T. , & Auvichayapat, N. (2018). The effects of transcranial direct current stimulation on metabolite changes at the anterior cingulate cortex in neuropathic pain: A pilot study. Journal of Pain Research, 11, 2301–2309. [DOI] [PMC free article] [PubMed] [Google Scholar]
- Bachtiar, V. , Johnstone, A. , Berrington, A. , Lemke, C. , Johansen‐Berg, H. , Emir, U. , & Stagg, C. J. (2018). Modulating regional motor cortical excitability with noninvasive brain stimulation results in neurochemical changes in bilateral motor cortices. The Journal of Neuroscience, 38, 7327–7336. [DOI] [PMC free article] [PubMed] [Google Scholar]
- Bachtiar, V. , Near, J. , Johansen‐Berg, H. , & Stagg, C. J. (2015). Modulation of GABA and resting state functional connectivity by transcranial direct current stimulation. eLife, 4, e08789. [DOI] [PMC free article] [PubMed] [Google Scholar]
- Barron, H. C. , Vogels, T. P. , Emir, U. E. , Makin, T. R. , O'Shea, J. , Clare, S. , … Behrens, T. E. J. (2016). Unmasking latent inhibitory connections in human cortex to reveal dormant cortical memories. Neuron, 90, 191–203. [DOI] [PMC free article] [PubMed] [Google Scholar]
- Baslow, M. H. (2003). N‐acetylaspartate in the vertebrate brain: Metabolism and function. Neurochemical Research, 28, 941–953. [DOI] [PubMed] [Google Scholar]
- Benninger, D. H. , & Hallett, M. (2015). Non‐invasive brain stimulation for Parkinson's disease: Current concepts and outlook 2015. NeuroRehabilitation, 37, 11–24. [DOI] [PubMed] [Google Scholar]
- Bikson, M. , Esmaeilpour, Z. , Adair, D. , Kronberg, G. , Tyler, W. J. , Antal, A. , … Peterchev, A. V. (2019). Transcranial electrical stimulation nomenclature. Brain Stimulation, 12, 1349–1366. [DOI] [PMC free article] [PubMed] [Google Scholar]
- Bikson, M. , Grossman, P. , Thomas, C. , Zannou, A. L., Jiang, J., … Woods, A.J. (2016). Safety of transcranial direct current stimulation: Evidence based update 2016. Brain Stimulation, 9, 641–661. [DOI] [PMC free article] [PubMed] [Google Scholar]
- Bikson, M. , Inoue, M. , Akiyama, H. , Deans, J. K. , Fox, J. E. , Miyakawa, H. , & Jefferys, J. G. (2004). Effects of uniform extracellular DC electric fields on excitability in rat hippocampal slices in vitro. The Journal of Physiology, 15, 175–190. [DOI] [PMC free article] [PubMed] [Google Scholar]
- Bikson, M. , & Rahman, A. (2013). Origins of specificity during tDCS: Anatomical, activity‐selective, and input‐bias mechanisms. Frontiers in Human Neuroscience, 7, 1–5. [DOI] [PMC free article] [PubMed] [Google Scholar]
- Binkofski, F. , Loebig, M. , Jauch‐Chara, K. , Bergmann, S. , Melchert, U. H. , Scholand‐Engler, H. G. , … Oltmanns, K. M. (2011). Brain energy consumption induced by electrical stimulation promotes systemic glucose uptake. Biological Psychiatry, 70, 690–695. [DOI] [PubMed] [Google Scholar]
- Brunelin, J. , Mondino, M. , Gassab, L. , Haesebaert, F. , Gaha, L. , Suaud‐Chagny, M. F. , … Poulet, E. (2012). Examining transcranial direct‐current stimulation (tDCS) as a treatment for hallucinations in schizophrenia. The American Journal of Psychiatry, 169, 719–724. [DOI] [PubMed] [Google Scholar]
- Brunoni, A. R. , Amadera, J. , Berbel, B. , Volz, M. S. , Rizzerio, B. G. , & Fregni, F. (2011). A systematic review on reporting and assessment of adverse effects associated with transcranial direct current stimulation. International Journal of Neuropsychopharmacology, 14(8), 1133–1145. [DOI] [PubMed] [Google Scholar]
- Brunoni, A. R. , Moffa, A. H. , Fregni, F. , Palm, U. , Padberg, F. , Blumberger, D. M. , … Loo, C. K. (2016). Transcranial direct current stimulation for acute major depressive episodes: Meta‐analysis of individual patient data. The British Journal of Psychiatry, 208, 522–531. [DOI] [PMC free article] [PubMed] [Google Scholar]
- Carlson, H. L. , Ciechanski, P. , Harris, A. D. , MacMaster, F. P. , & Kirton, A. (2018). Changes in spectroscopic biomarkers after transcranial direct current stimulation in children with perinatal stroke. Brain Stimulation, 11, 94–103. [DOI] [PubMed] [Google Scholar]
- Chiappelli, J. , Rowland, L. M. , Wijtenburg, S. A. , Chen, H. , Maudsley, A. A. , & Sheriff, S. (2019). Cardiovascular risks impact human brain N‐acetylaspartate in regionally specific patterns.. Proceedings of the National Academy of Sciences of the United States of America, 117, 25243–25249. 10.1073/pnas.1907730116. [DOI] [PMC free article] [PubMed] [Google Scholar]
- Clark, V. P. , Coffman, B. A. , Trumbo, M. C. , & Gasparovic, C. (2011). Transcranial direct current stimulation (tDCS) produces localized and specific alterations in neurochemistry: A 1H magnetic resonance spectroscopy study. Neuroscience Letters, 500, 67–71. [DOI] [PubMed] [Google Scholar]
- Cleeland, C. , Pipingas, A. , Scholey, A. , & White, D. (2019). Neurochemical changes in the aging brain: A systematic review. Neuroscience & Biobehavioral Reviews, 98, 306–319. [DOI] [PubMed] [Google Scholar]
- Creutzfeldt, O. D. , Fromm, G. H. , & Kapp, H. (1962). Influence of transcortical d‐c currents on cortical neuronal activity. Experimental Neurology, 5, 436–452. [DOI] [PubMed] [Google Scholar]
- Cuzzocreo, J. L. , Yassa, M. A. , Verduzco, G. , Honeycutt, N. A. , Scott, D. J. , & Bassett, S. S. (2009). Effect of handness on fMRI activation in the medial temporal lobe during an auditory verbal memory task. Human Brain Mapping, 30, 1271–1278. [DOI] [PMC free article] [PubMed] [Google Scholar]
- da Silva, A. F. , Volz, M. S. , Bikson, M. , & Fregni, F. (2011). Electrode positioning and montage in Transcranial direct current stimulation. JoVE, 51, e2744. [DOI] [PMC free article] [PubMed] [Google Scholar]
- Datta, A. , Baker, J. M. , Bikson, M. , & Fridriksson, J. (2011). Individualized model predicts brain current flow during transcranial direct‐current stimulation treatment in responsive stroke patient. Brain Stimulation, 4, 169–174. [DOI] [PMC free article] [PubMed] [Google Scholar]
- Datta, A. , Elwassif, M. , Bansal, V. , Diaz, J. , Battaglia, F. , & Bikson, M. (2008). A system and device for focal transcranial direct current stimulation using concentric ring electrode configurations. Brain Stimulation: Basic, Translational, and Clinical Research in Neuromodulation, 1, 318. [Google Scholar]
- Dezortova, M. , & Hajek, M. (2008). 1H MR spectroscopy in pediatrics. European Journal of radiology, 67, 240–249. 10.1016/j.ejrad.2008.02.035. [DOI] [PubMed] [Google Scholar]
- di Lazzaro, V. , & Ziemann, U. (2013). The contribution of transcranial magnetic stimulation in the functional evaluation of microcircuits in human motor cortex. Frontiers in Neural Circuits, 7, 7–18. [DOI] [PMC free article] [PubMed] [Google Scholar]
- Dickler, M. , Lenglos, C. , Renauld, E. , Ferland, F. , Edden, R. A. , Leblond, J. , & Fecteau, S. (2018). Online effects of transcranial direct current stimulation on prefrontal metabolites in gambling disorder. Neuropharmacology, 131, 51–57. [DOI] [PubMed] [Google Scholar]
- Dmochowski, J. P. , Datta, A. , Bikson, M. , Su, Y. , & Parra, L. C. (2011). Optimized multi‐electrode stimulation increases focality and intensity at target. Journal of Neural Engineering, 8, 046011. [DOI] [PubMed] [Google Scholar]
- Du, F. , Zhu, X.‐H. , Zhang, Y. , Friedman, M. , Zhang, N. , Uğurbil, K. , & Chen, W. (2008). Tightly coupled brain activity and cerebral ATP metabolic rate. PNAS, 105, 6409–6414. [DOI] [PMC free article] [PubMed] [Google Scholar]
- Dwyer, G. E. , Craven, A. R. , Hirnstein, M. , Kompus, K. , Assmus, J. , Ersland, L. , … Grüner, R. (2019). No effects of anodal tDCS on local GABA and Glx levels in the left posterior superior temporal gyrus. Frontiers in Neurology, 9, 1145. [DOI] [PMC free article] [PubMed] [Google Scholar]
- Edwards, D. , Cortes, M. , Datta, A. , Minhas, P. , Wassermann, E. M. , & Bikson, M. (2013). Physiological and modeling evidence for focal transcranial electrical brain stimulation in humans: A basis for high‐definition tDCS. NeuroImage, 74, 266–275. [DOI] [PMC free article] [PubMed] [Google Scholar]
- Esmaeilpour, Z. , Marangolo, P. , Hampstead, B. M. , Bestmann, S. , Galletta, E. , Knotkova, H. , & Bikson, M. (2018). Incomplete evidence that increasing current intensity of tDCS boosts outcomes. Brain Stimulation, 11, 310–321. [DOI] [PMC free article] [PubMed] [Google Scholar]
- Foerster, B. R. , Nascimento, T. D. , DeBoer, M. , Bender, M. A. , Rice, I. C. , Truong, D. Q. , … DaSilva, A. F. (2015). Brief report: Excitatory and inhibitory brain metabolites as targets of motor cortex transcranial direct current stimulation therapy and predictors of its efficacy in fibromyalgia. Arthritis & Rheumatology, 67, 576–581. [DOI] [PMC free article] [PubMed] [Google Scholar]
- Fonteneau, C. , Redoute, J. , Haesebaert, F. , le Bars, D. , Costes, N. , Suaud‐Chagny, M.‐F. , & Brunelin, J. (2018). Frontal transcranial direct current stimulation induces dopamine release in the ventral striatum in human. Cerebral Cortex, 28, 2636–2646. [DOI] [PMC free article] [PubMed] [Google Scholar]
- Fregni, F. , & Pascual‐Leone, A. (2007). Technology insight: Noninvasive brain stimulation in neurology—Perspectives on the therapeutic potential of rTMS and tDCS. Nature Clinical Practice. Neurology, 3, 383–393. [DOI] [PubMed] [Google Scholar]
- Fritsch, B. , Reis, J. , Martinowich, K. , Schambra, H. M. , Ji, Y. , Cohen, L. G. , & Lu, B. (2010). Direct current stimulation promotes BDNF‐dependent synaptic plasticity: Potential implications for motor learning. Neuron, 66, 198–204. [DOI] [PMC free article] [PubMed] [Google Scholar]
- Fukai, M. , Bunai, T. , Hirosawa, T. , Kikuchi, M. , Ito, S. , Minabe, Y. , & Ouchi, Y. (2019). Endogenous dopamine release under transcranial direct‐current stimulation governs enhanced attention: A study with positron emission tomography. Translational Psychiatry, 9, 1–10. [DOI] [PMC free article] [PubMed] [Google Scholar]
- Giordano, J. , Bikson, M. , Kappenman, E. S. , Clark, V. P. , Coslett, H. B. , Hamblin, M. R. , … Calabrese, E. (2017). Mechanisms and effects of transcranial direct current stimulation. Dose‐Response, 15. [DOI] [PMC free article] [PubMed] [Google Scholar]
- Harris, A. D. , Wang, Z. , Ficek, B. , Webster, K. , Edden, R. A. E. , & Tsapkini, K. (2019). Reductions in GABA following a tDCS‐language intervention for primary progressive aphasia. Neurobiology of Aging, 79, 75–82. [DOI] [PMC free article] [PubMed] [Google Scholar]
- Hebb, D. O. (1949). The organization of behavior; a neuropsychological theory. New York, NY: Wiley. [Google Scholar]
- Henning, A. (2018). Proton and multinuclear magnetic resonance spectroscopy in the human brain at ultra‐high field strength: A review. NeuroImage, 168, 181–198. [DOI] [PubMed] [Google Scholar]
- Higgins, J. P. T. , Thomas, J. , Chandler, J. , Cumpston, M. , Li, T. , Page, M. J. , & Welch, V. A. (2019). Cochrane handbook for systematic reviews of interventions (2nd ed.). Glasgow, England: Wiley Blackwell. [Google Scholar]
- Hone‐Blanchet, A. , Edden, R. A. , & Fecteau, S. (2016). Online effects of transcranial direct current stimulation in real time on human prefrontal and striatal metabolites. Biological Psychiatry, 80, 432–438. [DOI] [PMC free article] [PubMed] [Google Scholar]
- Jalali, R. , Chowdhury, A. , Wilson, M. , Miall, R. C. , & Galea, J. M. (2018). Neural changes associated with cerebellar tDCS studied using MR spectroscopy. Experimental Brain Research, 236, 997–1006. [DOI] [PMC free article] [PubMed] [Google Scholar]
- Jauch‐Chara, K. , Binkofski, F. , Loebig, M. , Reetz, K. , Jahn, G. , Melchert, U. H. , … Oltmanns, K. M. (2015). Blunted brain energy consumption relates to insula atrophy and impaired glucose tolerance in obesity. Diabetes, 64, 2082–2091. [DOI] [PubMed] [Google Scholar]
- Kalu, U. G. , Sexton, C. E. , Loo, C. K. , & Ebmeier, K. P. (2012). Transcranial direct current stimulation in the treatment of major depression: A meta‐analysis. Psychological Medicine, 42, 1791–1800. [DOI] [PubMed] [Google Scholar]
- Kim, S. , Stephenson, M. C. , Morris, P. G. , & Jackson, S. R. (2014). tDCS‐induced alterations in GABA concentration within primary motor cortex predict motor learning and motor memory: A 7T magnetic resonance spectroscopy study. NeuroImage, 99, 237–243. [DOI] [PMC free article] [PubMed] [Google Scholar]
- Kistenmacher, A. , Manneck, S. , Wardzinski, E. K. , Martens, J. C. , Gohla, G. , Melchert, U. H. , … Oltmanns, K. M. (2017). Persistent blood glucose reduction upon repeated transcranial electric stimulation in men. Brain Stimulation, 10, 780–786. [DOI] [PubMed] [Google Scholar]
- Knechtel, L. , Schall, U. , Cooper, G. , Ramadan, S. , Stanwell, P. , Jolly, T. , & Thienel, R. (2014). Transcranial direct current stimulation of prefrontal cortex: An auditory event‐related potential and proton magnetic resonance spectroscopy study. Neurology, Psychiatry and Brain Research, 20, 96–101. [Google Scholar]
- Koolschijn, R. S. , Emir, U. E. , Pantelides, A. C. , Nili, H. , Behrens, T. E. J. , & Barron, H. C. (2019). The hippocampus and neocortical inhibitory engrams protect against memory interference. Neuron, 101, 528–541.e6. [DOI] [PMC free article] [PubMed] [Google Scholar]
- Kraus, C. , Hahn, A. , Sigurdardottir, H. , Spurny, B. , Wadsak, W. , Mitterhauser, M. , … Lanzenberger, R. (2020). Brain glucose uptake during transcranial direct current stimulation measured with functional [18F]FDG‐PET. Brain Imaging and Behavior, 14, 477–484. [DOI] [PMC free article] [PubMed] [Google Scholar]
- Krause, B. , Márquez‐Ruiz, J. , & Cohen Kadosh, R. (2013). The effect of transcranial direct current stimulation: A role for cortical excitation/inhibition balance? Frontiers in Human Neuroscience, 7, 602. [DOI] [PMC free article] [PubMed] [Google Scholar]
- Kuo, H.‐I. , Bikson, M. , Datta, A. , Minhas, P. , Paulus, W. , Kuo, M.‐F. , & Nitsche, M. A. (2013). Comparing cortical plasticity induced by conventional and high‐definition 4 × 1 ring tDCS: A neurophysiological study. Brain Stimulation, 6, 644–648. [DOI] [PubMed] [Google Scholar]
- Kuo, M.‐F. , Paulus, W. , & Nitsche, M. A. (2014). Therapeutic effects of non‐invasive brain stimulation with direct currents (tDCS) in neuropsychiatric diseases. NeuroImage, 85, 948–960. [DOI] [PubMed] [Google Scholar]
- Lei, H. , Zhu, X.‐H. , Zhang, X.‐L. , Ugurbil, K. , & Chen, W. (2003). In vivo 31P magnetic resonance spectroscopy of human brain at 7 T: An initial experience. Magnetic Resonance in Medicine, 49, 199–205. [DOI] [PubMed] [Google Scholar]
- Li, Y. , Sun, H. , Chen, Z. , Xu, H. , Bu, G. , & Zheng, H. (2016). Implications of GABAergic neurotransmission in Alzheimer's disease. Frontiers in Aging Neuroscience, 8, 31. [DOI] [PMC free article] [PubMed] [Google Scholar]
- Mancuso, L. E. , Ilieva, I. P. , Hamilton, R. H. , & Farah, M. J. (2016). Does Transcranial direct current stimulation improve healthy working memory?: A meta‐analytic review. Journal of Cognitive Neuroscience, 28, 1063–1089. [DOI] [PubMed] [Google Scholar]
- Mayseless, N. , & Shamay‐Tsoory, S. G. (2015). Enhancing verbal creativity: Modulating creativity by altering the balance between right and left inferior frontal gyrus with tDCS. Neuroscience, 291, 167–176. [DOI] [PubMed] [Google Scholar]
- McGuinness, L. A. , & Higgins, J. P. T. (2020). Risk‐of‐bias VISualization (robvis): An R package and shiny web app for visualizing risk‐of‐bias assessments. Research Synthesis Methods, 12, 55–61. [DOI] [PubMed] [Google Scholar]
- Mescher, M. , Merkle, H. , Kirsch, J. , Garwood, M. , & Gruetter, R. (1998). Simultaneous in vivo spectral editing and water suppression. NMR in Biomedicine, 11, 7. [DOI] [PubMed] [Google Scholar]
- Mikkelsen, M. , Barker, P. B. , Bhattacharyya, P. K. , Bhattacharyya, P. K. , Brix, M. K. , Buur, P. F. , … Edden, R. A. E. (2017). Big GABA: Edited MR spectroscopy at 24 research sites. NeuroImage, 159, 32–45. [DOI] [PMC free article] [PubMed] [Google Scholar]
- Mikkelsen, M. , Rimbault, D. L. , Barker, P. B. , Bhattacharyya, P. K. , Brix, M. K. , Buur, P. F. , … Edden, R. A. E. (2019). Big GABA II: Water‐referenced edited MR spectroscopy at 25 research sites. NeuroImage, 191, 537–548. [DOI] [PMC free article] [PubMed] [Google Scholar]
- Moher, D. , Shamseer, L. , Clarke, M. , Ghersi, D. , Liberati, A. , Petticrew, M. , … Stewart, L. A. (2015). PRISMA‐P group, preferred reporting items for systematic review and meta‐analysis protocols (PRISMA‐P) 2015 statement. Systematic Reviews, 1, 1. [DOI] [PMC free article] [PubMed] [Google Scholar]
- Monte Ferreira, F. R. , Nogueira, M. I. , & de Felipe, J. (2014). The influence of James and Darwin on Cajal and his research into the neuron theory and evolution of the nervous system. Frontiers in Neuroanatomy, 8, 1–9. [DOI] [PMC free article] [PubMed] [Google Scholar]
- Monte‐Silva, K. , Kuo, M.‐F. , Hessenthaler, S. , Fresnoza, S. , Liebetanz, D. , Paulus, W. , & Nitsche, M. A. (2013). Induction of late LTP‐like plasticity in the human motor cortex by repeated non‐invasive brain stimulation. Brain Stimulation, 6, 424–432. [DOI] [PubMed] [Google Scholar]
- Mullins, P. G. , McGonigle, D. J. , O'Gorman, R. L. , Puts, N. A. J. , Vidyasagar, R. , Evans, C. J. , & Edden, R. A. E. (2014). Current practice in the use of MEGA‐PRESS spectroscopy for the detection of GABA. NeuroImage, 86, 43–52. [DOI] [PMC free article] [PubMed] [Google Scholar]
- Naressi, A. , Couturier, C. , Devos, J. M. , Janssen, M. , Mangeat, C. , de Beer, R. , & Graveron‐Demilly, D. (2001). Java‐based graphical user interface for the MRUI quantitation package. Magma, 12, 141–152. [DOI] [PubMed] [Google Scholar]
- Nava‐Mesa, M. O. , Jiménez‐Díaz, L. , Yajeya, J. , & Navarro‐Lopez, J. D. (2014). GABAergic neurotransmission and new strategies of neuromodulation to compensate synaptic dysfunction in early stages of Alzheimer's disease. Frontiers in Cellular Neuroscience, 8, 1–19. [DOI] [PMC free article] [PubMed] [Google Scholar]
- Nitsche, M. A. , Boggio, P. S. , Fregni, F. , & Pascual‐Leone, A. (2009). Treatment of depression with transcranial direct current stimulation (tDCS): A review. Experimental Neurology, Brain Stimulation in Psychiatry, 219, 14–19. [DOI] [PubMed] [Google Scholar]
- Nitsche, M. A. , Cohen, L. G. , Wassermann, E. M. , Priori, A. , Lang, N. , Antal, A. , … Pascual‐Leone, A. (2008). Transcranial direct current stimulation: State of the art. Brain Stimulation, 1, 206–223. [DOI] [PubMed] [Google Scholar]
- Nitsche, M. A. , Fricke, K. , Henschke, U. , Schlitterlau, A. , Liebetanz, D. , Lang, N. , … Paulus, W. (2003). Pharmacological modulation of cortical excitability shifts induced by Transcranial direct current stimulation in humans. The Journal of Physiology, 553, 293–301. [DOI] [PMC free article] [PubMed] [Google Scholar]
- Nitsche, M. A. , & Paulus, W. (2000). Excitability changes induced in the human motor cortex by weak transcranial direct current stimulation. The Journal of Physiology, 527, 633–639. [DOI] [PMC free article] [PubMed] [Google Scholar]
- Nitsche, M. A. , & Paulus, W. (2001). Sustained excitability elevations induced by transcranial DC motor cortex stimulation in humans. Neurology, 27, 1899–1901. [DOI] [PubMed] [Google Scholar]
- Nwaroh, C. , Giuffre, A. , Cole, L. , Bell, T. , Carlson, H. L. , MacMaster, F. P. , … Harris, A. D. (2020). Effects of transcranial direct current stimulation on GABA and Glx in children: A pilot study. PLoS One, 15, e0222620. [DOI] [PMC free article] [PubMed] [Google Scholar]
- O'Shea, J. , Revol, P. , Cousijn, H. , Near, J. , Petitet, P. , Jacquin‐Courtois, S. , … Rossetti, Y. (2017). Induced sensorimotor cortex plasticity remediates chronic treatment‐resistant visual neglect. eLife, 6, e26602. [DOI] [PMC free article] [PubMed] [Google Scholar]
- Patel, H. J. , Romanzetti, S. , Pellicano, A. , Nitsche, M. A. , Reetz, K. , & Binkofski, F. (2019). Proton magnetic resonance spectroscopy of the motor cortex reveals long term GABA change following anodal transcranial direct current stimulation. Scientific Reports, 9, 2807. [DOI] [PMC free article] [PubMed] [Google Scholar]
- Paulus, W. (2011). Transcranial electrical stimulation (tES – tDCS; tRNS, tACS) methods. Neuropsychological Rehabilitation, 21, 602–617. [DOI] [PubMed] [Google Scholar]
- Polania, R. , Nitsche, M. A. , & Ruff, C. C. (2018). Studying and modifying brain function with non‐invasive brain stimulation. Nature Neuroscience, 21, 174–187. [DOI] [PubMed] [Google Scholar]
- Priori, A. , Berardelli, A. , Rona, S. , Accornero, N. , & Manfredi, M. (1998). Polarization of the human motor cortex through the scalp. Neuroreport, 9, 2257–2260. [DOI] [PubMed] [Google Scholar]
- Provencher, S. W. (1993). Estimation of metabolite concentrations from localized in vivo proton NMR spectra. Magnetic Resonance in Medicine, 30, 672–679. [DOI] [PubMed] [Google Scholar]
- Provencher, S. W. (2001). Automatic quantitation of localized in vivo 1H spectra with LCModel. NMR in Biomedicine, 14, 260–264. [DOI] [PubMed] [Google Scholar]
- Purpura, D. P. , & McMurtry, J. G. (1965). Intracellular activities and evoked potential changes during polarization of motor cortex. Journal of Neurophysiology, 28, 166–185. [DOI] [PubMed] [Google Scholar]
- Rackayova, V. , Cudalbu, C. , Pouwels, P. J. W. , & Braissant, O. (2017). Creatine in the central nervous system: From magnetic resonance spectroscopy to creatine deficiencies. Analytical Biochemistry, 529, 144–157. [DOI] [PubMed] [Google Scholar]
- Radman, T. , Ramos, R. L. , Brumberg, J. C. , & Bikson, M. (2009). Role of cortical cell type and morphology in subthreshold and suprathreshold uniform electric field stimulation in vitro. Brain Stimulation, 2, 215–228.e3. [DOI] [PMC free article] [PubMed] [Google Scholar]
- Rae, C. D. (2014). A guide to the metabolic pathways and function of metabolites observed in human brain 1H magnetic resonance spectra. Neurochemical Research, 39, 1–36. [DOI] [PubMed] [Google Scholar]
- Rae, C. D. , Lee, V. H.‐C. , Ordidge, R. J. , Alonzo, A. , & Loo, C. (2013). Anodal transcranial direct current stimulation increases brain intracellular pH and modulates bioenergetics. International Journal of Neuropsychopharmacology, 16, 1695–1706. [DOI] [PubMed] [Google Scholar]
- Rahman, A. , Reato, D. , Arlotti, M. , Gasca, F. , Datta, A. , Parra, L. C. , & Bikson, M. (2013). Cellular effects of acute direct current stimulation: Somatic and synaptic terminal effects. The Journal of Physiology, 591, 2563–2578. [DOI] [PMC free article] [PubMed] [Google Scholar]
- Rango, M. , Cogiamanian, F. , Marceglia, S. , Barberis, B. , Arighi, A. , Biondetti, P. , & Priori, A. (2008). Myoinositol content in the human brain is modified by transcranial direct current stimulation in a matter of minutes: A 1 H‐MRS study. Magnetic Resonance in Medicine, 60, 782–789. [DOI] [PubMed] [Google Scholar]
- Regner, G. G. , Pereira, P. , Leffa, D. T. , de Oliveira, C. , Vercelino, R. , Fregni, F. , & Torres, I. L. S. (2018). Preclinical to clinical translation of studies of transcranial direct‐current stimulation in the treatment of epilepsy: A systematic review. Frontiers in Neuroscience, 12, 1–13. [DOI] [PMC free article] [PubMed] [Google Scholar]
- Ren, J. , Sherry, A. D. , & Malloy, C. R. (2015). 31P‐MRS of healthy human brain: ATP synthesis, metabolite concentrations, pH, and T1 relaxation times. NMR in Biomedicine, 28, 1455–1462. [DOI] [PMC free article] [PubMed] [Google Scholar]
- Ryan, K. , Wawrzyn, K. , Gati, J. S. , Chronik, B. A. , Wong, D. , Duggal, N. , & Bartha, R. (2018). 1H MR spectroscopy of the motor cortex immediately following transcranial direct current stimulation at 7 tesla. PLoS One, 13, e0198053. [DOI] [PMC free article] [PubMed] [Google Scholar]
- Salem, D. B. , Walker, P. M. , Bejot, Y. , Aho, S. L. , Tavernier, B. , Rouaud, O. , … Brunotte, F. (2008). N‐acetylaspartate/creatine and choline/creatine ratios in the thalami, insular cortex and white matter as markers of hypertension and cognitive impairment in the elderly. Hypertension Research, 31, 1851–1857. [DOI] [PubMed] [Google Scholar]
- Sanches, C. , Levy, R. , Benisty, S. , Volpe‐Gillot, L. , Habert, M. O. , Kas, A. , … Teichmann, M. (2019). Testing the therapeutic effects of transcranial direct current stimulation (tDCS) in semantic dementia: A double blind, sham controlled, randomized clinical trial. Trials, 20, 632. [DOI] [PMC free article] [PubMed] [Google Scholar]
- Scheenen, T. W. J. , Klomp, D. W. J. , Wijnen, J. P. , & Heerschap, A. (2008). Short echo time 1H‐MRSI of the human brain at 3T with minimal chemical shift displacement errors using adiabatic refocusing pulses. Magnetic Resonance in Medicine, 59, 1–6. [DOI] [PubMed] [Google Scholar]
- Sheldon, A. L. , & Robinson, M. B. (2007). The role of glutamate transporters in neurodegenerative diseases and potential opportunities for intervention. Neurochemistry International, 51, 333–355. [DOI] [PMC free article] [PubMed] [Google Scholar]
- Shiozawa, P. , Fregni, F. , Benseñor, I. M. , Lotufo, P. A. , Berlim, M. T. , Daskalakis, J. Z. , … Brunoni, A. R. (2014). Transcranial direct current stimulation for major depression: An updated systematic review and meta‐analysis. International Journal of Neuropsychopharmacology, 17, 1443–1452. [DOI] [PubMed] [Google Scholar]
- Siniatchkin, M. , Sendacki, M. , Moeller, F. , Wolff, S. , Jansen, O. , Siebner, H. , & Stephani, U. (2012). Abnormal changes of synaptic excitability in migraine with aura. Cerebral Cortex, 22, 2207–2216. [DOI] [PubMed] [Google Scholar]
- Stagg, C. J. , Best, J. G. , Stephenson, M. C. , O'Shea, J. , Wylezinska, M. , Kincses, Z. T. , … Johansen‐Berg, H. (2009). Polarity‐sensitive modulation of cortical neurotransmitters by transcranial stimulation. The Journal of Neuroscience, 29, 5202–5206. [DOI] [PMC free article] [PubMed] [Google Scholar]
- Stagg Charlotte J., Bachtiar Velicia, Johansen‐Berg Heidi (2011). The Role of GABA in Human Motor Learning. Current Biology, 21(6), 480–484. [DOI] [PMC free article] [PubMed] [Google Scholar]
- Stagg, C. J. , & Johansen‐Berg, H. (2013). Studying the effects of transcranial direct‐current stimulation in stroke recovery using magnetic resonance imaging. Frontiers in Human Neuroscience, 7, 1–8. [DOI] [PMC free article] [PubMed] [Google Scholar]
- Stagg, C. J. , & Nitsche, M. A. (2011). Physiological basis of transcranial direct current stimulation. The Neuroscientist, 17, 37–53. [DOI] [PubMed] [Google Scholar]
- Steinmetz, H. , Volkmann, J. , Jäncke, L. , & Freund, H. J. (1991). Anatomical left‐right asymmetry of language‐related temporal cortex is different in left‐ and right‐handers. Annals of Neurology, 29, 315–319. [DOI] [PubMed] [Google Scholar]
- Terzuolo, C. A. , & Bullock, T. H. (1956). Measurement of imposed voltage gradient adequate to modulate neuronal firing. Proceedings of the National Academy of Sciences of the United States of America, 42, 687–694. [DOI] [PMC free article] [PubMed] [Google Scholar]
- Tremblay, S. , Beaulé, V. , Proulx, S. , Lafleur, L.‐P. , Doyon, J. , Marjańska, M. , & Théoret, H. (2014). The use of magnetic resonance spectroscopy as a tool for the measurement of bi‐hemispheric transcranial electric stimulation effects on primary motor cortex metabolism. JoVE, 93. [DOI] [PMC free article] [PubMed] [Google Scholar]
- Tremblay, S. , Lafleur, L.‐P. , Proulx, S. , Beaulé, V. , Latulipe‐Loiselle, A. , Doyon, J. , … Théoret, H. (2016). The effects of bi‐hemispheric M1‐M1 transcranial direct current stimulation on primary motor cortex neurophysiology and metabolite concentration. Restorative Neurology and Neuroscience, 34, 587–602. [DOI] [PMC free article] [PubMed] [Google Scholar]
- Vanhamme, L. , van den Boogaart, A. , & van Huffel, S. (1997). Improved method for accurate and efficient quantification of MRS data with use of prior knowledge. Journal of Magnetic Resonance, 129, 35–43. [DOI] [PubMed] [Google Scholar]
- Wardzinski, E. K. , Friedrichsen, L. , Dannenberger, S. , Kistenmacher, A. , Melchert, U. H. , Jauch‐Chara, K. , & Oltmanns, K. M. (2019). Double transcranial direct current stimulation of the brain increases cerebral energy levels and systemic glucose tolerance in men. Journal of Neuroendocrinology, 31, e12688. [DOI] [PubMed] [Google Scholar]
- Whitfield‐Gabrieli, S. , & Nieto‐Castanon, A. (2012). Conn: A functional connectivity toolbox for correlated and anticorrelated brain networks. Brain Connectivity, 2, 125–141. [DOI] [PubMed] [Google Scholar]
- Wilke, S. , List, J. , Mekle, R. , Lindenberg, R. , Bukowski, M. , Ott, S. , … Flöel, A. (2017). No effect of anodal transcranial direct current stimulation on gamma‐aminobutyric acid levels in patients with recurrent mild traumatic brain injury. Journal of Neurotrauma, 34, 281–290. [DOI] [PubMed] [Google Scholar]
- Zappasodi, F. , Musumeci, G. , Navarra, R. , di Lazzaro, V. , Caulo, M. , & Uncini, A. (2018). Safety and effects on motor cortex excitability of five cathodal transcranial direct current stimulation sessions in 25 hours. Neurophysiologie Clinique, 48, 77–87. [DOI] [PubMed] [Google Scholar]
Associated Data
This section collects any data citations, data availability statements, or supplementary materials included in this article.
Data Availability Statement
Data sharing is not applicable to this article as no new data were created or analyzed in this study.