

Abstract
Endoplasmic reticulum (ER) calcium (Ca2+) stores are critical to proteostasis, intracellular signaling, and cellular bioenergetics. Through forward genetic screening in mice, we identified two members of a new complex, Pacs1 and Wdr37, which are required for normal ER Ca2+ handling in lymphocytes. Deletion of Pacs1 or Wdr37 caused peripheral lymphopenia that was linked to blunted Ca2+ release from the ER after antigen receptor stimulation. Pacs1‐deficient cells showed diminished inositol triphosphate receptor expression together with increased ER and oxidative stress. Mature Pacs1 −/− B cells proliferated and died in vivo under lymphocyte replete conditions, indicating spontaneous loss of cellular quiescence. Disruption of Pacs1‐Wdr37 did not diminish adaptive immune responses, but potently suppressed lymphoproliferative disease models by forcing loss of quiescence. Thus, Pacs1‐Wdr37 plays a critical role in stabilizing lymphocyte populations through ER Ca2+ handling and presents a new target for lymphoproliferative disease therapy.
Keywords: calcium homeostasis, lymphocyte quiescence, lymphoproliferative disease, Pacs1, Wdr37
Subject Categories: Immunology, Signal Transduction
A forward generic screen identifies the Pacs1‐Wdr37 complex as being required for controlled endoplasmic reticulum Ca2+ handling, and in turn for lymphocyte development and survival in mice.

Introduction
Dynamic flux of calcium ions (Ca2+) between subcellular compartments is required for cell health. Under steady‐state conditions, Ca2+ is sequestered in the extracellular space and within membrane‐bound intracellular stores, the largest of which is the endoplasmic reticulum (ER). The ER Ca2+ store has several distinct roles in maintaining normal cell physiology. First, high concentrations of Ca2+ in the ER enhance the activity of chaperones required for protein folding. Prolonged reduction of ER Ca2+ results in the accumulation of misfolded proteins that triggers ER stress and the unfolded protein response (UPR) (Mekahli et al, 2011). Second, the ER Ca2+ store is a central hub for signal transduction. Transient emptying of ER Ca2+ stores causes the adaptor protein STIM to localize to ER‐plasma membrane junctions where it directly facilitates the opening of cell surface Ca2+ channels (ORAIs) leading to influx of Ca2+ from the extracellular space (Putney, 2009). This mechanism, called store‐operated Ca2+ entry (SOCE), influences multiple downstream signaling pathways to regulate gene expression. Finally, Ca2+ transfer between the ER and mitochondria at mitochondrial associated membranes (MAMs) modulates mitochondrial bioenergetics and susceptibility to apoptotic stimuli (Giorgi et al, 2018). While each tissue has unique requirements for protein synthesis, cell signaling, and mitochondrial function, the mechanisms that match ER Ca2+ handling to specific demands are obscure.
The role of Ca2+ homeostasis in the adaptive immune system is appreciated primarily through the effects of SOCE on lymphocyte activation. Lymphocytes lacking STIM proteins or ORAI channels have defects in proliferation and effector differentiation (Feske et al, 2006; Picard et al, 2009). Patients harboring mutations in these proteins have a severe combined immunodeficiency (SCID) phenotype (Hogan et al, 2010). Much less is known about the role of subcellular Ca2+ homeostasis in the development and maintenance of mature lymphocyte populations. Through forward genetic screening of randomly mutagenized mice, we found that a known cytosolic trafficking protein, phosphofurin acidic cluster sorting protein 1 (Pacs1), is required for the development and survival of circulating lymphocytes due to its role in ER Ca2+ handling.
Pacs1 is a highly conserved 961 amino acid cytosolic protein that facilitates trafficking of cargo between membrane‐bound compartments through binding of phosphorylated acidic cluster motifs (Wan et al, 1998). It was originally identified as a key mediator of furin trafficking to the trans‐Golgi network, but has since been linked to the proper localization of multiple endogenous and viral proteins (Blagoveshchenskaya et al, 2002; Kottgen et al, 2005; Scott et al, 2006; Youker et al, 2009). Pacs1 has four major domains: (i) an initial atrophin‐related region (ARR); (ii) a furin‐binding region (FBR) which binds the phosphorylated acidic cluster motifs on cargo; (iii) a middle region (MR) with auto‐regulatory function; and (iv) a large C‐terminal region (CTR) (Youker et al, 2009). The ARR and CTR domains have unknown functions. Although it is known to be expressed in human peripheral blood leukocytes (Simmen et al, 2005), Pacs1 has no previously defined role in the immune system.
Pacs1 deletion caused impaired ER Ca2+ efflux in B and T cells after antigen receptor stimulation. Pacs1 deletion resulted in decreased IP3R expression while also increasing ER stress, reactive oxygen species (ROS), and sensitivity to oxidative challenge. Interestingly, Pacs1 −/− B cells also showed spontaneous loss of lymphocyte quiescence evidenced by increased proliferation and apoptosis in lymphocyte‐replete environments in vivo. We found that Pacs1 formed a complex with an uncharacterized protein called WD repeat domain protein 37 (Wdr37). Wdr37 deletion imparted B‐ and T‐cell deficiencies with Ca2+ flux defects like Pacs1 deletion. Pacs1 deletion did not impair normal humoral responses, but it strongly blocked lymphoproliferation that resulted from Faslpr mutation and Bcl2 overexpression.
Our work shows that the Pacs1‐Wdr37 complex is important for maintaining peripheral lymphocyte populations through its effects on ER Ca2+ handling and cellular quiescence. We propose that pharmacologic disruption of this complex may be a promising therapy for suppressing lymphoproliferative diseases while preserving beneficial immune functions.
Results
Pacs1 is required for normal numbers of circulating lymphocytes
We performed a forward genetic screen in mice mutagenized with N‐ethyl‐N‐nitrosourea (ENU) to identify genes affecting the proportions of circulating immune cell populations (Wang et al, 2015). Several mice from two pedigrees showed a diminished proportion of B220+ B cells in the peripheral blood. Automated mapping linked homozygous mutations in both pedigrees to separate mutations in Pacs1 using a recessive model of inheritance. The two alleles were named endive (en) and chicory (ccy). The en mutation was a premature stop codon at Y102 of the Pacs1 protein. The ccy allele was a point mutation (D757G) in the CTR that resulted in complete loss of Pacs1 expression (Fig 1A, Appendix Fig S1A).
Figure 1. Pacs1 is required for normal numbers of circulating lymphocytes.
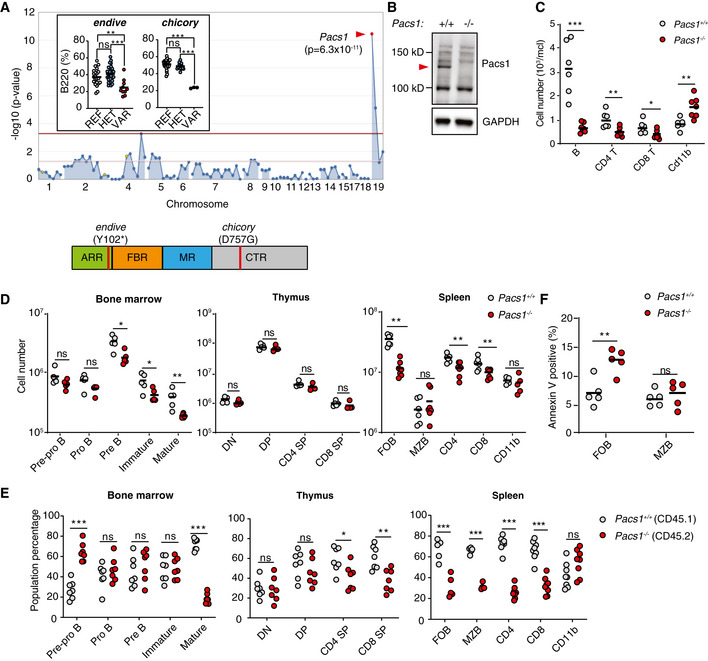
- Super‐pedigree mapping of two mutations in Pacs1 that were linked to peripheral B‐cell deficiency. Insert shows peripheral B cell deficiency in the endive (N = 22 REF, 28 HET, 10 VAR) and chicory (N = 24 REF, 15 HET, 3 VAR) pedigrees. Horizontal bars indicate mean values. Ordinary one‐way ANOVA with Tukey’s multiple comparisons test, ns = not significant, **P < 0.01, and ***P < 0.001. Protein domain model shows the encoded location of the ENU alleles.
- A 1 bp insertion in Pacs1 using CRISPR/Cas9 leads to loss of Pacs1 protein (red arrowhead).
- Peripheral blood immune cell counts from Pacs1 +/+ and Pacs1 −/− mice. Horizontal bars indicate mean values. Two‐tailed unpaired t test, *P < 0.05, **P < 0.01, and ***P < 0.001.
- Absolute numbers of lymphocyte subpopulations in the bone marrow, thymus, and spleen. B cell development in the bone marrow was assessed by FACS analysis for surface expression of: B220+CD43+CD19−IgM−IgD− (pre‐pro B); B220+CD43+CD19+IgM−IgD− (pro B); B220+CD43−CD19+IgM−IgD− (pre B); CD19+IgM+IgD− (immature); CD19+IgM+IgD+ (mature). T cell development in the thymus was assessed by FACS analysis for surface expression of: CD4−CD8− (double negative, DN); CD4+CD8+ (double positive, DP); CD4+CD8− (CD4 single positive, SP); CD4−CD8+ (CD8 SP). Splenocytes were assessed by FACS analysis for surface expression of: B220+CD21+CD23+ (follicular B cells, FOB); B220+CD21+CD23low (marginal zone B cells, MZB); CD4+ and CD8+ T cells; CD11b+ myeloid cells. Each symbol represents an individual mouse. Horizontal bars indicate mean values. Two‐tailed Mann–Whitney test, ns = not significant, *P < 0.05, and **P < 0.01.
- Proportion of cell populations derived from Pacs1 +/+ ; CD45.1 and Pacs1 −/− ; CD45.2 donors during competitive bone marrow reconstitution. Populations were determined based on the same markers as in (D) with the added congenic markers CD45.1 and CD45.2. Each symbol represents an individual recipient. Results are representative of two independent transplant experiments. Two‐tailed unpaired t test, ns = not significant, *P < 0.05, **P < 0.01, and ***P < 0.001.
- Measurement of cell death with Annexin V staining in FOB and MZB cells from the spleens of Pacs1 +/+ and Pacs1 −/− mice. Results are representative of two independent experiments. Horizontal bars indicate mean values. Two‐tailed unpaired t test, ns = not significant, **P < 0.01.
We used CRISPR/Cas9 editing to generate a 1 bp insertion in exon 4 of Pacs1, thereby eliminating protein expression (Fig 1B and Appendix Fig S1B). Pacs1 −/− mice had a deficiency of circulating B cells and CD4 and CD8 T cells, confirming that mutations in Pacs1 were causative of the en and ccy phenotypes (Fig 1C). We observed elevated numbers of CD11b+ myeloid cells in the peripheral blood of Pacs1 −/− mice.
We next enumerated developing lymphocyte populations in primary lymphoid organs to determine how Pacs1 influenced lymphocyte development (Fig 1D). Pacs1 −/− mice had reduced numbers of B‐cell progenitors in the bone marrow starting at the pre‐B stage and was most pronounced in mature recirculating B cells. Pacs1 −/− mice showed normal numbers of developing T‐cell subpopulations in the thymus.
We performed a more sensitive assessment of lymphocyte development using mixed bone marrow chimeras (Fig 1E). Lethally irradiated Rag2 −/− mice were transplanted with 2.5 million cells each of Pacs1 +/+; CD45.1 and Pacs1 −/−; CD45.2 bone marrow. The contribution of Pacs1 +/+ and Pacs1 −/− cells to developing and mature lymphocyte populations was measured in the bone marrow, thymus, and spleen of recipient mice 16 weeks post‐transplant based on congenic marker expression. In the bone marrow, chimeric mice showed increased proportions of Pacs1 −/− pre‐pro B cells, suggestive of a developmental block at this stage. Pacs1 −/− cells lost their competitive advantage as they progressed to the pro B, pre B, and immature stages. Pacs1 −/− mature recirculating B cells were at a strong competitive disadvantage with respect to Pacs1 +/+ cells. In the thymus, Pacs1 −/− and Pacs1 +/+ developing T cells had equal representation at the double‐negative and double‐positive stages. However, CD4 and CD8 Pacs1 −/− single positive T cells competed poorly with Pacs1 +/+ single positive T cells, revealing a role for Pacs1 in the generation of mature naïve T cells.
Non‐chimeric Pacs1 −/− mice had a 5‐fold reduction in splenic follicular B (FOB) cells but normal numbers of marginal zone (MZB) cells. Pacs1 −/− mice also had ~ 1.5‐fold fewer CD4 and ~ 2‐fold fewer CD8 T cells (Fig 1D). The spleens from mixed bone marrow chimeras showed that Pacs1 deletion resulted in reduced competition in both the FOB and MZB cell populations (Fig 1E). Additionally, the splenic T‐cell deficiency observed in Pacs1 −/− mice was exacerbated under competitive conditions. The myeloid population in chimeric spleens was composed of equal proportions of Pacs1 −/− and Pacs1 +/+‐derived cells.
An increased fraction of Pacs1 −/− FOB cells in the spleen was apoptotic based on Annexin V staining, indicating a role for Pacs1 in maintaining this population in the periphery in addition to facilitating their development in the bone marrow. There was no difference in the level of apoptosis between Pacs1 +/+ and Pacs1 −/− MZB cells (Fig 1F).
Defective ER Ca2+ efflux in Pacs1 −/− lymphocytes after antigen receptor stimulation
The antigen receptor signaling mechanism is common to both T and B cells and critical to their development and maintenance. We hypothesized there was a defect in antigen receptor signaling in Pacs1 −/− mice given their lymphopenia. We loaded splenocytes with the cytosolic Ca2+ indicator dye Indo‐1 and stained for B220, CD21, and CD23 to resolve FOB and MZB cells. Cytosolic Ca2+ flux was measured in response to titrated doses of anti‐IgM to stimulate the B‐cell receptor (BCR) (Fig 2A and B). Pacs1 −/− FOB cells showed impaired Ca2+ flux after BCR stimulation at all concentrations of anti‐IgM. MZB cells did not show any Ca2+ flux defects compared to Pacs1 +/+ controls.
Figure 2. Pacs1 deletion causes a defect in cytosolic Ca2+ flux after antigen receptor stimulation.
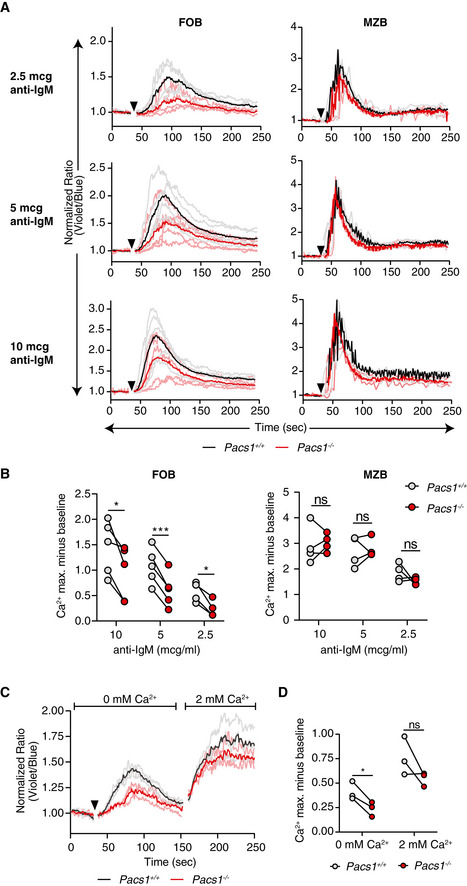
- Pacs1 +/+ and Pacs1 −/− splenocytes were labeled with Indo‐1 and stained for B220, CD21, and CD23 to identify FOB and MZB cells. Fluorescence was measured for 30 s to establish a baseline, and then cells were stimulated with the indicated amounts of anti‐IgM (black arrowhead). Cytosolic Ca2+ flux was monitored with FACS analysis by measuring the violet:blue fluorescence emission ratio of Indo‐1. Kinetic traces are displayed from five independent Pacs1 +/+ and Pacs1 −/− pairs and were normalized to baseline (Pacs1 +/+ gray traces, Pacs1 −/− pink traces). The mean Ca2+ flux for each genotype is overlaid in bold (Pacs1 +/+ black, Pacs1 −/− red).
- Maximum Ca2+ flux (peak height) at each anti‐IgM concentration for FOB and MZB cells. Paired t test, ns = not significant, *P < 0.05, and ***P < 0.001.
- Pacs1 +/+ and Pacs1 −/− FOB cells were labeled with Indo‐1 and stimulated in Ca2+ free buffer with 5 µg/ml anti‐IgM (black arrowhead) to assess ER Ca2+ efflux. Then, 2 mM Ca2+ was added back to assess SOCE. Kinetic traces normalized to baseline from three independent Pacs1 +/+ and Pacs1 −/− pairs are shown with the mean Ca2+ flux overlaid in bold.
- Maximum Ca2+ flux after stimulation under Ca2+ free conditions and after Ca2+ was added back. Two‐tailed paired t test, ns = not significant, *P < 0.05.
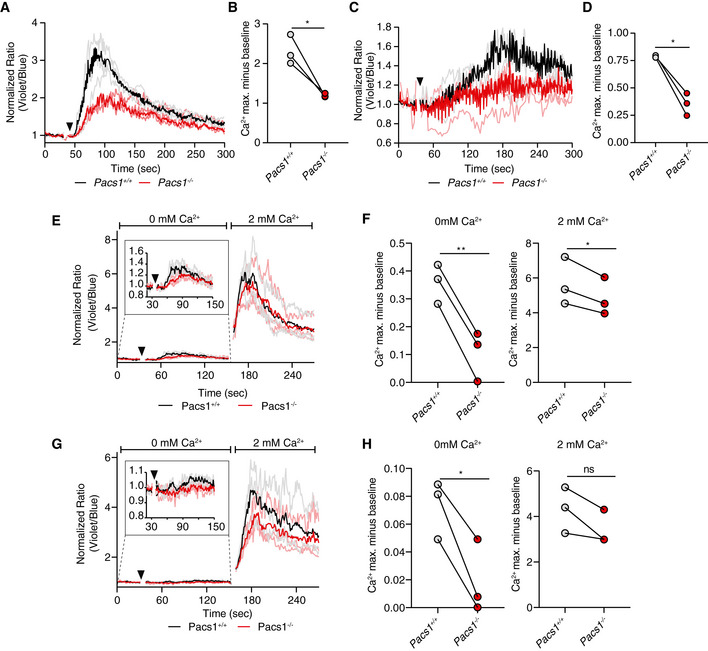
Additionally, Indo‐1‐loaded splenocytes were stained for CD8 (Fig EV1A and B) and CD4 (Fig EV1C and D) and stimulated with anti‐CD3 to cross‐link the T‐cell receptor (TCR). Both CD8 and CD4 T cells from the Pacs1 −/− mice had blunted Ca2+ flux after TCR stimulation.
Figure EV1. Ca2+ flux defects in Pacs1 −/− T cell populations.
-
ASplenocytes from Pacs1 +/+ and Pacs1 −/− mice were stained for CD8 and labeled with Indo‐1. Cells were then stimulated with 10 µg anti‐CD3 (black arrowhead). Cytosolic Ca2+ flux was monitored by FACS analysis. Kinetic traces are displayed from three independent Pacs1 +/+ and Pacs1 −/− pairs and were normalized to baseline (Pacs1 +/+ gray traces, Pacs1 −/− pink traces). The mean Ca2+ flux for each genotype is overlaid in bold (Pacs1 +/+ black, Pacs1 −/− red).
-
BMaximum Ca2+ flux in CD8 T cells after anti‐CD3 stimulation. Symbols represent independent pairs of mice. Two‐tailed paired t test, *P < 0.05.
-
CSplenocytes from Pacs1 +/+ and Pacs1 −/− mice were also stained for CD4 during same experiments as (A) and stimulated with 10 µg anti‐CD3 (black arrowhead). Kinetic traces are displayed from three independent Pacs1 +/+ and Pacs1 −/− pairs and were normalized to baseline (Pacs1 +/+ gray traces, Pacs1 −/− pink traces). The mean Ca2+ flux for each genotype is overlaid in bold (Pacs1 +/+ black, Pacs1 −/− red).
-
DMaximum Ca2+ flux in CD4 T cells after anti‐CD3 stimulation. Symbols represent independent pairs of mice. Two‐tailed paired t test, *P < 0.05.
-
E, GStimulation of (E) CD8 and (G) CD4 T cells with 10 µg anti‐CD3 under Ca2+‐free conditions (black arrowhead) followed by addition of 2 mM Ca2+.
-
F, HPeak of Ca2+ flux in (F) CD8 and (H) CD4 T cells under Ca2+‐free conditions and after addition of 2 mM Ca2+. Symbols represent independent pairs of mice. Two‐tailed paired t test, ns = not significant, *P < 0.05, **P < 0.01.
We then simulated Indo‐1‐loaded Pacs1 −/− FOB cells with anti‐IgM in Ca2+‐free buffer to measure ER Ca2+ efflux. Pacs1 −/− FOB cells showed blunted cytoplasmic Ca2+ flux under these conditions (Fig 2C and D). Despite a defect in ER Ca2+ efflux, we did not find a significant decrease in SOCE in the Pacs1 −/− FOB cells after adding back 2 mM Ca2+ to the extracellular media.
We also stimulated splenic CD8 (Fig EV1E and F) and CD4 (Fig EV1G and H) T cells in Ca2+ free media with anti‐CD3. We found impaired ER Ca2+ released in Pacs1 −/− T cells compared with Pacs1 +/+ T cells. Like FOB cells, SOCE in T cells was largely intact after adding back 2 mM Ca2+. There was a slight reduction in maximal Ca2+ flux in CD8 T cells after Ca2+ add back and a trend toward reduced maximal Ca2+ flux in CD4 T cells that did not reach statistical significance.
Pacs1 −/− B‐cell deficiency and Ca2+ flux phenotypes are independent of antigen receptor specificity
To this point, we had not excluded the possibility that Pacs1 deletion skewed lymphocyte developmental pathways to select for mature populations with the blunted Ca2+ flux phenotype. We controlled for repertoire skewing in the B‐cell compartment by introducing the B1‐8i immunoglobulin heavy chain into the Pacs1 −/− background. B cells expressing the B1‐8i heavy chain bind 4‐hydroxy‐3‐nitrophenyl hapten (NP) when it pairs with a lambda light chain (Schwickert et al, 2011).
Pacs1 −/− ; IgHB1‐8 /+ mice had reduced numbers of total FOB cells in the spleen, while the MZB cell population was preserved (Fig EV2A). NP‐specific B cells were identified by staining with NP conjugated to phycoerthythrin (NP‐PE, Fig EV2B). Within the NP‐specific population, there were fewer Pacs1 −/− FOB cells than Pacs1 +/+ FOB cells. There was no significant difference between the number of NP‐specific Pacs1 −/− MZB cells and NP‐specific Pacs1 +/+ MZB cells.
Figure EV2. Ca2+ flux defects in Pacs1 −/− B cells is independent of antigen receptor specificity.
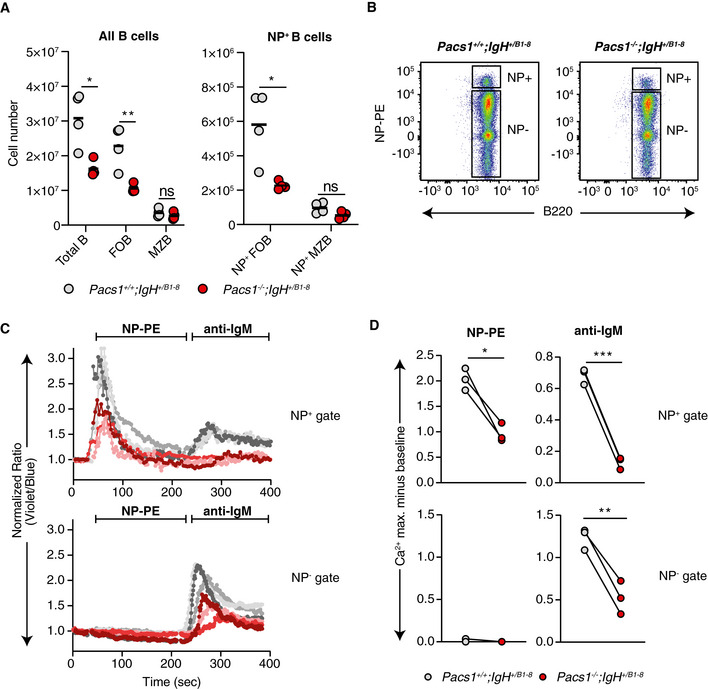
- Total number of splenic B cell subpopulations in Pacs1 +/+ and Pacs1 −/− mice expressing the NP‐specific B1‐8 heavy chain. Symbols represent individual mice. Horizontal bars indicate mean values. Two‐tailed unpaired t test, ns = not significant, *P < 0.05, **P < 0.01.
- Identification of NP‐specific FOB cells in spleens from Pacs1 +/+ ; IgHB1‐8 /+ and Pacs1 −/− ; IgHB1‐8 /+ mice using NP‐PE.
- Ca2+ flux kinetic traces within the NP+ and NP− gates after treatment with NP‐PE and then with anti‐IgM from three independent experiments (Pacs1 +/+ ; IgHB1‐8 /+ are gray traces, Pacs1 −/− ; IgHB1‐8 /+ are red/pink traces). Traces are normalized to baseline.
- Maximum Ca2+ flux after each stimulation within the NP+ and NP− gates. Symbols represent independent pairs of mice. Two‐tailed paired t test, *P < 0.05, **P < 0.01, ***P < 0.001.
We next looked at inducible Ca2+ flux within Indo‐1‐labeled NP‐specific FOB cells by stimulating with NP‐PE. Pacs1 −/− NP‐specific FOB cells had reduced Ca2+ flux after cross‐linking with NP‐PE compared with Pacs1 +/+ NP‐specific FOB cells (Fig EV2C and D). Whereas Pacs1 +/+ NP‐specific FOB cells could be subsequently stimulated with anti‐IgM to induce a second peak in cytosolic Ca2+ flux, Pacs1 −/− NP‐specific FOB cells were unable to flux cytosolic Ca2+ after a second stimulation. The polyclonal FOB cell population (NP‐PE negative cells) in both genotypes did not show any cytosolic Ca2+ flux after addition of NP‐PE. Subsequent addition of anti‐IgM showed reduced Ca2+ flux amplitude in Pacs1 −/− polyclonal FOB cells compared with Pacs1 +/+ polyclonal FOB cells. Together, these data show that the FOB cell deficiency and the Ca2+ flux defect resulting from Pacs1 deletion are independent of antigen receptor specificity.
Signaling upstream of ER Ca2+ release is intact in Pacs1 −/− B cells
Cytosolic Ca2+ flux in lymphocytes is controlled upstream by activated phospholipase C gamma‐2 (Plcγ‐2) (Kurosaki et al, 2000). We did not detect any defect in Plcγ‐2 activation in Pacs1 −/− B cells after anti‐IgM treatment (Fig EV3). The phosphoinositide 3‐kinase‐protein kinase B/Akt (Pi3K‐Akt) (Srinivasan et al, 2009) and extracellular signal‐regulated kinase (Erk) (Richards et al, 2001) pathways are important for B‐cell survival and function downstream of antigen receptor stimulation. We found that these pathways were also activated normally after BCR cross‐linking (Fig EV3). Together, these data indicate that Pacs1 is required for normal Ca2+ mobilization in lymphocytes at the level of ER Ca2+ release.
Figure EV3. Analysis of proximal BCR signaling in Pacs1 −/− B cells.
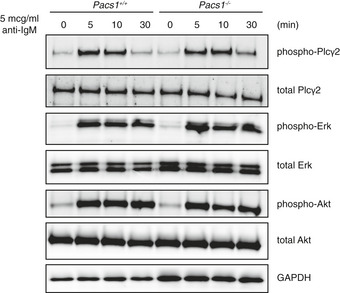
B cells were purified from the spleens of Pacs1 +/+ and Pacs1 −/− mice and stimulated with 5 µg/ml of anti‐IgM for the indicated times. Phosphorylated and total amounts of Plcγ2, ERK, and AKT were analyzed by Western blot.
Wdr37 forms a mutually stabilizing complex with Pacs1
Pacs1 is a cytosolic adaptor which facilitates intracellular protein trafficking. We speculated that incorrect localization of cargo proteins causes the Pacs1 −/− phenotype. We performed co‐immunoprecipitation (IP) mass spectrometry on Pacs1‐associated protein complexes purified from cell extracts to identify relevant interactor candidates. FLAG‐Pacs1 was transfected into 293T cells and affinity purified on anti‐FLAG resin. Bead‐immobilized FLAG‐Pacs1 was incubated with cytosolic extract from purified wild‐type murine B cells. The resulting protein complexes were washed and eluted from the anti‐FLAG resin and subjected to liquid chromatography tandem mass spectrometry (LC‐MS/MS). As a negative control, anti‐FLAG beads alone were incubated with B‐cell extract, washed, eluted, and subjected to LC‐MS/MS. We found 104 proteins that were enriched in the FLAG‐Pacs1 sample (Dataset EV1).
Among the candidate interactors was WD repeat domain protein 37 (Wdr37), within which we identified two ENU‐induced mutations linked to a reduction in circulating B cells (Fig 3A). The initial allele, radical, encoded an early stop codon (L182*). The second allele, profound, was a mutation in a critical splice site which was predicted to be a null allele. In lymphoid tissues, the quantity of Wdr37 protein was markedly reduced in the absence of Pacs1 (Fig EV4A).
Figure 3. Wdr37 forms a mutually stabilizing complex with Pacs1.
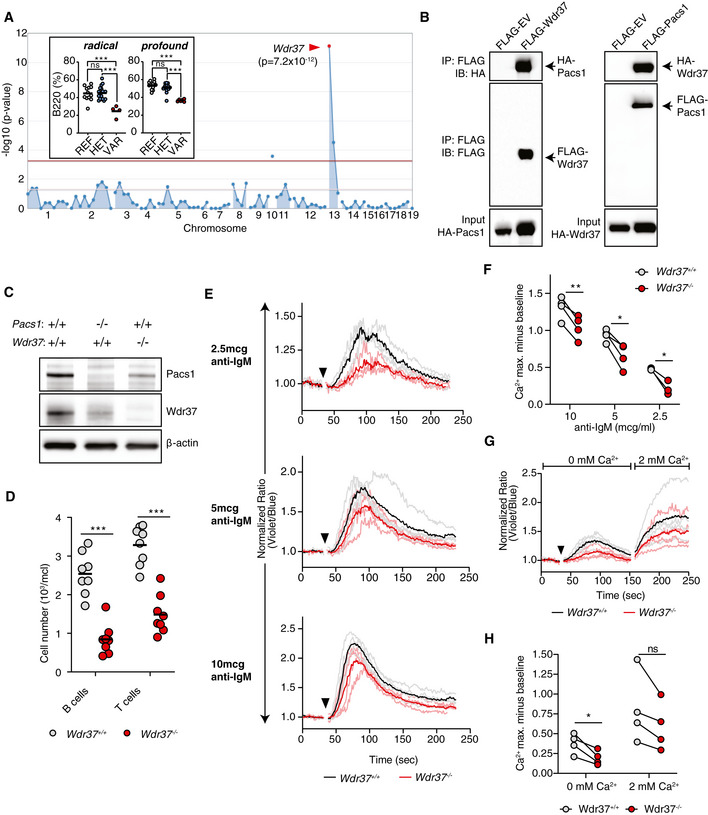
- Super‐pedigree mapping of two mutations in Wdr37 that are linked to peripheral B cell deficiency. Insert shows peripheral B cell deficiency in radical (N = 12 REF, 18 HET, 4 VAR) and profound (N = 14 REF, 15 HET, 6 VAR) pedigrees. Horizontal bars indicate mean values. Ordinary one‐way ANOVA with Tukey’s multiple comparisons test, ns = not significant, ***P < 0.001.
- Co‐immunoprecipitation of HA‐tagged Pacs1 by FLAG‐Wdr37 and HA‐Wdr37 by FLAG‐Pacs1 in co‐transfected 293T cells. EV, empty vector.
- Western blot for Pacs1 and Wdr37 expression in peripheral blood cells from WT, Pacs1 −/−, and Wdr37 −/− mice.
- B and T cell peripheral blood counts in Wdr37 −/− mice. Horizontal bars indicate mean values. Two‐tailed unpaired t test, ***P < 0.001.
- Wdr37 +/+ and Wdr37 −/− splenocytes were labeled with Indo‐1, stained for cell surface markers to identify FOB cells, and stimulated with the indicated amounts of anti‐IgM (black arrowhead). Normalized traces from three (2.5 µg/ml anti‐IgM) or four independent experiments (10 and 5 µg/ml anti‐IgM) are shown (Wdr37 +/+ gray, Wdr37 −/− pink). Mean Ca2+ flux for each genotype is overlaid in bold (Wdr37 +/+ black, Wdr37 −/− red).
- Maximum Ca2+ flux at each anti‐IgM concentration is shown. Two‐tailed paired t test, *P < 0.05, **P < 0.01.
- Wdr37 +/+ and Wdr37 −/− FOB cells were labeled with Indo‐1 and stimulated in Ca2+ free buffer with 5 µg/ml anti‐IgM (black arrowhead) followed by addition of 2 mM Ca2+. Normalized traces from four independent experiments are shown with mean Ca2+ flux overlaid in bold.
- Maximum Ca2+ flux after stimulation under Ca2+ free conditions and after Ca2+ was added back. Two‐tailed paired t test, ns = not significant, *P < 0.05.
Figure EV4. Pacs1 and Wdr37 stabilize each other’s expression.
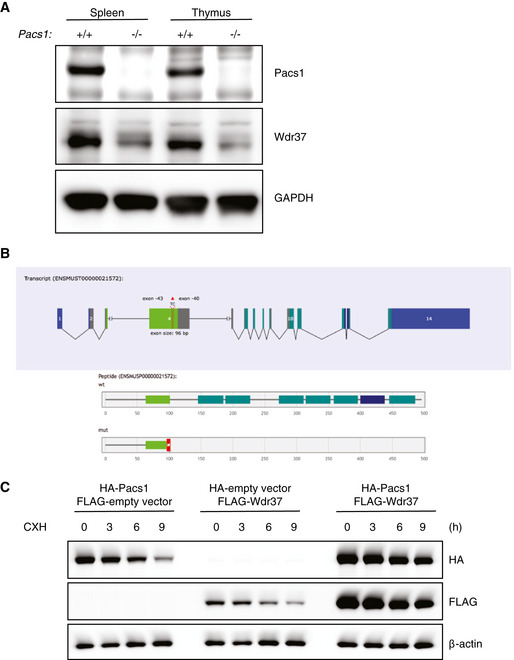
- Immunoblot analysis of Pacs1‐dependent Wdr37 expression in lymphoid tissues from Pacs1 +/+ and Pacs1 −/− mice.
- Gene model for 2 bp deletion from exon 4 of Wdr37 using CRISPR/Cas9 to generate Wdr37 −/− mice.
- Immunoblot analysis of epitope‐tagged Pacs1 and Wdr37 in 293T cells expressing the indicated proteins after CXH treatment.
The WD repeat protein family is characterized by 40 amino acid repeats bracketed by glycine‐histidine and tryptophan‐aspartic acid (GH‐WD) residues which fold into 7‐bladed beta‐propellers (Schapira et al, 2017). WD proteins typically function as scaffolds for macromolecular signaling complexes and are implicated in diverse cellular processes. Wdr37 is an uncharacterized member of this protein family.
To verify physical interaction between Pacs1 and Wdr37, we co‐transfected HEK 293T cells with FLAG‐tagged Pacs1 (amino acids 171−961) and HA‐tagged full‐length Wdr37 (Fig 3B). HA‐Wdr37 co‐immunoprecipitated with FLAG‐Pacs1 under these conditions. These proteins also interacted in a reciprocal co‐immunoprecipitation experiment using FLAG‐Wdr37 as bait and HA‐Pacs1 as the target. Our data verified prior large scale interactome analyses in mammalian cells that demonstrated Pacs1‐Wdr37 complex formation in 293T cells (Huttlin et al, 2017).
We used CRISPR/Cas9 editing to create a frame‐shifting 2 bp deletion allele in exon 4 of Wdr37 (Fig EV4B). Peripheral blood cells from these mice lacked detectable Wdr37 and showed reduced levels of Pacs1 expression, suggesting that these proteins stabilized each other in vivo (Fig 3C). We further evaluated Pacs1 and Wdr37 stability during co‐expression using a cycloheximide (CXH) pulse assay in transiently transfected 293T cells. Consistent with a model of mutual stabilization, FLAG‐Pacs1 and HA‐Wdr37 were expressed at higher levels and decayed more slowly after CXH pulse during co‐transfection than when each was expressed separately (Fig EV4C).
Like Pacs1 −/− mice, Wdr37 −/− mice had reduced absolute numbers of circulating T and B cells (Fig 3D). Furthermore, Wdr37 −/− FOB cells showed blunted cytosolic Ca2+ flux in response to BCR cross‐linking (Fig 3E and F). Stimulating these cells in Ca2+ free buffer showed that this phenotype was linked to defective Ca2+ efflux from the ER while SOCE was largely preserved, as we found in Pacs1 −/− mice (Fig 3G and H).
Pacs2 −/− mice have normal proportions of circulating B cells
Another candidate interactor identified by mass spectrometry was the Pacs1 homolog Pacs2. Pacs1 and Pacs2 share approximately 54% sequence identity and are generally found in distinct intracellular sorting loops (Thomas et al, 2017). We generated knockout alleles of Pacs2 in mice using CRISPR/Cas9 (Appendix Fig S2A). In contrast to Pacs1 −/− mice, we did not observe peripheral B‐cell deficiency in Pacs2 −/− mice (Appendix Fig S2B). Additionally, Pacs2 −/− FOB cells had normal cytosolic Ca2+ flux after stimulation with anti‐IgM (Appendix Fig S2C). Finally, Pacs2 deletion did not reduce stability of Pacs1 or Wdr37 (Appendix Fig S2D). Thus, Pacs1 and Pacs2 have distinct roles in the adaptive immune system, with Pacs1 being uniquely required for maintenance of circulating lymphocyte populations.
Pacs1 deletion induces ER stress, ROS, and heightened sensitivity to oxidative stress
ER Ca2+ homeostasis and protein folding are intricately linked. We asked whether the defective ER Ca2+ efflux in Pacs1 −/− lymphocytes might correlate with increased ER stress. While Pacs1 −/− B cells had ER mass that was comparable to Pacs1 +/+ B cells based on calreticulin expression, they showed substantial upregulation of the ER stress markers Grp78/BiP and CHOP at baseline (Fig 4A). Stimulation of B cells with 5 µg/ml anti‐IgM overnight reduced BiP expression in both Pacs1 +/+ and Pacs1 −/− B cells whereas CHOP expression remained elevated in stimulated Pacs1 −/− B cells.
Figure 4. Pacs1 deletion induces ER stress, ROS, and heightened sensitivity to oxidative stress.
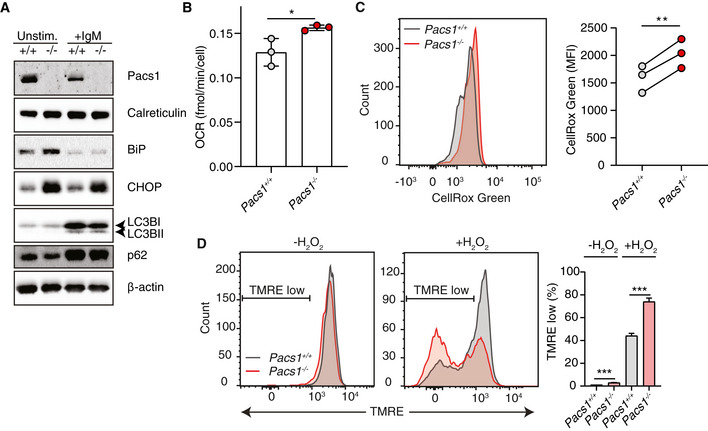
- Immunoblot of ER mass, ER stress, and autophagy markers in Pacs1 +/+ and Pacs1 −/− splenic B cells that were left unstimulated or stimulated overnight with 5 µg/ml IgM.
- B cells were purified from Pacs1 +/+ and Pacs1 −/− spleens and OCR was measured using a Seahorse metabolic flux analyzer. OCR after rotenone/Antimycin A treatment was subtracted from baseline OCR to give basal mitochondrial respiratory rate. Data shown are the mean of 7–10 technical replicates from three independent experiments. Error bars indicate mean ± SD. Two‐tailed unpaired t test, *P < 0.05.
- Determination of cellular ROS in Pacs1 +/+ and Pacs1 −/− FOB cells with CellRox Green analysis by flow cytometry. Quantification shows the mean fluorescence intensity (MFI) from three separate pairs of Pacs1 +/+ and Pacs1 −/− mice. Two‐tailed paired t test, **P < 0.01.
- Splenocytes from Pacs1 +/+ and Pacs1 −/− mice were stained with cell surface antibodies to identify FOB cells and treated with 100 µM H2O2 for 35 min. Cells were then labelled with TMRE to monitor MMP by FACS analysis. Low TMRE fluorescence indicated susceptibility to H2O2 treatment. Data are presented as mean ± SD of 3–4 replicates, two‐tailed unpaired t test, ***P < 0.001. Results are representative of three independent experiments performed on different Pacs1 +/+ and Pacs1 −/− pairs.
ER stress and altered cellular Ca2+ homeostasis can activate or suppress autophagy depending on cellular context (Rashid et al, 2015; Bootman et al, 2018). We measured the effect of Pacs1 deletion on autophagy markers in unstimulated splenic B cells and after overnight treatment with 5 µg/ml anti‐IgM (Fig 4A). In unstimulated Pacs1 +/+ or Pacs1 −/− B cells, the autophagosome marker LC3B‐II was not detected and there was similar basal expression of the autophagy receptor p62. Upon antigen receptor stimulation, we observed similar levels of LC3B‐I to LC3B‐II conversion and increased p62 expression in Pacs1 +/+ and Pacs1 −/− B cells. We interpreted these data to indicate a block in autophagy occurring during the early stages of B‐cell activation, analogous to what was previously described in T cells (Xu et al, 2014). This event was independent of Pacs1 expression.
A portion of ER‐derived Ca2+ is taken up by the mitochondria where it augments the activity of multiple enzymes involved in oxidative metabolism (Cardenas et al, 2010; Rossi et al, 2019). Additionally, ER stress can stimulate increased oxidative metabolism (Balsa et al, 2019). Therefore, we asked how Pacs1 deletion in lymphocytes modulated mitochondrial function. Pacs1 +/+ and Pacs1 −/− B cells contained similar mitochondrial numbers (Fig EV5A). Oxygen consumption rates (OCR) were measured in purified B cells from Pacs1 +/+ and Pacs1 −/− mice (Figs 4B and EV5B). Pacs1 −/− B cells had slightly elevated mitochondrial OCR at baseline. Consistent with increased oxidative metabolism and ER stress, Pacs1 −/− B cells also showed increased levels of cellular reactive oxygen species (ROS) (Fig 4C).
Figure EV5. Pacs1 deletion warps mitochondrial Ca2+ flux after IP3R stimulation.
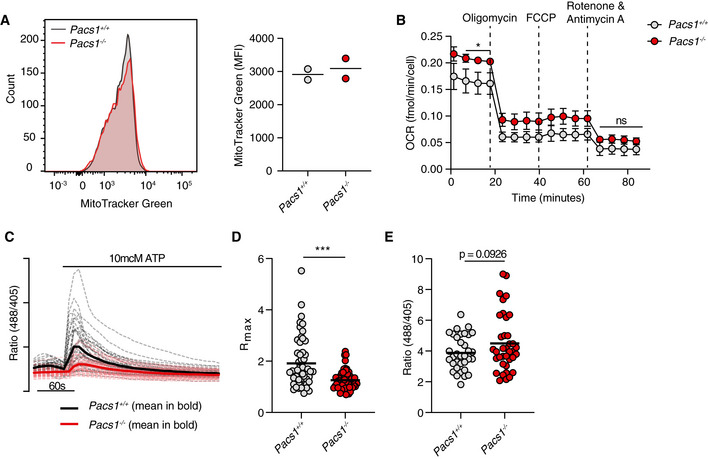
- Pacs1 +/+ and Pacs1 −/− splenocytes were stained to identify FOB cells then labeled with MitoTracker Green. Histogram shows representative intensity of MitoTracker fluorescence in FOB cells. Quantification shows the results of two pairs of Pacs1 +/+ and Pacs1 −/− mice. Each symbol represents the mean value from three technical replicates. Horizontal bars indicate mean values from the combined experiments.
- Mitochondrial stress test of purified Pacs1 +/+ and Pacs1 −/− B cells. Symbols represent the mean of three independent experiments each with 7‐10 technical replicates. Error bars show SD between the combined experiments. Two‐tailed unpaired t test. *P < 0.05, ns = not significant.
- Pacs1 +/+ and Pacs1 −/− NIH‐3T3 cells were infected with MSCV‐Mito‐Pericam. Mitochondrial Ca2+ flux was measured before and after treatment with 10 µM ATP with live cell imaging using the 488/405 nm excitation ratio. Each line shows the kinetic trace of an individual cell (Pacs1 +/+ gray, Pacs1 −/− pink) with the mean overlaid in bold (Pacs1 +/+ black, Pacs1 −/− red). N = 52 cells each for 3T3 and Pacs1 −/−. Results are representative of two independent experiments.
- Maximum mitochondrial Ca2+ flux from the cells imaged in panel C. Symbols represent individual cells. Horizontal bars indicate mean values. Two‐tailed Mann–Whitney test, ***P < 0.001.
- Pacs1 +/+ and Pacs1 −/− NIH‐3T3 cells were transfected with 2mtGCaMP6m and basal mitochondria Ca2+ content was measured. Symbols represent individual cells. N = 34 cells (3T3) and 37 cells (Pacs1 −/−). Results are combined from two independent experiments. Horizontal bars indicate mean values. Two‐tailed unpaired t test with Welch’s correction.
We next looked at how ER and mitochondrial dysfunction in Pacs1 −/− lymphocytes affected their sensitivity to cell death stimuli. Splenocytes from Pacs1 −/− mice were stained to identify FOB cells and loaded with TMRE to measure mitochondrial membrane potential (MMP). Cells were then treated with hydrogen peroxide (H2O2) to induce oxidative cell death. At baseline, there was a small increase in the number of TMRE low Pacs1 −/− FOB cells. After 35 min of H2O2 treatment, ~ 75% of Pacs1 −/− FOB cells showed loss of MMP compared with ~ 40% of Pacs1 +/+ cells, demonstrating increased sensitivity to oxidative stress (Fig 4D).
Pacs1 −/− B cells have reduced IP3R expression and ER Ca2+ stores
We reasoned that the defective ER Ca2+ efflux in Pacs1 −/− and Wdr37 −/− lymphocytes could be the result of two possible mechanisms: first, ER Ca2+ release may be blocked; and second, there may be reduced ER Ca2+ content either through diminished storage capacity or chronic leakage. To address these possibilities, we first measured protein expression of the three SERCA channel isoforms (SERCA1, SERCA2, and SERCA3) and IP3R isoforms (IP3R1, IP3R2, and IP3R3) in Pacs1 +/+ and Pacs1 −/− B cells (Fig 5A). We found substantial reduction in the expression of all three IP3R receptor isoforms in Pacs1 −/− B cells but intact levels of SERCA2. We could not detect SERCA1 or SERCA3 protein expression in B cells.
Figure 5. Pacs1 −/− B cells have reduced IP3R expression.
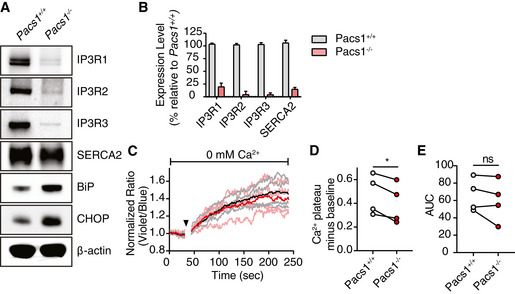
- Immunoblot of expression of all three IP3R isoforms and SERCA2 in primary splenic B cells from Pacs1 +/+ and Pacs1 −/− mice.
- Real‐time quantitative PCR of IP3R and SERCA2 transcripts in B cells. Data are presented as mean ± SD from three independent Pacs1 +/+ and Pacs1 −/− pairs of mice.
- Pacs1 −/− FOB cells were labeled with Indo‐1 and stimulated with 0.625 µM thapsigargin (black arrowhead) under Ca2+‐free conditions to measure intracellular Ca2+ stores. Kinetic traces of four independent experiments are shown (Pacs1 +/+ gray, Pacs1 −/− pink) with the mean overlaid in bold (Pacs1 +/+ black, Pacs1 −/− red).
- Plateau of cytosolic Ca2+ flux from intracellular Ca2+ stores in (C) calculated by the mean value over the last 30 s of analysis with baseline subtracted. Two‐tailed paired t test, *P < 0.05.
- AUC of cytosolic Ca2+ flux from intracellular Ca2+ stores in (C). Two‐tailed paired t test, ns = not significant.
Surprisingly, we found that Pacs1‐dependent regulation of IP3R expression occurred at the transcriptional level: IP3R1, IP3R2, and IP3R3 mRNA levels were all dramatically lower in Pacs1 −/− B cells (Fig 5B). We also found reduced transcript levels for SERCA2 in Pacs1 −/− B cells, which contrasted with the abundance of SERCA2 protein detected in these cells. We were unable to detect transcripts for SERCA1 and SERCA3 in either Pacs1 +/+ or Pacs1 −/− B cells.
We next measured ER Ca2+ stores in Indo‐1‐loaded Pacs1 −/− FOB cells by stimulating them with the SERCA inhibitor thapsigargin in Ca2+ free media (Fig 5C). Pacs1 −/− FOB cells showed a small decrease in the plateau of cytosolic Ca2+ elicited by thapsigargin compared with Pacs1 +/+ FOB cells (Fig 5D). However, calculating the area under the curve (AUC) of Indo‐1 signal revealed no significant difference between the two strains and suggests that ER Ca2+ stores are largely intact in Pacs1 −/− B cells (Fig 5E). Altogether, these findings suggest that the ER Ca2+ efflux defect in Pacs1 −/− lymphocytes stems primarily from decreased expression of IP3Rs.
Pacs1 deletion warps ER and mitochondrial Ca2+ handling
To better determine the role of Pacs1 in Ca2+ flux between subcellular compartments, we deleted Pacs1 in NIH‐3T3 fibroblasts using CRISPR‐Cas9 (Fig 6A). Pacs1 −/− 3T3 cells exhibited reduced Wdr37 and IP3R expression and increased ER stress markers. We observed clonal variation in Pacs1 −/− 3T3 cells with respect to the extent of IP3R reduction and BiP and CHOP induction. Additionally, we found reduced IP3R transcripts in Pacs1 −/− 3T3 cells (Fig 6B). We transfected WT and Pacs1 −/− 3T3 cells with a Ca2+ sensitive aequorin construct targeted to the cytosol and found that they had blunted Ca2+ flux after IPR3R stimulation with bradykinin (Fig 6C and D). Therefore, Pacs1 −/− 3T3 cells recapitulated several key features observed in Pacs1 −/− primary lymphocytes.
Figure 6. Pacs1 deletion warps ER Ca2+ handling.
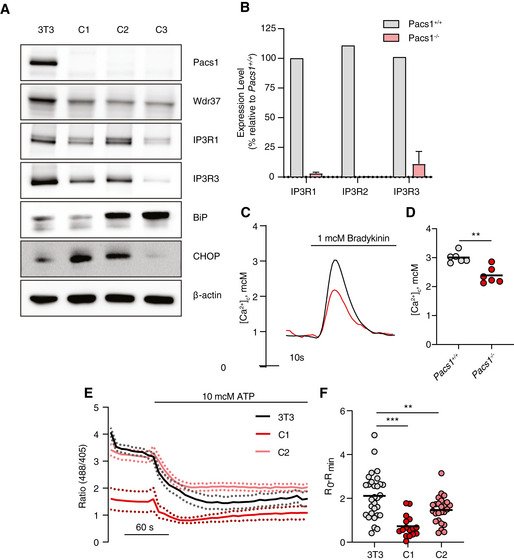
- Immunoblot of Pacs1, Wdr37, IP3Rs, and ER stress markers in the parental NIH‐3T3 cell line and three separate Pacs1 −/− clones.
- Real‐time quantitative PCR of IP3R isoform expression WT and Pacs1 −/− 3T3 cells. Expression in the Pacs1 −/− cells was measured in three independent clones. Data are presented as mean ± SD.
- Pacs1 +/+ and Pacs1 −/− NIH‐3T3 cells were transfected with cytosolic aequorin and Ca2+ flux was measured after treatment with 1 µM bradykinin. Representative kinetic tracing is shown.
- Peak cytosolic Ca2+ concentration based on aequorin measurements as performed in (C). Symbols represent individual wells containing ~ 5 × 10⁵ transfected Pacs1 +/+ 3T3 or Pacs1 −/− 3T3 cells from one experiment. Horizontal bars indicate mean. Two‐tailed unpaired t test, **P < 0.01.
- Pacs1 +/+ and Pacs1 −/− NIH‐3T3 cells (C1 and C2 from (A)) were transfected with ER‐GCamP6‐210. ER Ca2+ was measured before and after treatment with 10 µM ATP. Kinetic traces show the mean 488/405 nm excitation ratio of each cell line with error bars indicating SEM. N = 30 cells (3T3), 16 cells (C1), 25 cells (C2). Data are representative of 2 independent experiments.
- ER Ca2+ release from the NIH‐3T3 cell lines imaged in (E). Symbols represent individual cells. Horizontal bars indicate mean value. One‐way ANOVA with Tukey’s test for multiple comparisons, **P < 0.01, ***P < 0.001.
We transfected Pacs1 −/− 3T3 cells with ER‐GCaMP6‐210 (de Juan‐Sanz et al, 2017), a genetically encoded low‐affinity ratiometric Ca2+ indicator targeted to the ER. Transfected cells were imaged before and after treatment with ATP to trigger IP3‐mediated ER Ca2+ release (Fig 6E). Pacs1 −/− 3T3 cells showed a large reduction in ER Ca2+ release after ATP stimulation which was consistent with reduced IP3R expression in these cells (Fig 6F).
Mitochondrial Ca2+ concentration increases upon IP3R‐mediated ER Ca2+ release (Rizzuto et al, 2009). To determine the effects of Pacs1 deletion on mitochondrial Ca2+ handling, we infected Pacs1 +/+ and Pacs1 −/− 3T3 cells with MSCV‐Mito‐Pericam (Bohler, Stuhldreier et al, 2018) and stimulated them with ATP (Fig EV5C and D). Pacs1 −/− 3T3 cells showed substantially reduced maximal mitochondrial Ca2+ influx after ATP stimulation which agreed with our findings that Pacs1 deletion blunted ER Ca2+ release through IP3Rs. The increased oxygen consumption and ROS seen in Pacs1 −/− B cells led us to ask whether mitochondrial Ca2+ content might be elevated at baseline in the absence of Pacs1. We then measured basal mitochondrial Ca2+ content in Pacs1 −/− and Pacs1 +/+ 3T3 cells with the high‐affinity Ca2+ indicator 2mtGCaMP6m (Fig EV5E) and detected a trend toward higher mitochondrial Ca2+ in Pacs1 −/− cells.
Pacs1 −/− B cells proliferate normally in vitro and Pacs1 −/− mice mount normal humoral responses after immunization
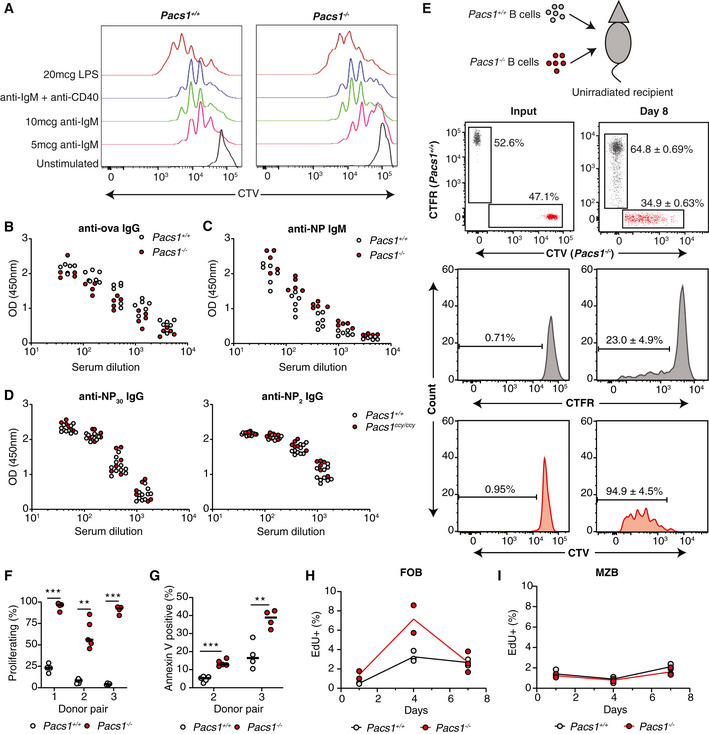
We next investigated the ramifications of Pacs1 deletion on adaptive immune function. Defects in B‐cell cytosolic Ca2+ flux typically result in diminished proliferative responses to antigen receptor stimulation in vitro (Matsumoto et al, 2011; Tang et al, 2017). We isolated B cells from Pacs1 +/+ and Pacs1 −/− mice and labeled them with CellTrace Violet (CTV) dye. Labeled cells were stimulated with anti‐IgM alone, anti‐IgM with anti‐CD40 to simulate T helper cells, or lipopolysaccharide (LPS). Pacs1 −/− B cells showed in vitro proliferative responses comparable to Pacs1 +/+ B cells 72 h after all stimulations (Fig 7A).
Figure 7. Spontaneous proliferation and increased cell death of Pacs1 −/− B cells in vivo under lymphocyte‐replete conditions.
-
APacs1 +/+ and Pacs1 −/− B cells were purified, labeled with CTV dye, and stimulated with the indicated mitogens. Cell proliferation was assessed after 72 h with FACS analysis based on CTV dilution.
-
B, CPacs1 +/+ and Pacs1 −/− mice were immunized with alum‐ova and 1 week later with NP‐Ficoll. Anti‐ova IgG and anti‐NP IgM titers were measured at 14 and 7 days after immunization, respectively. Each symbol represents an individual mouse.
-
DPacs1 +/+ and Pacs1ccy / ccy mice were immunized with NP‐KLH. Low‐affinity (anti‐NP30) and high‐affinity (anti‐NP2) antibodies were measured 14 days after immunization.
-
EB cells were purified from Pacs1 +/+ and Pacs1 −/− mice and labeled with CTFR and CTV dyes, respectively. Labeled B cells were injected into unirradiated CD45.1 recipients at ~ 1:1 ratio. Proliferation and survival of adoptively transferred B cells were measured 8 days post‐transplant.
-
FFraction of donor B cells that proliferated after adoptive transfer. Three independent experiments using three different Pacs1 +/+ and Pacs1−/− donor pairs. Each symbol represents an individual recipient. Horizontal bars indicate median value. Two‐tailed unpaired t test, **P < 0.01, ***P < 0.001.
-
GFraction of donor B cells that were Annexin V positive after adoptive transfer. Two independent experiments using two different Pacs1 +/+ and Pacs1 −/− donor pairs. Each symbol represents an individual recipient. Horizontal bars indicate median value. Two‐tailed unpaired t test, **P < 0.01, ***P < 0.001.
-
H, IPacs1 +/+ and Pacs1 −/− mice were injected with EdU, and the fraction of EdU+ FOB and MZB cells was measured in the spleen at 1, 4, and 7 days post‐injection. Data are from one experiment.
Genetic lesions that block cytosolic Ca2+ flux cause SCID syndrome (Feske et al, 2006; Picard et al, 2009). Pacs1 +/+ and Pacs1 −/− mice were immunized with ovalbumin precipitated on aluminum salt adjuvant (ova‐alum) and NP conjugated to Ficoll (NP‐Ficoll) to stimulate T cell‐dependent (TD) and T cell‐independent (TI) antibody responses, respectively. Pacs1 deletion did not affect either anti‐ova IgG titers 14 days after alum‐ova immunization or anti‐NP IgM titers 7 days after NP‐Ficoll immunization (Fig 7B and C). We assessed the importance of Pacs1 for generating high‐affinity antibodies using mice from the ccy pedigree. Pacs1 +/+ and Pacs1ccy / ccy mice were immunized with NP‐KLH precipitated on alum. IgG titers against NP30‐BSA (low‐affinity IgG) and NP2‐BSA (high‐affinity IgG) were identical between the two strains 14 days after immunization (Fig 7D). These data indicate that Pacs1 −/− B cells have normal proliferative capacity in vitro and are functional in vivo.
Pacs1 −/− B cells spontaneously activate and die in lymphocyte‐replete environments
We hypothesized that defective intracellular Ca2+ homeostasis combined with increased ER stress and ROS might diminish the longevity of Pacs1 −/− lymphocytes in vivo. We isolated B cells from the spleens of Pacs1 +/+ and Pacs1 −/− mice and labeled them with CellTrace Far Red (CTFR) and CTV dye, respectively. Labeled B cells were transferred at a 1:1 ratio into non‐irradiated CD45.1 recipients (Fig 7E). Adoptively transferred B cells were detected in the spleens of recipient mice 8 days post‐transfer by staining for CD45.2 and measuring CTFR and CTV fluorescence. In this assay, most transferred B cells should not undergo cell division because there is no stimulus for homeostatic expansion without lymphotoxic pre‐treatment of recipient mice (Cabatingan et al, 2002; Woodland & Schmidt, 2005). Accordingly, <25% of adoptively transferred Pacs1 +/+ B cells diluted CTFR after adoptive transfer. Strikingly, >95% of adoptively transferred Pacs1 −/− B cells spontaneously proliferated by 8 days after transfer (Fig 7E and F). This was accompanied by poor recovery of adoptively transferred Pacs1 −/− B cells relative to Pacs1 +/+ B cells from the spleens of recipient mice. Higher rates of apoptosis were also observed in adoptively transferred Pacs1 −/− B cells, as measured by Annexin V staining (Fig 7G).
We verified the effects of Pacs1 deletion on B‐cell turnover using pulse‐chase analysis with the thymidine analog 5‐ethynyl‐2′‐deoxyuridine (EdU). Pacs1 +/+ and Pacs1 −/− mice were given a single injection of EdU to label actively cycling cells in primary and secondary lymphoid organs (Fig 7H). Splenocytes were harvested at 1, 4, and 7 days after the EdU pulse, and the frequencies of EdU‐positive FOB and MZB cells were measured with flow cytometry. One day after the pulse, there was ~ 2‐fold increase in the frequency of EdU‐positive FOB cells in the spleens of Pacs1 −/− mice compared with Pacs1 +/+ mice, indicating a higher fraction of actively proliferating cells in the periphery. The frequency of EdU‐positive FOB cells in Pacs1 −/− spleens increased ~ 3‐ to 4‐fold by d4 after the pulse, reflecting recruitment of immature B cells to the mature FOB population. EdU‐labeled Pacs1 −/− FOB cells decayed rapidly and were mostly lost by d7. In contrast, there was ~ 1.5‐ to 2‐fold increase in the frequency of EdU‐labeled Pacs1 +/+ FOB cells on d4 after the pulse that remained stable when analyzed on d7. MZB cells are long lived with a slow turnover rate which was reflected in the low frequency of EdU+ cells in Pacs1 +/+ and Pacs1 −/− spleens at all time points (Fig 7I). These data indicate that Pacs1 −/− FOB cells have accelerated turnover rates and support our observations of spontaneous B‐cell proliferation and apoptosis in the adoptive transfer assay.
B‐cell populations are maintained in vivo by homeostatic cytokines like BAFF (Schiemann et al, 2001) and IL‐4 (Wurster et al, 2002). We asked whether spontaneous proliferation and increased turnover of Pacs1 −/− B cells may be triggered by stimulation with these homeostatic cytokines. We harvested splenic B cells from Pacs1 +/+ and Pacs1 −/− mice and stimulated them in vitro with BAFF and IL4, separately and together, for 72h (Appendix Fig S3). Stimulation with anti‐IgM and anti‐CD40 was included as a positive control. While Pacs1 +/+ and Pacs1 −/− B cells demonstrated normal proliferative responses to anti‐IgM and anti‐CD40, neither population showed significant proliferation after BAFF, IL‐4, or combined treatment.
Pacs1 deletion suppresses abnormal lymphocyte accumulation in models of lymphoproliferation
Defective lymphocyte cell‐death pathways are crucial to the development of autoimmunity, lymphoproliferative diseases, and hematologic malignancies (Rathmell & Thompson, 2002; Nagata & Tanaka, 2017). The anti‐apoptotic protein B‐cell lymphoma 2 (Bcl2) is frequently overexpressed in B‐cell malignancies and is a key contributor to tumorigenesis (Cory & Adams, 2002; Merino et al, 2018). Bcl2 overexpression blocks the mitochondrial apoptotic pathway both by inhibiting Bak and Bax oligomerization at the outer mitochondrial membrane (Shamas‐Din et al, 2013) and by binding to IP3Rs to limit pro‐apoptotic Ca2+ signals from the ER to the mitochondria (Pinton et al, 2000; Rong et al, 2009). Based on the strong B‐cell depletion observed in Pacs1 −/− mice, we next investigated whether Pacs1 deletion might restore the ability of B cells to die in the context of forced Bcl2 expression.
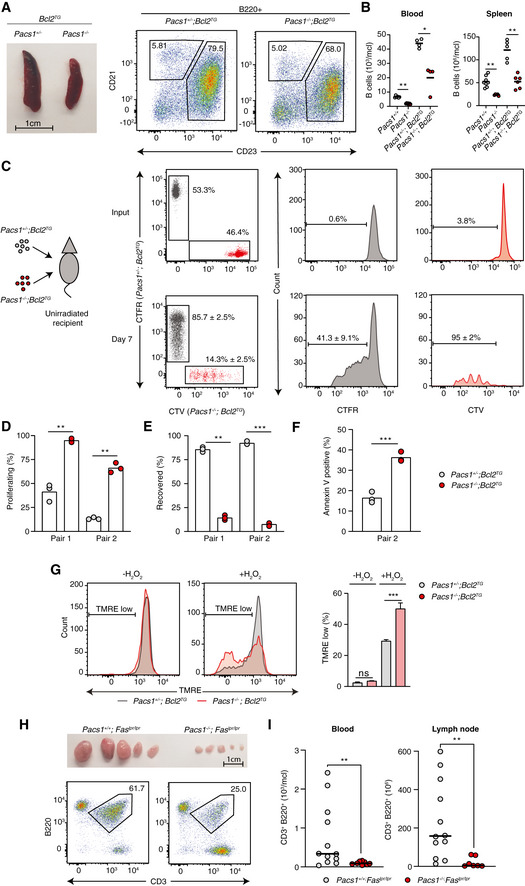
Mice overexpressing Bcl2 in the B‐cell lineage (Bcl2TG) develop abnormal expansion of FOB cells (Fig 8A). We crossed Pacs1 −/− mice to Bcl2TG mice and analyzed B‐cell counts in the offspring at > 20 weeks of age. Pacs1 −/− ; Bcl2TG mice showed reduced B‐cell counts in the peripheral blood and normalized splenic FOB cell counts compared to Pacs1 +/− ; Bcl2TG littermates (Fig 8B), indicating that Pacs1 deletion could override the effects of Bcl2 in blocking B‐cell death.
Figure 8. Pacs1 deletion suppresses abnormal lymphocyte accumulation in models of lymphoproliferation.
-
ASpleen size and FACS analysis of abnormally expanded B220+CD23+CD21+/low FOB cells in Pacs1 +/− ; Bcl2TG and Pacs1 −/− ; Bcl2TG mice.
-
BNumber of circulating B cells in the blood and FOB cells in the spleen of Pacs1 +/− ; Bcl2TG and Pacs1 −/− ; Bcl2TG mice. Horizontal bars indicate mean value. Two‐tailed Mann–Whitney test, *P < 0.05, **P < 0.01.
-
CB cells were purified from the spleens of Pacs1 +/− ; Bcl2TG and Pacs1 −/− ; Bcl2TG mice (CD45.2), labeled with CTFR and CTV proliferation dyes, respectively, and transplanted into unirradiated CD45.1 recipients. Donor B cells were measured in the spleen of recipient mice 7 days after B cell transfer based on CD45.2 expression and proliferation dye fluorescence.
-
D, EThe fraction of proliferating (D) and recovered (E) donor cells from the experiment in (C). Symbols represent individual recipient mice, and data are from two independent adoptive transfer experiments. Two‐tailed unpaired t test, **P < 0.01, ***P < 0.001.
-
FFraction of apoptotic B cells in the adoptively transferred B cell populations in the experiment in (C). Symbols represent individual recipient mice and data are from one adoptive transfer experiment. Two‐tailed unpaired t test, ***P < 0.001.
-
GSplenocytes from Pacs1 +/− ; Bcl2TG and Pacs1 −/− ; Bcl2TG mice were stained with cell surface antibodies to identify FOB cells and treated with 100 µM H2O2 for 35 min. Cells were then labeled with TMRE to monitor MMP. TMRE fluorescence was measured by FACS analysis. Data are presented as mean ± SD of 3–4 replicates, unpaired t test, ns = not significant, ***P < 0.001. Results are from one experiment.
-
HLymph node size and flow cytometry analysis of lymphoproliferative CD3+B220+ cells in Pacs1 +/+ ; Faslpr / lpr and Pacs1 −/− ; Faslpr / lpr mice.
-
IEnumeration of CD3+B220+ cells in the peripheral blood and lymph nodes of Faslpr / lpr dependent on Pacs1 expression. Symbols represent individual mice. Horizontal bars indicate median value. Two‐tailed Mann–Whitney test, **P < 0.01.
To better understand how Pacs1 deletion could block expansion of Bcl2TG B cells, we transplanted CTFR‐labeled Pacs1 +/− ; Bcl2TG B cells and CTV‐labeled Pacs1 −/− ; Bcl2TG B cells into unirradiated CD45.1 recipients. Approximately 25–50% of Pacs1 +/− ; Bcl2TG cells showed spontaneous proliferation 7 days after transplant. In contrast, >95% of transferred Pacs1 −/− ; Bcl2‐TG B cells underwent cell division (Fig 8C and D). Additionally, Pacs1 −/− ; Bcl2TG B cells were recovered at a much lower frequency compared to Pacs1 +/− ; Bcl2TG B cells from recipient spleens and showed higher rates of apoptosis (Fig 8E and F). Like Pacs1 −/− cells, B cells isolated from the spleens of Pacs1 −/− ; Bcl2TG mice were more sensitive to oxidative stress after treatment with H2O2 (Fig 8G). These data indicate that Pacs1 deletion overrides the effect of forced Bcl2 expression by increasing sensitivity to cell death stimuli and diminishing lymphocyte quiescence.
We observed that Pacs1 deletion caused both decreased T‐cell numbers and defective Ca2+ flux after TCR stimulation. Therefore, we assessed the effect of Pacs1 deletion on lymphoproliferative disease in the T‐cell lineage using the Faslpr model of lymphoproliferation. Loss‐of‐function Fas mutations in mice and humans leads to age‐dependent expansion of an aberrant CD3+B220+ T‐cell population, which accumulate in large numbers in lymph nodes (Crampton et al, 2014; Price et al, 2014). We crossed Pacs1 −/− mice to Faslpr / lpr mice on the C57BL/6J background and monitored peripheral blood and lymph node cell counts in aged mice (> 24 weeks). We observed a striking suppression of CD3+B220+ cells and bulky lymphadenopathy in Pacs1 −/− ; Faslpr / lpr mice compared with Pacs1 +/+ ; Faslpr / lpr mice (Fig 8H and I). Together, these data indicate disruption of Pacs1‐Wdr37 can potently suppress lymphoproliferative disease in B‐ and T‐cell lineages arising from blocked cell‐intrinsic and extrinsic apoptotic pathways.
Discussion
Through forward genetic screening and biochemical approaches, we found that Pacs1 and Wdr37 are two components of a novel complex required for lymphocyte development and survival. The lymphocyte deficiency in Pacs1 and Wdr37 mice was linked to problems in ER Ca2+ handling. Pacs1 deletion resulted in decreased expression of all three IP3R isoforms which subsequently blunted ER Ca2+ release. Pacs1 −/− B cells were highly stressed, demonstrating elevation in both ER stress markers and ROS and were hypersensitive to oxidative stress. They also showed spontaneous loss of quiescence after adoptive transfer into lymphocyte‐replete recipients. Surprisingly, Pacs1 −/− mice did not have major defects in immune competence. However, they were markedly resistant to lymphoproliferative diseases resulting from blocked cell‐intrinsic or cell‐extrinsic apoptotic pathways.
All three IP3R isoforms were previously deleted in B (Tang et al, 2017) and T cells (Ouyang et al, 2014). As expected, this led to a strong reduction in ER Ca2+ efflux and SOCE. IP3R deletion in B cells led to a deficiency in peripheral B cells like we observed in Pacs1 −/− and Wdr37 −/− mice. However, IP3R deletion also caused defects in B‐cell proliferation and delayed TD antibody responses while Pacs1 −/− B cells appeared normal in these assays. Interestingly, deletion of IP3Rs in T cells resulted in a highly penetrant lethal T‐cell leukemia due to perturbed developmental pathways. In contrast, Pacs1 deletion caused a relatively mild peripheral T‐cell deficiency without any signs of malignancy. We attribute these phenotypic differences to the fact that there is still residual low level IP3R expression in Pacs1 −/− cells. IP3Rs are high conductance Ca2+ channels and a small number of molecules can flux a large amount of Ca2+ (Dellis et al, 2006; Taylor & Tovey, 2010). We hypothesize that the IP3Rs remaining in Pacs1 −/− mice allow for largely maintained SOCE, which preserves many normal lymphocyte functions but limits their development and survival.
Given Pacs1’s role as an intracellular protein trafficking adaptor, we anticipated that regulation of IP3R expression occurred at the post‐translational level. Instead, we found that IP3R expression was reduced at the transcript level in both B cells and 3T3 cells. IP3R gene expression regulation is not well understood. In neurons, L‐type voltage‐gated Ca2+ channel activation was previously shown to increase IP3R expression via calcineurin‐NFAT signaling (Genazzani et al, 1999; Graef et al, 1999). In non‐excitable cells, forced Bcl‐XL expression was found to decrease IP3R gene expression (Li et al, 2002). Our data indicate that Pacs1 deletion triggers a robust mechanism for IP3R downregulation. We hypothesize that downregulation of IP3Rs is an adaptive response to increased ER stress and ROS production that occurs after Pacs1 deletion: to compensate for cell stress, a signal to the nucleus downregulates the ER Ca2+ efflux machinery to prevent catastrophic ER Ca2+ loss. Whether this signal is communicated through canonical ER stress or ROS signaling networks, or via a different mechanism, remains to be discovered.
With increased ER stress and ROS production in Pacs1 −/− B cells, it was not surprising that they underwent apoptosis at higher rates in vivo. Unexpectedly, Pacs1 −/− B cells also spontaneously proliferated upon adoptive transfer into lymphocyte‐replete recipients. Pacs1 −/− B cells showed normal proliferative responses to antigen receptor signaling and to homeostatic cytokines in vitro. What might cause Pacs1 −/− B cells to spontaneously proliferate in vivo? Both ER stress (Bettigole & Glimcher, 2015) and ROS (Wheeler & Defranco, 2012; Franchina et al, 2018) can enhance lymphocyte activation and differentiation depending on cell context. We hypothesize these chronic stresses in Pacs1 −/− lymphocytes lower the threshold for spontaneous lymphocyte activation, but that subsequent proliferation is ultimately outweighed by pro‐apoptotic signals and lack of appropriate co‐stimulatory signals (Akkaya et al, 2018).
We showed that Pacs1 deletion limited the expansion of lymphocytes in two clinically relevant models of lymphoproliferative disease affecting B cells (Bcl2 overexpression) and T cells (Faslpr). Our mechanistic investigations indicate that Pacs1‐Wdr37 maintains lymphocyte quiescence by supporting normal cellular Ca2+ homeostasis and reducing ER and oxidative stress. Overriding the quiescent state of lymphocytes to force their elimination is a novel approach to the suppression of lymphoid diseases. We propose that Pacs1‐Wdr37 is a viable therapeutic target for lymphoproliferative diseases and possibly for lymphoid malignancies. Pharmacologic disruption of Pacs1‐Wdr37 may synergize with existing therapies that target lymphocyte survival factors such as Bcl2 (venetoclax), BTK (ibrutinib), and PI3K (idelasib). Whether Pacs1‐Wdr37 limits lymphocyte expansion in the context of other drivers of leukemogenesis such as c‐Myc overexpression, p185 Bcr‐Abl, or constitutive Notch activation is an area of future investigation.
A spontaneous recurrent autosomal dominant mutation in the Pacs1 FBR (R203W) was identified as the causative genetic lesion in children with syndromic craniofacial abnormalities and intellectual disability (Schuurs‐Hoeijmakers et al, 2012). Of the patients identified so far with Pacs1 syndrome, we could find no reports of lymphopenia or immunodeficiency (Schuurs‐Hoeijmakers et al, 2016). The disease‐causing mechanism of Pacs1R203W is unclear, and it is currently thought to be a dominant negative or gain‐of‐function mutation. Similarly, a recent study has identified variants of Wdr37 associated with epilepsy, developmental delay, and cerebellar hypoplasia (Kanca et al, 2019; Reis et al, 2019). Deficiency in the fly Wdr37 homolog also imparted severe neurologic deficits that were not rescued by the human mutant variants. Neither Pacs1 −/− nor Wdr37 −/− mice had gross neurologic phenotypes. Testing effects of the mutant proteins on subcellular Ca2+ handling, ER and oxidative stress, and Pacs1‐Wdr37 complex formation may help elucidate the pathophysiology of these human syndromes and define the role of Pacs1‐Wdr37 in neuronal function.
Materials and Methods
Mouse strains
Mice were housed in specific pathogen‐free conditions at the University of Texas Southwestern Medical Center and fed a normal chow diet. All experimental procedures were performed according to institutionally approved protocols. Eight‐ to ten‐week‐old C57BL/6J males were purchased from the Jackson Laboratory and mutagenized with ENU, as previously described (Georgel et al, 2008). Strategic breeding of ENU‐mutagenized generation 0 (G0) males, whole‐exome sequencing, phenotypic screening, and automated mapping of G3 mice were performed as previously described (Wang et al, 2015). B6 CD45.1, Rag2 −/−, Faslpr / lpr, Ightm2Cgn (IgHB1‐8i), and Tg(BCL2)22Wehi/J (Bcl2TG) mice were purchased from the Jackson Laboratory. Pacs1 −/− ; Faslpr / lpr, Pacs1 −/− ; Bcl2TG, and Pacs1 −/− ; IgHB1‐8 /+ mice were generated by intercrossing mouse strains. Male and female mice aged 10–16 weeks were used for experiments. To elicit increased lymphocyte counts, mice on the Faslpr / lpr and Bcl2TG backgrounds were aged longer (> 20 weeks).
Generation of knockout mouse strains using the CRISPR/Cas9 system
To generate single knockout mouse strains, female C57BL/6J mice were super‐ovulated by injection of 6.5 U pregnant mare serum gonadotropin (PMSG; Millipore), followed by injection of 6.5 U human chorionic gonadotropin (hCG; Sigma‐Aldrich) 48 h later. The super‐ovulated mice were subsequently mated overnight with C57BL/6J male mice. The following day, fertilized eggs were collected from the oviducts and in vitro‐transcribed Cas9 mRNA (50 ng/µl) and Pacs1, Pacs2, or Wdr37 small base‐pairing guide RNA (50 ng/µl; Pacs1: 5′‐CATCTCGCTTAAGGAAATGA‐3′; Pacs2: 5′‐ATGTGATCTCAAGACACGCT‐3′; Wdr37: 5′‐GTGAAGGACAAGCGATCGAT‐3′) were injected into the cytoplasm or pronucleus of the embryos. The injected embryos were cultured in M16 medium (Sigma‐Aldrich) at 37°C in 5% CO2. For the production of mutant mice, two‐cell stage embryos were transferred into the ampulla of the oviduct (10–20 embryos per oviduct) of pseudo‐pregnant Hsd:ICR (CD‐1) female mice (Harlan Laboratories).
Plasmids
Mouse Pacs1 (amino acids 114–961) and full‐length mouse Wdr37 were tagged with N‐terminal FLAG or HA epitope in the pcDNA6 vector. Plasmids were sequenced to confirm the absence of undesirable mutations. Details of plasmids are available on request.
Immunizations and ELISA
For TD immunizations, mice were injected via the intraperitoneal route with 200 µg ovalbumin or 100 µg NP‐KLH (BioSearch) adsorbed on aluminum hydroxide hydrogel (InvivoGen). For TI immunizations, mice were given intraperitoneal injections of 50 µg TNP‐Ficoll (BioSearch). At the indicated time points, peripheral blood was harvested in MiniCollect tubes (Mercedes Medical) and centrifuged at 9,391 g rpm to separate the serum for ELISA analysis. For high‐ and low‐affinity antibody detection, Nunc MaxiSorp flat‐bottom 96‐well microplates (Thermo Fisher Scientific) were coated with 5 µg/ml NP2‐BSA or NP30‐BSA (BioSearch). Plates were washed four times using a BioTek microplate washer and then blocked with 1% (v/v) bovine serum albumin (BSA) in PBS for 1 h at room temperature. Serum from immunized mice was serially diluted in the prepared ELISA plates. After 2 h of incubation, plates were washed eight times with washing buffer and then incubated with horseradish peroxidase (HRP)–conjugated goat anti‐mouse IgG (Thermo) for 1 h at room temperature. Plates were washed eight times with washing buffer and then developed with SureBlue TMB Microwell Peroxidase Substrate and TMB Stop Solution (KPL). Absorbance was measured at 450 nm on a Synergy Neo2 plate reader (BioTek).
Bone marrow chimera and adoptive transfer experiments
At 24 h prior to transplant, Rag2 −/− recipient mice were lethally irradiated with 11 Gy given in split doses (X‐RAD 320, Precision X‐ray). Bone marrow was flushed from the tibias and fibulas from the indicated donor strains. Red blood cells were lysed in RBC lysis buffer (BD Biosciences), and bone marrow cells were counted and combined at a 1:1 ratio. Approximately 5–6 million cells were injected intravenously via the retro‐orbital route into Rag2 −/− recipients. Recipient mice were maintained on antibiotic water for 8 weeks post‐transplant. At 16 weeks after transplant, primary and secondary lymphoid tissues were harvested to assess donor chimerism based on lineage, CD45.1, and CD45.2 staining. For B cell adoptive transfer, B cells were purified to > 90% purity from the spleen of indicated donor strains (pan‐B isolation kit; StemCell Technologies). Cells were stained with CTFR or CTV proliferation dyes (Molecular Probes) according to the manufacturer’s instructions. Differentially labeled cells were combined a 1:1 ratio, and 3–4 million cells were injected intravenously into unirradiated CD45.1 recipients. At 7–8 days after transplant, spleens from the recipient mice were harvested. The frequency and proliferation status of donor cells were assessed based on positive staining for CD45.2 and the fluorescence of the proliferation dyes.
Transfection, co‐immunoprecipitation, and Western blotting
HEK293T cells were maintained in DMEM containing 10% FBS and routinely tested for mycoplasma (Fisher Scientific). Cells were transfected in 6‐well plates with 2 µg of the indicated constructs in the presence of Lipofectamine 2000 according to the manufacturer’s instructions. At 36–48 h post‐transfection, cells were rinsed in cold PBS and lysed in buffer containing 1% NP‐40 and HALT protease inhibitor (Thermo). Immunoprecipitation of FLAG‐tagged proteins was performed by incubating M2 anti‐FLAG resin (Sigma) with cell lysates for 2 h at 4°C with end‐over‐end rotation. Beads were washed four times in cold lysis buffer, and protein complexes were eluted with 150 mg/ml of 3 × FLAG peptide (Sigma). Samples were diluted in 2 × SDS sample buffer, run on SDS–PAGE, and transferred to nitrocellulose membranes according to standard procedures. For Western blotting on primary cells, cell pellets were lysed in buffer containing 1% SDS and HALT protease inhibitor. Protein levels were normalized using the bicinchoninic acid (BCA) assay (Pierce) and 10–15 µg of protein was diluted in 2 × SDS sample buffer and run on SDS–PAGE. Primary antibodies used in this study are listed in Table EV1.
Generation of Pacs1 knockout NIH‐3T3 cell lines
NIH‐3T3 (ATCC) were transfected with pSpCas9(BB)‐2A‐GFP (PX458) encoding a small base‐pairing guide RNA targeting the genomic locus of mouse Pacs1 (5′‐CATCTCGCTTAAGGAAATGA‐3′). Forty‐eight hours after transfection, GFP+ cells were sorted by flow cytometry, and single colonies were selected by limiting dilution. Clonal cell lines were screened for Pacs1 deletion by immunoblotting. The parental line and Pacs1 −/− clones were maintained in DMEM containing 10% FBS and routinely tested for mycoplasma. PX458 was a gift from Feng Zhang (Addgene: #48138).
Real‐time quantitative PCR measurements
RNA from purified splenic B cells or NIH‐3T3 cells was reverse transcribed into cDNA using oligo‐d(T) primers and M‐MuLV reverse transcription (Promega). Real‐time quantitative PCR was performed using SYBR DNA polymerase (Thermo Scientific) and target specific primers (Table EV2).
Lymphocyte Ca2+ flux measurements
Splenocytes were harvested from the indicated strains and RBCs were lysed. Cells were loaded for 30 min at 37°C with Indo‐1, AM (Molecular Probes) according to manufacturer’s instructions in RPMI containing 2% FBS (R2). After dye loading, cell surface staining with fluorescence conjugated antibodies to resolve T‐ and B‐cell subsets was performed on ice for 20 min. Cells were washed once in cold PBS and resuspended at 10 million cells/ml in cold R2. To measure Ca2+ flux, 100 µl of cells were diluted into 900 µl of warm R2 and incubated at 37°C for 2 min. Indo‐1 fluorescence was then measured with flow cytometry in response to treatment with anti‐IgM (Invitrogen). For Ca2+ store mobilization, 100 µl of labeled splenocytes was diluted in 900 µl of warm HBSS containing 1 mM EGTA and 10 mM HEPES and incubated at 37°C for 2 min.
Subcellular Ca2+ measurements
For cytosolic AEQ (cytAEQ), the coverslip containing transfected cells was incubated with 5 µM coelenterazine for 1–2 h in KRB (Krebs‐Ringer modified buffer: 125 mM NaCl, 5 mM KCl, 1 mM Na3PO4, 1 mM MgSO4, 5.5 mM glucose, and 20 mM Hepes, pH 7.4, at 37°C) supplemented with 1% FCS, and then transferred to the perfusion chamber. All AEQ measurements were carried out in KRB, and all agonists and other drugs were also dissolved in KRB. The experiments were terminated by lysing cells with 100 µM digitonin in a hypotonic solution containing 10 mM CaCl2, thus discharging the remaining AEQ pool. The light signal was collected and calibrated into [Ca2+] values as previously described (Bonora et al, 2013).
Ca2+ imaging experiments were performed as previously described (Filippin et al, 2003; Patron et al, 2014). Briefly, cells were transfected with 2mtGCaMP6m or ER‐GCaMP6‐210 encoding plasmids and transferred to glass coverslips 24 h post‐transfection. Where indicated, cells were infected with an ecotropic retrovirus encoding Mito‐Pericam (pMSCVpuro‐Mito‐Pericam was a gift from Björn Stork, Addgene: #87381). Imaging was performed in HBSS supplemented with 1 mM CaCl2, 1% FCS, and 20 mM HEPES, pH 7.4 at 37°C. Images were obtained on a wide‐field fluorescence microscope with a high magnification oil immersion lens (40× or 60×, n.a. 1.4). Cells were alternatively illuminated at 474 and 410 nm and fluorescence collected through a 515/30 nm band‐pass filter. Analysis was performed with the Fiji open source software. Both images were background corrected frame by frame by a rolling ball algorithm, then manually thresholded to select for positive pixels. Data are presented as the mean of the averaged ratio of all time points.
Proteomics
FLAG‐Pacs1 was transfected into HEK 293T cells. At 48 h after transfection, cells were lysed in buffer containing 1% NP‐40, and FLAG‐Pacs1 was purified with M2 anti‐FLAG resin. Bead‐bound FLAG‐Pacs1 was washed four times in lysis buffer and incubated with primary B‐cell extract in 1% NP‐40 lysis buffer overnight at 4°C. As a negative control, FLAG beads were incubated with B‐cell extract in 1% NP‐40 lysis buffer overnight at 4°C. Co‐immunoprecipitates were washed four times in lysis buffer, eluted with 150 mg/ml 3 × FLAG peptide, and diluted in 6 × SDS sample buffer. Samples were run on SDS–PAGE until they had entered ~ 0.5 cm into the resolving gel. Protein was visualized with Gel‐Code Blue (Thermo), cut from the gel, and submitted to the UT Southwestern Proteomics Core for LC‐MS/MS analysis as previously described (Zhang et al, 2016). Data were semi‐quantified based on spectral index (SIn), and candidate binding proteins were ranked based on the SIn ratio of FLAG‐Pacs1/beads (Dataset EV1).
In vitro lymphocyte studies
For proliferation assays, B cells were purified from the spleens of the indicated strains (pan‐B isolation kit; StemCell Technologies) and labeled with CTV. Labeled cells were incubated at a concentration of 1 million cells/ml in 24‐well plates in X‐VIVO 15 (Lonza) supplemented with 2‐mercaptoethanol, glutamine, and antibiotics. Cells were treated with indicated amounts of anti‐IgM (Invitrogen), anti‐CD40 (Mitenyi), LPS (Enzo), murine IL4 (Biolegend), or murine BAFF (Peprotech). Proliferation was measured 72 h post‐stimulation with FACS analysis based on CTV dilution. For oxidative cell death studies, splenocytes from Pacs1 +/+ and Pacs1 −/− mice were stained on ice to identify FOB cells then washed in PBS and re‐suspended in culture media. Approximately 1 million cells were then treated with 100 µM H2O2 (Sigma) at 37°C for 35 min followed staining with 30 nM TMRE for an additional 15 min. TMRE fluorescence was measured using FACS analysis. For ROS analysis, approximately 1 million splenocytes were stained on ice to identify FOB cells, washed with PBS, then incubated with CellRox Green (Molecular Probes) according to the manufacturer’s protocol. For mitochondrial perturbation studies, 100,000–200,000 purified splenic B cells per well were analyzed using a Seahorse XFe96 metabolic flux analyzer (Agilent) according to published protocols (van der Windt et al, 2016). 2 µM oligomycin, 1 µM FCCP, and 1 µM rotenone/antimycin A were used for drug treatments. Oxygen consumption rates were normalized to total cells plated.
Statistical analysis
No statistical methods were used to pre‐determine sample size. Normal distribution of data was determined by the Shapiro–Wilk normality test. For normally distributed data, the statistical significance of differences between experimental groups was determined by paired or unpaired t tests as indicated. For non‐normally distributed data, a non‐parametric test was used as indicated. Multiple comparisons were analyzed with ANOVA. Statistical analysis was performed using GraphPad Prism software. Differences with P values < 0.05 were considered significant. P values are denoted by *P < 0.05, **P < 0.01, and ***P < 0.001. Differences with P values ≥ 0.05 were considered not significant (ns).
Author contributions
Study conception and funding: EN‐G and BB; Methodology: EN‐G, MB, XZ, PP, and BB; Experiments: EN‐G, MB, XZ, AL, AM, NS, SL, and JR; Data analysis: EN‐G, MB, XZ, PP, and BB; Project supervision: BB; Writing the paper: EN‐G, TG, and BB.
Conflicts of interest
The authors declare they have no conflicts of interest.
Supporting information
Appendix
Expanded View Figures PDF
Table EV1
Table EV2
Dataset EV1
Review Process File
Source Data for Figure 4
Source Data for Figure 5
Acknowledgements
We thank Luming Chen for assistance with making the figures and insightful comments. We thank the following for their valuable assistance: Stephanie Arnett and Sheila Davis for mouse breeding, Diantha La Vine for the summary illustration, the UT Southwestern Proteomics Core for mass spectrometry, and Marcel Mettlen for live cell imaging. Funding for this project was provided by the Rheumatology Research Foundation Tobé and Stephen E. Malawista, MD Endowment in Academic Rheumatology (E.N.‐G.), NIH grants R01 AI125581 (B.B.) and U19 AI100627 (B.B.), and the Lyda Hill Foundation (B.B.).
The EMBO Journal (2021) 40: e104888.
Data availability
The LC‐MS/MS data produced in this study are available in the following databases:
Dataset EV1: MassIVE (MSV000086799) https://massive.ucsd.edu/ProteoSAFe/dataset.jsp?task=fecd20cd596140c1b2f6c67cbc1fe28d
References
- Akkaya M, Traba J, Roesler AS, Miozzo P, Akkaya B, Theall BP, Sohn H, Pena M, Smelkinson M, Kabat J et al (2018) Second signals rescue B cells from activation‐induced mitochondrial dysfunction and death. Nat Immunol 19: 871–884 [DOI] [PMC free article] [PubMed] [Google Scholar]
- Balsa E, Soustek MS, Thomas A, Cogliati S, Garcia‐Poyatos C, Martin‐Garcia E, Jedrychowski M, Gygi SP, Enriquez JA, Puigserver P (2019) ER and nutrient stress promote assembly of respiratory chain supercomplexes through the PERK‐eIF2alpha axis. Mol Cell 74: 877–890 e6 [DOI] [PMC free article] [PubMed] [Google Scholar]
- Bettigole SE, Glimcher LH (2015) Endoplasmic reticulum stress in immunity. Annu Rev Immunol 33: 107–138 [DOI] [PubMed] [Google Scholar]
- Blagoveshchenskaya AD, Thomas L, Feliciangeli SF, Hung CH, Thomas G (2002) HIV‐1 Nef downregulates MHC‐I by a PACS‐1‐ and PI3K‐regulated ARF6 endocytic pathway. Cell 111: 853–866 [DOI] [PubMed] [Google Scholar]
- Bohler P, Stuhldreier F, Anand R, Kondadi AK, Schlutermann D, Berleth N, Deitersen J, Wallot‐Hieke N, Wu W, Frank M et al (2018) The mycotoxin phomoxanthone A disturbs the form and function of the inner mitochondrial membrane. Cell Death Dis 9: 286 [DOI] [PMC free article] [PubMed] [Google Scholar]
- Bonora M, Giorgi C, Bononi A, Marchi S, Patergnani S, Rimessi A, Rizzuto R, Pinton P (2013) Subcellular calcium measurements in mammalian cells using jellyfish photoprotein aequorin‐based probes. Nat Protoc 8: 2105–2118 [DOI] [PubMed] [Google Scholar]
- Bootman MD, Chehab T, Bultynck G, Parys JB, Rietdorf K (2018) The regulation of autophagy by calcium signals: do we have a consensus? Cell Calcium 70: 32–46 [DOI] [PubMed] [Google Scholar]
- Cabatingan MS, Schmidt MR, Sen R, Woodland RT (2002) Naive B lymphocytes undergo homeostatic proliferation in response to B cell deficit. J Immunol 169: 6795–6805 [DOI] [PubMed] [Google Scholar]
- Cardenas C, Miller RA, Smith I, Bui T, Molgo J, Muller M, Vais H, Cheung KH, Yang J, Parker I et al (2010) Essential regulation of cell bioenergetics by constitutive InsP3 receptor Ca2+ transfer to mitochondria. Cell 142: 270–283 [DOI] [PMC free article] [PubMed] [Google Scholar]
- Cory S, Adams JM (2002) The Bcl2 family: regulators of the cellular life‐or‐death switch. Nat Rev Cancer 2: 647–656 [DOI] [PubMed] [Google Scholar]
- Crampton SP, Morawski PA, Bolland S (2014) Linking susceptibility genes and pathogenesis mechanisms using mouse models of systemic lupus erythematosus. Dis Model Mech 7: 1033–1046 [DOI] [PMC free article] [PubMed] [Google Scholar]
- Dellis O, Dedos SG, Tovey SC, Taufiq Ur R, Dubel SJ, Taylor CW (2006) Ca2+ entry through plasma membrane IP3 receptors. Science 313: 229–233 [DOI] [PubMed] [Google Scholar]
- Feske S, Gwack Y, Prakriya M, Srikanth S, Puppel SH, Tanasa B, Hogan PG, Lewis RS, Daly M, Rao A (2006) A mutation in Orai1 causes immune deficiency by abrogating CRAC channel function. Nature 441: 179–185 [DOI] [PubMed] [Google Scholar]
- Filippin L, Magalhaes PJ, Di Benedetto G, Colella M, Pozzan T (2003) Stable interactions between mitochondria and endoplasmic reticulum allow rapid accumulation of calcium in a subpopulation of mitochondria. J Biol Chem 278: 39224–39234 [DOI] [PubMed] [Google Scholar]
- Franchina DG, Dostert C, Brenner D (2018) Reactive oxygen species: involvement in T cell signaling and metabolism. Trends Immunol 39: 489–502 [DOI] [PubMed] [Google Scholar]
- Genazzani AA, Carafoli E, Guerini D (1999) Calcineurin controls inositol 1,4,5‐trisphosphate type 1 receptor expression in neurons. Proc Natl Acad Sci USA 96: 5797–5801 [DOI] [PMC free article] [PubMed] [Google Scholar]
- Georgel P, Du X, Hoebe K, Beutler B (2008) ENU mutagenesis in mice. Methods Mol Biol 415: 1–16 [DOI] [PubMed] [Google Scholar]
- Giorgi C, Marchi S, Pinton P (2018) The machineries, regulation and cellular functions of mitochondrial calcium. Nat Rev Mol Cell Biol 19: 713–730 [DOI] [PubMed] [Google Scholar]
- Graef IA, Mermelstein PG, Stankunas K, Neilson JR, Deisseroth K, Tsien RW, Crabtree GR (1999) L‐type calcium channels and GSK‐3 regulate the activity of NF‐ATc4 in hippocampal neurons. Nature 401: 703–708 [DOI] [PubMed] [Google Scholar]
- Hogan PG, Lewis RS, Rao A (2010) Molecular basis of calcium signaling in lymphocytes: STIM and ORAI. Annu Rev Immunol 28: 491–533 [DOI] [PMC free article] [PubMed] [Google Scholar]
- Huttlin EL, Bruckner RJ, Paulo JA, Cannon JR, Ting L, Baltier K, Colby G, Gebreab F, Gygi MP, Parzen H et al (2017) Architecture of the human interactome defines protein communities and disease networks. Nature 545: 505–509 [DOI] [PMC free article] [PubMed] [Google Scholar]
- de Juan‐Sanz J, Holt GT, Schreiter ER, de Juan F, Kim DS, Ryan TA (2017) Axonal endoplasmic reticulum Ca(2+) content controls release probability in CNS nerve terminals. Neuron 93: 867–881.e6 [DOI] [PMC free article] [PubMed] [Google Scholar]
- Kanca O, Andrews JC, Lee PT, Patel C, Braddock SR, Slavotinek AM, Cohen JS, Gubbels CS, Aldinger KA, Williams J et al (2019) De novo variants in WDR37 are associated with epilepsy, colobomas, dysmorphism, developmental delay, intellectual disability, and cerebellar hypoplasia. Am J Hum Genet 105: 413–424 [DOI] [PMC free article] [PubMed] [Google Scholar]
- Kottgen M, Benzing T, Simmen T, Tauber R, Buchholz B, Feliciangeli S, Huber TB, Schermer B, Kramer‐Zucker A, Hopker K et al (2005) Trafficking of TRPP2 by PACS proteins represents a novel mechanism of ion channel regulation. EMBO J 24: 705–716 [DOI] [PMC free article] [PubMed] [Google Scholar]
- Kurosaki T, Maeda A, Ishiai M, Hashimoto A, Inabe K, Takata M (2000) Regulation of the phospholipase C‐gamma2 pathway in B cells. Immunol Rev 176: 19–29 [DOI] [PubMed] [Google Scholar]
- Li C, Fox CJ, Master SR, Bindokas VP, Chodosh LA, Thompson CB (2002) Bcl‐X(L) affects Ca(2+) homeostasis by altering expression of inositol 1,4,5‐trisphosphate receptors. Proc Natl Acad Sci USA 99: 9830–9835 [DOI] [PMC free article] [PubMed] [Google Scholar]
- Matsumoto M, Fujii Y, Baba A, Hikida M, Kurosaki T, Baba Y (2011) The calcium sensors STIM1 and STIM2 control B cell regulatory function through interleukin‐10 production. Immunity 34: 703–714 [DOI] [PubMed] [Google Scholar]
- Mekahli D, Bultynck G, Parys JB, De Smedt H, Missiaen L (2011) Endoplasmic‐reticulum calcium depletion and disease. Cold Spring Harb Perspect Biol 3: a004317 [DOI] [PMC free article] [PubMed] [Google Scholar]
- Merino D, Kelly GL, Lessene G, Wei AH, Roberts AW, Strasser A (2018) BH3‐mimetic drugs: blazing the trail for new cancer medicines. Cancer Cell 34: 879–891 [DOI] [PubMed] [Google Scholar]
- Nagata S, Tanaka M (2017) Programmed cell death and the immune system. Nat Rev Immunol 17: 333–340 [DOI] [PubMed] [Google Scholar]
- Ouyang K, Leandro Gomez‐Amaro R, Stachura DL, Tang H, Peng X, Fang X, Traver D, Evans SM, Chen J (2014) Loss of IP3R‐dependent Ca2+ signalling in thymocytes leads to aberrant development and acute lymphoblastic leukemia. Nat Commun 5: 4814 [DOI] [PMC free article] [PubMed] [Google Scholar]
- Patron M, Checchetto V, Raffaello A, Teardo E, Vecellio Reane D, Mantoan M, Granatiero V, Szabo I, De Stefani D, Rizzuto R (2014) MICU1 and MICU2 finely tune the mitochondrial Ca2+ uniporter by exerting opposite effects on MCU activity. Mol Cell 53: 726–737 [DOI] [PMC free article] [PubMed] [Google Scholar]
- Picard C, McCarl CA, Papolos A, Khalil S, Luthy K, Hivroz C, LeDeist F, Rieux‐Laucat F, Rechavi G, Rao A et al (2009) STIM1 mutation associated with a syndrome of immunodeficiency and autoimmunity. N Engl J Med 360: 1971–1980 [DOI] [PMC free article] [PubMed] [Google Scholar]
- Pinton P, Ferrari D, Magalhaes P, Schulze‐Osthoff K, Di Virgilio F, Pozzan T, Rizzuto R (2000) Reduced loading of intracellular Ca(2+) stores and downregulation of capacitative Ca(2+) influx in Bcl‐2‐overexpressing cells. J Cell Biol 148: 857–862 [DOI] [PMC free article] [PubMed] [Google Scholar]
- Price S, Shaw PA, Seitz A, Joshi G, Davis J, Niemela JE, Perkins K, Hornung RL, Folio L, Rosenberg PS et al (2014) Natural history of autoimmune lymphoproliferative syndrome associated with FAS gene mutations. Blood 123: 1989–1999 [DOI] [PMC free article] [PubMed] [Google Scholar]
- Putney JW (2009) Capacitative calcium entry: from concept to molecules. Immunol Rev 231: 10–22 [DOI] [PubMed] [Google Scholar]
- Rashid HO, Yadav RK, Kim HR, Chae HJ (2015) ER stress: autophagy induction, inhibition and selection. Autophagy 11: 1956–1977 [DOI] [PMC free article] [PubMed] [Google Scholar]
- Rathmell JC, Thompson CB (2002) Pathways of apoptosis in lymphocyte development, homeostasis, and disease. Cell 109(Suppl): S97–S107 [DOI] [PubMed] [Google Scholar]
- Reis LM, Sorokina EA, Thompson S, Muheisen S, Velinov M, Zamora C, Aylsworth AS, Semina EV (2019) De novo missense variants in WDR37 cause a severe multisystemic syndrome. Am J Hum Genet 105: 425–433 [DOI] [PMC free article] [PubMed] [Google Scholar]
- Richards JD, Dave SH, Chou CH, Mamchak AA, DeFranco AL (2001) Inhibition of the MEK/ERK signaling pathway blocks a subset of B cell responses to antigen. J Immunol 166: 3855–3864 [DOI] [PubMed] [Google Scholar]
- Rizzuto R, Marchi S, Bonora M, Aguiari P, Bononi A, De Stefani D, Giorgi C, Leo S, Rimessi A, Siviero R et al (2009) Ca(2+) transfer from the ER to mitochondria: when, how and why. Biochim Biophys Acta 1787: 1342–1351 [DOI] [PMC free article] [PubMed] [Google Scholar]
- Rong YP, Bultynck G, Aromolaran AS, Zhong F, Parys JB, De Smedt H, Mignery GA, Roderick HL, Bootman MD, Distelhorst CW (2009) The BH4 domain of Bcl‐2 inhibits ER calcium release and apoptosis by binding the regulatory and coupling domain of the IP3 receptor. Proc Natl Acad Sci USA 106: 14397–14402 [DOI] [PMC free article] [PubMed] [Google Scholar]
- Rossi A, Pizzo P, Filadi R (2019) Calcium, mitochondria and cell metabolism: a functional triangle in bioenergetics. Biochim Biophys Acta Mol Cell Res 1866: 1068–1078 [DOI] [PubMed] [Google Scholar]
- Schapira M, Tyers M, Torrent M, Arrowsmith CH (2017) WD40 repeat domain proteins: a novel target class? Nat Rev Drug Discov 16: 773–786 [DOI] [PMC free article] [PubMed] [Google Scholar]
- Schiemann B, Gommerman JL, Vora K, Cachero TG, Shulga‐Morskaya S, Dobles M, Frew E, Scott ML (2001) An essential role for BAFF in the normal development of B cells through a BCMA‐independent pathway. Science 293: 2111–2114 [DOI] [PubMed] [Google Scholar]
- Schuurs‐Hoeijmakers JH, Oh EC, Vissers LE, Swinkels ME, Gilissen C, Willemsen MA, Holvoet M, Steehouwer M, Veltman JA, de Vries BB et al (2012) Recurrent de novo mutations in PACS1 cause defective cranial‐neural‐crest migration and define a recognizable intellectual‐disability syndrome. Am J Hum Genet 91: 1122–1127 [DOI] [PMC free article] [PubMed] [Google Scholar]
- Schuurs‐Hoeijmakers JH, Landsverk ML, Foulds N, Kukolich MK, Gavrilova RH, Greville‐Heygate S, Hanson‐Kahn A, Bernstein JA, Glass J, Chitayat D et al (2016) Clinical delineation of the PACS1‐related syndrome–Report on 19 patients. Am J Med Genet A 170: 670–675 [DOI] [PubMed] [Google Scholar]
- Schwickert TA, Victora GD, Fooksman DR, Kamphorst AO, Mugnier MR, Gitlin AD, Dustin ML, Nussenzweig MC (2011) A dynamic T cell‐limited checkpoint regulates affinity‐dependent B cell entry into the germinal center. J Exp Med 208: 1243–1252 [DOI] [PMC free article] [PubMed] [Google Scholar]
- Scott GK, Fei H, Thomas L, Medigeshi GR, Thomas G (2006) A PACS‐1, GGA3 and CK2 complex regulates CI‐MPR trafficking. EMBO J 25: 4423–4435 [DOI] [PMC free article] [PubMed] [Google Scholar]
- Shamas‐Din A, Kale J, Leber B, Andrews DW (2013) Mechanisms of action of Bcl‐2 family proteins. Cold Spring Harb Perspect Biol 5: a008714 [DOI] [PMC free article] [PubMed] [Google Scholar]
- Simmen T, Aslan JE, Blagoveshchenskaya AD, Thomas L, Wan L, Xiang Y, Feliciangeli SF, Hung CH, Crump CM, Thomas G (2005) PACS‐2 controls endoplasmic reticulum‐mitochondria communication and Bid‐mediated apoptosis. EMBO J 24: 717–729 [DOI] [PMC free article] [PubMed] [Google Scholar]
- Srinivasan L, Sasaki Y, Calado DP, Zhang B, Paik JH, DePinho RA, Kutok JL, Kearney JF, Otipoby KL, Rajewsky K (2009) PI3 kinase signals BCR‐dependent mature B cell survival. Cell 139: 573–586 [DOI] [PMC free article] [PubMed] [Google Scholar]
- Tang H, Wang H, Lin Q, Fan F, Zhang F, Peng X, Fang X, Liu J, Ouyang K (2017) Loss of IP3 receptor‐mediated Ca(2+) release in mouse B cells results in abnormal B cell development and function. J Immunol 199: 570–580 [DOI] [PubMed] [Google Scholar]
- Taylor CW, Tovey SC (2010) IP(3) receptors: toward understanding their activation. Cold Spring Harb Perspect Biol 2: a004010 [DOI] [PMC free article] [PubMed] [Google Scholar]
- Thomas G, Aslan JE, Thomas L, Shinde P, Shinde U, Simmen T (2017) Caught in the act – protein adaptation and the expanding roles of the PACS proteins in tissue homeostasis and disease. J Cell Sci 130: 1865–1876 [DOI] [PMC free article] [PubMed] [Google Scholar]
- Wan L, Molloy SS, Thomas L, Liu G, Xiang Y, Rybak SL, Thomas G (1998) PACS‐1 defines a novel gene family of cytosolic sorting proteins required for trans‐Golgi network localization. Cell 94: 205–216 [DOI] [PubMed] [Google Scholar]
- Wang T, Zhan X, Bu CH, Lyon S, Pratt D, Hildebrand S, Choi JH, Zhang Z, Zeng M, Wang KW et al (2015) Real‐time resolution of point mutations that cause phenovariance in mice. Proc Natl Acad Sci USA 112: E440–E449 [DOI] [PMC free article] [PubMed] [Google Scholar]
- Wheeler ML, Defranco AL (2012) Prolonged production of reactive oxygen species in response to B cell receptor stimulation promotes B cell activation and proliferation. J Immunol 189: 4405–4416 [DOI] [PMC free article] [PubMed] [Google Scholar]
- van der Windt GJW, Chang CH, Pearce EL (2016) Measuring bioenergetics in T cells using a seahorse extracellular flux analyzer. Curr Protoc Immunol 113: 1–3 [DOI] [PMC free article] [PubMed] [Google Scholar]
- Woodland RT, Schmidt MR (2005) Homeostatic proliferation of B cells. Semin Immunol 17: 209–217 [DOI] [PubMed] [Google Scholar]
- Wurster AL, Rodgers VL, White MF, Rothstein TL, Grusby MJ (2002) Interleukin‐4‐mediated protection of primary B cells from apoptosis through Stat6‐dependent up‐regulation of Bcl‐xL. J Biol Chem 277: 27169–27175 [DOI] [PubMed] [Google Scholar]
- Xu X, Araki K, Li S, Han JH, Ye L, Tan WG, Konieczny BT, Bruinsma MW, Martinez J, Pearce EL et al (2014) Autophagy is essential for effector CD8(+) T cell survival and memory formation. Nat Immunol 15: 1152–1161 [DOI] [PMC free article] [PubMed] [Google Scholar]
- Youker RT, Shinde U, Day R, Thomas G (2009) At the crossroads of homoeostasis and disease: roles of the PACS proteins in membrane traffic and apoptosis. Biochem J 421: 1–15 [DOI] [PMC free article] [PubMed] [Google Scholar]
- Zhang Z, Turer E, Li X, Zhan X, Choi M, Tang M, Press A, Smith SR, Divoux A, Moresco EM et al (2016) Insulin resistance and diabetes caused by genetic or diet‐induced KBTBD2 deficiency in mice. Proc Natl Acad Sci USA 113: E6418–E6426 [DOI] [PMC free article] [PubMed] [Google Scholar]
Associated Data
This section collects any data citations, data availability statements, or supplementary materials included in this article.
Supplementary Materials
Appendix
Expanded View Figures PDF
Table EV1
Table EV2
Dataset EV1
Review Process File
Source Data for Figure 4
Source Data for Figure 5
Data Availability Statement
The LC‐MS/MS data produced in this study are available in the following databases:
Dataset EV1: MassIVE (MSV000086799) https://massive.ucsd.edu/ProteoSAFe/dataset.jsp?task=fecd20cd596140c1b2f6c67cbc1fe28d