

Abstract
p97ATPase‐mediated membrane fusion is required for the biogenesis of the Golgi complex. p97 and its cofactor p47 function in soluble N‐ethylmaleimide‐sensitive factor (NSF) attachment protein receptor (SNARE) priming, but the tethering complex for p97/p47‐mediated membrane fusion remains unknown. In this study, we identified formiminotransferase cyclodeaminase (FTCD) as a novel p47‐binding protein. FTCD mainly localizes to the Golgi complex and binds to either p47 or p97 via its association with their polyglutamate motifs. FTCD functions in p97/p47‐mediated Golgi reassembly at mitosis in vivo and in vitro via its binding to p47 and to p97. We also showed that FTCD, p47, and p97 form a big FTCD‐p97/p47‐FTCD tethering complex. In vivo tethering assay revealed that FTCD that was designed to localize to mitochondria caused mitochondria aggregation at mitosis by forming a complex with endogenous p97 and p47, which support a role for FTCD in tethering biological membranes in cooperation with the p97/p47 complex. Therefore, FTCD is thought to act as a tethering factor by forming the FTCD‐p97/p47‐FTCD complex in p97/p47‐mediated Golgi membrane fusion.
Keywords: Golgi apparatus, membrane fusion, mitosis, p97ATPase, tethering
Subject Categories: Cell Cycle, Membrane & Intracellular Transport
Identification of Golgi‐associated formiminotransferase cyclodeaminase (FTCD) as p47‐binding protein completes the understanding of p97/VCP ATPase involvement in Golgi membrane fusion at the end of mitosis.
Introduction
The Golgi apparatus plays a central role in the vesicular transport pathway, where it receives the entire output of de novo synthesized proteins from the endoplasmic reticulum (ER), and functions to distill, post‐translationally process, and sort cargo to their ultimate destinations (Mellman & Simons, 1992). Associated with the central roles of the Golgi is its unique and complicated architecture, consisting of a series of stacked flattened cisternae (Warren, 1995). How this complicated structure of the Golgi is formed and maintained is one of the most important issues in molecular cell biology.
Once a mammalian cell enters mitosis, the Golgi is fragmented into thousands of vesicles and short tubules that are dispersed throughout the cytoplasm. At the end of mitosis, the Golgi is rapidly reassembled from the fragments within each daughter cell (Lucocq et al, 1989). Golgi assembly from membrane fragments requires p97ATPase (also known as VCP) as well as N‐ethylmaleimide‐sensitive factor (NSF) (Rabouille et al, 1995b). We previously showed that p97ATPase utilizes two distinct cofactors, namely p47 and p37, for its membrane fusion function; the p97ATPase and its cofactor are thought to function in soluble NSF attachment protein receptor (SNARE) priming (Uchiyama et al, 2006). p47 forms a complex with p97, and the complex induces Golgi membrane fusion (Kondo et al, 1997), which requires the SNARE syntaxin5 (Rabouille et al, 1998). As p47, which has nuclear localization signals in its peptide sequence, mainly localizes to the nucleus during interphase, the p97/p47 pathway is thought to be specialized for the reassembly of organelles at the end of mitosis (Uchiyama et al, 2003). In contrast, p37, which is another cofactor of p97, localizes to the cytoplasm during interphase. The p97/p37 complex also induces Golgi membrane fusion, which utilizes the SNARE GS15 (Uchiyama et al, 2006). The p97/p37 pathway is hence thought to be required for organelle maintenance during interphase.
These two p97 pathways have several differences in their molecular mechanisms. Although both p97 pathways require VCIP135 (Uchiyama et al, 2002; Uchiyama et al, 2006), the p97/p47 pathway only requires the deubiquitinating activity of VCIP135 (Totsukawa et al, 2011). Regarding the tethering system, there is also a big difference between the two pathways. It is generally thought that two membranes have to be bridged by tethering factors prior to their fusion (Sztul & Lupashin, 2009; Brocker et al, 2010), and the p97/p37 pathway, as well as the NSF pathway, utilizes p115‐GM130 tethering (Uchiyama et al, 2006). In contrast, the p97/p47 pathway does not require p115‐GM130 tethering and its tethering system has remained unclear to date.
In this study, we identified formiminotransferase cyclodeaminase (FTCD) as a novel p47‐binding protein. FTCD, which mainly localizes to the Golgi, was found to bind to p97 as well as to p47. In vivo and in vitro studies demonstrated that FTCD functions in the p97/p47‐mediated Golgi reassembly at mitosis via its binding to p47 and to p97. We also showed that FTCD, p47, and p97 form the big complex FTCD‐p97/p47‐FTCD, which can work as a tether.
On the basis of the idea that expressed FTCD that was designed to localize to mitochondria can form this tethering complex between two mitochondrial membranes to cause mitochondria aggregation, we established a novel in vivo tethering assay. In the cells in which expressed FTCD was located in mitochondria, mitochondria aggregation was actually observed, which enabled us to monitor the tethering function of FTCD in living cells. Using this in vivo assay, we demonstrated that the FTCD‐p97/p47‐FTCD complex is sufficient to tether biological membranes at the end of mitosis. FTCD is hence thought to function together with the p97/p47 complex as a tethering machinery in p97/p47‐mediated Golgi membrane fusion. This suggests that the p97/p47 complex may play the dual roles of membrane tethering and SNARE priming in the membrane fusion process.
Results
Identification of FTCD as a p47‐binding protein
The two p97 pathways require distinct adaptors, namely p47 and p37, for their Golgi biogenesis. The C‐terminal halves of p47 and p37 are very similar, containing SEP and UBA domains, whereas their N‐terminal halves are completely different (Uchiyama et al, 2006). These characteristics of the two molecules led to the idea that the N‐terminal half of p47 might be important for its specific function. On the basis of this idea, we aimed to identify novel essential factors of p97/p47‐mediated Golgi biogenesis. A fragment of p47, p47(1–170 a.a.), was immobilized onto beads, the beads were mixed with rat liver extract, and we then analyzed the bound proteins. As shown in Fig 1A, a protein of approximately 55kDa was isolated and was confirmed to be FTCD by mass spectrometry analysis.
Figure 1. Identification of FTCD as a p47‐binding protein.
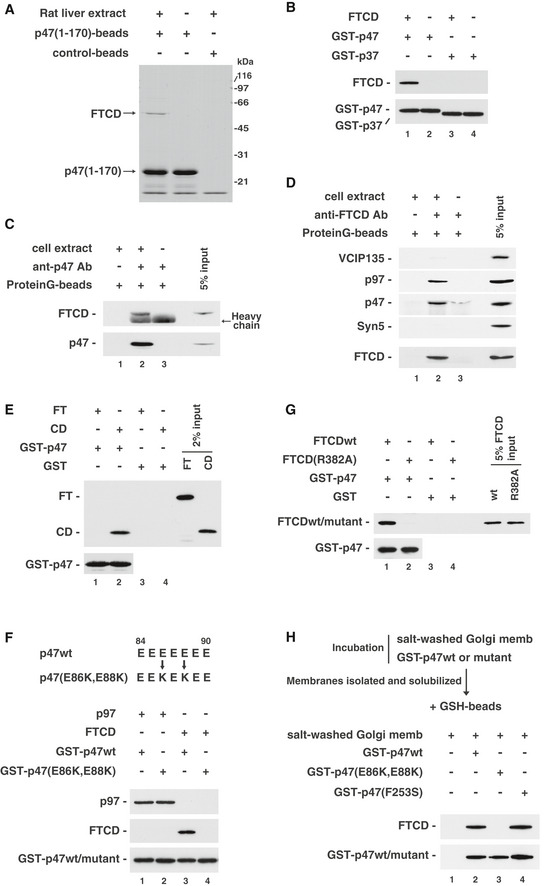
- Isolation of FTCD from rat liver extract. The p47(1–170) fragment, which does not contain the p97‐binding site, was immobilized on beads and incubated with rat liver extract. Bound proteins were fractionated by SDS–PAGE and stained with CBB.
- FTCD binds directly to p47. GST‐tagged p47 (0.54 μg) or GST‐tagged p37 (0.45 μg) was incubated with His‐tagged FTCD (0.80 μg) and then isolated on glutathione beads. The blots were probed with antibodies to FTCD and GST.
- FTCD and p47 form a complex in cells. HepG2 cells were solubilized and incubated with anti‐p47 antibodies. The immunoprecipitates were fractionated by SDS–PAGE, followed by Western blotting with antibodies to p47 and FTCD.
- FTCD, p47, and p97 form a complex in cells. HepG2 cells were solubilized and incubated with anti‐FTCD antibodies. The immunoprecipitates were fractionated by SDS–PAGE, followed by Western blotting with antibodies to FTCD, VCIP135, p97, p47, and syntaxin5.
- p47 binds to the CD domain of FTCD. GST‐tagged p47 (0.50 μg) was incubated with either His‐tagged FTCD(1–326) (FT, 0.88 μg) or His‐tagged FTCD(327–541) (CD, 0.63 μg). The blots were probed with antibodies to His‐tag and GST.
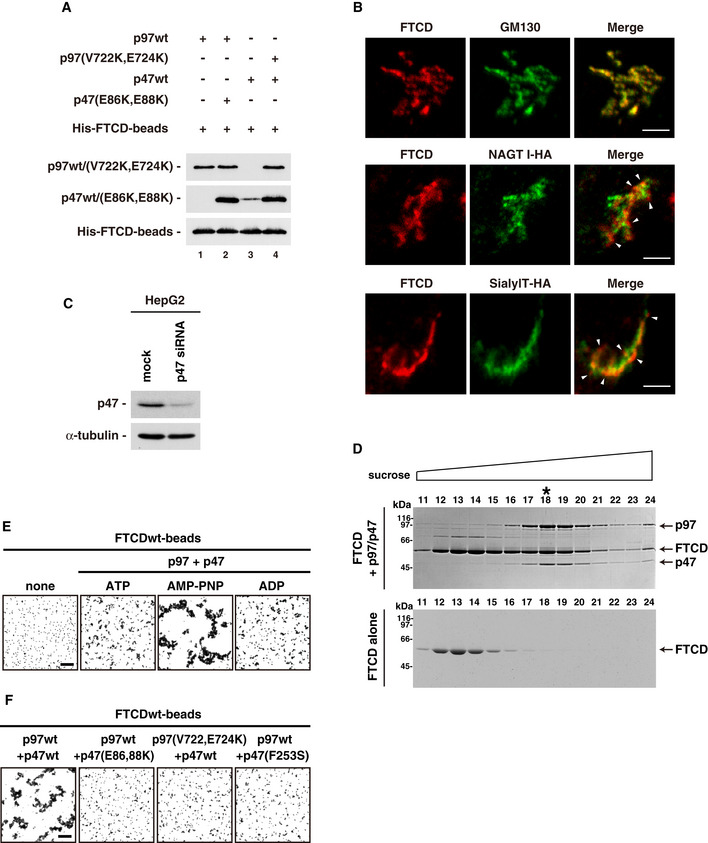
- p47(E86K, E88K) does not bind to FTCD. GST‐tagged p47wt/mutant (0.50 μg) was incubated with the indicated His‐tagged proteins (p97, 1.0 μg; FTCD, 0.75 μg). The blots were probed with antibodies to p97, FTCD, and GST.
- FTCD(R382A), which lacks binding ability to polyglutamates, does not bind to p47. GST‐tagged p47 (0.35 μg) was incubated with His‐tagged FTCDwt/mutant (0.53 μg). The blots were probed with antibodies to His‐tag and GST.
- p47 binds to FTCD in Golgi membranes. Salt‐washed Golgi membranes were first incubated with either GST‐tagged p47wt, p47(E86K, E88K), or p47(F253S). The isolated membranes were solubilized, and then, GST‐tagged p47wt/mutants and their binding proteins were recovered with glutathione beads. The bound proteins were assayed by Western blotting with antibodies to FTCD and GST.
Source data are available online for this figure.
We next tested whether FTCD binds to full‐length p47 (p47full; Fig 1B). FTCD was incubated with either GST‐tagged p47full or GST‐tagged p37full. GST‐tagged p47full bound to FTCD (Fig 1B, upper panel, lane 1), whereas GST‐p37full did not (upper panel, lane 3). This result suggests that FTCD binds specifically to p47.
We then aimed to confirm the interaction between endogenous p47 and FTCD in cells. HepG2 cells were solubilized and used for the immunoprecipitation experiments. We first carried out the immunoprecipitation using anti‐p47 antibodies. FTCD was precipitated together with p47 (Fig 1C, lane 2). We also precipitated FTCD and its binding proteins with anti‐FTCD antibodies (Fig 1D). p47 and p97, a p47‐binding partner, were precipitated together with FTCD (Fig 1D, the second, third and fifth panels, lane 2). These results strongly suggest that FTCD, p47, and p97 form a complex in cells. Since we previously reported that VCIP135 and syntaxin5 are p47‐interacting proteins (Rabouille et al, 1998; Uchiyama et al, 2002), we also investigated whether they were included in this complex. Only a tiny amount of VCIP135 was coprecipitated (Fig 1D, top panel, lane 2), and syntaxin5 was not found in the precipitate (the fourth panel, lane 2).
FTCD is a homo‐octameric enzyme that couples histidine catabolism to folate metabolism and structurally and functionally comprises two domains, namely the FT and CD domains (Mao et al, 2004). We next investigated which domain of FTCD is required for its binding to p47. GST‐tagged p47 was found to bind to the CD fragment (Fig 1E, upper panel, lane 2), but not to the FT fragment (upper panel, lane 1), indicating that p47 binds to FTCD via the CD domain.
FTCD was reported to contain polyglutamate‐binding sites in its CD domain, which enables it to anchor its substrates that possess a polyglutamate stretch (Findlay & MacKenzie, 1987; Murley & MacKenzie, 1995). Interestingly, p47, in contrast to p37, has a polyglutamate motif (84EEEEEEE90) in its peptide sequence (Kondo et al, 1997). It was, hence, speculated that the polyglutamate motif in p47 may interact with the polyglutamate‐binding site in the CD domain of FTCD. To clarify this point, we generated a p47 mutant, in which the polyglutamate motif was mutated (E86K, E88K). p47(E86K, E88K) showed no binding to FTCD (Fig 1F, middle panel, lane 4), whereas there was no difference in the bindings of p47wt and p47(E86K, E88K) to p97 (Fig 1F, upper panel, lanes 1 and 2).
It was also reported that mutant FTCD(R382A) does not associate with polyglutamates (Mao et al, 2004), and indeed, this mutant did not bind to GST‐tagged p47 (Fig 1G, upper panel, lane 2). Considering these findings, we conclude that the polyglutamate motif in p47 is important for its binding to FTCD.
As FTCD mainly localizes to the Golgi, as shown in Fig 3A, we next aimed to clarify whether p47 binds to FTCD in Golgi membranes. Salt‐washed Golgi membranes were saturated with GST‐tagged p47 and solubilized, and then, GST‐tagged p47 and its binding proteins were precipitated with glutathione beads. FTCD was coprecipitated with GST‐tagged p47wt (Fig 1H, upper panel, lane 2). When Golgi membranes were saturated with GST‐tagged p47(E86K, E88K), which lacks FTCD‐binding ability, FTCD was not coprecipitated (Fig 1H, upper panel, lane 3). These results suggested that p47 associates with the FTCD in Golgi membranes. When GST‐tagged p47(F253S), which lacks p97‐binding ability, was used, FTCD was still coprecipitated (Fig 1H, upper panel, lane 4). Hence, we conclude that p47 forms a complex with FTCD in Golgi membranes via its direct binding to FTCD.
Figure 3. FTCD is necessary for the Golgi biogenesis.
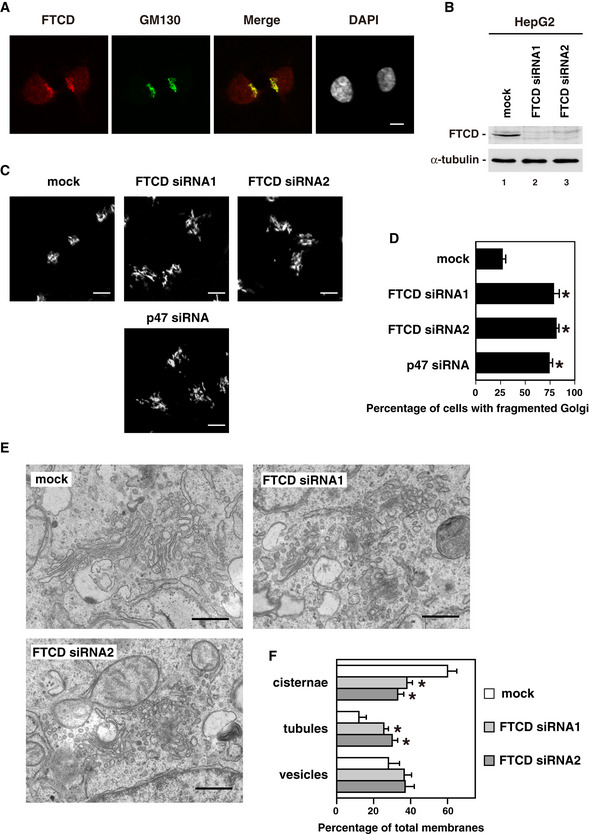
- Immunofluorescence staining of FTCD and GM130, a Golgi marker. HepG2 cells were fixed, permeabilized, stained with a monoclonal antibody to FTCD, a polyclonal antibody to GM130 and DAPI, and observed by confocal microscopy. Scale bar = 10 μm.
- Depletion of FTCD by FTCD siRNA duplexes. HepG2 cells were either mock transfected with water or transfected with two distinct siRNA duplexes specific to FTCD. After incubation for 48 h, the cells were analyzed by Western blotting with antibodies to FTCD and α‐tubulin.
- The Golgi in cells which were depleted of either FTCD or p47. HepG2 cells, which were treated with either FTCD siRNAs, p47 siRNA, or mock for 48 h, were fixed, and stained with a monoclonal antibody to GM130. Scale bar = 10 μm.
- The results of quantification of (C). The values are from five sets of independent experiments. Results are expressed as the mean ± SD (n = 5), with 100 cells counted in each group of each set. Asterisks indicate a significant difference at P < 0.01 compared with the mock‐treated cells (Bonferroni method).
- Representative EM images of the Golgi in HepG2 cells treated with either mock or FTCD siRNAs for 42 h. Scale bar = 0.5 μm.
- The results of quantification of (E). Golgi membranes in HepG2 cells were classified into cisternae, vesicles, and tubules and counted as previously described (Shorter & Warren, 1999). The results are shown as the mean ± SD of five sets of independent experiments, with 15–20 cells counted in each group in each independent experiment. An asterisk indicates a significant difference (P < 0.05) compared with the mock‐treated cells in each category (Bonferroni method).
Source data are available online for this figure.
FTCD directly binds to p97 as well as to p47
His‐tagged FTCD was incubated with GST‐tagged p97 in the absence of p47. To our surprise, FTCD was found to bind to GST‐tagged p97 (Fig 2A, upper panel, lane 1), indicating that FTCD directly interacts with p97. As p97 is an ATPase, we investigated the effects of nucleotides on this binding. Figure 2B shows that the addition of nucleotides increased the binding of FTCD to p97 (upper panel, lanes 2–4). The increase was highest in the presence of AMP‐PNP, a nonhydrolyzable ATP analogue (Fig 2B, upper panel, lane 3), suggesting that ATP binding increases the association between p97 and FTCD.
Figure 2. FTCD binds to p97 as well as to p47.
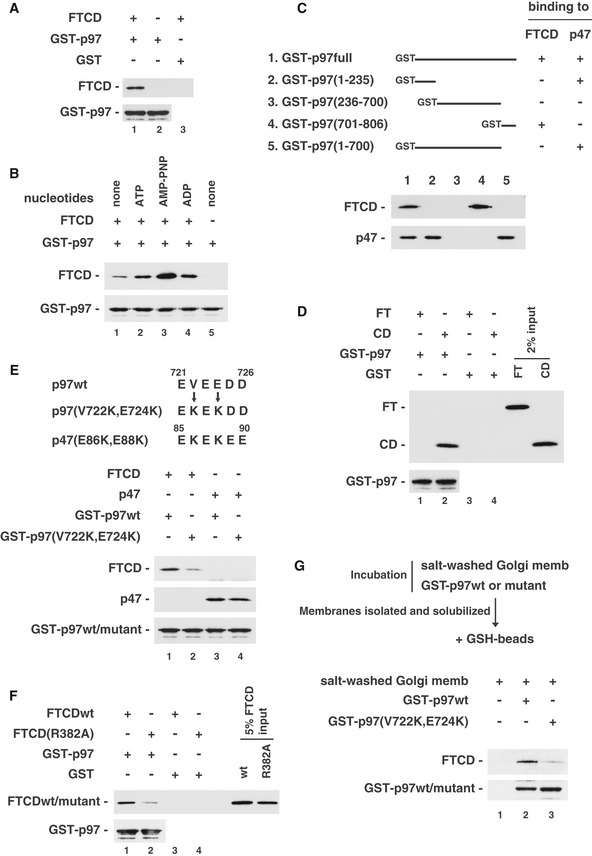
- FTCD directly binds to p97. GST‐tagged p97 (2.1 μg) was incubated with His‐tagged FTCD (0.80 μg) and then isolated on glutathione beads. The blots were probed with antibodies to FTCD and GST.
- Nucleotide dependency of the binding of FTCD with p97. FTCD (0.80 μg) and GST‐tagged p97 (2.1 μg) were incubated in the presence of the indicated nucleotide (1 mM). The blots were probed with antibodies to FTCD and GST.
- FTCD binds to the C‐terminal region of p97. GST‐tagged p97 fragments were incubated with either FTCD or p47. The blots were probed with antibodies to FTCD and p47.
- p97 also binds to the CD domain of FTCD. GST‐tagged p97 (2 μg) was incubated with either His‐tagged FTCD(1–326) (FT, 0.88 μg) or His‐tagged FTCD(327–541) (CD, 0.62 μg). The blots were probed with antibodies to His‐tag and GST.
- p97(V722K, E724K) shows very low binding affinity to FTCD. GST‐tagged p97wt/mutant (2.0 μg) was incubated with the indicated His‐tagged proteins (FTCD, 2.0 μg; p47, 0.5 μg). The blots were probed with antibodies to p47, FTCD, and GST.
- FTCD(R382A), which lacks binding ability to polyglutamates, shows a very low binding affinity to p97. GST‐tagged p97 (1.4 μg) was incubated with His‐tagged FTCDwt/mutant (0.53 μg). The blots were probed with antibodies to His‐tag and GST.
- p97 binds to FTCD in Golgi membranes. Salt‐washed Golgi membranes were incubated with either GST‐tagged p97wt or p97(V722k, E724K). The isolated membranes were solubilized, and then, GST‐tagged p97wt/mutants and their binding proteins were recovered with glutathione beads. The bound proteins were assayed by Western blotting with antibodies to FTCD and GST.
Source data are available online for this figure.
We also clarified the FTCD‐binding domain in p97. As p97 is composed of three domains, namely the N‐terminal (1–235 a.a.), D1D2 (236–700 a.a.), and C‐terminal (701–806 a.a) domains, we produced their GST‐tagged fragments and tested their binding to FTCD and p47. p47 was found to bind to the N‐terminal domain of p97 (Fig 2C, lower panel, lane 2), which is consistent with our previous observations (Uchiyama et al, 2002). In contrast, FTCD bound to the C‐terminal domain of p97 (Fig 2C, upper panel, lane 4), but not to p97 lacking the C‐terminal domain (upper panel, lane 5). The difference in their binding regions suggests that FTCD and p47 may not compete with each other for their binding to p97. Although many p97‐interacting proteins have been identified, there are very few proteins that bind to the C‐terminal domain of p97.
We next investigated the p97‐binding domain in FTCD. Similarly to p47, p97 bound to the CD domain of FTCD (Fig 2D, upper panel, lane 2). Considering that the polyglutamate motif is very important for the binding of p47 to FTCD, we analyzed the peptide sequence of the p97 C‐terminal domain and found a candidate sequence, 721EVEEDD726. Based on an analogous idea to the generation of p47(E86K, E88K), we introduced two mutations (V722K and E724K; Fig 2E, upper panel) to p97. As shown in Fig 2E, only a very small amount of FTCD was bound to GST‐tagged p97(V722K, E724K; upper panel, lane 2). The amount of binding to p47 did not differ between p97wt and its mutant (V722K, E724K; Fig 2E, middle panel, lanes 3 and 4). We also found that FTCD(R382A), which lacks the binding affinity to polyglutamates, had a very low binding affinity to p97 (Fig 2F, upper panel, lane 2). Therefore, the binding of p97 to FTCD is thought to involve the polyglutamate motif of p97, in an analogous manner to the binding of p47 to FTCD.
We finally tested whether p97 forms a complex with FTCD in Golgi membranes. Salt‐washed Golgi membranes were saturated with GST‐tagged p97 and solubilized, and then, GST‐tagged p97 and its binding proteins were isolated with glutathione beads. FTCD was coprecipitated together with GST‐tagged p97wt (Fig 2G, upper panel, lane 2). When GST‐tagged p97(V722K, E724K), which lacks FTCD‐binding ability, was used instead of GST‐tagged p97wt, FTCD was not coprecipitated (Fig 2G, upper panel, lane 3). These biochemical results show that p97 associates with FTCD in Golgi membranes.
FTCD is required for Golgi biogenesis
Figure 3A shows the double‐stained images of FTCD and GM130, a Golgi marker. FTCD mainly localized to the Golgi, though it was also found in the nucleus. In addition, we compared the localization of FTCD with those of expressed β‐1,2‐N‐acetyl‐glucosaminyltransferase I (NAGT I), a medial/trans‐Golgi marker, and α2,6‐sialyltransferase (SialylT), a trans‐Golgi/TGN marker (Rabouille et al, 1995a) (Fig EV1B). The best colocalization was obtained with GM130.
Figure EV1. The complex comprising FTCD, p47, and p97.
- Binding of p97 to p47 enhances the binding affinity of p47 to FTCD. His‐tagged FTCDwt was biotinylated using EZ‐Link Sulfo‐NHS‐LC‐biotin and bound to Dynabeads M280 Streptavidin to generate FTCD‐beads. The FTCD‐beads (1.0 μg) were incubated in the presence of AMP‐PNP (1 mM) together with the indicated proteins (p97wt, 2.0 μg; p97(V722k, E724K), 2.0 μg; p47wt, 1.0 μg; p47(E86K, E88K), 1.0 μg) in buffer (100 mM KCl, 20 mM Hepes, 1 mM MgCl2, 1 mM DTT, 0.5% Triton X‐100, 10% glycerol, pH 7.4). The blots were probed with HRP‐conjugated avidin and antibodies to p97 and p47. The amount of p97 bound to the FTCD‐beads was not changed in the presence of p47(E86K, E88K), which lacked binding affinity to FTCD (upper panel, lane 2). In contrast, the amount of p47 bound to the FTCD‐beads was increased in the presence of p97(V722k, E724K), which lacked binding affinity to FTCD (middle panel, lane 4). These results indicate that the binding of p97 to p47 enhances the binding affinity of p47 to FTCD.
- Localization of FTCD. GM130, a cis‐Golgi marker, and FTCD were visualized as described in Fig 3A. HA‐tagged NAGT I, a medial/trans‐Golgi marker, and HA‐tagged SialylT, a trans‐Golgi/TGN marker, were expressed in HepG2 cells and visualized with anti‐HA antibodies after fixation. Arrowheads indicate differences in the staining patterns. Scale bar = 5 μm.
- Depletion of p47 by p47 siRNA duplexes. HepG2 cells were either mock transfected with water or transfected with siRNA duplexes specific to human p47. After incubation for 48 h, the cells were analyzed by Western blotting with antibodies to p47 and α‐tubulin.
- Isolation of the complex comprising p97, p47, and FTCD. The p97/p47 complex was incubated with an excess amount of FTCD in the presence of 1 mM AMP‐PNP, and the complex comprising p97, p47, and FTCD was isolated using 5%‐40% sucrose gradient centrifugation. Proteins in the fractions were separated by SDS–PAGE and stained with Coomassie Brilliant Blue (upper panel). As a control, FTCD alone was used (lower panel). The amounts of p97, p47, and FTCD in fraction no. 18 (indicated by the asterisk) were analyzed by a densitometer and used for the stoichiometric estimation of the complex. The results demonstrated a ratio of p97 hexamer:p47 trimer:FTCD octamer = 1:1:1.8, indicating that each complex comprises a p97 hexamer, a p47 trimer and two FTCD octamers or a p97 hexamer, a p47 trimer and one FTCD octamer. This is consistent with the results from the negative staining EM (Fig 7D).
- p97/p47‐mediated aggregation of FTCDwt‐beads is nucleotide‐dependent. FTCDwt‐beads were incubated together with p97 (0.1 μg/μl) and p47 (0.1 μg/μl) in the presence of the indicated nucleotides (1 mM). Scale bar = 50 μm. The results of quantification are presented in Fig 7G.
- p47 and p97 mutants that lack binding affinity inhibit p97/p47‐mediated aggregation of FTCDwt‐beads. FTCDwt‐beads were incubated with p97wt/mutant (0.1 μg/μl) and p47wt/mutants (0.1 μg/μl) in the presence of AMP‐PNP. Scale bar = 50 μm. The results of quantification are presented in Fig 7H.
We then aimed to clarify the roles of FTCD in the Golgi. We first performed siRNA experiments and observed the morphology of the Golgi, i.e., two distinct FTCD siRNA duplexes were introduced into HepG2 cells. Western blotting showed that both FTCD siRNA duplexes significantly decreased FTCD levels (Fig 3B, upper panel, lanes 2 and 3). In FTCD‐depleted cells, although the Golgi still localized to a perinuclear region, it was fragmented and dispersed (Fig 3C, middle and right panels), which is similar to the Golgi morphology induced by the depletion of p47, a binding partner of FTCD (Fig 3C, bottom panel; Fig EV1C). The treatment of cells with FTCD siRNA significantly increased the ratio of the cells that had fragmented Golgi (Fig 3D).
We furthermore investigated the ultrastructures of the Golgi apparatus by electron microscopy. In FTCD‐depleted cells, very few big stacks of Golgi were found and the number of tubules seemed to be increased in the Golgi area (Fig 3E). In fact, as the counting results show (Fig 3F), FTCD siRNA treatment significantly decreased the percentage of cisternae and, instead, significantly increased the percentage of tubules. These electron microscopic results together with the above immunofluorescence observations strongly suggested that FTCD may be important for the biogenesis of the Golgi.
FTCD is required for Golgi reassembly at the end of mitosis
We previously showed that the p97/p47 complex is required for Golgi reassembly at the end of mitosis (Uchiyama et al, 2003). As shown above, FTCD is associated with the p97/p47 complex and is required for Golgi biogenesis. Considering these findings, it is likely that FTCD functions in p97/p47‐mediated Golgi reassembly at mitosis. We, hence, tried to clarify the role of FTCD in Golgi reassembly at the end of mitosis.
Mitotic HepG2 cells were collected by flushing, cultured on the coverslips for 10–40 min, and then fixed (Fig 4A). The Golgi remained fragmented at telophase (Fig 4A, panels b and f) and was reassembled at cytokinesis (panel j). FTCD was observed in the Golgi fragments at telophase (panels a and e) as well as in the reassembled Golgi at cytokinesis (panel i). We next investigated the role of FTCD on Golgi reassembly at the end of mitosis. Mitotic cells were collected from the HepG2 cells that had been treated with either FTCD siRNA or mock treatment for 48 h. In the mock‐treated cells, the Golgi was fragmented at telophase (Fig 4B, panels a and c) and reassembled at cytokinesis (panels e and g). In the FTCD siRNA‐treated cells, the Golgi remained fragmented even at cytokinesis (Fig 4B, panels m and o). As shown in Fig 4D, FTCD siRNA treatment significantly increased the percentage of the cells with fragmented Golgi at cytokinesis (the second bar from the top) compared with mock treatment (top bar). These results show that FTCD is necessary for Golgi reassembly at mitosis.
Figure 4. FTCD is necessary for Golgi reassembly at the end of mitosis.
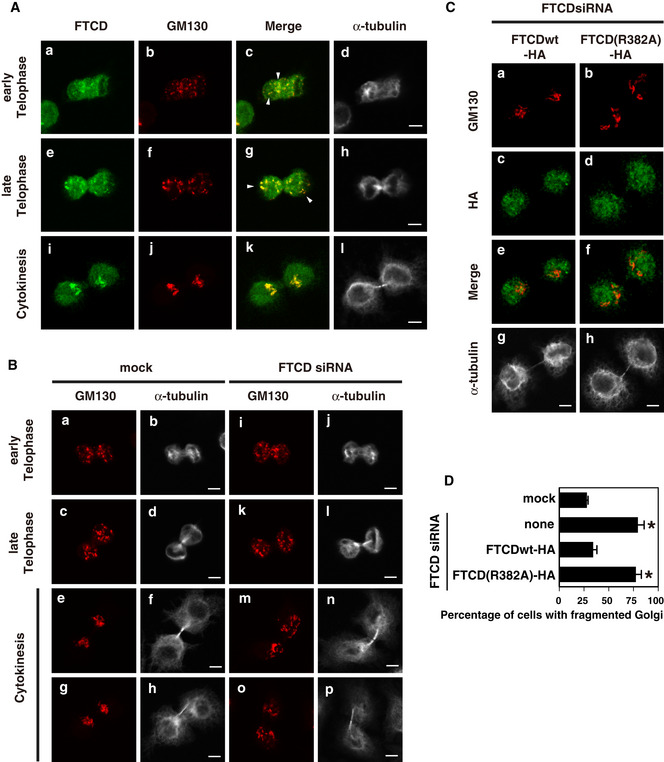
- The localization of FTCD in mitotic cells. Mitotic HepG2 cells were collected by flushing and cultured on coated coverslips for 10–40 min. The cells were fixed, stained with a monoclonal antibody to FTCD and polyclonal antibodies to GM130 and α‐tubulin, and observed by confocal microscopy. Panels d, h, and l indicate the images of α‐tubulin, and the other panels show the distribution of FTCD or/and GM130. Scale bar = 10 μm. Arrowheads indicate the colocalization of FTCD and GM130.
- The effects of FTCD siRNA treatment on Golgi reassembly at the end of mitosis. HepG2 cells were treated with either FTCD siRNA (FTCD siRNA 2 duplex) or mock for 48 h before the collection of mitotic cells. The collected mitotic cells were cultured for 35 min and then fixed. The cells were stained with a polyclonal antibody to GM130 and a monoclonal antibody to α‐tubulin and observed by confocal microscopy. Panels a–p display representative images. Scale bar = 10 μm.
- Rescue experiments in FTCD siRNA‐treated HepG2 cells. The indicated HA‐tagged FTCDs, which were insensitive to FTCD siRNA, were expressed 25 h after the treatment of cells with FTCD siRNA2. The cells were further cultured for 23 h and then used for the collection of mitotic cells. The collected mitotic cells were cultured for 35 min and fixed. The cells were stained with a monoclonal antibody to α‐tubulin (panels g and h) and polyclonal antibodies to GM130 and HA (panels a–f). Scale bar = 10 μm.
- The cells at cytokinesis in (B) and (C) were analyzed. The results are shown as the mean ± SD of five sets of independent experiments, with 100 cells counted in each group in each independent experiment. Asterisks indicate a significant difference (P < 0.01) compared with the mock‐treated cells (Bonferroni method).
We next performed rescue experiments in FTCD‐depleted cells. HA‐tagged rat FTCD (FTCD‐HA), which was insensitive to human FTCD siRNA, was expressed in human FTCD siRNA‐treated HepG2 cells. As shown in Fig 4C and D, the expression of FTCDwt‐HA, which localized to the Golgi as well as the nucleus (Fig 4C, panel e), rescued the Golgi structures at cytokinesis in FTCD‐depleted cells (Fig 4C, panel a; Fig 4D, the third bar from the top). Interestingly, the expression of FTCD(R382A)‐HA did not rescue the Golgi morphology in FTCD‐depleted cells (Fig 4C, panel b; Fig 4D, the bottom bar).
As biochemical in vitro experiments showed that FTCD(R382A), which lacks the binding affinity to polyglutamates, has a very low binding affinity to both p47 and p97 (Figs 1G and 2F), the results of these rescue experiments may suggest the important roles of the bindings between FTCD and p47 and between FTCD and p97 on the Golgi reassembly at mitosis. We, hence, investigated the localization of p47 and p97 at cytokinesis in FTCD‐depleted cells. Figure 5A and B presents the localization of p47 at cytokinesis in FTCD siRNA‐treated cells. p47 localized to the Golgi at cytokinesis in control cells (Fig 5A, panels a and i; Fig 5B, left panel). The depletion of FTCD caused Golgi fragmentation at cytokinesis (Fig 5A, panel f) and dissociated p47 from the Golgi (Fig 5A, panels b and j; Fig 5B, the second panel from the left). The expression of FTCDwt‐HA in FTCD‐depleted cells redistributed p47 to the Golgi (Fig 5A, panels c and k; Fig 5B, the third panel from the left) as well as restored the Golgi morphology at cytokinesis (Fig 5A, panel g). In contrast, the expression of FTCD(R382A)‐HA in FTCD‐depleted cells did not restored either the Golgi morphology (Fig 5A, panel h) or p47 distribution (Fig 5A, panels d and l; Fig 5B, right panel) to the control condition. The results of quantification shown in Fig 5C demonstrated that FTCD siRNA treatment significantly decreased the percentage of the cells in which p47 was localized to the Golgi. The expression of FTCDwt‐HA restored the decrease in this percentage, but the expression of FTCD(R382A)‐HA did not.
Figure 5. p47 and p97 require their association with FTCD for their localization to the Golgi at the end of mitosis.
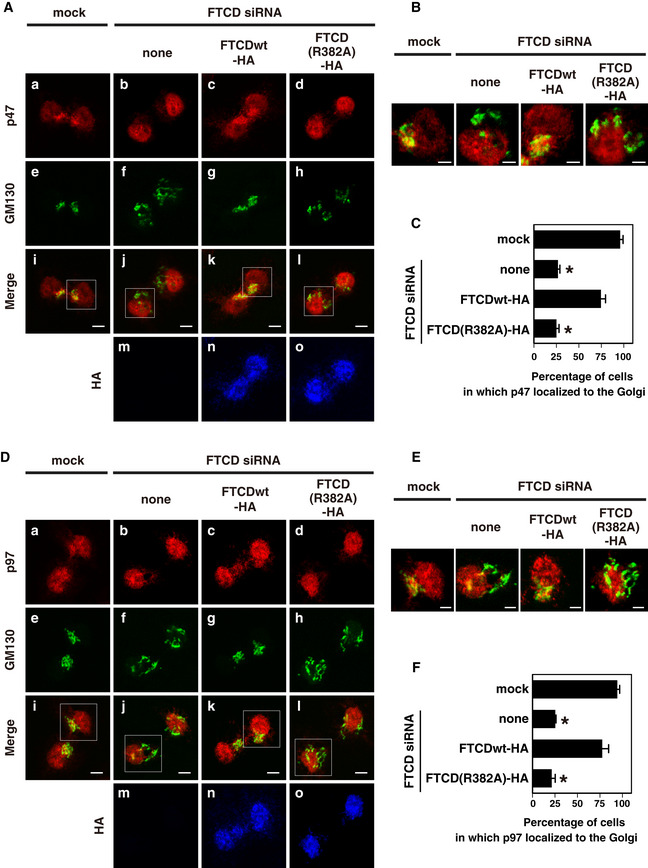
- p47 requires its association with FTCD for its localization to the Golgi at the end of mitosis. HepG2 cells were treated with FTCD siRNA, and then, the indicated HA‐tagged FTCDs were expressed as described in Fig 4C. The mitotic cells were collected, cultured for 35 min, and then fixed. The cells were stained with polyclonal antibodies to p47 and HA and a monoclonal antibody to GM130 and observed by confocal microscopy. Panels a‐l show the distribution of p47 or/and GM130 and panels m‐o show HA‐FTCD expression. Scale bar = 10 μm.
- Insets in (A). p47 (red) and the GM130 (a Golgi marker, green) were visualized. Scale bar = 5 μm.
- The results of quantification of (A). The results are shown as the mean ± SD of five sets of independent experiments, with 100 cells counted in each group in each independent experiments. Asterisks indicate a significant difference at P < 0.01 compared with the mock‐treated cells (Bonferroni method).
- p97 requires its association with FTCD for its localization to the Golgi at the end of mitosis. The cells were treated in the same way as (A) and stained with polyclonal antibodies to p97 and HA and a monoclonal antibody to GM130. Panels a–l show the distribution of p97 or/and GM130 and panels m‐o show HA‐FTCD expression. Scale bar = 10 μm.
- Insets in (D). p97 (red) and the GM130 (a Golgi marker, green) were visualized. Scale bar = 5 μm.
- The results of quantification of (D). The results are shown as the mean ± SD of five sets of independent experiments, with 100 cells counted in each group in each independent experiments. Asterisks indicate a significant difference at P < 0.01 compared with the mock‐treated cells (Bonferroni method).
Figure 5D and E presents the localization of p97 at cytokinesis in FTCD‐depleted cells. The localization of p97 to the Golgi was lost by the depletion of FTCD (Fig 5D, panels b and j; Fig 5E, the second panel from the left). The dissociation of p97 from the Golgi was rescued by the expression of FTCDwt‐HA (Fig 5D, panels c and k; Fig 5E, the third panel from the left), whereas it was not rescued by the expression of FTCD(R382A)‐HA (Fig 5D, panels d and l; Fig 5E, the right panel). The results of quantification shown in Fig 5F demonstrate that the expression of FTCDwt‐HA successfully restored the decrease induced by the FTCD siRNA in the percentage of the cells in which p97 was localized to the Golgi. In contrast, the expression of FTCD(R382A)‐HA was unable to restore the decrease caused by the FTCD siRNA.
Summarizing the above, FTCD localizes to the Golgi in mitotic cells and is necessary for Golgi reassembly at the end of mitosis. The function of FTCD in Golgi reassembly may also require its bindings to p47 and to p97 in the Golgi.
FTCD is necessary for p97/p47‐mediated Golgi membrane fusion
We next investigated whether FTCD functions in p97/p47‐mediated Golgi membrane fusion. As it is necessary to distinguish the function of the p97/p47 pathway from those of other membrane fusion pathways, such as the NSF and p97/p37 pathways, we performed the in vitro Golgi reassembly assay for this purpose.
As shown in Fig 6A, cisternal growth was observed by the incubation of mitotic Golgi fragments with either the p97/p47 complex (Fig 6D, panel b) or the p97/p37 complex together with p115. Coincubation of the anti‐FTCD antibody significantly inhibited this p97/p47‐mediated cisternal regrowth by approximately 70%, whereas coincubation of the anti‐p115 antibody did not (Fig 6A and D, panel c). These observations indicate that FTCD, but not p115, is involved in p97/p47‐mediated Golgi membrane fusion. In contrast, for p97/p37‐mediated cisternal regrowth, anti‐p115 antibodies showed an inhibitory effect, although the anti‐FTCD antibody did not (Fig 6A), suggesting that p115, but not FTCD, is involved in the p97/p37 pathway.
Figure 6. FTCD is necessary for p97/p47‐mediated Golgi membrane fusion.
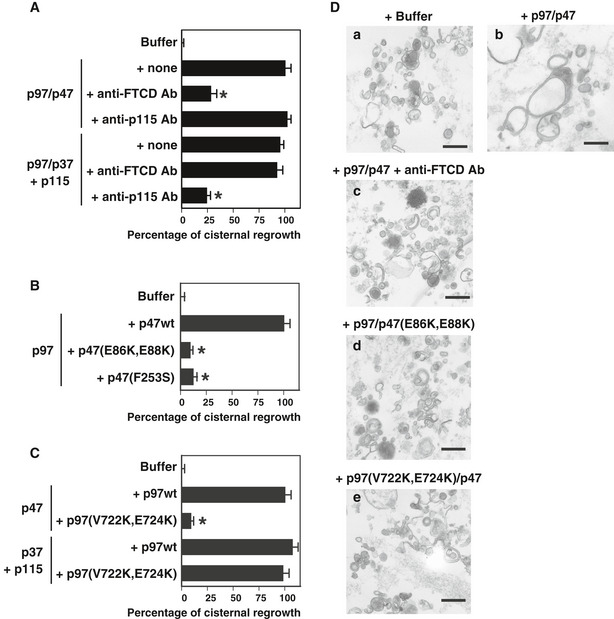
- Anti‐FTCD antibodies inhibit p97/p47‐mediated Golgi membrane fusion. Golgi fragments were mixed with the indicated components (p97, 60 μg/ml; p47, 30 μg/ml; p37, 24 μg/ml; p115, 40 μg/ml) together with either anti‐FTCD or anti‐p115 antibodies. Results are expressed as mean ± SD of five sets of independent experiments; 0% and 100% represent the buffer only (25.9% in cisternal membranes) and p97/p47 with no antibodies (“+ none”, 48.8%), respectively. Asterisks indicate a significant difference at P < 0.01 compared with the no antibody groups (“+none”; Bonferroni method).
- p47(E86K, E88K), which lacks binding affinity to FTCD, does not function in p97/p47‐mediated Golgi membrane fusion. Golgi fragments were incubated with p97 (60 μg/ml) and p47wt/mutant (30 μg/ml). Data are shown as the mean ± SD of five sets of independent experiments; 0 and 100% represent the buffer only (27.3% in cisternal membranes) and p97 + p47wt (“+p47wt”, 50.9%), respectively. Asterisks indicate a significant difference at P < 0.01 compared with the group in which p47wt as well as p97 were added (“+p47wt”; Bonferroni method).
- p97(V722K, E724K), which lacks binding affinity to FTCD, does not function in p97/p47‐mediated Golgi membrane fusion. Golgi fragments were incubated with the following components: p97wt/mutant, 60 μg/ml; p47, 30 μg/ml; p37, 24 μg/ml; and p115, 40 μg/ml. Data are shown as the mean ± SD of five sets of independent experiments; 0% and 100% represent the buffer only (29.5% in cisternal membranes), and p47 + p97wt (“+p97wt”. 57.5%), respectively. An asterisk indicates a significant difference at P < 0.01 compared with the group in which p97wt as well as p47 were added (“+p97wt”; Bonferroni method).
- Panels a–e show representative EM images. Scale bar = 0.5 μm.
As presented in Figs 1F and 2E, we designed p47 and p97 mutants that are deficient in binding affinities to FTCD, namely p47(E86K, E88K) and p97(V722K, E724K). We also reported that p47(F253S) lacks the binding affinity to p97 (Kaneko et al, 2010). We used these mutants in the in vitro Golgi reassembly assay. p47(E86K, E88K) and p47(F253S) were able to only very slightly induce p97/p47‐mediated cisternal regrowth (Fig 6B and D, panel d). p97(V722K, E724K) also only very slightly induced p97/p47‐mediated cisternal regrowth, whereas it is still functional in p97/p37‐mediated cisternal regrowth (Fig 6C and D, panel e). These results demonstrate that p97/p47‐mediated Golgi membrane fusion requires all of the bindings between FTCD and p47, p47, and p97, and p97 and FTCD.
Two FTCD octamers and the p97/p47 complex form a quaternary complex
We previously reported that p97 directly binds to the C‐terminal half of p47 (Kondo et al, 1997; Uchiyama et al, 2002), whereas in the present study we found that FTCD binds to the N‐terminal half of p47 (Fig 1A). Hence, FTCD is not thought to compete with p97 for its binding to p47. Similarly, as FTCD and p47 bind to the C‐terminal and N‐terminal regions of p97, respectively (Fig 2C), FTCD is unlikely to compete with p47 for its binding to p97. In fact, in the biochemical binding experiments using p97 and p47 mutants, the binding affinities of FTCD to p47 and p97 were never reduced by the formation of the p97/p47 complex, or rather the binding affinity between FTCD and p47 was enhanced (Fig EV1A). Taking into account all this information, we hypothesized that two molecules of FTCD can bind to a p97/p47 complex to form a quaternary complex, which is supported by the stoichiometric analysis of the complex comprising FTCD, p47, and p97 (Fig EV1D).
To verify this hypothesis, His‐tagged FTCD was immobilized on beads (His‐FTCD‐beads) and incubated with Flag‐tagged FTCD in the presence or absence of p97 and p47. Flag‐tagged FTCD was coprecipitated with the His‐FTCD‐beads when p97 and p47 were added together (Fig 7A, top panel, lane 4), suggesting the existence of a quaternary complex consisting two molecules of FTCD and a p97/p47 complex. The amount of bound p47 was increased in the presence of p97 (Fig 7A, the third panel, lane 4), which is confirmed by the binding experiment using p97 and p47 mutants (Fig EV1A).
Figure 7. Two molecules of FTCD are tethered by the p97/p47 complex.
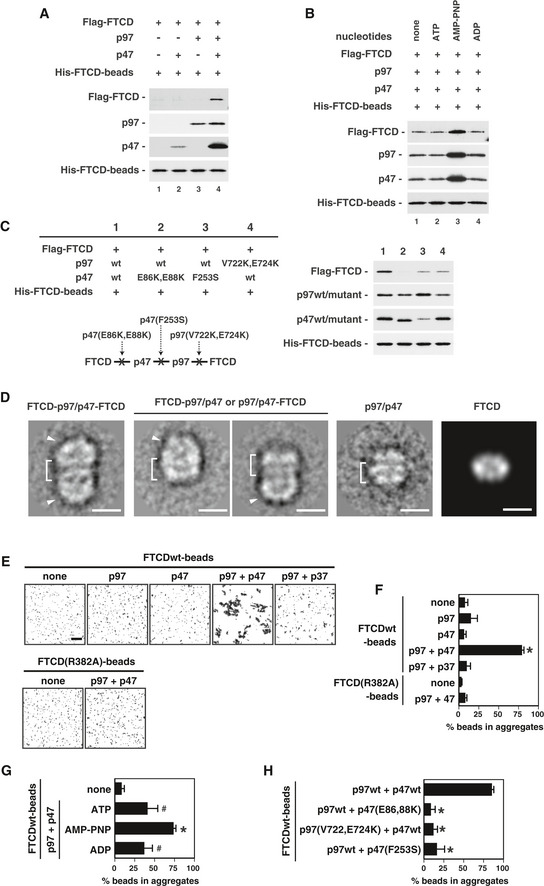
- Two sets of FTCD molecules and a p97/p47 complex form a quaternary complex. His‐tagged FTCD was biotinylated and immobilized on streptavidin beads (His‐FTCD‐beads). The beads (1.0 μg) were incubated with Flag‐tagged FTCD (2.0 μg) in the absence or presence of p47 (1.0 μg) and p97 (2.0 μg). The blots were probed with HRP‐conjugated avidin and antibodies to Flag‐tag, p97 and p47.
- Formation of the quaternary complex in the presence of nucleotides. His‐FTCD‐beads (1.0 μg) were incubated with Flag‐tagged FTCD (2.0 μg), p97 (2.0 μg) and p47 (1.0 μg) in the presence of nucleotides (1 mM). The blots were probed as described in (A).
- Mutants that lack binding affinity disrupt the formation of the quaternary complex. His‐FTCD‐beads (1.0 μg) and Flag‐tagged FTCD (2.0 μg) were incubated in the presence of AMP‐PNP together with p97wt/mutant (2.0 μg) and p47wt/mutant (1.0 μg). The blots were probed as described in (A).
- Negative stain electron microscopy of the quaternary complex. The panels show class averages of centered and aligned negative stain particles for the different populations present within the dataset, i.e., the full quaternary complex FTCD‐p97/p47‐FTCD (left panel), and its partial complexes (two variations, middle two panels). Class averages contain approximately 20 images per class. A class average showing a p97/p47 side view from cryo‐EM data and a projection generated from FTCD structure (PDB code 1TT9) have been included for comparisons. Brackets and arrow heads indicate the p97 hexamer and the FTCD octamer, respectively. Scale bar = 15 nm.
- FTCDwt‐beads are aggregated in the presence of both p97 and p47. Biotinylated FTCDwt and FTCD(R382A) were immobilized on streptavidin magnetic beads to form FTCDwt‐beads and FTCD(R382A)‐beads, respectively. The beads were incubated with the indicated proteins (p97, 0.1 μg/μl; p47, 0.1 μg/μl; p37, 0.1 μg/μl) in the presence of AMP‐PNP (1 mM) and observed under a bright‐field microscope. Scale bar = 50 μm.
- The results of quantification of (E). The percentages of beads in the aggregates were calculated. Results are expressed as the mean ± SD of 10 sets of independent experiments. An asterisk indicates a significant difference at P < 0.01 compared with the others (Bonferroni method).
- p97/p47‐mediated aggregation of FTCDwt‐beads is nucleotide‐dependent. FTCDwt‐beads were incubated together with p97 (0.1 μg/μl) and p47 (0.1 μg/μl) in the presence of the indicated nucleotides (1 mM). The representative images are presented in Fig EV1E. Data are shown as the mean ± SD of nine sets of independent experiments. An asterisk and hash tags indicate significant differences at P < 0.01 compared with the others and the negative control (“none”), respectively (Bonferroni method).
- p47 and p97 mutants that lack binding affinity inhibit p97/p47‐mediated aggregation of FTCDwt‐beads. FTCDwt‐beads were incubated with p97wt/mutant (0.1 μg/μl) and p47wt/mutants (0.1 μg/μl) in the presence of AMP‐PNP. The representative images are presented in Fig EV1F. Data are shown as the mean ± SD of nine sets of independent experiments. Asterisks indicate a significant difference at P < 0.01 compared with the positive control (“p97wt + p47wt”; Bonferroni method).
Source data are available online for this figure.
We also investigated the effect of nucleotides on the formation of this quaternary complex. The amount of Flag‐tagged FTCD, p97, and p47 bound to the His‐FTCD‐beads was increased by the addition of AMP‐PNP (Fig 7B, lane 3), indicating that the formation of the quaternary complex might be enhanced in the presence of AMP‐PNP.
Next, we tested the various mutants that abolished the binding between either FTCD and p47, FTCD, and p97, or p97 and p47. The addition of p47(E86K, E88K), which lacks FTCD‐binding ability, blocked the binding of Flag‐tagged FTCD to the beads (Fig 7C, top panel, lane 2), which suggests that the direct binding of FTCD to p47 is necessary for the quaternary complex formation. p47(E86K, E88K) still precipitated with the beads (Fig 7C, the third panel, lane 2), presumably owing to its association with the p97, which bound directly to the FTCD on the beads. Similarly, p47(F253S), which lacks p97‐binding ability, and p97(V722K, E724K), which lacks FTCD‐binding ability, reduced the amount of precipitated Flag‐tagged FTCD (Fig 7C, top panel, lanes 3 and 4), indicating that the formation of the quaternary complex requires the direct bindings of p47 with p97 and p97 with FTCD. The small amount of p47(F253S) bound to the beads (Fig 7C, the third panel, lane 3) may be explained by the observation that the binding affinity between p47 and FTCD was decreased in the absence of p97 (Figs 7A and EV1A). Summing up all of these results, the formation of the quaternary complex requires the direct protein–protein interactions between FTCD and p47, p47, and p97, and p97 and FTCD.
Moreover, we analyzed the quaternary complex using negative stain electron microscopy, as shown in Fig 7D. The majority of particles were large rectangular particles of approximately 260 Å in length and 140 Å in width. Classification and averaging of similar particles yielded class averages (Fig 7D, left panel) in which the distinctive p97 side view is clearly visible (Fig 7D, brackets). Meanwhile, dimensions of the two densities vertically stacked on either side of the p97 side view are consistent with the side views of the FTCD octamer or FTCD bound to p47 (Mao et al, 2004). This corresponds to the binding of two FTCD molecules, i.e., one below and one above the p97/p47 complex. Analysis of the data also revealed a subpopulation of particles which ranged between 200 and 150 Å in length. Again, p97 side views are clearly visible in these particles (Fig 7D, middle two panels); however, with only one extra density attributed to FTCD, they represent partial complexes, where only one FTCD molecule is bound. Within this subpopulation, two subsets of particles are present with variability in the density attributed to the FTCD molecule, most likely accounting for the difference in binding between FTCD to the C‐terminal of p97 and FTCD to the N‐terminal of p97 via p47.
Two molecules of FTCD are tethered by the p97/p47 complex
We next aimed to confirm the above finding that two molecules of FTCD are tethered by a p97/p47 complex in the quaternary complex and performed the in vitro tethering assay using His‐FTCDwt‐immobilized beads (Figs 7E and F). The addition of either p97 or p47 to the beads did not cause aggregation of the beads (Fig 7E, top panels 2 and 3). Aggregation of the beads was only observed when p97 and p47 were added together to the beads (Fig 7E, top panel 4; Fig 7F). When p37 was added instead of p47 together with p97, the beads were not aggregated (Fig 7E, top panel 5). His‐FTCD(R382A)‐immobilized beads were not aggregated by the addition of p97 and p47 (Fig 7E, bottom panel 2). These results strongly suggest that two molecules of FTCD are tethered by the p97/p47 complex.
We also tested the effects of the addition of various nucleotides to the incubation buffer of the in vitro tethering assay (Figs 7G and EV1E). Although aggregated beads were still observed even in the presence of either ATP or ADP (Fig EV1E, panels 2 and 4), the degree of aggregation was most robustly increased by the addition of AMP‐PNP (Figs 7G and EV1E, panel 3).
We next tested the effects of various p97 and p47 mutants on aggregation of the beads (Figs 7H and EV1F). The addition of either p47(E86K, E88K) or p97(V722K, E724K), which lack FTCD‐binding affinity, decreased the amount of aggregated beads (Figs 7H and EV1F, panels 2 and 3). p47(F253S), which lacks binding to p97, diminished the aggregation of the beads (Figs 7H and EV1F, panel 4). These data demonstrate that the tethering of two FTCD molecules mediated by the p97/p47 complex requires all the bindings of FTCD and p47, p47, and p97, and p97 and FTCD, which is consistent with the results of the in vitro Golgi reassembly assay (Fig 6).
FTCD acts as a tethering factor in cooperation with the p97/p47 complex in living cells
The in vitro tethering assay using beads demonstrated that the big tethering complex FTCD‐p97/p47‐FTCD is formed when FTCD is accessible to the p97/p47 complex. This leads to the notion that the two membranes where FTCD is located can be tethered by the p97/p47 complex. To verify this notion in living cells, we used mitochondria instead of beads to set up the in vivo tethering assay, which we named the in vivo mitochondria aggregation assay. There are several reasons why we chose mitochondria in this assay. Mitochondria display a distinctive location and are distributed throughout the cells. In addition, endogenous FTCD is not found in mitochondria, and neither p97 nor p47 has been reported to function in mitochondria.
For the targeting of FTCD to the outer mitochondrial membrane, the C‐terminal transmembrane domain of monoamine oxidase (MAO) was connected to the C‐terminus of FTCD via an HA‐tag (FTCD‐HA‐MAO) (Mitoma & Ito, 1992; Wong & Munro, 2014). The HeLa cell line inducibly expressing either FTCDwt‐HA‐MAO or FTCD(R382A)‐HA‐MAO has been established using the Tet‐off gene expression system. As shown in Fig 8A, either FTCDwt‐HA‐MAO or FTCD(R382A)‐HA‐MAO was expressed by the depletion of doxycycline (DOX), a stable tetracycline analogue, from the growth medium (also refer to Fig EV2A), and was localized to mitochondria (panels e and j). The expression of FTCDwt‐HA‐MAO caused robust changes in the distribution of mitochondria (Fig 8A, panel c; Fig EV2B, panel c), although it did not change the size of the cell (Fig EV2B, panel d). Mitochondria were aggregated around the nucleus and were rarely observed in the peripheral region of the cell. Interestingly, aggregated mitochondria were located close to the Golgi, and, in some cells, they were partially intermixed with the Golgi, resulting in the Golgi being somewhat dispersed (Fig EV3). In contrast, the expression of FTCD(R382A)‐HA‐MAO did not cause any changes in mitochondria distribution (Fig 8A, panel h). The quantitative data in Fig 8B show that the ratio of the cells with aggregated mitochondria was significantly increased by the expression of FTCDwt‐HA‐MAO, but not by the expression of FTCD(R382A)‐HA‐MAO.
Figure 8. FTCD works as a tethering factor in cooperation with the p97/p47 complex in living cells.
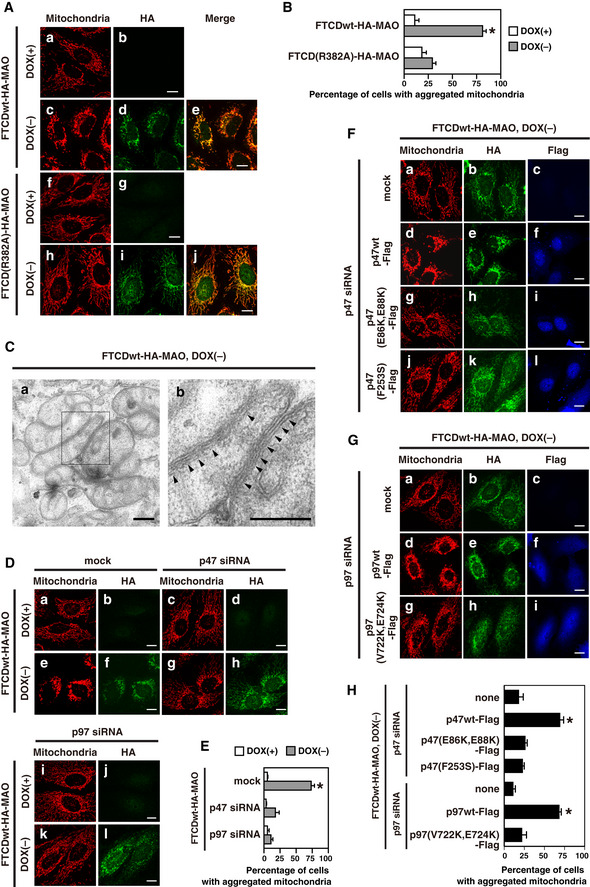
- The expression of FTCDwt‐HA‐MAO causes the aggregation of mitochondria. HeLa Tet‐off cells inducibly expressing either FTCDwt‐HA‐MAO or FTCD(R382A)‐HA‐MAO were cultured in DOX‐free medium for 48 h. Cells which were cultured in the DOX‐containing medium were used as a control. The cells were fixed and stained with a monoclonal antibody to mitochondria and a polyclonal antibody to HA, followed by observation by confocal microscopy. Panels a–j display representative images. Scale bar = 10 μm.
- The results of quantification of (A). Results are shown as the mean ± SD of five sets of independent experiments, with 100 cells counted in each group in each independent experiment. An asterisk indicates a significant difference at P < 0.01 compared with the others (Bonferroni method).
- Representative EM images of a cell expressing FTCDwt‐HA‐MAO. The HeLa Tet‐off cells inducibly expressing FTCDwt‐HA‐MAO were cultured for 48 h in the absence of DOX and used for EM observation. Panel b displays the inset in panel a. Arrowheads show narrow gaps between mitochondria. Scale bar = 0.2 μm. The low magnification image is presented in Fig EV2C.
- Endogenous p47 and p97 are necessary for mitochondria aggregation mediated by FTCDwt‐HA‐MAO. HeLa Tet‐off cells inducibly expressing FTCDwt‐HA‐MAO were transfected with either mock, p47 siRNA or p97 siRNA duplexes and cultured for 24 h. The cells were further cultured in DOX‐free medium for 48 h for the induction of FTCDwt‐HA‐MAO, and then analyzed as in (A). Panels a–l display representative images. Scale bar = 10 μm.
- The results of quantification of (D). Results are shown as the mean ± SD of five sets of independent experiments, with 100 cells counted in each group in each independent experiment. An asterisk indicates a significant difference at P < 0.01 compared with the others (Bonferroni method).
- Binding between FTCD and p47 and between p47 and p97 is necessary for mitochondria aggregation mediated by FTCDwt‐HA‐MAO. The HeLa Tet‐off cells inducibly expressing FTCDwt‐HA‐MAO were transfected with mammalian expression constructs of siRNA‐insensitive Flag‐tagged p47wt/mutants at the same time as the treatment of p47 siRNA and cultured for 24 h. The cells were further cultured in DOX‐free medium for 48 h for the induction of FTCD‐HA‐MAO. After fixation, the cells were visualized with a monoclonal antibody to mitochondria and polyclonal antibodies to HA and Flag. Panels a–l display representative images. Scale bar = 10 μm.
- Binding between FTCD and p97 is necessary for mitochondria aggregation mediated by FTCDwt‐HA‐MAO. The HeLa Tet‐off cells inducibly expressing FTCDwt‐HA‐MAO were transfected with the mammalian expression construct of siRNA‐insensitive Flag‐tagged p97wt/mutant at the same time as treatment with p97 siRNA. The following procedures were the same as in (F). Panels a–i display representative images. Scale bar = 10 μm.
- The results of quantification of (F) and (G). Results are shown as the mean ± SD of five sets of independent experiments, with 100 cells counted in each group in each independent experiment. Asterisks indicate a significant difference at P < 0.01 compared with siRNA treatment alone (“none”) and compared with mutant expression (Bonferroni method).
Figure EV2. HeLa Tet‐off cells inducibly expressing either FTCDwt‐HA‐MAO or FTCD(R382A).
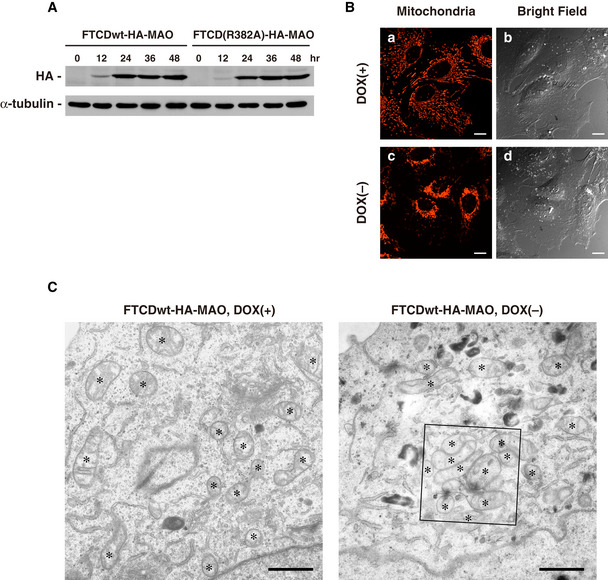
- Time course of the expression of either FTCDwt‐HA‐MAO or FTCD(R382A)‐HA‐MAO in Tet‐off HeLa cells. HeLa Tet‐off cells inducibly expressing either FTCDwt‐HA‐MAO or FTCD(R382A)‐HA‐MAO were cultured in DOX‐free medium for the indicated times. The cells were trypsinized immediately before the medium change. Their expression levels were determined by Western blotting with antibodies to their HA‐tags. The expression level was very low at the 12‐h time point and reached a maximum at the 24‐h time point.
- Images of cells expressing FTCDwt‐HA‐MAO. The HeLa Tet‐off cells inducibly expressing FTCDwt‐HA‐MAO were cultured for 48 h in the presence or absence of DOX. Living cells were stained with MitoTracker for the visualization of the mitochondria and observed by confocal microscopy and differential interference contrast microscopy. The cells were incubated in a stage top CO2 incubator during the observation. Scale bar = 10 μm. The expression of FTCDwt‐HA‐MAO had no effect on the size of the cell, but caused mitochondria aggregation. Mitochondria were aggregated around the nucleus and were rarely observed in the peripheral region of cells.
- Representative EM images of a cell expressing FTCDwt‐HA‐MAO. The HeLa Tet‐off cells inducibly expressing FTCDwt‐HA‐MAO were cultured for 48 h in the presence or absence of DOX and used for EM observation. The asterisks show mitochondria. Scale bar = 1 μm. The inset is presented in Fig 8C (panel a).
Figure EV3. Aggregated mitochondria were located close to the Golgi and were partially intermixed with the Golgi in the in vivo mitochondria aggregation assay.
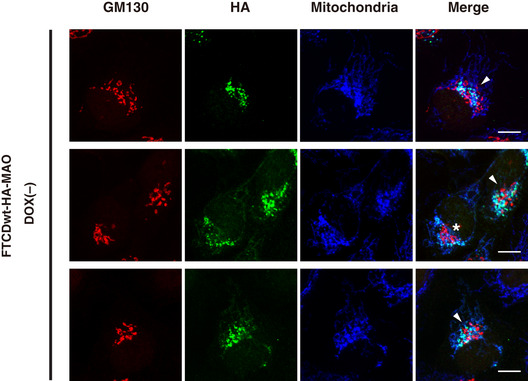
HeLa Tet‐off cells inducibly expressing FTCDwt‐HA‐MAO were cultured in DOX‐free medium for 24 h. The cells were fixed, stained with a monoclonal antibody to mitochondria and polyclonal antibodies to GM130 and HA, and observed by confocal microscopy. Scale bar = 10 μm. The asterisk shows that aggregated mitochondria surround the Golgi. The arrowheads indicate aggregated mitochondria, which are partially intermixed with the Golgi, and consequently, the Golgi is somewhat dispersed.
We furthermore investigated the ultrastructures of the aggregated mitochondria induced by the expression of FTCDwt‐HA‐MAO. Electron microscopic images are presented in Figs 8C and EV2C. In the aggregated mitochondria cluster, mitochondria were adhered closely to each other in a very narrow gap and no additional membrane component was found between them (Fig 8C, panel b, arrowheads). This indicates that the mitochondria aggregation is caused by the direct tethering between mitochondria, which may be achieved by FTCD‐containing tether protein complexes.
Up to this point, we have demonstrated that the FTCD located in mitochondria causes the aggregation of mitochondria in living cells. As the expression of the FTCD(R382A) mutant, which has low binding affinity to both p47 and p97, did not cause the aggregation of mitochondria, it is possible that the FTCD may cooperate with p47 and p97 to cause mitochondria aggregation. We then tested whether p97 and p47 function in mitochondria aggregation mediated by the FTCD located in mitochondria. For this purpose, either endogenous p47 or p97 had been depleted by siRNA treatment when FTCDwt‐HA‐MAO was expressed (refer to Fig EV4A and B). As shown in Fig 8D and E, the depletion of either endogenous p47 or p97 suppressed FTCD‐mediated mitochondria aggregation (Fig 8D, panels g and k). This indicates that the FTCD located in mitochondria cooperates with p47 and p97 for the aggregation of mitochondria.
Figure EV4. The siRNA treatment specific to p47, p97, and vimentin in the mitochondria aggregation assay.
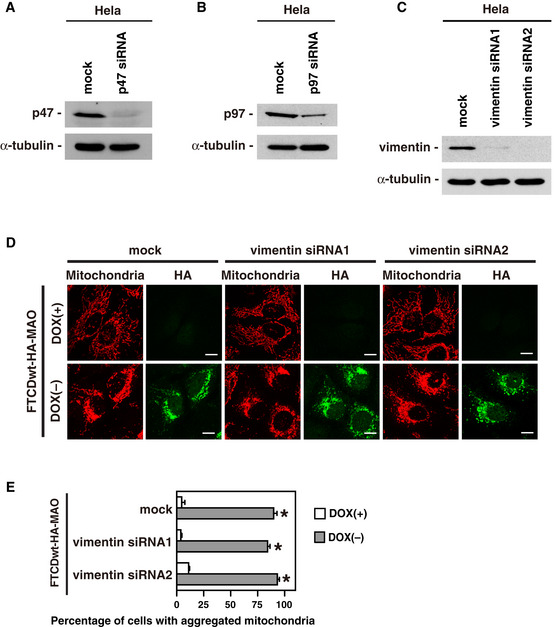
- Depletion of p47 by p47 siRNA duplexes. HeLa cells were either mock transfected with water or transfected with siRNA duplexes specific to human p47. After incubation for 48 h, the cells were analyzed by Western blotting with antibodies to p47 and α‐tubulin.
- Depletion of p97 by p97 siRNA duplexes. HeLa cells were either mock transfected with water or transfected with siRNA duplexes specific to human p97. After incubation for 48 h, the cells were analyzed by Western blotting with antibodies to p97 and α‐tubulin.
- Depletion of vimentin by vimentin siRNA duplexes. Human vimentin was targeted with the following independent siRNAs: 5′‐CUGAGUACCGGAGACAGGUdTdT‐3′ (vimentin siRNA1) and 5′‐ GGAUUCACUCCCUCUGGUUdTdT‐3′ (vimentin siRNA2). HeLa cells were either mock transfected with water or transfected with siRNA duplexes (2.5 nM) specific to human vimentin. After incubation for 48 h, the cells were analyzed by Western blotting with antibodies to vimentin (V9, Sigma) and α‐tubulin.
- Endogenous vimentin is unnecessary for mitochondria aggregation mediated by FTCDwt‐HA‐MAO. HeLa Tet‐off cells inducibly expressing FTCDwt‐HA‐MAO were transfected with either mock, vimentin siRNA1, or vimentin siRNA2 duplexes and cultured for 24 h. The cells were further cultured in DOX‐free medium for 48 h for the induction of FTCDwt‐HA‐MAO and then analyzed as in Fig 8D. Scale bar = 10 μm.
- The results of quantification of (D). Results are shown as the mean ± SD of five sets of independent experiments, with 100 cells counted in each group in each independent experiment. Asterisks indicate a significant difference at P < 0.01 compared with each DOX(+) group (Bonferroni method).
To further confirm this finding, we tested the various mutants that abolished the binding between either FTCD and p47, p47, and p97, or p97 and FTCD in the in vivo mitochondria aggregation assay. As the FTCD‐mediated mitochondria aggregation was suppressed by the depletion of either endogenous p47 or p97 (Fig 8D), we investigated whether the expression of p47 or p97 mutants could restore this suppression. We first tested two p47 mutants, p47(E86K, E88K) and p47(F253S), which lack binding affinity to FTCD and to p97, respectively (Fig 8F and H). The HeLa Tet‐off cells inducibly expressing FTCDwt‐HA‐MAO were transfected with the mammalian expression constructs of siRNA‐insensitive Flag‐tagged p47wt/mutants at the same time as their treatment of p47 siRNA and were cultured for 24 h. The cells were further cultured in DOX‐free medium for 48 h for the induction of FTCD‐HA‐MAO. The expression of p47wt‐Flag restored mitochondria aggregation in p47‐depleted cells (Fig 8F, panel d), whereas that of either p47(E86K, E88K)‐Flag or p47(F253S)‐Flag did not (Fig 8F, panels g and j). These data indicate that mitochondria aggregation mediated by the FTCD located in mitochondria requires the bindings between FTCD and p47 and between p47 and p97. We also tested the expression of the siRNA‐insensitive Flag‐tagged p97wt/mutant in p97‐depleted cells in a similar fashion (Fig 8G and H). The expression of p97wt‐Flag restored mitochondria aggregation in p97‐depleted cells (Fig 8G, panel d). In contrast, the expression of p97(V722K, E724K)‐Flag, which lacks the binding affinity to FTCD, did not restore the mitochondria aggregation (Fig 8G, panel g), indicating that the binding between FTCD and p97 is necessary for mitochondria aggregation caused by the FTCD located in mitochondria.
We have shown using the in vitro beads aggregation assay that the FTCD‐p97/p47‐FTCD complex is sufficient to tether the beads (Fig 7E–H). Considering this in vitro result, mitochondria aggregation mediated by the FTCD located in mitochondria is thought to be caused via the formation of the FTCD‐p97/p47‐FTCD complex. This means that the FTCD‐p97/p47‐FTCD complex can function as a tethering machinery of membranes in living cells.
FTCD‐mediated tether is formed at the end of mitosis
p47, which has two nuclear localization signals in its peptide sequence, is mainly localized to the nucleus during interphase (Uchiyama et al, 2003). When a cell enters mitosis, p47 moves to the cytoplasm, and p97/p47‐mediated Golgi membrane fusion occurs to reassemble the Golgi at mitosis (Uchiyama et al, 2006). These previous observations of ours resulted in the following question: Does the FTCD located in mitochondria cause mitochondria aggregation during mitosis?
To address this issue, mitotic cells were collected from HeLa Tet‐off cells in which either FTCDwt‐HA‐MAO or FTCD(R382A)‐HA‐MAO had been induced for 24 h. The mitotic cells were further cultured for 4 h before fixation to enable complete cytokinesis (Fig 9A and B). The expression of either FTCDwt‐HA‐MAO or FTCD(R382A)‐HA‐MAO had little effect on cell cycle progression. When FTCDwt‐HA‐MAO was expressed, more than 80% of the cells had aggregated mitochondria after undergoing mitosis (Fig 9A panel a; Fig 9B). In the case of FTCD(R382A)‐HA‐MAO, postmitotic cells rarely showed aggregated mitochondria (Fig 9A, panel b; Fig 9B). In this experiment, cells in which FTCDwt‐HA‐MAO was expressed for 28 h without synchronization were used as the asynchronous control group. The expression level of FTCD‐HA‐MAO was very low at 12 h after the start of induction and reached a maximum at 24 h (Fig EV2A). It is, hence, estimated that most cells in the asynchronous control group entered mitosis with a lower expression level of FTCDwt‐HA‐MAO. In this asynchronous control group, only 25% of cells were found to have aggregated mitochondria (Fig 9A panel c; Fig 9B). These results suggested the possibility that the FTCD‐mediated tether might be formed at mitosis.
Figure 9. FTCD‐mediated tether is formed at the end of mitosis.
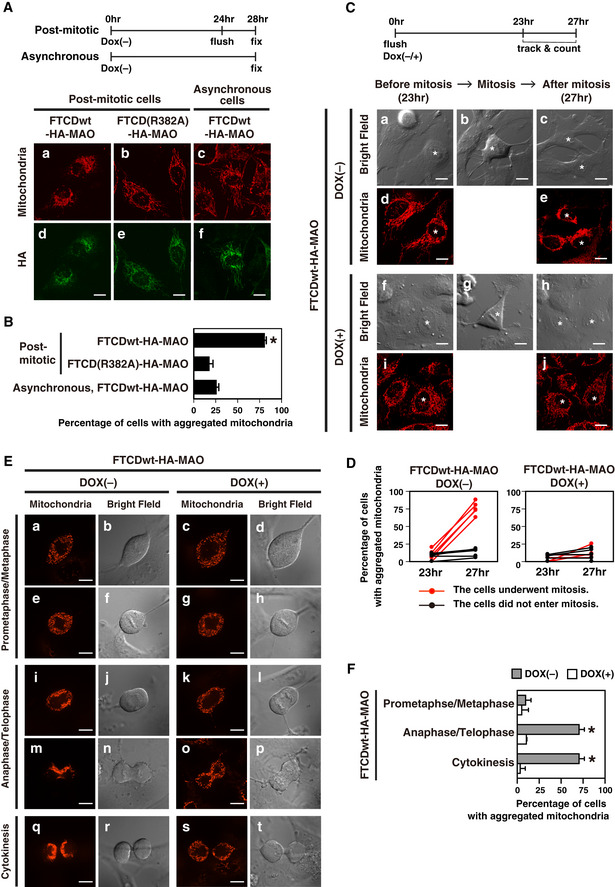
- FTCD located in mitochondria causes mitochondria aggregation during mitosis. Mitotic cells were collected by flushing from HeLa Tet‐off cells in which either FTCDwt‐HA‐MAO or FTCD(R382A)‐HA‐MAO had been induced for 24 h. The mitotic cells were further cultured for 4 h to enable complete cytokinesis. Cells in which FTCDwt‐HA‐MAO was induced for 28 h without synchronization were used as the asynchronous control group. Cells were fixed and visualized with a monoclonal antibody to mitochondria and a polyclonal antibody to HA. Panels a–f display representative images. Scale bar = 10 μm.
- The results of quantification of (A). Results are shown as the mean ± SD of seven sets of independent experiments, with 100 cells counted in each group in each independent experiment. An asterisk indicates a significant difference at P < 0.01 compared with the others (Bonferroni method).
- A single living cell expressing FTCDwt‐HA‐MAO was tracked during mitosis. Mitotic cells were collected by flushing from the HeLa Tet‐off cells inducibly expressing FTCDwt‐HA‐MAO and cultured in the absence or presence of DOX. The cells were stained with MitoTracker at the 22‐h time point, and confocal images of 30–40 cells were randomly taken at the 23‐h time point. From the 23‐ to 27‐h time point, cells were tracked in the bright field every 30 min. At the 27‐h time point, confocal images were taken of the 21–38 cells that were successfully tracked. Panels a–j display representative images. Asterisks indicate the tracked cells. Scale bar = 10 μm.
- The results of quantification of (C). The experiment was repeated five times and each line shows the average percentage of an independent experiment. The percentages of cells that underwent mitosis are as follows: 41.5% in the DOX(−) group and 54.7% in the DOX(+) group.
- FTCD located in mitochondria causes mitochondria aggregation at the end of mitosis. Mitotic cells were collected from the HeLa Tet‐off cells inducibly expressing FTCDwt‐HA‐MAO and cultured in the absence or presence of DOX as in (C). Cells were stained with MitoTracker at the 23‐h time point and observed by confocal microscopy from the 24‐ to 26‐h time point. Panels a–t display representative images. Scale bar = 10 μm.
- The results of quantification of (E). Cells were classified by their cell cycle phases into the following three categories: prometaphase/metaphase, anaphase/telophase, and cytokinesis. Results are shown as the mean ± SD of three sets of independent experiments, with 10–14 cells counted in each group in each independent experiment. Asterisks indicate a significant difference at P < 0.01 compared with the DOX(+) group and with the prometaphase/metaphase category (Bonferroni method).
To investigate this possibility, we tracked single living cells expressing FTCDwt‐HA‐MAO. Briefly, mitotic cells were collected by flushing and cultured in DOX‐free medium for the induction of FTCDwt‐HA‐MAO. The cells were tracked and observed every 30 min from 23 h until 27 h after flushing. Cells in which the expression of FTCDwt‐HA‐MAO was not induced were used as a control. We succeeded in tracking 21–38 cells in each experiment and repeated the experiment five times. In the presence or absence of the induction of FTCDwt‐HA‐MAO, there was little difference in the ratios of the cells that underwent mitosis during the observation, i.e., 41.5% in the DOX(−) group and 54.7% in the DOX(+) group. As presented in Fig 9C, mitochondria aggregation in the FTCDwt‐HA‐MAO‐induced cells occurred during mitosis (panels c and e). In contrast, mitochondria aggregation was rarely observed in the absence of the FTCDwt‐HA‐MAO expression, even after the cells had undergone mitosis (Fig 9C, panels h and j). We also tracked single living cells expressing FTCD(R382A)‐HA‐MAO and found that mitochondria aggregation was not observed after mitosis (Fig EV5A and B).
Figure EV5. FTCD(R382A)‐HA‐MAO expression did not cause mitochondria aggregation during mitosis.
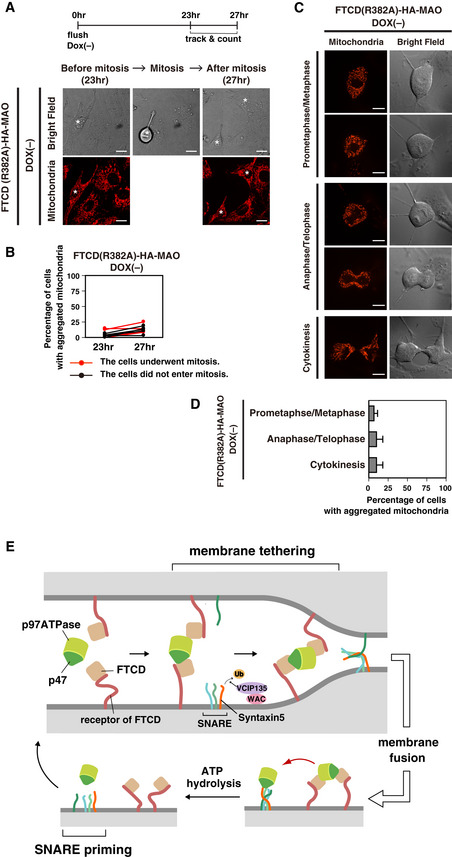
- A single living cell expressing FTCD(R382A)‐HA‐MAO was tracked during mitosis. Mitotic cells were collected by flushing from HeLa Tet‐off cells inducibly expressing FTCD(R382A)‐HA‐MAO and cultured in DOX‐free medium. The cells were stained with MitoTracker at the 22‐h time point, and confocal images of 30–40 cells were randomly taken at the 23‐h time point. From the 23‐ to 27‐h time point, cells were tracked in the bright field every 30 min. At the 27‐h time point, the confocal images of the 23–39 cells that were successfully tracked were taken. Asterisks indicate the tracked cells. Scale bar = 10 μm.
- The results of quantification of (A). The experiment was repeated five times and each line shows the average percentage of an independent experiment.
- In the FTCD(R382A)‐HA‐MAO‐expressed cells, mitochondria aggregation was rarely observed during mitosis. Mitotic cells were collected from HeLa Tet‐off cells inducibly expressing FTCD(R382A)‐HA‐MAO and cultured in DOX‐free medium. The cells were stained with MitoTracker at the 23‐h time point and observed by confocal microscopy from the 24‐ to 26‐h time point. Scale bar = 10 μm.
- The results of quantification of (C). Cells were classified by their cell cycle phases into the following three categories: prometaphase/metaphase, anaphase/telophase, and cytokinesis. The values are from three sets of independent experiments. The results are shown as the mean ± SD of three sets of independent experiments, with 10 cells counted for each category in each independent experiment.
- The p97/p47 complex plays the dual roles of membrane tethering and SNARE priming in the membrane fusion process. Prior to membrane fusion, the p97/p47 complex tethers two equal Golgi fragments by forming FTCD‐p97/p47‐FTCD complex. After membrane fusion, the tethering complex is dissociated and then the p97/p47 complex is utilized for SNARE priming.
The results of the quantification are presented in Fig 9D. In the presence of FTCDwt‐HA‐MAO expression, the ratio of the cells that had aggregated mitochondria was remarkably increased after mitosis, an average of 8.9% (23 h) and 75.3% (27 h; Fig 9D, left panel, red lines). Even in the presence of the FTCDwt‐HA‐MAO expression, when the cells had not entered mitosis during the observation, the ratio of the cells with aggregated mitochondria was only slightly increased, an average of 7.8% (23 h) and 12.6% (27 h; Fig 9D, left panel, black lines). In the case that FTCDwt‐HA‐MAO was not expressed, there was almost no increase in the ratio of cells with aggregated mitochondria even after they had undergone mitosis, an average of 6.4% (23 h) and 13.5% (27 h; Fig 9D, right panel, red lines). These observations strongly support that the FTCD‐mediated tether causes mitochondria aggregation during mitosis, which is consistent with the results presented in Fig 9A and B.
p97/p47‐mediated Golgi membrane fusion was reported to be specific to the Golgi reassembly at the end of mitosis; it is blocked at prometaphase/metaphase by the phosphorylation of p47 (Uchiyama et al, 2003). We therefore aimed to clarify whether FTCD‐mediated mitochondria aggregation occurred at the end of mitosis. As shown in Fig 9E and F, mitochondria aggregation was not caused at prometaphase/metaphase (panels a and e), whereas it was observed at anaphase/telophase and at cytokinesis (panels i, m and q).
Considering all of the in vivo data, we conclude that the FTCD‐mediated membrane tether is formed at the end of mitosis, which is consistent with the cell cycle‐dependent regulation of p97/p47‐mediated membrane fusion.
Discussion
SNARE priming is important for membrane fusion, and p97ATPase is thought to function in this process, in a similar manner to NSF. Membrane tethering is another essential process for membrane fusion (Brocker et al, 2010). The p97/p37 pathway as well as the NSF pathway requires the p115‐GM130 complex as a tethering complex (Nakamura et al, 1997; Lesa et al, 2000; Uchiyama et al, 2006). In contrast, in the p97/p47 pathway, its tethering system has not yet been clarified (Uchiyama et al, 2006). In this study, we identified FTCD as a novel binding protein to p47 and p97. FTCD directly binds to either p47 or p97 via its association with the polyglutamate motifs in p47 and p97. FTCD localizes to the Golgi and is important for Golgi biogenesis. In particular, FTCD is associated with p47 and p97 in the mitotic Golgi and functions in Golgi reassembly at mitosis, in cooperation with p47 and p97. The in vitro Golgi reassembly assay showed that FTCD is essential for p97/p47‐mediated Golgi membrane fusion via its binding to p47 and to p97. Insights into the function of FTCD in p97/p47‐mediated Golgi membrane fusion have been provided by the several results of biochemical studies and functional assays. Biochemical binding experiments indicated the existence of the FTCD‐p97/p47‐FTCD complex, which is supported by negative staining images of the complex. The in vitro beads aggregation assay demonstrated that this big complex FTCD‐p97/p47‐FTCD works as a tether.
To clarify whether this big complex can tether biological membranes in living cells, we set up the in vivo mitochondria aggregation assay. As a result, expressed FTCDwt‐HA‐MAO caused mitochondria aggregation by forming a complex with endogenous p97 and p47, which indicating that this big complex is sufficient to tether two mitochondrial membranes. Furthermore, the cells expressing FTCDwt‐HA‐MAO exhibited interesting phenotypes; i.e., the aggregated mitochondria were located close to the Golgi and, in some cells, were partially intermixed with the Golgi (Fig EV3). The uneven distribution of the aggregated mitochondria is likely to be a result of the tethers that are formed between the endogenous FTCD in the Golgi and FTCD‐HA‐MAO in mitochondria. Similarly, in the absence of FTCD‐HA‐MAO in mitochondria, because endogenous FTCD is mainly localized to the Golgi, endogenous FTCD must function as a tether of Golgi membranes. Our in vivo mitochondria aggregation assay also demonstrated that FTCD‐mediated tether is formed at the end of mitosis. Summarizing the above, FTCD is thought to tether mitotic Golgi fragments in cooperation with the p97/p47 complex in p97/p47‐mediated Golgi membrane fusion at the end of mitosis.
On the other hand, several lines of evidence indicate that the p97/p47 complex functions in SNARE priming. Firstly, in the p97/p37 pathway, which utilizes the p115‐GM130 complex for the tethering of membranes, the p97/p37 complex functions in SNARE priming via p97‐catalyzed ATP hydrolysis (Uchiyama et al, 2006). As p47 and p37 are very similar in their mode of binding to p97ATPase (Uchiyama et al, 2006), it is reasonable that the p97/p47 complex also functions in SNARE priming. In fact, we previously reported that the p97/p47 complex directly binds to SNAREs, which are essential for p97/p47‐mediated membrane fusion (Rabouille et al, 1998), and the resulting complex is dissociated with the assistance of VCIP135 via p97‐catalyzed ATP hydrolysis (Uchiyama et al, 2002). Therefore, the p97/p47 complex is also thought to function in SNARE priming. This means that the p97/p47 complex plays distinct roles in membrane tethering and SNARE priming, which is schematically demonstrated in Fig EV5E. Although it is unclear at this moment as to why the p97/p47 complex has the dual roles, it is possible to speculate several biological significances. One is that the two key steps, namely membrane tethering and SNARE priming, can be tightly connected. The sharing of a common component, the p97/p47 complex, leads to the spatiotemporal linkage of the two key steps in the membrane fusion process. This dual role of the p97/p47 complex also appears to be reasonable from an evolutional viewpoint, which will be discussed later.
There are also several interesting points regarding the formation of this tethering complex. First, this novel tethering system is consistent with the homotypic membrane fusion function of the p97/p47 pathway. It is suggested from the results of the in vitro Golgi assembly assay that the p97/p47 pathway mediates the homotypic fusion of short tubules and larger vesicles to form unfenestrated cisternae, in contrast to the NSF pathway, which mediates the heterotypic fusion of small vesicles (Rabouille et al, 1995b). This is supported by studies on the membrane fusion function of Cdc48p, which is the yeast homologue of p97 (Latterich et al, 1995). We previously reported in vivo lines of evidence of homotypic membrane fusion mediated by the p97/p47 pathway (Uchiyama et al, 2002). Injection of anti‐p47 antibodies into living cells caused the accumulation of tubules, which are thought to be the starting membrane material for homotypic fusion, but not the accumulation of vesicles, which are required for heterotypic fusion. Injection of anti‐p47 antibodies also decreased the amount of unfenestrated cisternae, which are products of homotypic fusion. Hence, the p97/p47 pathway is thought to mediate homotypic membrane fusion. The novel tether we have reported in this study is in good agreement with the homotypic membrane fusion function of the p97/p47 pathway, because this novel tether enables the p97/p47 complex to bridge two equal Golgi membranes. Indeed, the existence of this tethering system may guarantee as well as enable the p97/p47 complex to perform homotypic membrane fusion.
In addition, the requirement of p47 in the formation of this FTCD tethering complex suggests that its control may be cell cycle‐dependent. p47 has two nuclear localization signals and mainly localizes to the nucleus in interphase cells. Once a cell enters mitosis, p47 moves to the cytoplasm and works in cytoplasmic events. Using the in vivo mitochondria aggregation assay, we actually demonstrated that FTCD‐mediated tethering of membranes works at mitosis and not during interphase. The in vivo assay also showed that FTCD‐mediated tethers are formed at telophase and cytokinesis, but not at prometaphase or metaphase (Fig 9E and F). Why the formation of FTCD‐mediated tethering complexes is suppressed at prometaphase and metaphase is presently unclear. We previously reported that the binding of p47 to Golgi membranes is blocked at prometaphase and metaphase by p47 phosphorylation (Uchiyama et al, 2003). Hence, there is a possibility that mitotically phosphorylated p47 cannot form the tethering complex with FTCD and p97. Alternatively, FTCD (and its receptor in Golgi membranes) may undergo mitotic modifications, such as phosphorylation and ubiquitination, which may be important for the control of tethering complex formation.
The findings that FTCD is a component of the tethering complex suggest several interesting points. Firstly, p47 is a trimer whereas FTCD is an octamer, and owing to symmetry mismatch, it is impossible for all eight subunits of FTCD to interact with all three subunits of p47. Instead, it is probable that one subunit of the FTCD octamer binds to one subunit of the p47 trimer, which probably enables high structural flexibility in their binding. The binding between the FTCD octamer and the p97 hexamer can also be achieved in a similar manner. The tethering complex must take advantage of the high flexibility in the binding between FTCD and p47 and between FTCD and p97 for its tethering function, and this high flexibility may enhance the ability of the p97/p47 complex to capture the target membrane.
The second interesting point is that FTCD is an enzyme involved in the histidine degradation pathway (Findlay & MacKenzie, 1987). FTCD is a bifunctional enzyme of glutamate formiminotransferase (EC 2.1.2.5, the FT domain) and formiminotetrahydrofolate cyclodeaminase (EC 4.3.1.4, the CD domain), which have distinct reaction mechanisms involving the intermediate formino‐tetrahydropteroylpolyglutamate with glutamates (formino‐H4PteGlun). The direct transfer of formino‐H4PteGlun from the FT domain to the CD domain requires anchoring of the intermediate to the enzyme. This anchoring is achieved by the noncovalent binding of polyglutamates in the intermediate to the CD domain (Mao et al, 2004). p47 and p97 have polyglutamate motifs, whereas p37 does not. An FTCD mutant that lacks binding to the polyglutamates shows low binding affinities to p47 and p97. It is, hence, probable that the binding of p97 and p47 with FTCD utilizes the same mechanism as reported in the anchoring of formino‐H4PteGlun to the CD domain during the enzyme reaction. Interestingly, polyglutamylated tubulin in the brain was also reported to utilize the binding ability of FTCD to polyglutamates for its association with FTCD (Bashour & Bloom, 1998).
The third interesting point is that FTCD can interact with the cytoskeleton (Hennig et al, 1998; Gao & Sztul, 2001; Gao et al, 2002). Gao and Sztul (2001) reported that the expression of FTCD in cultured cells resulted in the formation of chimeric FTCD/vimentin fibers originating from the Golgi region. As shown in Fig EV4C–E, we, hence, tested the effects of vimentin siRNA in the in vivo mitochondria aggregation assay and found that the FTCD/p97/p47‐mediated membrane tethering occurred even in the absence of vimentin, indicating that vimentin may not be involved in this tethering system. Nevertheless, it is interesting that FTCD is necessary for these two distinct events of membrane fusion and reconstruction of the cytoskeleton, which suggests that FTCD may be a key molecule spatiotemporally liking these two important events required for Golgi reassembly at mitosis.
The fourth interesting point is the reason why the p97/p47 pathway needs to utilize a nonenzymatic function of FTCD. Our genome database search demonstrated that orthologues of FTCD only exist in vertebrates, similarly to orthologues of VCIP135 and WAC, which are other essential factors of the p97/p47 pathway. It is, hence, plausible that the p97/p47 pathway functions only in vertebrates (Totsukawa et al, 2011). This may be one possible explanation for the nonenzymatic function of FTCD in the p97/p47 pathway. As the p97/p47 system was developed at an evolutionarily late stage, the system might require diversion of the FTCD enzyme to the membrane fusion process. This idea can also explain why the p97/p47 complex works in the two distinct steps of membrane tethering and SNARE priming.
Materials and Methods
Proteins, constructs, and antibodies
p97, p47, p37, and p115 were prepared as reported previously (Rabouille et al, 1995b; Kondo et al, 1997; Uchiyama et al, 2002; Uchiyama et al, 2006). For the production of mutated proteins, the mutations were directly introduced into their cDNA in either the pQE30 or pGEX‐6P‐1 vector by PCR reactions, using the QuikChange mutagenesis kit (Stratagene). All clones were verified by DNA sequencing.
For the expression of Flag‐tagged p47 and p97 in cultured cells, their rat cDNAs were subcloned into the pFLAG‐CMV5 vector. To obtain siRNA‐insensitive p47 and p97, seven and six nucleotides, respectively, were mutated within their siRNA‐targeting regions.
Polyclonal antibodies to p47, p37, p97, VCIP135, syntaxin5, GM130, and p115 were prepared as described previously (Uchiyama et al, 2002; Uchiyama et al, 2003; Uchiyama et al, 2006; Totsukawa et al, 2011). A monoclonal antibody to FTCD (58K‐9) was purchased from Sigma. A polyclonal antibody to the HA‐tag (NB600‐362) was purchased from Novus; a monoclonal antibody to mitochondria (MTCO2) and a polyclonal antibody to α‐tubulin (ab89984) were from Abcam; monoclonal antibodies to GST (4C10), α‐tubulin (B‐5‐1‐2), and Flag‐tag (M2) were from Sigma; monoclonal antibodies to p97 (58.13.3), p47 (D‐9), His‐tag (34610), and GM130 (35) were from Progen, Santa Cruz, Qiagen, and BD Transduction, respectively.
Identification of FTCD and preparation of its recombinant protein
His‐tagged p47(1–170) (100 μg) was biotinylated using EZ‐Link Sulfo‐NHS‐LC‐biotin (Pierce), bound to immobilized Streptavidin beads (Sigma), and washed with 1 M KCl in buffer (20 mM Hepes, 1 mM MgCl2, 1 mM DTT, 0.5% Triton X‐100, 5% glycerol, pH 7.4).
Rat liver tissues were homogenized in a five‐fold volume (w/v) of buffer (0.1 M KCl, 30 mM Tris‐Cl, 1 mM MgCl2, 250 mM sucrose, protease inhibitor cocktail [Roche], pH 7.4) with a Potter‐Elvehjem homogenizer using two different Teflon pestles (clearance of 0.35 and 0.05 mm). The homogenate was centrifuged at 2,000 g for 15 min, and the resulting supernatant was further centrifuged at 8,000 g for 20 min. The 8,000 g supernatant was supplied with Triton X‐100 to a final concentration of 0.5% and was used as the rat liver extract. All these procedures were carried out at 4°C.
The rat liver extract (530 μl) was precleaned by centrifugation (20,000 g for 15 min) and incubated with the p47(1–170)‐immobilized beads for 2 h at 4°C. The binding proteins were separated by SDS–PAGE and stained with Coomassie Brilliant Blue. The protein bands were excised from the gel and subjected to in‐gel digestion with trypsin, followed by mass spectrometry analysis using an LTQ Orbitrap Velos mass spectrometer (Thermo Fisher Scientific).
The ORF of rat FTCD was subcloned into the pQE30 vector for the production of His‐tagged recombinant protein. His‐tagged FTCD was expressed in Escherichia coli and purified with Ni‐beads, followed by further purification using 5%‐30% sucrose gradient centrifugation. His‐tagged FTCD was used to raise rabbit anti‐FTCD polyclonal antibodies. For the expression of HA‐tagged FTCD in cultured cells, rat FTCD cDNA was subcloned into the pCG‐C‐BL vector.
Biochemical experiments
Binding experiments using GST‐tagged proteins were performed in buffer A (20 mM Hepes, 1 mM MgCl2, 1 mM DTT, 10% glycerol, pH 7.4) containing 100 mM KCl and 0.5% Triton X‐100. For binding experiments using His‐FTCD‐beads, His‐tagged FTCD was biotinylated using EZ‐Link Sulfo‐NHS‐LC‐biotin, bound to Dynabeads M280 Streptavidin (Invitrogen), and used for the binding reactions in buffer A containing 75 mM KCl, 0.5% Triton X‐100 and 0.1% BSA.
For immunoprecipitation experiments, HepG2 cells were solubilized in buffer A containing 50 mM KCl, 1% Triton X‐100, 0.2 mM AMP‐PNP, and protease inhibitor cocktail (EDTA‐free, Roche), and mixed with either antibodies to p47 or FTCD. p47, FTCD, and their binding proteins were precipitated by protein G‐beads.
To generate Golgi membranes saturated with p47 and p97, 1 M KCl‐washed Golgi membranes (250 μg protein) were incubated with excess amounts of GST‐tagged p47 and GST‐tagged p97, respectively. The membranes were isolated by centrifugation and solubilized in 500 μl of buffer A containing 50 mM KCl and 1% Triton X‐100. The extracts were precleaned by centrifugation and supplied with glutathione beads to recover the GST‐tagged proteins and their binding proteins.
Immunofluorescence microscopy
HepG2 cells were grown in DMEM (Sigma) containing 10% fetal bovine serum at 37°C in a 5% CO2 incubator. For the collection of mitotic cells, the cells were washed twice with PBS and flushed with Hepes‐containing medium. The mitotic cells were collected and transferred onto the coverslips coated with poly‐d‐lysine.
Human FTCD was targeted with the following independent siRNAs: 5′‐GCUGGUACCUGGAUGAGAATT‐3′ (FTCD siRNA1) and 5′‐GCTTCCCGACTTATCGACATGAGCA‐3′ (FTCD siRNA2). Each siRNA duplex (25 nM) was transfected into HepG2 cells using TransIT‐X2 (Mirus). For the rescue experiments, the mammalian expression construct of HA‐tagged rat FTCD, which was insensitive to human FTCD siRNA, was transfected using TransIT‐X2.
For the visualization of FTCD, cells grown on coverslips were fixed with 3% paraformaldehyde (PFA) for 6 min, permeabilized with 0.3% Triton X‐100 for 5 min, and stained with a monoclonal antibody to FTCD. To visualize p47 and p97, the cells were fixed in the following two stages: first with 8 mM dimethyl pimelimidate (DMP) in 3% PFA for 5 min and then with 8 mM DMP in PBS for 11 min. The fixed cells were permeabilized with 0.002% saponin for 5 min and stained with polyclonal antibodies containing 0.001% saponin. The stained cells were observed by a confocal microscope (Zeiss Axiovert 200M, LSM510) equipped with a 63× objective lens (Plan‐Apochromat, NA 1.40).
Electron microscopy
HepG2 and Hela cells were fixed, embedded in Epon, ultrathin‐sectioned, and observed using an electron microscope (JEM‐1230, JEOL).
The Golgi area was defined by the boundary enclosing the Golgi stacks, tubules and tubulo‐reticular networks, and all the vesicles that were within 100 nm of these membranes. Membrane profiles in the Golgi area were divided into three categories: cisternae, tubules, and vesicles, and the relative proportion of each category of membrane was counted using an intersection method, as previously described (Shorter et al, 1999).
In vitro Golgi assembly assay
The in vitro Golgi assembly assay was performed and analyzed using an electron microscope, as reported previously (Shorter et al, 1999). Briefly, Golgi fragments, which were generated by the incubation of Golgi membranes with mitotic HeLa cytosol, were incubated with the indicated proteins and antibodies in the presence of ATP and GTP. After incubation at 37°C for 60 min, the membranes were fixed and processed, and the percentage of membrane in cisternae was determined. The length of cisternae was measured by an intersection method (Shorter et al, 1999).
All proteins added in the assay were prepared as recombinant proteins from E. coli. All antibodies used in the assay were polyclonal and affinity‐purified.
Negative stain electron microscopy
The p97/p47 complex was incubated with an excess amount of FTCD in the presence of 1 mM AMP‐PNP, and the FTCD‐p47/p97‐FTCD complex was isolated using the GraFix method (Kastner et al, 2008). Briefly, 0.2% glutaraldehyde was added to a 40% sucrose solution, and then, a 5–40% sucrose gradient, containing 40 mM KCl and 0.2 mM AMP‐PNP, was made. The mixture of p97, p47, and FTCD was loaded onto the sucrose gradient, and the separation was performed using VTi90 (k factor = 8) at 80k rpm for 40 min. The fractions containing the complex were pooled and used for the negative staining.
The samples were loaded onto negatively glow‐discharged copper grids coated with a carbon film, left to adhere for 1 min, and stained with 2% uranyl for 1 min. Images were collected using a Philips CM200 operated at 200 kV at 50 k magnification, using a 4k × 4k CCD camera, resulting in a pixel size of 1.765 Å. A set of 2101 particles was manually picked from 66 micrographs. Particles were extracted in boxes of 300 × 300 pixels. All image processing operations were performed with SPIDER (Shaikh et al, 2008). Boxed particles were normalized and band‐pass filtered with low and high frequency cutoffs of 200 and 15 Å, respectively. A soft circular mask with a diameter of 270 pixels was applied to the preprocessed particles. The particles were first aligned to a set of projections generated from the published p97p47 cryoEM reconstructions, lowpass filtered to 40 Å first (EMDB code 1191) (Beuron et al, 2006). After performing multivariate statistical analysis (MSA) to determine eigenimages, 200 2D class averages were generated. A set of five representative distinct 2D class averages was selected and used as references for a second round of alignment. An additional cycle of MSA, followed by selection of templates and subsequent alignments, was performed, after which a final set of 150 2D class averages was obtained using MSA. Among the datasets, approximately 640 particles belong to classes with dimensions and features that are consistent with one FTCD bound to a p97p47 complex and approximately 530 particles belong to classes which are consistent with two FTCD molecules bound to a p97p47 complex. The crystal structure of FTCD (PDB code 1TT9) was used to generate a density map using molmap in UCSF Chimera (Pettersen et al, 2004) at 35 Å resolution, and projections were created using SPIDER.
Beads aggregation assay
His‐tagged FTCD was biotinylated using EZ‐Link Sulfo‐NHS‐LC‐biotin and bound to Dynabeads M280 Streptavidin to generate the His‐FTCD‐beads. The beads were mixed with the indicated proteins in buffer (20 mM Hepes, 50 mM KCl, 1 mM MgCl2, 1 mM DTT, 0.1% BSA, 5% glycerol, 0.5% Triton X‐100, pH 7.4), and then, an aliquot of the mixture was spotted on a siliconized slide. After mounting a coverslip, the slide was incubated in a moisture chamber for 1 h at room temperature.
Aggregation of the beads was observed under a bright‐field microscope. The obtained images were analyzed using Image‐Pro Plus software (Media Cybernetics) to determine the surface area of objects, which was used to calculate the number of beads in the clusters. Aggregates were defined as those with more than six beads.
In vivo mitochondria aggregation assay
For the targeting of FTCD to the outer mitochondrial membrane, the C‐terminal transmembrane domain (481–528 a.a.) of MAO was connected to the C‐terminus of FTCD via an HA‐tag (FTCD‐HA‐MAO) (Mitoma & Ito, 1992; Wong & Munro, 2014). The HeLa cell line inducibly expressing either FTCDwt‐HA‐MAO or FTCD(R382A)‐HA‐MAO was established using the Tet‐off gene expression system (Clontech). For the induction of expression, the cells were washed twice with PBS, trypsinized, and cultured in the medium containing tetracycline‐free fetal bovine serum (Clontech) and 2 mM sodium butyrate. In the case of the induction in mitotic cells, the trypsinization step was omitted.
Human p47 and p97 were targeted with the following siRNAs: 5′‐CAUUCAUGACCAAGAUGAA‐3′ (p47 siRNA) and 5′‐GAGUUCCUGGCUAAAAUGA‐3′ (p97 siRNA). Each siRNA duplex (10 nM) was transfected into Hela cells using Lipofectamine RNAiMAX (Thermo Fisher Scientific). For the rescue experiments, the mammalian expression constructs of siRNA‐insensitive Flag‐tagged p47 and p97 were transfected using Lipofectamine 3000 (Thermo Fisher Scientific).
For the observation of fixed cells, the cells were fixed with 3% PFA for 13 min, permeabilized with 0.3% Triton X‐100 for 5 min, and stained with antibodies to mitochondria, HA and Flag, followed by observation using a confocal microscope (LSM510, Zeiss).
In the case of living cells, cells were stained with MitoTracker Red CMXRos (Invitrogen) by culturing in medium containing 50 nM MitoTracker for 10 min. After changing the medium, the cells were observed using a confocal microscope (Olympus IX71, Yokogawa CSU‐X1, Andor ixon CCD camera) equipped with a 40× objective lens (UPlanFL N, NA 1.30; for fluorescence observation) and a 20× objective lens (UPlanSApo, NA 0.85; for differential interference contrast observation). The cells were incubated in a stage top CO2 incubator (Tokai Hit Co.) during the observation period.
Author contributions
HK conceived the project, designed the experiments, performed biochemical and cell biological experiments, analyzed the data, and wrote the manuscript. YK performed biochemical and cell biological experiments. SP, RA, and XZ performed molecular structural studies. KS and YG performed cell biological experiments.
Conflict of interest
The authors declare that they have no conflict of interest.
Supporting information
Review Process File
Expanded View Figures PDF
Source Data for Figure 1
Source Data for Figure 2
Source Data for Figure 3
Source Data for Figure 7
Acknowledgements
We would like to thank M. Matsumoto for the mass spectrometric analysis; G. Totsukawa and A. Tanaka for their technical assistance in the biochemical and cell biological experiments; and H. A. Popiel for her kind assistance in preparation of the manuscript. This work is supported by grants to H. Kondo and Y. Kaneko from the Ministry of Education, Culture, Sports, Science and Technology of Japan.
The EMBO Journal (2021) 40: e105853.
Data availability
The mass spectrometry proteomics data have been deposited to the ProteomeXchange Consortium via the Japan ProteOme (Project ID, JPST001022; Dataset ID, PXD022746; https://repository.jpostdb.org/entry/JPST001022).
References
- Bashour AM, Bloom GS (1998) 58K, a microtubule‐binding Golgi protein, is a formiminotransferase cyclodeaminase. J Biol Chem 273: 19612–19617 [DOI] [PubMed] [Google Scholar]
- Beuron F, Dreveny I, Yuan X, Pye VE, McKeown C, Briggs LC, Cliff MJ, Kaneko Y, Wallis R, Isaacson RL et al (2006) Conformational changes in the AAA ATPase p97–p47 adaptor complex. EMBO J 25: 1967–1976 [DOI] [PMC free article] [PubMed] [Google Scholar]
- Brocker C, Engelbrecht‐Vandre S, Ungermann C (2010) Multisubunit tethering complexes and their role in membrane fusion. Curr Biol 20: R943–R952 [DOI] [PubMed] [Google Scholar]
- Findlay WA, MacKenzie RE (1987) Dissociation of the octameric bifunctional enzyme formiminotransferase‐cyclodeaminase in urea. Isolation of two monofunctional dimers. Biochemistry 26: 1948–1954 [DOI] [PubMed] [Google Scholar]
- Gao Y, Sztul E (2001) A novel interaction of the Golgi complex with the vimentin intermediate filament cytoskeleton. J Cell Biol 152: 877–894 [DOI] [PMC free article] [PubMed] [Google Scholar]
- Gao YS, Vrielink A, MacKenzie R, Sztul E (2002) A novel type of regulation of the vimentin intermediate filament cytoskeleton by a Golgi protein. Eur J Cell Biol 81: 391–401 [DOI] [PubMed] [Google Scholar]
- Hennig D, Scales SJ, Moreau A, Murley LL, De Mey J, Kreis TE (1998) A formiminotransferase cyclodeaminase isoform is localized to the Golgi complex and can mediate interaction of trans‐Golgi network‐derived vesicles with microtubules. J Biol Chem 273: 19602–19611 [DOI] [PubMed] [Google Scholar]
- Kaneko Y, Tamura K, Totsukawa G, Kondo H (2010) Isolation of a point‐mutated p47 lacking binding affinity to p97ATPase. FEBS Lett 584: 3873–3877 [DOI] [PubMed] [Google Scholar]
- Kastner B, Fischer N, Golas MM, Sander B, Dube P, Boehringer D, Hartmuth K, Deckert J, Hauer F, Wolf E et al (2008) GraFix: sample preparation for single‐particle electron cryomicroscopy. Nat Methods 5: 53–55 [DOI] [PubMed] [Google Scholar]
- Kondo H, Rabouille C, Newman R, Levine TP, Pappin D, Freemont P, Warren G (1997) p47 is a cofactor for p97‐mediated membrane fusion. Nature 388: 75–78 [DOI] [PubMed] [Google Scholar]
- Latterich M, Frohlich KU, Schekman R (1995) Membrane fusion and the cell cycle: Cdc48p participates in the fusion of ER membranes. Cell 82: 885–893 [DOI] [PubMed] [Google Scholar]
- Lesa GM, Seemann J, Shorter J, Vandekerckhove J, Warren G (2000) The amino‐terminal domain of the golgi protein giantin interacts directly with the vesicle‐tethering protein p115. J Biol Chem 275: 2831–2836 [DOI] [PubMed] [Google Scholar]
- Lucocq JM, Berger EG, Warren G (1989) Mitotic Golgi fragments in HeLa cells and their role in the reassembly pathway. J Cell Biol 109: 463–474 [DOI] [PMC free article] [PubMed] [Google Scholar]
- Mao Y, Vyas NK, Vyas MN, Chen DH, Ludtke SJ, Chiu W, Quiocho FA (2004) Structure of the bifunctional and Golgi‐associated formiminotransferase cyclodeaminase octamer. EMBO J 23: 2963–2971 [DOI] [PMC free article] [PubMed] [Google Scholar]
- Mellman I, Simons K (1992) The Golgi complex: in vitro veritas? Cell 68: 829–840 [DOI] [PMC free article] [PubMed] [Google Scholar]
- Mitoma J, Ito A (1992) Mitochondrial targeting signal of rat liver monoamine oxidase B is located at its carboxy terminus. J Biochem 111: 20–24 [DOI] [PubMed] [Google Scholar]
- Murley LL, MacKenzie RE (1995) The two monofunctional domains of octameric formiminotransferase‐cyclodeaminase exist as dimers. Biochemistry 34: 10358–10364 [DOI] [PubMed] [Google Scholar]
- Nakamura N, Lowe M, Levine TP, Rabouille C, Warren G (1997) The vesicle docking protein p115 binds GM130, a cis‐Golgi matrix protein, in a mitotically regulated manner. Cell 89: 445–455 [DOI] [PubMed] [Google Scholar]
- Pettersen EF, Goddard TD, Huang CC, Couch GS, Greenblatt DM, Meng EC, Ferrin TE (2004) UCSF Chimera–a visualization system for exploratory research and analysis. J Comput Chem 25: 1605–1612 [DOI] [PubMed] [Google Scholar]
- Rabouille C, Hui N, Hunte F, Kieckbusch R, Berger EG, Warren G, Nilsson T (1995a) Mapping the distribution of Golgi enzymes involved in the construction of complex oligosaccharides. J Cell Sci 108: 1617–1627 [DOI] [PubMed] [Google Scholar]
- Rabouille C, Levine TP, Peters JM, Warren G (1995b) An NSF‐like ATPase, p97, and NSF mediate cisternal regrowth from mitotic Golgi fragments. Cell 82: 905–914 [DOI] [PubMed] [Google Scholar]
- Rabouille C, Kondo H, Newman R, Hui N, Freemont P, Warren G (1998) Syntaxin 5 is a common component of the NSF‐ and p97‐mediated reassembly pathways of Golgi cisternae from mitotic Golgi fragments in vitro . Cell 92: 603–610 [DOI] [PubMed] [Google Scholar]
- Shaikh TR, Gao H, Baxter WT, Asturias FJ, Boisset N, Leith A, Frank J (2008) SPIDER image processing for single‐particle reconstruction of biological macromolecules from electron micrographs. Nat Protoc 3: 1941–1974 [DOI] [PMC free article] [PubMed] [Google Scholar]
- Shorter J, Warren G (1999) A role for the vesicle tethering protein, p115, in the post‐mitotic stacking of reassembling Golgi cisternae in a cell‐free system. J Cell Biol 146: 57–70 [DOI] [PMC free article] [PubMed] [Google Scholar]
- Shorter J, Watson R, Giannakou ME, Clarke M, Warren G, Barr FA (1999) GRASP55, a second mammalian GRASP protein involved in the stacking of Golgi cisternae in a cell‐free system. EMBO J 18: 4949–4960 [DOI] [PMC free article] [PubMed] [Google Scholar]
- Sztul E, Lupashin V (2009) Role of vesicle tethering factors in the ER‐Golgi membrane traffic. FEBS Lett 583: 3770–3783 [DOI] [PMC free article] [PubMed] [Google Scholar]
- Totsukawa G, Kaneko Y, Uchiyama K, Toh H, Tamura K, Kondo H (2011) VCIP135 deubiquitinase and its binding protein, WAC, in p97ATPase‐mediated membrane fusion. EMBO J 30: 3581–3593 [DOI] [PMC free article] [PubMed] [Google Scholar]
- Uchiyama K, Jokitalo E, Kano F, Murata M, Zhang X, Canas B, Newman R, Rabouille C, Pappin D, Freemont P et al (2002) VCIP135, a novel essential factor for p97/p47‐mediated membrane fusion, is required for Golgi and ER assembly in vivo . J Cell Biol 159: 855–866 [DOI] [PMC free article] [PubMed] [Google Scholar]
- Uchiyama K, Jokitalo E, Lindman M, Jackman M, Kano F, Murata M, Zhang X, Kondo H (2003) The localization and phosphorylation of p47 are important for Golgi disassembly‐assembly during the cell cycle. J Cell Biol 161: 1067–1079 [DOI] [PMC free article] [PubMed] [Google Scholar]
- Uchiyama K, Totsukawa G, Puhka M, Kaneko Y, Jokitalo E, Dreveny I, Beuron F, Zhang X, Freemont P, Kondo H (2006) p37 is a p97 adaptor required for Golgi and ER biogenesis in interphase and at the end of mitosis. Dev Cell 11: 803–816 [DOI] [PubMed] [Google Scholar]
- Warren G (1995) Intracellular membrane morphology. Philos Trans R Soc Lond B Biol Sci 349: 291–295 [DOI] [PubMed] [Google Scholar]
- Wong M, Munro S (2014) Membrane trafficking. The specificity of vesicle traffic to the Golgi is encoded in the golgin coiled‐coil proteins. Science 346: 1256898 [DOI] [PMC free article] [PubMed] [Google Scholar]
Associated Data
This section collects any data citations, data availability statements, or supplementary materials included in this article.
Supplementary Materials
Review Process File
Expanded View Figures PDF
Source Data for Figure 1
Source Data for Figure 2
Source Data for Figure 3
Source Data for Figure 7
Data Availability Statement
The mass spectrometry proteomics data have been deposited to the ProteomeXchange Consortium via the Japan ProteOme (Project ID, JPST001022; Dataset ID, PXD022746; https://repository.jpostdb.org/entry/JPST001022).