

Increasing aridity will drive a shift in desert vegetation and interspace gap (microsite) structure toward gap expansion. To evaluate the impact of gap expansion, we assess microsite effects on soil nutrients, microbiome community composition and functional capacity, and the potential of gap soils to serve as microbial reservoirs for plant root-associated microbiomes in an arid ecosystem.
KEYWORDS: deserts, microsite, soil microbiome, nutrient mineralization, ureC, urease enzymatic activity, aridity, functional traits
ABSTRACT
Increasing temperatures and drought in desert ecosystems are predicted to cause decreased vegetation density combined with barren ground expansion. It remains unclear how nutrient availability, microbial diversity, and the associated functional capacity vary between the vegetated canopy and gap soils. The specific aim of this study was to characterize canopy versus gap microsite effect on soil microbial diversity, the capacity of gap soils to serve as a canopy soil microbial reservoir, nitrogen (N)-mineralization genetic potential (ureC gene abundance) and urease enzyme activity, and microbial-nutrient pool associations in four arid-hyperarid geolocations of the western Sonoran Desert, Arizona, United States. Microsite combined with geolocation explained 57% and 45.8% of the observed variation in bacterial/archaeal and fungal community composition, respectively. A core microbiome of amplicon sequence variants was shared between the canopy and gap soil communities; however, canopy soils included abundant taxa that were not present in associated gap communities, thereby suggesting that these taxa cannot be sourced from the associated gap soils. Linear mixed-effects models showed that canopy soils have significantly higher microbial richness, nutrient content, and organic N-mineralization genetic and functional capacity. Furthermore, ureC gene abundance was detected in all samples, suggesting that ureC is a relevant indicator of N mineralization in deserts. Additionally, novel phylogenetic associations were observed for ureC, with the majority belonging to Actinobacteria and uncharacterized bacteria. Thus, key N-mineralization functional capacity is associated with a dominant desert phylum. Overall, these results suggest that lower microbial diversity and functional capacity in gap soils may impact ecosystem sustainability as aridity drives open-space expansion in deserts.
IMPORTANCE Increasing aridity will drive a shift in desert vegetation and interspace gap (microsite) structure toward gap expansion. To evaluate the impact of gap expansion, we assess microsite effects on soil nutrients, microbiome community composition and functional capacity, and the potential of gap soils to serve as microbial reservoirs for plant root-associated microbiomes in an arid ecosystem. Results indicate that gap soils have significantly lower bioavailable nutrients, microbial richness, and N-mineralization functional capacity. Further, abundance of the bacterial urease gene (ureC) correlates strongly with N availability, and its major phylogenetic association is with Actinobacteria, the dominant phylum found in deserts. This finding is relevant because it identifies an important N-mineralization capacity indicator in the arid soil microbiome. Such indicators are needed to understand the relationships between interplant gap expansion and microbial diversity and functional potential associated with plant sustainability. This will be a critical step in recovery of land degraded by aridity stress.
INTRODUCTION
Desert ecosystems are characterized by plant spatial heterogeneity, where vegetation cover is present in patches separated by gaps (1). Vegetation patches capture dust, water, and nutrients from wind and water erosion, forming fertility or resource islands in soils (2, 3). According to climate model predictions, a rise in global temperatures with associated extreme weather events and drought conditions will lead to an increase in aridity in these regions (4). This, in turn, will affect essential ecosystem services (5) through transformation of vegetation patterns as well as gap expansion in drylands (6) and might result in irreversible shifts from healthy to degraded soils (7). Presently, there is limited knowledge of how loss of vegetative cover accompanied by expanded gaps will affect arid ecosystem services.
Previous work has shown that desert soil microbial communities are taxonomically distinct from other biomes and have lower functional diversity with respect to nutrient cycling (8). In addition, studies conducted in drylands have demonstrated that an increase in aridity results in a decrease in microbial abundance and diversity (9, 10). It is also known that microbial abundance and diversity in deserts are controlled by microsites (vegetation and gap microsites include soils under plant canopies versus interspace gaps devoid of any vegetation) (11, 12), size of the fertility island (13, 14), and precipitation (15). However, the link between microbial diversity and the associated genetic potential and functional capacity remains largely unclear in deserts. Predicted global climatic changes that shift desert microsite structure may, in turn, influence the microsite-specific microbial community composition and its functional capacity. Therefore, it is critical to understand microbial functions not only under the vegetation canopy soils but also in the gaps.
A critical nutrient cycling service in desert ecosystems is soil organic matter mineralization, a process carried out by heterotrophic bacteria and fungi. Microbial mineralization of organic matter is a primary source of important inorganic nutrients, including nitrogen (N) (16). In fact, N availability is the main limiting factor for net primary productivity and ecosystem function in desert ecosystems. However, knowledge concerning the consortia of microorganisms that drive mineralization of organic N pools to inorganic forms in deserts is limited. N mineralization is an important function impacting plant-available nitrogen supplies. N mineralization begins with proteolysis, the breakdown of proteins into peptides, amines, and amides (17). These proteolysis products are converted into urea, and urea is further hydrolyzed into ammonium by the enzyme urease (18). Whereas proteases are ubiquitous and produced by all forms of life (19), the processes of ureolysis are driven by specialized microbial guilds (18). Thus, the genetic potential and functional capacity of these ureolytic microorganisms should be evaluated to assess N availability between canopy and gap soil microsites in deserts.
The goal of this study is to evaluate the effects of soil microsites (canopy versus gap) in different geolocations on the coupled association of microbial community composition, functional nutrient cycling capacity, and nutrient pools in the Sonoran Desert of the southwestern United States. To do so, we compare microbial community composition and mineralization potential of gap and vegetated fertility islands at four arid to hyperarid locations (geolocations) in the Larrea tridentata-Ambrosia dumosa (creosote bush-white bursage) ecosystem of the western Sonoran Desert, Arizona (Fig. 1). The creosote bush-white bursage is the dominant vegetation ecosystem of the western Sonoran Desert, and vegetation density is controlled by aridity (20). The study was designed to evaluate the impact of the desert microsite and geolocation on (i) microbial diversity and community composition, (ii) capacity of the gap soils to serve as a reservoir for the plant root zone microbiome, and (iii) associations between N-mineralization gene abundance (bacterial ureC, ureolysis), N-enzyme activity (urease), and soil nutrient pools in the four Sonoran Desert geolocations. Abundance of the ureC gene was targeted to compare microbial populations critical to the cycling of organic N and to address whether urease functional capacities shift to alternate taxa in desert ecosystems.
FIG 1.
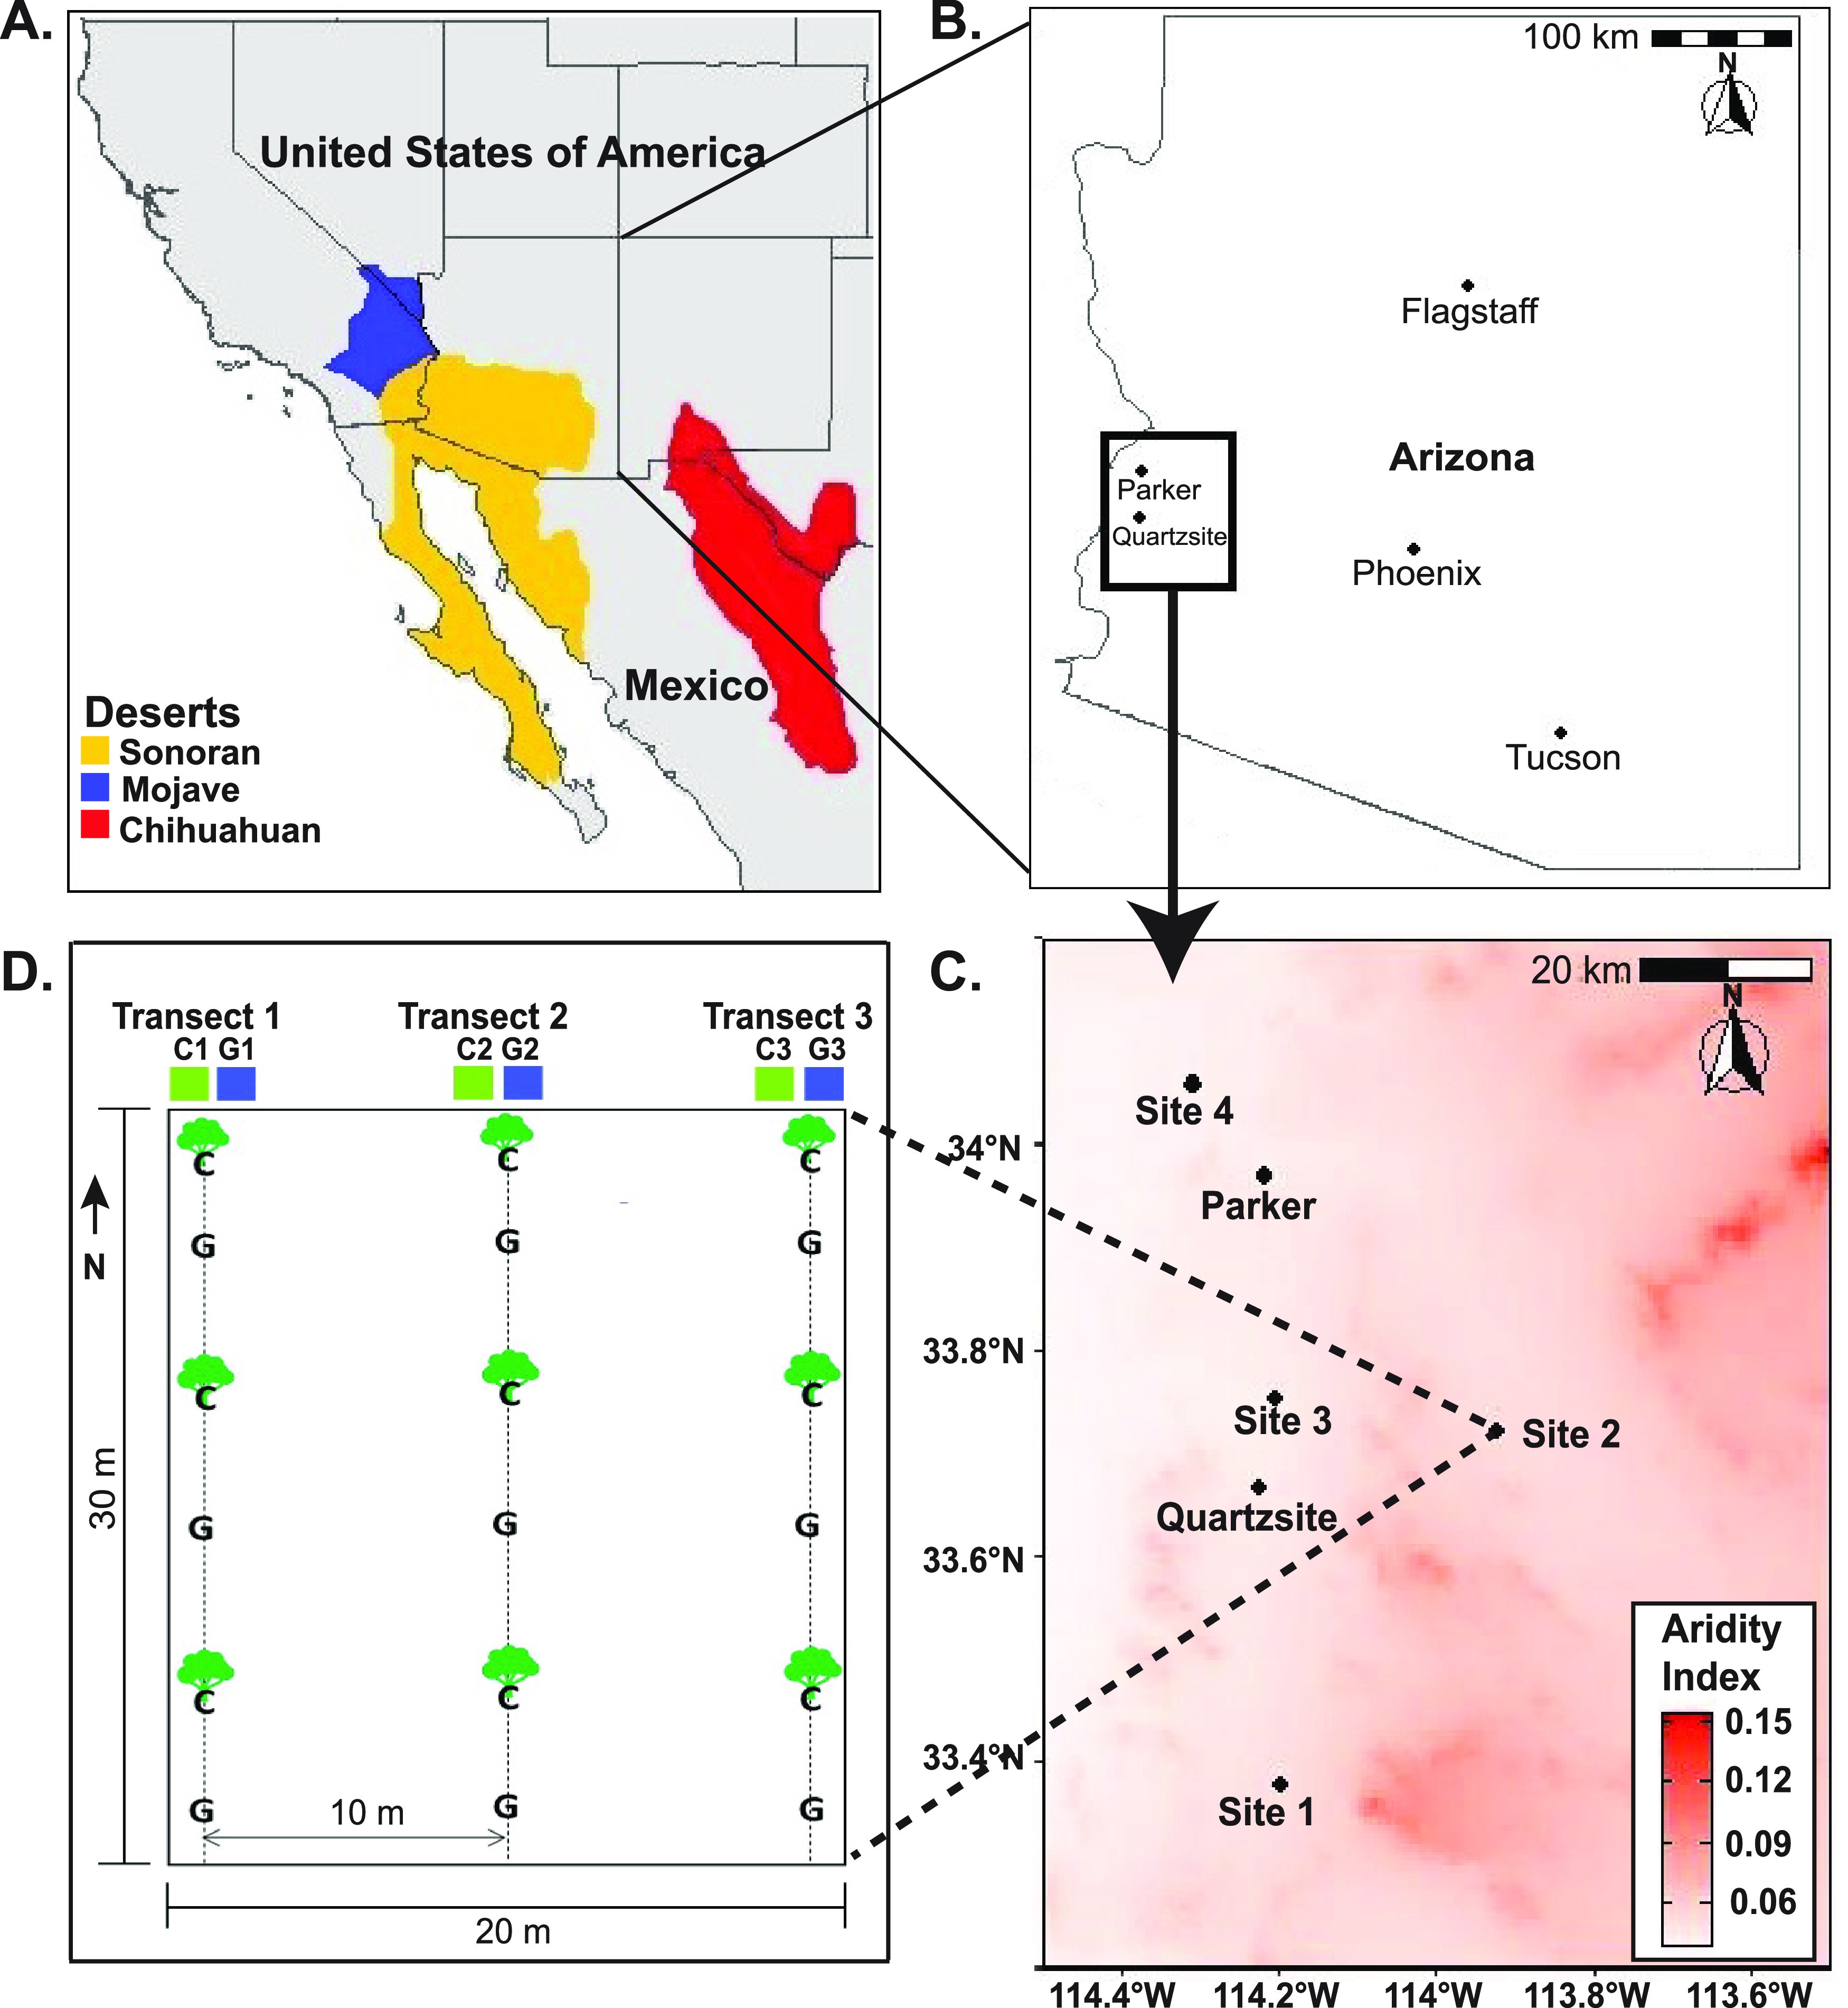
Sampling design in this study. (A) Map of the Sonoran, Mojave, and Chihuahuan deserts in North America. (B) Map of the Sonoran Desert sampling area in the state of Arizona. (C) Aridity index map showing the soil sampling sites. (D) Field sampling layout. Along each transect, a composite sample of canopy (C) and gap (G) soils was collected by combining three canopy and three gap samples. Panels A to C were created in R using the libraries rnaturalearth and rnaturalearthdata.
RESULTS
Soil physicochemical properties.
Physicochemical analysis was performed on soil samples collected from the vegetation canopy and gap soil microsites. Vegetation canopy was defined as the soil samples collected under the canopy of the creosote bush-white bursage vegetation, and gap was defined as the interplant barren spaces devoid of vegetation or biocrust (Fig. 1). Physicochemical analysis indicated that nutrient values, particularly dissolved organic carbon (DOC), total organic carbon (TOC), total nitrogen (TN), dissolved nitrogen (DN), ammonium (NH4-N), nitrate (NO3-N), and bioavailable phosphorus (BAP) were significantly higher in canopy soils than gap soils (Table 1; Table S1 in the supplemental material). The soil chemical parameters that most strongly and significantly associated with canopy soils as opposed to gap soils included DN, NH4-N, TN, BAP, and DOC (linear mixed-effect models; marginal R2 > 0.30; Table 1). Specifically, the content of DN was, on average, 1.5- to 4.6-fold higher in canopy soils than in gap soils. Total carbon (TC) and DOC also showed significant geolocation effects, thereby indicating that certain nutrient pools varied with different geographic sites. Additionally, the major fraction of TN and DN was primarily organic, as inorganic N values (NH4-N and NO3-N) were relatively low (Table S1).
TABLE 1.
Abiotic and biotic differences between canopy and gap soil micrositesa
| Characteristica | Canopy and gap differences | Significance | Marginal R2 | Conditional R2 |
|---|---|---|---|---|
| Abioticb | ||||
| DN (µg g−1) | 20.80 | *** | 0.51 | 0.65 |
| DIC (µg g−1) | 24 | *** | 0.50 | 0.73 |
| Ammonium (µg g−1) | 1.7 | *** | 0.46 | 0.60 |
| TN (µg g−1) | 154.3 | *** | 0.43 | 0.74 |
| BAP (µg g−1) | 3.5 | *** | 0.42 | 0.43 |
| DOC (µg g−1) | 94.2 | *** | 0.31 | 0.84 |
| Nitrate (µg g−1) | 10.8 | ** | 0.30 | 0.41 |
| EC (µs cm−1) | 153 | ** | 0.26 | 0.58 |
| TOC (%) | 0.24 | * | 0.22 | 0.22 |
| TC (µg g−1) | 1372.5 | ** | 0.14 | 0.75 |
| pH | −0.15 | ns | 0.07 | 0.49 |
| Sand (%) | −1.4 | ns | 0.01 | 0.82 |
| Silt (%) | 1.6 | ns | 0.01 | 0.78 |
| Clay (%) | −0.13 | ns | 0.00 | 0.18 |
| Biotic | ||||
| ITS richness | 131.7 | *** | 0.58 | 0.63 |
| 16S rRNA gene richness | 261.3 | * | 0.20 | 0.21 |
| ureC gene abundance (copy no. g−1 soil) | 0.23 | *** | 0.38 | 0.49 |
| Urease enzyme activity (µg NH4-N g−1 h−1) | 5.4 | ** | 0.31 | 0.49 |
| 16S rRNA gene abundance (copy no. g−1 soil) | 0.18 | ** | 0.18 | 0.56 |
| Fungal functional guild type | ||||
| Epiphyte | 0.0001 | *** | 0.89 | 0.98 |
| Endophyte | 0.02 | *** | 0.71 | 0.71 |
| Plant pathogen | 0.09 | *** | 0.68 | 0.73 |
| Wood saprotroph | 0.01 | ** | 0.57 | 0.57 |
| Ericoid mycorrhizal fungi | 0.002 | * | 0.44 | 0.44 |
| Fungal parasite | 0.001 | ** | 0.44 | 0.44 |
| Ectomycorrhizal fungi | 0.003 | * | 0.40 | 0.40 |
| Arbuscular mycorrhizal fungi | −0.02 | * | 0.38 | 0.40 |
| Soil saprotroph | 0.001 | ns | 0.05 | 0.05 |
Results of linear mixed-effects models are shown. Microsite and geolocation were used as fixed and random effects, respectively. A positive number in the canopy and gap differences column (difference in average canopy and gap values) represents a higher value in canopy soils, and a negative number denotes higher value in gap soils. Significant P values are represented as *, P < 0.05; **, P < 0.01; and ***, P < 0.001; ns, not significant. The marginal R2 represents only the variance of the microsite. The conditional R2 takes both the microsite and geolocation into account. The variables are ranked based on their decreasing marginal R2 values.
DN, dissolved nitrogen; DIC, dissolved inorganic carbon; TN, total nitrogen; BAP, bioavailable phosphorus; DOC, dissolved organic carbon; EC, electrical conductivity; TOC, total organic carbon; TC, total carbon.
Microbial community composition.
The bacterial/archaeal communities across the four arid to hyperarid geolocations of the western Sonoran Desert were dominated by Actinobacteria (40.9%), Proteobacteria (24.2%), Firmicutes (7.4%), Gemmatimonadetes (6%), Chloroflexi (5.2%), Acidobacteria (4.9%), Planctomycetes (2.1%), Bacteroidetes (1.5%), and Verrucomicrobia (0.9%) (Fig. S1). A comparison of this community composition with other desert and nondesert biomes revealed a profile distinct from nondesert biomes (Fig. S1; tropical/temperate forests and prairie grasslands). Specifically, the relative abundance of Actinobacteria (15.3 to 45.3%) and Gemmatimonadetes (1.3 to 6.7%) was consistently greater in desert biomes (Fig. S1), whereas Acidobacteria (17.3 to 28.1%), and Verrucomicrobia (22.8 to 28.1%) were more abundant in forests and grasslands (Fig. S1; Table S2).
For the sites sampled for this study, compositional differences between microbial communities in canopy and gap soils were assessed using DESeq2 (Fig. S2 and S3). For bacteria/archaea, the relative abundances of Actinobacteria, Firmicutes, Chloroflexi, and Armatimonadetes were significantly higher in gap soils (P < 0.05), whereas Proteobacteria, Gemmatimonadetes, Entotheonellaeota, Deinococcus-Thermus, Dependentiae, and Nanoarchaeota had higher relative abundances in canopy soils (Fig. S2A). At the class level, Alphaproteobacteria and Deltaproteobacteria had greater relative abundances in the canopy soils, whereas Bacilli, Rubrobacteria, and Thermoleophilia classes had higher relative abundances in gap soils (Fig. S2B). There were 58 and 31 genera that were significantly more abundant in canopy and gap soils, respectively (Fig. S2C). Of these, genera belonging to Actinobacteria were split in relative abundance; 11 and 9 genera had greater relative abundance in canopy and gap soils, respectively (Fig. S2C). Twenty Alphaproteobacteria and eight Gammaproteobacteria genera were more abundant in canopy soils, and seven Bacilli genera were more abundant in gap soils (Fig. S2C).
Likewise, fungal community composition was significantly different between canopy and gap soils (Fig. S3). Ascomycota had greater relative abundance in canopy soils (P < 0.05), whereas the relative abundances of Basidiomycota and Glomeromycota were significantly greater in gap soils (Fig. S3A). At the class level, Leotiomycetes was the most abundant class in the canopy soils, whereas Geminibasidiomycetes, Glomeromycetes, and Pezizomycetes were more abundant in the gap soils (Fig. S3B). In all, 37 fungal genera were significantly different between canopy and gap soil microsites, and of these, 32 genera had greater relative abundance in canopy soils, and only 5 were more abundant in gap soils (Fig. S3C). The majority of the genera that were abundant in canopy soils belonged to Ascomycota, whereas the five genera with greater relative abundance in gap soils belonged to Ascomycota, Basidiomycota, Calcarisporiellomycota, and Glomeromycota (Fig. S3C).
Microbial community diversity.
Linear mixed-effects models showed that the effect of microsite was greater in canopy soils than in gap soils, and this effect was stronger for fungi (marginal R2 = 0.58) than for bacteria and archaea (marginal R2 = 0.20; Table 1). For bacteria/archaea, there was no difference between canopy and gap soil richness at sites 1 and 2; however, richness was greater in canopy soils than gap soils for the more arid sites 3 and 4 (Fig. 2A). In contrast, fungal richness was consistently greater under plant canopies across all the four geolocations (Fig. 2C). Nonmetric multidimensional scaling (NMDS) revealed that soil microbial community composition was different between canopy and gap soils and among geolocations (Fig. 2B and D). In addition, geolocation 4 clustered separately from the other sites. Permutational multivariate analysis of variance (PERMANOVA) showed that geolocation explained 20% of the variation in bacterial/archaeal community composition (P = 0.001), and microsites within each location explained an additional 37% variation (P = 0.001; Fig. 2B). For fungal communities, 16.3% of the variation in community composition (P = 0.001) was explained by geolocation, and microsites within geolocation explained an additional 29.5% variation (P = 0.001; Fig. 2D). Additionally, multivariate dispersion analysis revealed that the bacterial/archaeal (P = 0.28) and fungal (P = 0.19) community dispersions were not significantly different between microsites (Fig. S4), suggesting that the PERMANOVA results were not biased by the variation within microsites.
FIG 2.

Richness and nonmetric multidimensional scaling (NMDS) ordination plots for the microbial community. (A) Observed number of bacterial/archaeal amplicon sequence variants (ASV) or phylotypes. (B) Ordination plot for bacterial/archaeal community composition. (C) Observed number of fungal ASVs (or phylotypes). (D) Ordination plot for fungal community composition. Richness is depicted as the mean value and standard deviation.
Core microbiome- and microsite-specific ASVs.
The number of unique and shared amplicon sequence variants (ASVs) in canopy and gap soil microbial communities was examined to investigate whether the gap microbial community has the capacity to serve as a reservoir for the plant root zone microbiome community recruitment. Unique ASVs are identified as those present in either the canopy or the gap soils but absent from the other, whereas shared ASVs refer to those present in both microsites. Here, we define the core microbiome of this system as the shared ASVs that are present in both canopy and gap soils. In this analysis, ASV number represents richness, and ASV relative abundance (at the class level) represents community composition (Fig. 3). A total of 16,484 ASVs were identified for bacteria/archaea across all the sites. The richness of unique bacterial/archaeal ASVs was higher in canopy soils (7,573) than in gap soils (5,254), and the core microbiome was comprised of 3,657 ASVs (Fig. 3A). At the site level, unique canopy soil ASVs represented 34 to 51% of the richness across the four geolocations (Fig. 3B) and 18 to 49% of the canopy community composition (Fig. 3C; Table S3). In contrast, the core microbiome represented 51 to 82% (Fig. 3C; Table S4) and 71 to 81% (Table S4) of the community composition in the canopy and gap soil communities, respectively.
FIG 3.

Unique and shared ASVs across the canopy and gap soil microsites. (A) Venn diagram represents unique and shared bacterial/archaeal amplicon sequence variants (ASVs) in the microsites. (B) Number of unique and shared bacterial/archaeal ASVs in the microsites at the site level. (C) Relative abundance of canopy soil bacterial/archaeal ASVs. (D) Venn diagram represents unique and shared fungal ASVs in the microsites. (E) Number of unique and shared fungal ASVs in the microsites at site level. (F) Relative abundance of canopy soil fungal ASVs. The relative abundance values of unique and shared bacterial/archaeal and fungal ASVs (at the class level) across the microsites are represented in Tables S3 to S6 in the supplemental material.
There was a total of 2,234 ASVs identified for fungi across all sites. Similar to the bacteria/archaea, fungal richness was also higher in canopy soils (1,295 ASVs) than gap (500 ASVs) soils (Fig. 3D). However, the difference was much more pronounced for fungi; the ratio of unique canopy soil to gap soil fungal ASVs was 1.8 times greater than for bacterial/archaeal ASVs. Further, the core microbiome was comprised of just 439 ASVs (Fig. 3D). At the site level, unique fungal ASVs in canopy soils represented 48 to 73% of the richness, while the core microbiome represented only 10 to 21% of the richness (Fig. 3E). For community composition, unique fungal canopy soils ASVs comprised 26 to 70% of the community (Fig. 3F; Table S5), in contrast to the core microbiome, which represented 30 to 75% of the relative abundance of fungal taxa in canopy soils (Fig. 3F; Table S6).
Fungal guild predictions.
Fungal functional guilds were determined from fungal ASVs using the FUNGuild tool. Linear mixed-effects models showed that the functional guild variability was influenced more significantly by microsite than geolocation (Table 1). Arbuscular mycorrhizal fungi represented the only guild that associated more significantly with gap soils (marginal R2 = 0.38; Fig. 4A). In contrast, plant pathogens (marginal R2 = 0.68) and wood saprotrophs (marginal R2 = 0.57) were more abundant in canopy soils (Fig. 4B and 4C; Table 1). In addition, epiphytes and endophytes also had higher abundance in canopy soils, which are functionally associated with plants (Table 1).
FIG 4.

Predicted fungal guilds in Sonoran Desert soil samples. (A) arbuscular mycorrhizal fungi; (B) plant pathogen; (C) wood saprotroph. Proportions are depicted as the mean value and standard deviation.
Quantitative PCR bacterial gene abundance.
The 16S rRNA and ureC bacterial genes were used to quantify bacteria and evaluate specific N-mineralization genetic potential of the bacterial community, respectively (Fig. 5). Bacterial abundance ranged from 7.83- to 8.65-log 16S rRNA gene copies g−1 soil (Fig. 5A). The 16S rRNA gene abundance indicated that bacteria were significantly more abundant in canopy soils than gap soils; however, the variability in bacterial abundance was explained more by geolocation than microsite (Table 1; compare the marginal and conditional R2 values). In contrast, the bacterial ureC gene abundance showed a strong and significant microsite effect and a weaker geolocation effect (Table 1). The ureC gene was detected in all but one sample, and the abundance ranged from 6.5- to 7.5-log gene copies g−1 soil (Fig. 5B). Similar to the ureC gene abundance pattern, urease enzyme activity was detected in all the samples (n = 24; Table S1). Both urease enzyme activity (marginal R2 = 0.31) and ureC gene abundance (marginal R2 = 0.38) were greater in canopy soils (Table 1). A limited clone library was prepared from Sonoran Desert soil samples, and a phylogenetic analysis of associated ureC sequences revealed that 51% of the clones did not have a phylogenetic affiliation in the database, 42% belonged to Actinobacteria, and 4% of the clones were associated with Proteobacteria (Table S7).
FIG 5.

Gene abundance in Sonoran Desert soil samples. (A) 16S rRNA gene; (B) ureC. Copy numbers were calculated per gram of dry soil and are depicted as the mean value and standard deviation.
Correlations between soil nutrients and gene abundance.
The organic matter pool is an important source of limiting nutrients such as nitrogen. Correlations were evaluated between TOC, different N forms, and N-mineralization functional potential to characterize the associations between N pools and microbial N-mineralization capacity. Correlations between TOC and TN (r = 0.72; P < 0.001) and TOC and DN (r = 0.59; P < 0.01) were stronger and more significant than between TOC and ammonium or nitrate (Table S8), indicating that the major N pool in the deserts is organic. Further analysis of N forms and gene abundance showed significant positive correlations between 16S rRNA gene abundance and both TN and DN (Table S9). In addition, bacterial ureC gene abundance strongly correlated with all N forms, but the strongest correlations were observed between ureC and TN and DN (r > 0.70; Table S9).
DISCUSSION
Climate change-induced acceleration of dryland expansion is predicted to stress arid ecosystems and transform vegetation patterns, leading to expansion of interplant gaps (6, 7). Thus, there is a need to understand the significance of the canopy-gap microsite dichotomy to the soil nutrient pools and microbial nutrient cycling capacity of desert ecosystems to predict potential impacts of factors such as gap expansion. This study describes the effect of microsite (canopy versus gap soils) on microbial community composition, functional potential, and microbial associations with soil nutrient pools across four geolocations in the western Sonoran Desert, Arizona. Specifically, we demonstrate that (i) there is a stronger microsite than geolocation effect on the microbial community composition; (ii) there is significantly greater phylogenetic, genetic, and functional N-mineralization capacity associated with canopy soils relative to the gap soils; and (iii) the gap soil microbial community lacks sufficient microbial diversity to serve as a complete reservoir for the plant root zone microbiome.
Microsite differences in microbial diversity.
The Sonoran Desert samples showed that canopy soils have a higher microbial diversity than the gap soils. These results are in contrast to a study of desert palms conducted in semiarid to arid regions of Tunisian Saharan Desert that found bacterial diversity to be greater in bulk soils than rhizosphere in five out of the seven sampling sites (21). Interestingly, a study in the Namib Desert demonstrated different patterns for bacterial and fungal diversity in bulk and speargrass rhizosphere soils. Bulk soils had lower fungal diversity than speargrass rhizosphere soils, whereas bacterial diversity was comparable in bulk and rhizosphere soils (22). It is important to note that the aridity conditions of our Sonoran Desert sites are more similar to the Namib Desert (arid-hyperarid), whereas the Tunisian Saharan Desert sites range from semiarid to arid. Taken together, our results and the results from these previous studies suggest that the ratio of microbial richness of bulk to rhizosphere soils decreases as aridity increases.
This study also revealed interesting microsite impacts on microbial community composition. For the bacteria/archaea, Actinobacteria, Firmicutes, and Chloroflexi had significantly higher relative abundance in gap soils than under plant canopy soils. This is likely a result of gap areas being more prone to desiccation due to the absence of the protective (shading) vegetation canopy (23). Previous research has shown that the relative abundance of Actinobacteria increases with decreased water availability and that desiccation stimulates ribosome synthesis for a quick head start during favorable conditions in members of this phylum (24). For example, Actinobacteria classes of Rubrobacteria and Thermoleophilia, known to be radio-tolerant and thermophilic, respectively, were abundant in gap soils (25, 26). Similarly, Firmicutes are known for a resistance response strategy that maintains a stable ribosome content in both drought and wet conditions (24), and Chloroflexi exhibit adaptation strategies, including resistance to desiccation and UV radiation (27). Taken together, adaptation to desiccation and dormancy are common strategies that facilitate microbial survival under the oligotrophic arid conditions of gap soils (28). In contrast, examples of populations found predominantly in canopy soils are the Alphaproteobacteria genera Rhizobiales and Sphingomonadales. These microbes are known for their ability to fix nitrogen and carry out phototrophy in deserts, respectively (29).
A strong, significant microsite impact was also observed for fungal communities. Functionally, desiccation stress of gaps does not affect fungi, as they are considered more resistant than bacteria and have hyphae to aid in accessing nutrients and water (30, 31). The higher fungal richness in canopy soils is likely driven by plant litter inputs in canopy soils (32). FUNGuild correctly predicted that plant pathogen, epiphyte, endophyte, and saprotrophs would be more associated with canopy soils. Ascomycetes were more abundant under plant canopies, and these fungi play an important role in carbon and nitrogen cycling as they break down complex molecules such as cellulose and lignin (33). Of the Ascomycota, the fungal classes enriched in canopy soils were Dothideomycetes, Eurotiomycetes, and Sordariomycetes. The characterized members of Sordariomycetes are involved in decomposition and nutrient cycling and act as plant and animal pathogens, endophytes, and saprobes (34, 35). Further, members of the orders Sordariales (Sordariomycetes) and Agaricales (Agaricomycetes) are potent lignin degraders (36, 37).
Based on FUNGuild results, arbuscular mycorrhizae are more abundant in gap soils than under canopy soils. This is surprising, as arbuscular mycorrhizae are typically found in association with plant roots. It is noted that arbuscular mycorrhizae belonging to Glomeromycetes were also found to have higher abundance in gap rather canopy soils. Some species of this taxa are found associated both with plants and free-living (38). Alternatively, an explanation for this observed pattern is the fungal loop hypothesis where fungi act as biological networks for transforming and translocating nutrient resources across barren spaces between plants (39).
In summary, the microsite was a strong driver of microbial community composition for both bacteria/archaea and fungi. Possible explanations for this difference include (i) the plant fertility island effect under oligotrophic conditions provides enhanced nutrient availability that supports a plant rhizosphere microbial community that is quite different from gaps (40–42), and (ii) the plant-protective effect provides a safe haven for canopy soil microbial communities by buffering extreme temperatures, providing UV protection, and preventing desiccation by maintaining soil moisture (43).
Gap soils are not a complete reservoir for the plant canopy soil microbiome.
Studies of global drylands have demonstrated that increased aridity reduces microbial diversity (9, 10). Thus, it is logical to hypothesize that without the protection of plants, gap soil microbial diversity may be more susceptible to aridity stress. Berdugo and colleagues described the response of drylands to increasing aridity as a three-step sequential process, initiated by a “vegetation decline” followed by a phase of “soil disruption” and finally resulting in a “systemic breakdown” along with a reduction in relative abundance of saprotrophic and ectomycorrhizal fungi (5). This scenario raises two related questions: (i) does gap microbial diversity function as an ecosystem reservoir from which plants recruit microbes for plant-rhizosphere soils, (44) and (ii) if the gap does not provide a plant microbiome reservoir, will aridity-induced gap expansion leave vegetation patches as the only reservoirs of critical microbial capacity?
Our results demonstrate that the core microbiome of the plant root zone was comprised of numerous taxa that were sourced from surrounding bulk (gap) soils; however, there was a recognizable number of unique plant canopy soil microbial taxa that were not shared with the associated gap microbial communities. Importantly, the relative abundance of unique taxa in canopy soils increased with aridity; sites 3 and 4 had higher relative abundance of unique canopy soil microbial taxa than sites 1 and 2. These patterns suggest that gap soils do not provide a complete microbial reservoir for the plant root zone microbiome, and the source of the unique taxa in the canopy soil microbiome is unknown. For this reason, we suggest a potential loss of this plant-associated haven of microbial diversity as a result of decreasing plant density or death (45) in the scenario of increasing aridity (4). In this case, the ecosystem would lose a reservoir of microbial diversity that may be critical to plant survival in arid ecosystems (45). Therefore, the canopy-gap dichotomy documented in our study suggests that plant death could lead to ecosystem loss of critical microbial genetic potential, possibly causing the soil disruption and systemic breakdown described by Bergudo et al. (5).
Organic nitrogen is the major nitrogen pool in the Sonoran Desert.
The carbon, nitrogen, and phosphorus levels found in this study are similar to that observed in many desert ecosystems that exhibit fertility island effects (3, 32, 46). TOC was 3.1 to 13.7 times higher in canopy soils than in gap soils across the geolocations studied. In desert ecosystems, organic carbon is an important nutrient source and a good indicator of the plant-associated fertility. Organic carbon supports heterotrophic microbes that carry out depolymerization and mineralization processes needed to increase N availability (47, 48). Multimodel analyses performed by Delgado-Baquerizo et al. (48) to characterize N availability found that aridity is the primary driver for N availability in gaps, but organic carbon is as significant as aridity for N availability under plant canopies. In another study by Delgado-Baquerizo et al., their model explained that increasing aridity will decrease N and C concentrations and increase phosphorus (P) concentrations, hence decoupling C, N, and P cycles (49). Such reduced availability of C and N is predicted to disrupt the stoichiometric balance between C, N, and P, resulting in reduced plant productivity and microbial diversity and activity. Results from our study showed that inorganic N content in desert soils is relatively low and TOC strongly correlates with TN/DN. Therefore, we contend that organic N is the major N pool in the Sonoran Desert soils. Given that organic N is a relevant source of N in this ecosystem, predicted changes in C and N availability due to climatic changes could disrupt the stoichiometric nutrient balance and subsequently lead to loss of ecosystem services.
Nitrogen availability is indicated by ureC in Sonoran Desert soils.
The bacterial ureC gene abundance was significantly greater in canopy soils than gap soils; however, little is known about ureC gene abundance in natural ecosystems. Most studies on ureC gene abundance have been conducted in agricultural settings. The ureC abundance values detected in two unfertilized control agricultural soils, an organic farm soil, a black soil, and vegetated sandstone and siltstone surface mine rock fragments were 4.5 × 10⁷ to 9.5 × 10⁷, 1 × 10⁸ to 1.8 × 10⁸, 4.8 × 10⁷ to 8.4 × 10⁷, and 0.68 × 10⁵ to 3.4 × 10⁵ gene copies g−1 soil, respectively (50–54). Given that the ureC gene abundance in the Sonoran Desert ecosystem is just slightly lower (0.35 × 10⁷ to 2.87 × 10⁷ gene copies g−1 soil) than unamended agricultural and black soils, it suggests that canopy and gap soils have substantial N-mineralization genetic potential among ureolytic bacteria. Additionally, in a recently published organic-inorganic cocomposting study, the ureC gene was validated as a marker for ammonification (i.e., conversion of urea to ammonium) (55). Thus, our study supports the use of ureC as a marker for N ammonification/mineralization in the desert ecosystems. Urease enzyme activity measurements, like ureC gene abundance, were significantly more abundant in canopy soils than gap locations, indicating a strong link between genetic potential and functional capacity. Additionally, ureC gene abundance correlated strongly with TN and DN. These correlations support the contention that mineralization of organic matter is an abundant and relevant source of N in this arid ecosystem.
Phylogenetic associations of ureC in the Sonoran Desert soils.
Like ureC gene abundance, the diversity of ureolytic bacteria have been primarily studied in agricultural soils. Proteobacteria are the most abundant ureolytic bacteria in urea-amended or nonamended agricultural soils followed by Actinobacteria, Verrucomicrobia, and Nitrospirae (50, 53). Other low-abundance phyla containing ureC taxa include Acidobacteria, Bacteroidetes, Cloroflexi, Firmicutes, and Planctomycetes (50, 53). In contrast, the majority of the identifiable ureC sequences in our limited clone library phylogenetically associated with Actinobacteria (42%; Table S7 in the supplemental material), whereas only 4% of the clones were associated with Proteobacteria. As discussed previously, Actinobacteria are more abundant in desert soils than other biomes. Therefore, this novel association of critical ureolysis functional capacity with the dominant desert phylum suggests that the limited and distinct microbial diversity observed in desert soils may not imply a loss of functional capacity but, rather, an important shift in the association of that functional capacity to phylogenetic groups dominant in desert ecosystems. Moreover, it is noteworthy that the ureC primers used in this study were designed using conserved regions within ureC gene from sequences of Proteobacteria (56). Clearly, these primers are compatible with Actinobacteria, indicating that the ureC gene sequence is conserved across taxa. Further, 51% of the ureC gene clones from this study represented taxa that did not have a phylogenetic affiliation in the database (Table S7). This suggests that the ureC phylogenetic distribution in desert soils includes many unidentified bacteria. These results confirm the limitations of current databases and contend that important functional nutrient cycling capacities in desert ecosystems are associated with novel organisms that are currently poorly characterized.
In summary, canopy soils of the Sonoran Desert were found to have significantly higher nutrient content, greater bacterial and fungal diversity, as well as greater N-mineralization genetic potential and urease functional capacity than the associated gap soils. The ureC gene marker for N mineralization was not only identified as a significant indicator of functional capacity in this desert ecosystem, but the shift in association of that functional capacity to phylogenetic groups dominant in desert ecosystems demonstrated an important pattern for desert ecosystem services. Additionally, we showed that Sonoran Desert gap soil microbial community lacks sufficient microbial diversity to serve as a complete reservoir for the plant root zone microbiome. Therefore, it is critical that future research further characterizes the low microbial diversity and functional capacity of arid ecosystem gap soils and determines whether the diversity of these soils is necessary as a reservoir for plant recruitment to the rhizosphere community. We propose that future studies investigate the microbial genetic capacity of gap soils along a wide aridity gradient, continue to identify novel associations between phylogenetic and functional diversity, and extensively evaluate the significance of the gap soil microbiome to the sustainability of plant vegetation density in desert ecosystems.
MATERIALS AND METHODS
Site description and sample collection.
This study focused on arid (0.05 ≤ aridity index < 0.2) and hyperarid (aridity index < 0.05) regions of the western Sonoran Desert, Arizona. Samples were collected from four distinct geographic locations along a 77-km north-south transect (Fig. 1) in October 2017. Site 1 was located in the Kofa National Wildlife Refuge; site 2 was on Route 60 in Pioneer, Arizona; site 3 was on route 95 north of Quartzsite, Arizona; and site 4 was south of Parker, Arizona (Table S1 in the supplemental material). The mean annual temperature (MAT) and mean annual precipitation (MAP) of the geolocations were compiled from the WorldClim global database (57) (Table S1). The aridity index (AI) was compiled from the CGIAR-CSI’s Global Potential Evapotranspiration and Global Aridity Index (Table S1; https://cgiarcsi.community/2019/01/24/global-aridity-index-and-potential-evapotranspiration-climate-database-v2/).
At each geolocation, a 30 m by 20 m sampling area was delineated, and three 30-m transects were laid out in a north-south direction within the sampling area beginning with transect 1 at the northwest corner (Fig. 1D). Transects 2 and 3 were started 10 m east of the first transect. Vegetation metrics, including the number of vegetation patch and gaps, interdistance between each vegetation patch, and number of grasses/shrubs/trees in each patch along the three transects, were recorded (Table S1). The shrub species Larrea tridentata (creosote bush) and Ambrosia dumosa (white bursage) comprised the dominant vegetation (∼70%), and the remaining plants were mixed species. For soil and microbial analyses, soil samples were collected from vegetation canopy and gap soil microsites, where (i) canopy is defined as under the canopy of the creosote bush-white bursage vegetation, and (ii) gap is defined as the interplant barren spaces devoid of any vegetation or biocrusts. Six grab samples were collected along each transect, three under the shrub canopy (canopy) and three in interplant barren spaces (gap; Fig. S5). At each transect, soil was removed from a 20-cm-diameter soil pit excavated to a depth of 20 cm and combined with soils from the other two canopy or gap soil pits along the same transect. The three composite soil samples were homogenized, sieved (2 mm pore size), and subsampled for soil chemical analyses in the field. This was done separately for under shrub canopy and gap soils along each transect. Soils were sampled to a depth of 20 cm to include soils relevant to root development and to minimize the impact of UV radiation on surface soil microbial communities (58). Composite samples for each microsite were collected to capture the heterogeneity of the microsites along the transect. For microbial analysis, samples were collected from each sampling pit sidewall to a depth of 20 cm using sterile instruments. Microbial samples from three pits along the transect were homogenized and combined. Thus, a single microbial composite sample was generated for canopy and gap soil microsites from each transect. These samples were transported on ice to the lab and frozen at −80°C until ready for DNA extraction. Selected soil chemistry measurements (TOC, DOC, DN, and BAP) and 16S rRNA gene amplicon analyses have been reported by Chen et al. (59). In our present study, detailed analyses of soil physicochemical and enzymatic properties, microbial diversity and composition, and gene abundance have been described.
Soil physicochemical and enzymatic analyses.
Soil pH and electric conductivity (EC) were determined from a 1:2 soil-to-distilled water (dH2O) slurry after 30 min of shaking (60). Dry soils were milled (Spex 8000D mixer/mill; Metuchen, NJ) prior to analysis for TC, TN, DOC, dissolved inorganic carbon (DIC), and DN. The TC and TN were analyzed using ECS 4010 C and N analyzer (Costech Analytical Technologies, Valencia, CA). The DOC, DIC, and DN (1:15 soil: dH2O; shaken at 200 rpm for 24 h at room temperature) were quantified by a TOC-L analyzer (Shimadzu Scientific Instruments, Columbia, MD). For measurement of TOC, soil samples were digested with HCl to remove dissolved carbonates followed by washing with water and drying at 70°C. The dried samples were then combusted in the presence of CuO in vacuum, and the released carbon dioxide was cryogenically distilled from the mixture of combustion gases, manometrically quantified, and converted to carbon mass (University of Arizona Accelerator Mass Spectrometry Lab). The NO3-N (1:5 wt/vol in KCl solution) was measured using the Cd reduction method (61). The NH4-N (1:2 wt/vol in KCl solution) was quantified using the Hach ammonia salicylate reagent and ammonia cyanurate reagent (Hach, Loveland, CO; Sinsabaugh lab protocol 2005). BAP was measured using the Olsen method (62), and soil texture was determined using the hydrometer method (63). Urease enzyme activity was measured using the Kandeler and Gerber (64) method with modifications as per Fioretto et al. (65).
Molecular analyses of microbial communities.
DNA extraction from 0.5-g soil samples was carried out using FastDNA Spin for Soil kit (MP Biomedicals, Solon, OH, USA) with modifications to enhance DNA recovery from oligotrophic arid soil samples. All consumables and reagents lacking biomolecules were sterilized with UV light for 30 min. Further modifications include the following: (i) 0.8 ml of binding matrix was used to bind DNA, and after mixing and settling the binding matrix, all supernatant was removed and discarded without filtering through the spin filter; (ii) binding matrix was washed 1 or 2 times with 0.5 ml of 6 M guanidine thiocyanate (Sigma-Aldrich, St. Louis, MO) to remove organic matter; (iii) the wash with salt/ethanol wash solution (SEWS-M) reagent was repeated twice to remove coextracted salts; (iv) spin filters were dried at 37°C for 10 min under a laminar flow hood prior to DNA elution; (v) a 2-fold DNA elution was performed using two sequential aliquots of 50 µl of UV-sterilized, diethyl pyrocarbonate (DEPC)-treated, nuclease-free water (Growcells, Irvine, CA) preheated to 60°C in which each 50-μl aliquot was followed by incubation at 60°C for 10 min and centrifugation for 1 min. The extracted DNA was quantified using the Qubit double-stranded DNA (dsDNA) high-sensitivity assay kit (Life Technologies, NY, USA). All the samples had quantifiable DNA ranging from 3.17 to 41.5 ng µl−1. Paired-end amplicon sequencing of DNA extracts was performed using 16S rRNA gene primers 515F/806R (bacteria/archaea) and internal transcribed spacer (ITS) primers ITS1f-ITS2 (fungi) as described in Walters et al. (66). The purified PCR products from all samples were pooled in equimolar concentrations and sequenced on a 2 × 150-bp Illumina MiSeq platform. All sequencing runs were conducted at the Microbiome Core, Steele Children’s Research Center, University of Arizona.
Sequence processing.
Raw reads were demultiplexed using the idemp tool (https://github.com/yhwu/idemp). Further bioinformatics analyses were carried out using the DADA2 pipeline (67). The demultiplexed reads were trimmed to retain 140 bases of the forward and reverse reads. The paired‐end reads were joined using the default overlap of at least 12 bases and then grouped into ASVs. The ASVs were subjected to chimera removal. Postquality filtering, a total of 4,193,573 sequence reads remained for 16S rRNA gene and 2,901,758 for ITS, with an average of 149,770 ± 33,143 and 120,907 ± 37,410 sequence reads per sample for the 16S rRNA gene and ITS region, respectively. Taxonomy assignments were determined with the RDP classifier (68) using SILVA (69) and UNITE ITS (70) databases for bacterial/archaeal and fungal communities, respectively. Contaminants were removed from the ASV tables through comparisons of samples and the blanks, leaving 16,484 and 2,234 ASVs for bacterial/archaeal and fungal communities, respectively. The taxonomy tables obtained were then normalized using a cumulative sum scaling approach (71). The taxonomic distributions of bacterial/archaeal communities were compared to other desert and nondesert biomes using published data sets (8, 10). Additionally, the FUNGuild tool was utilized to predict fungal guilds from ITS taxonomic assignments (72).
Bacterial gene abundance using quantitative PCR.
Bacterial 16S rRNA and ureC genes were quantified to assess the bacterial copy number and N-mineralization capacity, respectively. The V3-V4 variable region of the 16S rRNA gene was amplified using primers 338F and 518R (73). The bacterial ureC gene, encoding a subunit of the urease enzyme, was amplified using the primers ureC1F and ureC2R (56). Conserved regions within the ureC gene from Ralstonia eutropha and other ureolytic proteobacteria, including species from the genera Nitrosospira and Nitrosococcus, were used to design degenerate primers for the ureC gene (56).
The quantitative PCR (qPCR) standard for 16S rRNA gene quantification was described previously (74). For the bacterial ureC gene, a limited clone library was constructed from the collected soil samples as described in reference 75, and the resulting ureC sequences were matched to the NCBI protein database using BLASTX. The clone for the standard was selected based on 100% sequence match to the query in the NCBI database (Table S7). Plasmids were quantified using Qubit dsDNA high-sensitivity assay kit. The qPCRs were performed in triplicate using a 96-well plate on a CFX96 real-time detection system (Bio-Rad Laboratories, Hercules, CA). In a 10-μl reaction, 5 μl SsoFast EvaGreen Supermix (Bio-Rad Laboratories, Hercules, CA), either 0.2 μM (ureC) or 0.3 μM (16S rRNA gene) primers and 1 μl of sample DNA extract or plasmid standards were used.
All qPCR standards and samples were run in triplicate. Amplification conditions for the 16S rRNA gene were as described previously (74) with an amplification efficiency of 97 to 100%, an R2 of 0.99, and a calibration curve with 103 to 108 copies of the 16S rRNA gene. The amplification conditions for ureC gene were 98°C for 3 min, 50 cycles of 98°C for 20 s, 60°C for 25 s with an amplification efficiency greater than 91%, an R2 of 0.98 to 0.99, and a calibration curve of 102 to 106 gene copies. Melt curves were generated at the end of each run with a temperature range of 65 to 95°C in 0.5°C increments. Amplicon specificity was confirmed by melt curve analysis and gel electrophoresis. Interplate calibration was performed to normalize for interplate variations in amplification efficiencies among plates being assayed for the same gene (CFX Manager software).
Statistical analyses.
Statistical analyses were implemented in R (R Core Team). Significant differences in soil physicochemical properties, microbial richness, and gene abundance between canopy and gap soils were determined using linear mixed-effects models using the lme4 and lmerTest packages. Microsite and geolocation were used as fixed and random effects, respectively. The Satterthwaites (76) approximations were used to estimate the statistical significance of the fixed effect. The R2 value of the fixed effect was assessed as described in Nakagawa and Schielzeth (77). Community dissimilarity was calculated using the Bray-Curtis distance, and NMDS ordination was used for visualization. Microbial community differences among geolocations and microsites were examined using PERMANOVA (78). Further, community dispersion within the microsite (multivariate dispersion) was calculated. FUNGuild differences were also evaluated using negative binomial generalized linear mixed-effects models. Additional statistical tests are described in the supplemental methods. The R scripts used for the statistical analyses are available on GitHub at https://github.com/kush-priyanka/Arid_Soil_Microbiome.
Data availability.
Raw sequence data for the 16S rRNA gene and ITS were submitted to NCBI’s BioProject under the accession number PRJNA610058.
Supplementary Material
ACKNOWLEDGMENTS
The research was supported by the National Institute of Environmental Health Sciences grant P42ES004940 and University of Arizona’s Research, Discovery, and Innovation Accelerate for Success grant 2018 to 2019.
We thank Mary Kay Amistadi and Rachel Neville of the Arizona Laboratory for Emerging Contaminants for performing DOC, DIC, and DN analyses. We are also thankful to Gregory Hodgins at the Accelerator Mass Spectrometry Lab for TOC measurements. Many thanks to Daniel Laubitz at Microbiome Core, University of Arizona Steele Children’s Research Center for providing quality control and technical support for amplicon sequencing. In addition, we acknowledge Karen Serrano, Lia Ossanna, Emma Ison, and Stephanie Honeker for performing pH and EC testing, DNA extractions, bioavailable phosphorus, and soil texture analyses, respectively.
Footnotes
Supplemental material is available online only.
REFERENCES
- 1.Aguiar MR, Sala OE. 1999. Patch structure, dynamics and implications for the functioning of arid ecosystems. Trends Ecol Evol 14:273–277. doi: 10.1016/S0169-5347(99)01612-2. [DOI] [PubMed] [Google Scholar]
- 2.Schlesinger WH, Raikes JA, Hartley AE, Cross AF. 1996. On the spatial pattern of soil nutrients in desert ecosystems. Ecology 77:364–374. doi: 10.2307/2265615. [DOI] [Google Scholar]
- 3.de Graaff M-A, Throop HL, Verburg PSJ, Arnone JA, Campos X. 2014. A synthesis of climate and vegetation cover effects on biogeochemical cycling in shrub-dominated drylands. Ecosystems 17:931–945. doi: 10.1007/s10021-014-9764-6. [DOI] [Google Scholar]
- 4.Seager R, Ting M, Held I, Kushnir Y, Lu J, Vecchi G, Huang HP, Harnik N, Leetmaa A, Lau NC, Li C, Velez J, Naik N. 2007. Model projections of an imminent transition to a more arid climate in southwestern North America. Science 316:1181–1184. doi: 10.1126/science.1139601. [DOI] [PubMed] [Google Scholar]
- 5.Berdugo M, Delgado-Baquerizo M, Soliveres S, Hernández-Clemente R, Zhao Y, Gaitán JJ, Gross N, Saiz H, Maire V, Lehman A, Rillig MC, Solé RV, Maestre FT. 2020. Global ecosystem thresholds driven by aridity. Science 367:787–790. doi: 10.1126/science.aay5958. [DOI] [PubMed] [Google Scholar]
- 6.Sun GQ, Wang CH, Chang LL, Wu YP, Li L, Jin Z. 2018. Effects of feedback regulation on vegetation patterns in semi-arid environments. Appl Math Model 61:200–215. doi: 10.1016/j.apm.2018.04.010. [DOI] [Google Scholar]
- 7.Kéfi S, Rietkerk M, Alados CL, Pueyo Y, Papanastasis VP, Elaich A, De Ruiter PC. 2007. Spatial vegetation patterns and imminent desertification in Mediterranean arid ecosystems. Nature 449:213–217. doi: 10.1038/nature06111. [DOI] [PubMed] [Google Scholar]
- 8.Fierer N, Leff JW, Adams BJ, Nielsen UN, Bates ST, Lauber CL, Owens S, Gilbert JA, Wall DH, Caporaso JG. 2012. Cross-biome metagenomic analyses of soil microbial communities and their functional attributes. Proc Natl Acad Sci U S A 109:21390–21395. doi: 10.1073/pnas.1215210110. [DOI] [PMC free article] [PubMed] [Google Scholar]
- 9.Maestre FT, Delgado-Baquerizo M, Jeffries TC, Eldridge DJ, Ochoa V, Gozalo B, Quero JL, García-Gómez M, Gallardo A, Ulrich W, Bowker MA, Arredondo T, Barraza-Zepeda C, Bran D, Florentino A, Gaitán J, Gutiérrez JR, Huber-Sannwald E, Jankju M, Mau RL, Miriti M, Naseri K, Ospina A, Stavi I, Wang D, Woods NN, Yuan X, Zaady E, Singh BK. 2015. Increasing aridity reduces soil microbial diversity and abundance in global drylands. Proc Natl Acad Sci U S A 112:15684–15689. doi: 10.1073/pnas.1516684112. [DOI] [PMC free article] [PubMed] [Google Scholar]
- 10.Neilson JW, Califf K, Cardona C, Copeland A, van Treuren W, Josephson KL, Knight R, Gilbert JA, Quade J, Caporaso JG, Maier RM. 2017. Significant impacts of increasing aridity on the arid soil microbiome. mSystems 2:e00195-16. doi: 10.1128/mSystems.00195-16. [DOI] [PMC free article] [PubMed] [Google Scholar]
- 11.Bachar A, Ines M, Soares M, Gillor O. 2012. The effect of resource islands on abundance and diversity of bacteria in arid soils. Microb Ecol 63:694–700. doi: 10.1007/s00248-011-9957-x. [DOI] [PubMed] [Google Scholar]
- 12.Ben-David EA, Zaady E, Sher Y, Nejidat A. 2011. Assessment of the spatial distribution of soil microbial communities in patchy arid and semi-arid landscapes of the Negev Desert using combined PLFA and DGGE analyses. FEMS Microbiol Ecol 76:492–503. doi: 10.1111/j.1574-6941.2011.01075.x. [DOI] [PubMed] [Google Scholar]
- 13.Hortal S, Bastida F, Armas C, Lozano YM, Moreno JL, García C, Pugnaire FI. 2013. Soil microbial community under a nurse-plant species changes in composition, biomass and activity as the nurse grows. Soil Biol Biochem 64:139–146. doi: 10.1016/j.soilbio.2013.04.018. [DOI] [Google Scholar]
- 14.Garcia DE, Lopez BR, de-Bashan LE, Hirsch AM, Maymon M, Bashan Y. 2018. Functional metabolic diversity of the bacterial community in undisturbed resource island soils in the southern Sonoran Desert. Land Degrad Dev 29:1467–1477. doi: 10.1002/ldr.2905. [DOI] [Google Scholar]
- 15.Nielsen UN, Ball BA. 2015. Impacts of altered precipitation regimes on soil communities and biogeochemistry in arid and semi-arid ecosystems. Glob Chang Biol 21:1407–1421. doi: 10.1111/gcb.12789. [DOI] [PubMed] [Google Scholar]
- 16.De Neve S. 2017. Organic matter mineralization as a source of nitrogen, p 65–83. In Tei F, Nicola S, Benincasa P (ed), Advances in research on fertilization management of vegetable crops. Advances in Olericulture. Springer, Cham, Switzerland. [Google Scholar]
- 17.Jan MT, Roberts P, Tonheim SK, Jones DL. 2009. Protein breakdown represents a major bottleneck in nitrogen cycling in grassland soils. Soil Biol Biochem 41:2272–2282. doi: 10.1016/j.soilbio.2009.08.013. [DOI] [Google Scholar]
- 18.Gresham TLT, Sheridan PP, Watwood ME, Fujita Y, Colwell FS. 2007. Validation of ureC-based primers for groundwater detection of urea-hydrolyzing bacteria. Geomicrobiol J 24:353–364. doi: 10.1080/01490450701459283. [DOI] [Google Scholar]
- 19.Baraniya D, Puglisi E, Ceccherini MT, Pietramellara G, Giagnoni L, Arenella M, Nannipieri P, Renella G. 2016. Protease encoding microbial communities and protease activity of the rhizosphere and bulk soils of two maize lines with different N uptake efficiency. Soil Biol Biochem 96:176–179. doi: 10.1016/j.soilbio.2016.02.001. [DOI] [Google Scholar]
- 20.Butterfield BJ, Betancourt JL, Turner RM, Briggs JM. 2010. Facilitation drives 65 years of vegetation change in the Sonoran Desert. Ecology 91:1132–1139. doi: 10.1890/09-0145.1. [DOI] [PubMed] [Google Scholar]
- 21.Mosqueira MJ, Marasco R, Fusi M, Michoud G, Merlino G, Cherif A, Daffonchio D. 2019. Consistent bacterial selection by date palm root system across heterogeneous desert oasis agroecosystems. Sci Rep 9:4033. doi: 10.1038/s41598-019-40551-4. [DOI] [PMC free article] [PubMed] [Google Scholar]
- 22.Marasco R, Mosqueira MJ, Fusi M, Ramond J-B, Merlino G, Booth JM, Maggs-Kölling G, Cowan DA, Daffonchio D. 2018. Rhizosheath microbial community assembly of sympatric desert speargrasses is independent of the plant host. Microbiome 6:215. doi: 10.1186/s40168-018-0597-y. [DOI] [PMC free article] [PubMed] [Google Scholar]
- 23.Butterfield BJ, Bradford JB, Armas C, Prieto I, Pugnaire FI. 2016. Does the stress‐gradient hypothesis hold water? Disentangling spatial and temporal variation in plant effects on soil moisture in dryland systems. Funct Ecol 30:10–19. doi: 10.1111/1365-2435.12592. [DOI] [Google Scholar]
- 24.Barnard RL, Osborne CA, Firestone MK. 2013. Responses of soil bacterial and fungal communities to extreme desiccation and rewetting. ISME J 7:2229–2241. doi: 10.1038/ismej.2013.104. [DOI] [PMC free article] [PubMed] [Google Scholar]
- 25.Chanal A, Chapon V, Benzerara K, Barakat M, Christen R, Achouak W, Barras F, Heulin T. 2006. The desert of Tataouine: an extreme environment that hosts a wide diversity of microorganisms and radiotolerant bacteria. Environ Microbiol 8:514–525. doi: 10.1111/j.1462-2920.2005.00921.x. [DOI] [PubMed] [Google Scholar]
- 26.Hu D, Zang Y, Mao Y, Gao B. 2019. Identification of molecular markers that are specific to the class thermoleophilia. Front Microbiol 10:1185. doi: 10.3389/fmicb.2019.01185. [DOI] [PMC free article] [PubMed] [Google Scholar]
- 27.Battistuzzi FU, Hedges SB. 2009. A major clade of prokaryotes with ancient adaptations to life on land. Mol Biol Evol 26:335–343. doi: 10.1093/molbev/msn247. [DOI] [PubMed] [Google Scholar]
- 28.Leung PM, Bay SK, Meier DV, Chiri E, Cowan DA, Gillor O, Woebken D, Greening C. 2020. Energetic basis of microbial growth and persistence in desert ecosystems. mSystems 5:e00495-19. doi: 10.1128/mSystems.00495-19. [DOI] [PMC free article] [PubMed] [Google Scholar]
- 29.Van Goethem MW, Makhalanyane TP, Cowan DA, Valverde A. 2017. Cyanobacteria and Alphaproteobacteria may facilitate cooperative interactions in niche communities. Front Microbiol 8:2099. doi: 10.3389/fmicb.2017.02099. [DOI] [PMC free article] [PubMed] [Google Scholar]
- 30.Gordon H, Haygarth PM, Bardgett RD. 2008. Drying and rewetting effects on soil microbial community composition and nutrient leaching. Soil Biol Biochem 40:302–311. doi: 10.1016/j.soilbio.2007.08.008. [DOI] [Google Scholar]
- 31.de Vries FT, Liiri ME, Bjørnlund L, Bowker MA, Christensen S, Setälä HM, Bardgett RD. 2012. Land use alters the resistance and resilience of soil food webs to drought. Nat Clim Chang 2:276–280. doi: 10.1038/nclimate1368. [DOI] [Google Scholar]
- 32.Ochoa-Hueso R, Eldridge DJ, Delgado-Baquerizo M, Soliveres S, Bowker MA, Gross N, Le Bagousse-Pinguet Y, Quero JL, García-Gómez M, Valencia E, Arredondo T, Beinticinco L, Bran D, Cea A, Coaguila D, Dougill AJ, Espinosa CI, Gaitán J, Guuroh RT, Guzman E, Gutiérrez JR, Hernández RM, Huber-Sannwald E, Jeffries T, Linstädter A, Mau RL, Monerris J, Prina A, Pucheta E, Stavi I, Thomas AD, Zaady E, Singh BK, Maestre FT. 2018. Soil fungal abundance and plant functional traits drive fertile island formation in global drylands. J Ecol 106:242–253. doi: 10.1111/1365-2745.12871. [DOI] [Google Scholar]
- 33.Zeng Q, Liu Y, Xiao L, An S. 2020. Climate and soil properties regulate soil fungal communities on the Loess Plateau. Pedobiologia (Jena) 81–82:150668. doi: 10.1016/j.pedobi.2020.150668. [DOI] [Google Scholar]
- 34.Suleiman MK, Dixon K, Commander L, Nevill P, Quoreshi AM, Bhat NR, Manuvel AJ, Sivadasan MT. 2019. Assessment of the diversity of fungal community composition associated with Vachellia pachyceras and its rhizosphere soil from Kuwait Desert. Front Microbiol 10:63. doi: 10.3389/fmicb.2019.00063. [DOI] [PMC free article] [PubMed] [Google Scholar]
- 35.Qin H, Wang H, Strong PJ, Li Y, Xu Q, Wu Q. 2014. Rapid soil fungal community response to intensive management in a bamboo forest developed from rice paddies. Soil Biol Biochem 68:177–184. doi: 10.1016/j.soilbio.2013.09.031. [DOI] [Google Scholar]
- 36.Pöggeler S. 2011. Evolution of multicopper oxidase genes in Coprophilous and non-Coprophilous members of the order Sordariales. Curr Genomics 12:95–103. doi: 10.2174/138920211795564368. [DOI] [PMC free article] [PubMed] [Google Scholar]
- 37.Entwistle EM, Zak DR, Edwards IP. 2013. Long-term experimental nitrogen deposition alters the composition of the active fungal community in the forest floor. Soil Sci Soc Am J 77:1648–1658. doi: 10.2136/sssaj2013.05.0179. [DOI] [Google Scholar]
- 38.Hempel S, Renker C, Buscot F. 2007. Differences in the species composition of arbuscular mycorrhizal fungi in spore, root and soil communities in a grassland ecosystem. Environ Microbiol 9:1930–1938. doi: 10.1111/j.1462-2920.2007.01309.x. [DOI] [PubMed] [Google Scholar]
- 39.Collins SL, Sinsabaugh RL, Crenshaw C, Green L, Porras-Alfaro A, Stursova M, Zeglin LH. 2008. Pulse dynamics and microbial processes in aridland ecosystems. J Ecol 96:413–420. doi: 10.1111/j.1365-2745.2008.01362.x. [DOI] [Google Scholar]
- 40.Pointing SB, Belnap J. 2012. Microbial colonization and controls in dryland systems. Nat Rev Microbiol 10:551–562. doi: 10.1038/nrmicro2831. [DOI] [PubMed] [Google Scholar]
- 41.Mueller RC, Belnap J, Kuske CR. 2015. Soil bacterial and fungal community responses to nitrogen addition across soil depth and microhabitat in an arid shrubland. Front Microbiol 6:891. doi: 10.3389/fmicb.2015.00891. [DOI] [PMC free article] [PubMed] [Google Scholar]
- 42.Steven B, Gallegos-Graves LV, Yeager C, Belnap J, Kuske CR. 2014. Common and distinguishing features of the bacterial and fungal communities in biological soil crusts and shrub root zone soils. Soil Biol Biochem 69:302–312. doi: 10.1016/j.soilbio.2013.11.008. [DOI] [Google Scholar]
- 43.Cortina J, Maestre FT. 2005. Plant effects on soils in drylands: implications for community dynamics and ecosystem restoration. Kluwer Academic Publishers, Dordrecht, Netherlands. [Google Scholar]
- 44.Yeoh YK, Dennis PG, Paungfoo-Lonhienne C, Weber L, Brackin R, Ragan MA, Schmidt S, Hugenholtz P. 2017. Evolutionary conservation of a core root microbiome across plant phyla along a tropical soil chronosequence. Nat Commun 8:215. doi: 10.1038/s41467-017-00262-8. [DOI] [PMC free article] [PubMed] [Google Scholar]
- 45.Honeker LK, Gullo CF, Neilson JW, Chorover J, Maier RM. 2019. Effect of re-acidification on buffalo grass rhizosphere and bulk microbial communities during phytostabilization of metalliferous mine tailings. Front Microbiol 10:1209. doi: 10.3389/fmicb.2019.01209. [DOI] [PMC free article] [PubMed] [Google Scholar]
- 46.Butterfield BJ, Briggs JM. 2009. Patch dynamics of soil biotic feedbacks in the Sonoran Desert. J Arid Env 73:96–102. doi: 10.1016/j.jaridenv.2008.09.012. [DOI] [Google Scholar]
- 47.Cookson WR, Müller C, O'Brien PA, Murphy DV, Grierson PF. 2006. Nitrogen dynamics in an Australian semiarid grassland soil. Ecology 87:2047–2057. doi: 10.1890/0012-9658(2006)87[2047:NDIAAS]2.0.CO;2]. [DOI] [PubMed] [Google Scholar]
- 48.Delgado-Baquerizo M, Maestre FT, Gallardo A, Quero JL, Ochoa V, García-Gómez M, Escolar C, García-Palacios P, Berdugo M, Valencia E, Gozalo B, Noumi Z, Derak M, Wallenstein MD. 2013. Aridity modulates N availability in arid and semiarid Mediterranean grasslands. PLoS One 8:e59807. doi: 10.1371/journal.pone.0059807. [DOI] [PMC free article] [PubMed] [Google Scholar]
- 49.Delgado-Baquerizo M, Maestre FT, Gallardo A, Bowker MA, Wallenstein MD, Luis Quero J, Ochoa V, Gozalo B, García-Gómez M, Soliveres S, García-Palacios P, Berdugo M, Valencia E, Escolar C, Arredondo T, Barraza-Zepeda C, Bran D, Carreira JA, Chaieb M, Conceição AA, Derak M, Eldridge DJ, Escudero A, Espinosa CI, Gaitán J, Gatica MG, Gómez-González S, Guzman E, Gutiérrez JR, Florentino A, Hepper E, Hernández RM, Huber-Sannwald E, Jankju M, Liu J, Mau RL, Miriti M, Monerris J, Naseri K, Noumi Z, Polo V, Prina A, Pucheta E, Ramírez E, Ramírez-Collantes DA, Romão R, Tighe M, Torres D, Torres-Díaz C, Ungar ED, et al. 2013. Decoupling of soil nutrient cycles as a function of aridity in global drylands. Nature 502:672–676. doi: 10.1038/nature12670. [DOI] [PubMed] [Google Scholar]
- 50.Sun R, Li W, Hu C, Liu B. 2019. Long-term urea fertilization alters the composition and increases the abundance of soil ureolytic bacterial communities in an upland soil. FEMS Microbiol Ecol 95:44. doi: 10.1093/femsec/fiz044. [DOI] [PubMed] [Google Scholar]
- 51.Ouyang Y, Reeve JR, Norton JM. 2018. Soil enzyme activities and abundance of microbial functional genes involved in nitrogen transformations in an organic farming system. Biol Fertil Soils 54:437–450. doi: 10.1007/s00374-018-1272-y. [DOI] [Google Scholar]
- 52.Ouyang Y, Norton JM. 2020. Short-term nitrogen fertilization affects microbial community composition and nitrogen mineralization functions in an agricultural soil. Appl Environ Microbiol 86:e02278-19. doi: 10.1128/AEM.02278-19. [DOI] [PMC free article] [PubMed] [Google Scholar]
- 53.Wang L, Luo X, Liao H, Chen W, Wei D, Cai P, Huang Q. 2018. Ureolytic microbial community is modulated by fertilization regimes and particle-size fractions in a Black soil of Northeastern China. Soil Biol Biochem 116:171–178. doi: 10.1016/j.soilbio.2017.10.012. [DOI] [Google Scholar]
- 54.Yarwood S, Wick A, Williams M, Daniels WL. 2015. Parent material and vegetation influence soil microbial community structure following 30-years of rock weathering and pedogenesis. Microb Ecol 69:383–394. doi: 10.1007/s00248-014-0523-1. [DOI] [PubMed] [Google Scholar]
- 55.Yu H, Xie B, Khan R, Yan H, Shen G. 2020. The changes in functional marker genes associated with nitrogen biological transformation during organic-inorganic co-composting. Bioresour Technol 295. doi: 10.1016/j.biortech.2019.122197. [DOI] [PubMed] [Google Scholar]
- 56.Koper TE, El-Sheikh AF, Norton JM, Klotz MG. 2004. Urease-encoding genes in ammonia-oxidizing bacteria. Appl Environ Microbiol 70:2342–2348. doi: 10.1128/aem.70.4.2342-2348.2004. [DOI] [PMC free article] [PubMed] [Google Scholar]
- 57.Fick SE, Hijmans RJ. 2017. WorldClim 2: new 1-km spatial resolution climate surfaces for global land areas. Int J Climatol 37:4302–4315. doi: 10.1002/joc.5086. [DOI] [Google Scholar]
- 58.Maier RM, Drees KP, Neilson JW, Henderson DA, Quade J, Betancourt JL, Navarro-Gonzalez R, Rainey FA, McKay CP. 2004. Microbial life in the Atacama Desert. Science 306:1289–1291. doi: 10.1126/science.306.5700.1289c. [DOI] [PubMed] [Google Scholar]
- 59.Chen Y, Neilson JW, Kushwaha P, Maier RM, Barberán A. 2020. Life-history strategies of soil microbial communities in an arid ecosystem. ISME J:1–9. doi: 10.1038/s41396-020-00803-y. [DOI] [PMC free article] [PubMed] [Google Scholar]
- 60.Honeker LK, Neilson JW, Root RA, Gil-Loaiza J, Chorover J, Maier RM. 2017. Bacterial rhizoplane colonization patterns of Buchloe dactyloides growing in metalliferous mine tailings reflect plant status and biogeochemical conditions. Microb Ecol 74:853–867. doi: 10.1007/s00248-017-0998-7. [DOI] [PMC free article] [PubMed] [Google Scholar]
- 61.Dorich RA, Nelson DW. 1984. Evaluation of manual cadmium reduction methods for determination of nitrate in potassium chloride extracts of soils. Soil Sci Soc Am J 48:72–75. doi: 10.2136/sssaj1984.03615995004800010013x. [DOI] [Google Scholar]
- 62.Olsen S, Cole C, Watanabe E, Dean L. 1954. Estimation of available phosphorus in soils by extraction with sodium bicarbonate. U.S. Department of Agriculture. Washington, DC. [Google Scholar]
- 63.Gee GW, Bauder JW. 1979. Particle size analysis by hydrometer: a simplified method for routine textural analysis and a sensitivity test of measurement parameters. Soil Sci Soc Am J 43:1004–1007. doi: 10.2136/sssaj1979.03615995004300050038x. [DOI] [Google Scholar]
- 64.Kandeler E, Gerber H. 1988. Short-term assay of soil urease activity using colorimetric determination of ammonium. Biol Fert Soils 6:68–72. doi: 10.1007/BF00257924. [DOI] [Google Scholar]
- 65.Fioretto A, Papa S, Pellegrino A, Ferrigno A. 2009. Microbial activities in soils of a Mediterranean ecosystem in different successional stages. Soil Biol Biochem 41:2061–2068. doi: 10.1016/j.soilbio.2009.07.010. [DOI] [Google Scholar]
- 66.Walters W, Hyde ER, Berg-Lyons D, Ackermann G, Humphrey G, Parada A, Gilbert JA, Jansson JK, Gregory Caporaso J, Fuhrman JA, Apprill A, Knight R, Walters CW. 2016. Improved bacterial 16S rRNA gene (V4 and V4-5) and fungal internal transcribed spacer marker gene primers for microbial community surveys. mSystems 1:e00009-15. doi: 10.1128/mSystems.00009-15. [DOI] [PMC free article] [PubMed] [Google Scholar]
- 67.Callahan BJ, Mcmurdie PJ, Rosen MJ, Han AW, Johnson AJA, Holmes SP. 2016. DADA2: high-resolution sample inference from Illumina amplicon data. Nat Methods 13:581–583. doi: 10.1038/nmeth.3869. [DOI] [PMC free article] [PubMed] [Google Scholar]
- 68.Wang Q, Garrity GM, Tiedje JM, Cole JR. 2007. Naive Bayesian classifier for rapid assignment of rRNA sequences into the new bacterial taxonomy. Appl Environ Microbiol 73:5261–5267. doi: 10.1128/AEM.00062-07. [DOI] [PMC free article] [PubMed] [Google Scholar]
- 69.Quast C, Pruesse E, Yilmaz P, Gerken J, Schweer T, Yarza P, Peplies J, Glöckner FO. 2013. The SILVA ribosomal RNA gene database project: improved data processing and web-based tools. Nucleic Acids Res 41:D590–D596. doi: 10.1093/nar/gks1219. [DOI] [PMC free article] [PubMed] [Google Scholar]
- 70.Nilsson RH, Larsson K-H, Taylor AFS, Bengtsson-Palme J, Jeppesen TS, Schigel D, Kennedy P, Picard K, Glöckner FO, Tedersoo L, Saar I, Kõljalg U, Abarenkov K. 2019. The UNITE database for molecular identification of fungi: handling dark taxa and parallel taxonomic classifications. Nucleic Acids Res 47:D259–D264. doi: 10.1093/nar/gky1022. [DOI] [PMC free article] [PubMed] [Google Scholar]
- 71.Paulson JN, Pop M, Bravo HC. 2013. metagenomeSeq: statistical analysis for sparse high-throughput sequencing. Bioconductor package. http://bioconductor.org/packages/release/bioc/html/metagenomeSeq.html.
- 72.Nguyen NH, Song Z, Bates ST, Branco S, Tedersoo L, Menke J, Schilling JS, Kennedy PG. 2016. FUNGuild: an open annotation tool for parsing fungal community datasets by ecological guild. Fungal Ecol 20:241–248. doi: 10.1016/j.funeco.2015.06.006. [DOI] [Google Scholar]
- 73.Einen J, Thorseth IH, Øvreås L, Øvreås Ø. 2008. Enumeration of Archaea and Bacteria in seafloor basalt using real-time quantitative PCR and fluorescence microscopy. FEMS Microbiol Lett 282:182–187. doi: 10.1111/j.1574-6968.2008.01119.x. [DOI] [PubMed] [Google Scholar]
- 74.Ortiz M, Legatzki A, Neilson JW, Fryslie B, Nelson WM, Wing RA, Soderlund CA, Pryor BM, Maier RM. 2014. Making a living while starving in the dark: metagenomic insights into the energy dynamics of a carbonate cave. ISME J 8:478–491. doi: 10.1038/ismej.2013.159. [DOI] [PMC free article] [PubMed] [Google Scholar]
- 75.Delgado-Baquerizo M, Maestre FT, Eldridge DJ, Singh BK. 2016. Microsite differentiation drives the abundance of soil ammonia oxidizing bacteria along aridity gradients. Front Microbiol 7:505. doi: 10.3389/fmicb.2016.00505. [DOI] [PMC free article] [PubMed] [Google Scholar]
- 76.Satterthwaite FE. 1941. Synthesis of variance. Psychometrika 6:309–316. doi: 10.1007/BF02288586. [DOI] [Google Scholar]
- 77.Nakagawa S, Schielzeth H. 2013. A general and simple method for obtaining R2 from generalized linear mixed-effects models. Methods Ecol Evol 4:133–142. doi: 10.1111/j.2041-210x.2012.00261.x. [DOI] [Google Scholar]
- 78.Anderson MJ. 2001. A new method for non-parametric multivariate analysis of variance. Austral Ecol 26:32–46. doi: 10.1111/j.1442-9993.2001.01070.pp.x. [DOI] [Google Scholar]
Associated Data
This section collects any data citations, data availability statements, or supplementary materials included in this article.
Supplementary Materials
Data Availability Statement
Raw sequence data for the 16S rRNA gene and ITS were submitted to NCBI’s BioProject under the accession number PRJNA610058.