

Abstract
Rhythmic actions are characterizable as a repeating invariant pattern of movement together with variability taking the form of cycle-to-cycle fluctuations. Variability in behavioral measures is atypically random, and often exhibits serial temporal dependencies and statistical self-similarity in the scaling of variability magnitudes across timescales. Self-similar (i.e. fractal) variability scaling is evident in measures of both brain and behavior. Variability scaling structure can be quantified via the scaling exponent (α) from detrended fluctuation analysis (DFA). Here we study the task of coordinating thumb-finger tapping to the beats of constructed auditory stimuli. We test the hypothesis that variability scaling evident in tap-to-tap intervals as well as in the fluctuations of cortical hemodynamics will become entrained to (i.e. drawn toward) manipulated changes in the variability scaling of a stimulus’s beat-to-beat intervals. Consistent with this hypothesis, manipulated changes of the exponent α of the experimental stimuli produced corresponding changes in the exponent α of both tap-to-tap intervals and cortical hemodynamics. The changes in hemodynamics were observed in both motor and sensorimotor cortical areas in the contralateral hemisphere. These results were observed only for the longer timescales of the detrended fluctuation analysis used to measure the exponent α. These findings suggest that complex auditory stimuli engage both brain and behavior at the level of variability scaling structures.
Keywords: 1/f scaling, motor control, fNIRS, sensorimotor synchronization, complexity matching
INTRODUCTION
The organization of context-adapted behaviors arises from the interdependent dynamics of the nervous system, physical body, and environment (Chiel and Beer, 1997). Effective context-adapted behavior is thought to depend upon multi-scaled and nested system organizations (Bernstein, 1996; Diniz et al., 2011; Delignières and Marmelat, 2013; Harrison and Stergiou, 2015; Werner, 2010). Accordingly, multi-scaled and nested structure is evident in both the architecture and functional activity of brain (Bassett and Bullmore, 2006; Bassett et al., 2006; Werner, 2010; Bullmore and Sporns, 2012; Di leva et al., 2014) and body (Turvey and Fonseca, 2014). It is also evident in the structure of the environment (Mandelbrot, 1990; Anderson and Schooler, 1991; Blau et al., 2013), such that the organization of both perception (Ulanovsky et al., 2004; Yu et al., 2005; Turvey and Fonseca, 2014) and memory (Brown et al., 2007; Rhodes and Turvey, 2007) appear to be adapted to the spatial and temporal scales and statistical structure of environmental events. We assume here that brain, body movement, and environmental events possess interdependent dynamics with a multi-scaled and nested temporal structure.
Multi-scaled and nested structure can be quantified in behavioral time series with variability scaling measures (Van Orden et al., 2003; Diniz et al., 2011). Variability scaling has been quantified via rescaled range analysis (Hurst, 1951), power spectral analysis (Eke et al., 2000; Delignières et al., 2004), and detrended fluctuation analysis (Peng et al., 1993). In DFA, variability scaling is evaluated by plotting the log of the amplitude of fluctuations for various time series window sizes against the size of the measurement window (see Fig. 11). The scaling exponent α is given by the slope of a regression line fitted this data. Scaling exponents distinguish time series with persistent or anti-persistent structure. For persistent structure, a trend (e.g. a positive change) in the past is likely to be followed by a similar trend in the future. Self-similar or fractal structure follows from the nesting of trends.
Fig. 11.

Fluctuation functions from DFA for IBIs (top) and ITIs (bottom) of one participant (data matched to Fig. 1). Thick gray lines show regression line fits for short (dashed line) and long (solid line) regions. The slope of these regression lines is used to determine αshort and αlong respectively.
Measures of behavior exhibiting variability scaling, include exploratory movements of eyes and body (Stephen et al., 2010; Stephen and Anastas, 2011), reaction times in cognitive tasks (Gilden, 2001; Van Orden et al., 2003), and various rhythmic actions (Hausdorff et al., 1995; Chen et al., 1997; Delignières et al., 2004; Torre et al., 2007; Wing et al., 2004; Torre and Wagenmakers, 2009; Almurad et al., 2017). Variability scaling is observed in measures of brain dynamics, including in electrophysiological signals measured via MEG and EEG (Novikov et al., 1997; Linkenkaer-Hansen et al., 2001; Bédard et al., 2006; Hardstone et al., 2012), and blood-oxygen-level dependent (BOLD) signals measured via fMRI (Thurner et al., 2003; He, 2011; Herman et al., 2011) and functional Near-Infrared Spectroscopy (fNIRS) (Eke and Hermán, 1999; Khoa and Nakagawa, 2008).
Variability scaling is interpreted to reflect the outcome of interactions of distributed neural (Chen et al., 2008b; Werner, 2010) and mechanical (Turvey and Fonseca, 2014) processes unfolding over multiple temporal scales. Variability scaling with persistent structure has been interpreted as indicating robust and flexible system organization (Harrison and Stergiou, 2015). In the case of brain dynamics, variability scaling has been interpreted as an index of metastability, where metastability refers to a state in which interacting neural subsystems, each possessing their own intrinsic dynamics, can be flexibly integrated in varied task relevant ways (Freeman and Holmes, 2005; Friston, 1997; Tognoli and Kelso, 2014). The functional significance of variability scaling is suggested by observations that deviations away from optimal values of persistent structure are associated with functional deficits and pathology (Stergiou et al., 2006; van Orden et al., 2009). Moreover, simulation studies have shown the exchange of information between interacting complex dynamical systems can be maximized via comlexity matching, that is, when the dynamics of the involved systems possess a similar multi-scaled and nested structure (West et al., 2008; Aquino et al., 2011). On the issue of efficient information exchange, it has been shown that the existence of persistent variability scaling structure in rhythmic auditory stimuli supports a degree of anticipation of—as opposed to reaction to—upcoming fluctuations in variable beat-to-beat intervals (Repp, 2002; Rankin and Limb, 2014; Rankin et al., 2014).
The proposed functional advantages of complexity matching have motivated the prediction that when two complex dynamical systems are coupled, their complexities should become drawn toward one another (Delignières et al., 2016). Consistent with this prediction, the variability scaling structures of coordinated actions have been found to be drawn toward the variability scaling of the systems to which they are coupled. When two people are asked to rhythmically coordinate their actions, an entrainment of movement variability scaling is observed in addition to the expected entrainment of movement oscillation periods and phases (Marmelat and Delignières, 2012). Entrainment of variability scaling structure is observed with interpersonal conversation (Abney et al., 2014), musical performances (Hennig, 2014), and coordinated actions (Den Hartig et al., 2018; Zapata-Fonseca et al., 2016).
Entrainment of variability scaling is observed in experiments in which participants coordinate their actions to specially created environmental stimuli (Kaipust et al., 2013; Torre et al., 2013; Marmelat et al., 2014). Hunt et al. (2014) tasked participants with walking in synchronization with auditory metronomes possessing heterochronous beat-to-beat intervals with variability scalings of α = 0.5 (i.e. no scaling), α = 1.0, and α = 1.5. The scaling exponent of participants’ stride-to-stride intervals was drawn toward the experimentally manipulated scaling exponent of the stimuli. Here, we extend the paradigm of Hunt et al. (2014) to test the hypothesis that variability scaling evident in both movement dynamics and associated brain activity dynamics can become entrained to the variability scaling of environmental stimuli. The latter prediction, is motivated by the results of simulation studies that suggest complexity matching can emerge from interactions of elements in neural networks (Mafahim et al., 2015). It is also motivated by correlations between the variability scaling of inter-tap intervals and the variability scaling of resting state alpha-band oscillations (Smit et al., 2013).
We test our hypothesis by investigating measures of oxygenated hemoglobin (HbO2) levels. Time series of HbO2 levels in regional cerebral blood flow were used as indicators of brain activity dynamics. Activity in the two cortical regions of interest (ROI) was investigated in left and right hemispheres. The selected ROIs were premotor/motor and sensorimotor areas. ROIs were selected given their known sensitivity to the conditions of performance of manual coordinated actions. BOLD activity indicators in primary motor cortex and/or sensory cortex are affected by the intensity (Kuboyama et al., 2004; Shibuya et al., 2008; Shibusawa et al., 2009), frequency (Obrig et al., 1996; Kuboyama et al., 2004, 2005; Brigadoi et al., 2012), and phase (Oullier et al., 2005) of coordinated actions. Premotor cortex is thought to be relevant to the stability of coordinated action. Disruption of premotor cortex via repetitive transcranial magnetic stimulation affects the cycle-to-cycle variability of tapping coordinated with isochronous auditory metronomes (Pollok et al., 2008; Bijsterbosch et al., 2011; Del Olmo et al., 2007; Kornysheva and Schubotz, 2011). In the case of the auditory cortex, neural oscillations have been found to become entrained to the structure of periodic stimuli (Will and Berg, 2007; Large, 2008; Lakatos et al., 2005; Nozaradan et al., 2011). The auditory cortex is responsive to the complex nonlinear temporal structure of human voices (Herzel, 1993; Kumar and Mullick, 1996), musical instruments (Fletcher, 1999), and the structure in temporally complex auditory stimuli (Itoh and Nakada, 2013). Premotor/motor and sensorimotor areas were chosen as ROIs of interest, over auditory cortex ROIs, because any observed variability scaling entrainment in these ROIs is not trivially explainable as being directly driven by the external stimulus. Of note, musical rhythms recruit motor and auditory areas of the brain (Chen et al., 2008a), with dorsal premotor cortex observed to mediate auditory–motor interactions (Chen et al., 2008b).
The implication of cortical ROIs in unilateral motor tasks is lateralized, with changes in BOLD indicators of activity most pronounced for areas contralateral to the coordinated effector (Hirth et al., 1997; Obrig et al., 1996; Sato et al., 2007; Holper et al., 2009). For right-handed participants, ipsilateral activation is less pronounced when the task is performed by the dominant effector (Plichta et al., 2006).
To test our hypotheses, we studied performances of thumb–finger tapping produced in isolation at a self-selected comfortable pace (self-paced task), or in coordination with an auditory stimulus (coordination task). In the coordination task, participants coordinated thumb–finger tapping to an isochronous metronome (IM), or to heterochronous metronomes (HM) possessing inter-beat interval (IBI) variability with scaling structures of α = 0.5, α = 1, and α = 1.5. IBI time series for these stimuli are shown in Fig. 1. Following Hunt et al. (2014), stimuli are matched for global mean IBI (0.5 s) and each HM is matched for global standard deviation of IBI (0.02 s). Here global mean and global standard deviation refer to statistics calculated over all intervals in a trial. A local standard deviation that is alternatively calculated over a subset of intervals and will differ across HM stimuli (Fig. 1). The magnitude of local variability is significant, as it has been taken to quantify the magnitude of perturbing forces affecting the stability of the coordination task (Torre and Balasubramanium, 2011). Following Hunt et al. (2014), stimuli were played to the tune of Für Elise.
Fig. 1.

Inter-beat interval (IBI) and corresponding inter-tap interval (ITI) time series from one participant performing the tasks of tapping in coordination with an isochronous metronome (IM), and three heterochronous metronomes (HM) that differ in the fractal scaling exponents (α) of their IBIs.
Thumb–finger tapping was chosen to reduce task complexity and to facilitate participants’ ability to comfortably perform the extended duration trials that benefit the accurate measurement of α. An additional reason for studying a tapping task is that progress has been made in identifying the simple mechanisms supporting sensorimotor synchronization in this task (see Repp, 2005; Repp and Su, 2013).
Marmelat et al. (2014) studied participants walking to the beat of heterochronous metronomes with IBI variability scalings ranging from α ≈ 0.6 to α ≈ 1.5. A DFA analysis revealed a positive correlation between changes in the α of IBI intervals and associated changes in α of stride-to-stride intervals. Importantly, the performed DFA analysis separately considered variability scaling across shorter (10–31 intervals) and longer (50–128 intervals) timescale ranges, and a significant correlation was only found for the longer timescales of the analysis. This finding, of variability scaling entrainment only for longer timescale ranges, appears to depend upon contextual/task constraints. Delignières et al. (2016) reanalyzed the walking data just described, together with data from a bimanual coordinated joystick oscillation task (Torre and Delignières, 2008), and data from the task of coordinating the swinging of hand-held pendulums between two people (Marmelat and Delignières, 2012). Using a multi-fractal variant of detrended fluctuation analysis, they again observed that in the walking task the correlation of variability scaling broke down when shorter interval ranges were included in the analysis. In contrast, for the other two tasks, a strong correlation of variability scalings was unaffected by whether shorter interval ranges were included in the analysis or not. Delignières et al. (2016) interpreted these results to be a consequence of whether simple mechanisms of cycle-to-cycle adjustments were present in the task. Such mechanisms would appear to be implicated when discrete to-be-coordinated-to events (e.g. a distinct metronome) are present in the task constraints. Given the discrete nature of the presently investigated task, we predicted that only the longer timescales (in the DFA analysis) of both tap-to-tap intervals and cortical hemodynamics would show entrainment to the variability scaling of the stimuli.
EXPERIMENTAL PROCEDURES
Participants
Seventeen young healthy adults aged between 19 and 36 years participated in the study. All participants signed an informed consent form. Seven participants were female and ten were male. All participants self-reported that they were right handed. The consent process and study procedures were approved by the University of Nebraska at Omaha Institutional Review Board. This study complied with the Declaration of Helsinki.
Tasks and procedure
Four tasks were performed by participants, and were ordered as follows: (1) a tap/no-tap task, (2) a baseline no-tapping (rest) task, (3) a baseline self-paced tapping task, and (4) a coordinated tapping task. For all tasks, participants positioned themselves in a comfortable seated posture in a cushioned backed chair with their right forearm supinated and rested on their right thigh. Across tasks, participants sat either quietly, or quietly while performing a rhythmic index finger-to-thumb tapping motion. Participants were asked to minimize any motions (e.g. head turning or arm repositioning) other than those instructed by the experimenter.
In the tap/no-tap task, ten blocks consisting of 30 s of no-tapping followed by 30 s of self-paced tapping were consecutively performed. In the baseline no-tapping (rest) task, participants sat quietly for 15 min. In the self-paced tapping task, participants performed the tapping motion continuously for 15 min. In the coordinated tapping task, participants coordinated their tapping motions such that contact of the thumb and index-finger was contiguous in time with the beats of a heard rhythmic auditory stimulus. Four coordinated tapping task trials with differing auditory stimuli were performed in random order. Each lasted for 15 min.
Self-paced tapping was instructed to be performed at a rate that could be comfortably maintained for extended periods of time. Tapping was always performed with the right hand. The tapping motion was verbally described (as opposed to visually demonstrated) by the experimenter. This was done to minimize bias upon the self-selected movement frequencies adopted by participants in the tap/no-tap task and the baseline self-paced tapping task.
The experiment lasted approximately 120 min. Breaks in which the participants were free to stand up and to chat to the experimenter were offered approximately every 15 min.
Auditory stimuli
Four metronomic auditory stimuli were created as midi files using MATLAB and played using a midi player (Olympus WS-600S digital voice recorder) through loud speakers. The duration of each generated beats was 0.125 s. Given that participants typically make about two taps per second when asked to tap at a comfortable rate (Drake et al., 2000), all stimuli were designed to possess an average inter-beat interval of 0.5 s. Following Hunt et al. (2014) pitch changes were imposed upon the stimuli to produce a repetition of the first section (the first 50 notes) of the song Für Elise. Note frequencies ranged from 261.63 Hz (middle C) to 659.26 Hz. The four auditory stimuli included one IM and three HM. All stimuli were designed to possess an IBI mean of 0.5 s. The three HM stimuli matched the design of the stimuli used in Kaipust et al. (2013) and Hunt et al. (2014). HM stimuli were designed to possess an IBI standard deviation of 0.02 s. These stimuli differed in the fractal scaling exponent (α) of their IBI variability. The IBI structure of the HMα = 0.5 stimulus was created from a random time series. Following Kaipust et al. (2013), the IBI structure of the HMα = 1.5 stimulus was created by integrating a random time series and the IBI structure of the HMα = 1.0 stimulus was generated by filtering an integrated random time series.
Data acquisition
Thumb–index finger tap events were recorded using a 12.7-mm diameter force-sensitive resistor taped to the pad of each participant’s right thumb. A Trigno™ 4-channel footswitch sensor (Delsys, Boston, MA, USA) was used to synchronously record thumb–index finger contact events (tapping) registered via the force-sensitive resistor, and acoustic events registered by splitting the audio output from the midi player and feeding it into a channel of the footswitch sensor. Data from the Trigno sensor was sampled at 1000 Hz.
A fNIRS system (ETG-4000 Optical System; Hitachi Medical Corporation, Tokyo, Japan) was employed to record hemodynamic response measurements of the underlying neural tissues. This system uses two wavelengths (~695 and ~830 nm). Relative changes in the absorption of near-infrared light between an optode emitter and an optode detector was measured and sampled at 10 Hz. This measure was converted into relative concentration changes of HbO2 and deoxygenated hemoglobin (Cope and Delpy, 1988; Obrig and Villringer, 2003). Our analysis was focused on the study of HbO2. This measure was chosen following evidence that HbO2 is a more sensitive measure (Hoshi et al., 2001; Wilson et al., 2014) and bears a closer correspondence to BOLD fMRI (Toronov et al., 2001; Strangman et al., 2002).
Eight infrared optode emitters and eight optode detectors were arrayed in a 4 × 4 configuration with 3-cm inter-optode spacing (Fig. 2). This configuration supported 24 possible channels of hemodynamic response measurements with each fNIRS channel located midway in between an optode emitter–detector pair. Optodes were housed in a flexible plastic sheet that molded to the surface of the scalp. The optodes and housing were secured in position on the scalp with elastic straps.
Fig. 2.
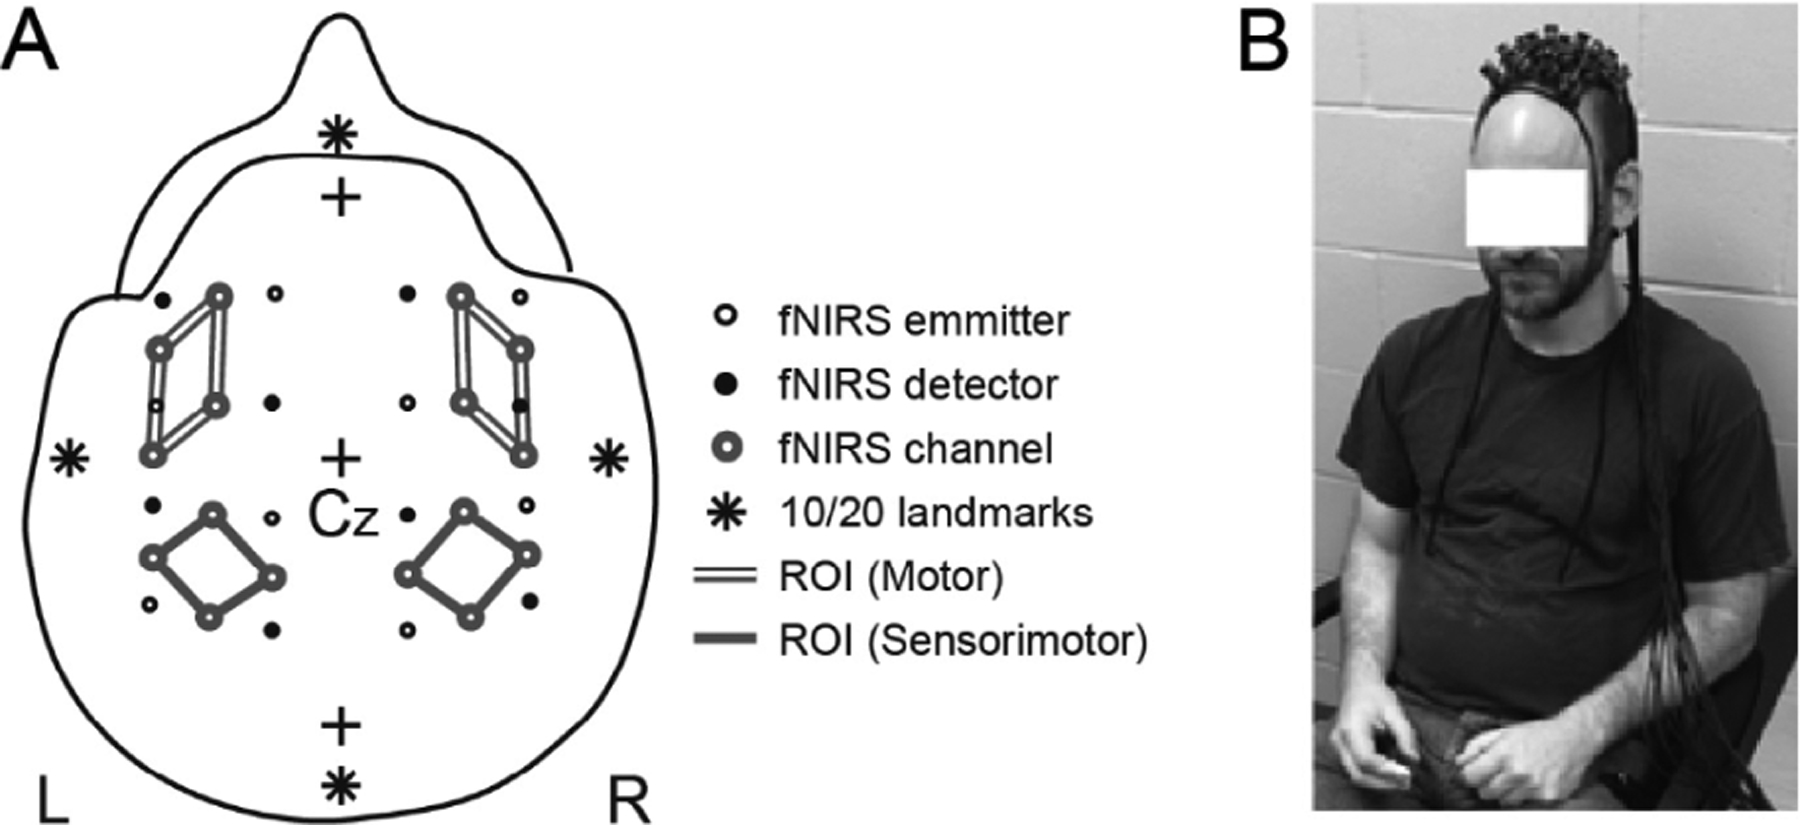
Configuration and placement of fNIRS emitter and detector array. (A) Studied fNIRS channels are shown, with lines connecting the studied fNIRS channels identifying groupings of channels into investigated regions of interest (ROI). (B) Placement of emitter and detector array on a participant performing the task in a comfortable posture.
The positioning of the optode array on the head followed the International 10/20 scalp-based coordinate system (Jasper, 1958). The intersection of the inion/nasion plane and the periaruicle plane define the reference position Cz. The location of Cz on the scalp was identified by determining the midpoint intersection of over-scalp paths between the nasion to the inion and between the left and right periauricles. The optode array was centered over Cz. Following methods for transforming 10–20 system coordinates to Montreal Neurological Institute (MNI)-based coordinates (Okamoto et al., 2004; Okamoto and Dan, 2005), the activity of four cortical ROI were identified. Each was associated to groupings of four fNIRS channels (Fig. 2). These ROIs distinguished motor and sensorimotor cortical regions in the left and right hemispheres (Okamoto et al., 2004; Hatakenaka et al., 2007; Leff et al., 2011). Two participant’s audio data was lost due to a faulty cable. These participants are not present in analyses involving acoustic events.
Data analysis
We followed the procedures of Wilson et al. (2014) in our analysis of HbO2 data in the tap/no-tap task. Following Wilson et al. (2014), a 5.0 s moving average and 0.01-Hz high pass filter were applied to the HbO2 concentration waveforms for each channel. Principal component analyses were then implemented to increase the signal-to-noise ratio (Boas et al., 2004; Zhang et al., 2005; Wilson et al., 2014). Components for each trial were compared to a reference waveform, which was a trapezoidal function with a 5-s increase in concentration at the start of tapping, a 25-s sustained peak concentration, and a 5-s decrease in concentration following the trial. A trapezoidal function has been shown to approximate observed HbO2 dynamics (Buxton et al., 2004; Cui et al., 2011; Wilson et al., 2014). If the correlation between the component and reference waveform was greater than 0.25, the component was incorporated into the final reconstruction of the HbO2 time series for individual channels. Components with a correlation to the reference waveform of less than 0.25 were excluded from reconstruction. Following reconstruction, data were averaged across trials for each channel and participant. Thus, average HbO2 waveforms were generated to represent the average hemodynamic activity for individual channels during finger tapping trials. The average waveforms consisted of a 10-s no-tapping baseline, 30-s tapping, and 20-s no-tapping recovery period. To assess if the production of right-handed finger tapping was associated with a significant change in HbO2 concentration for any ROI, the difference between the means of the no-tapping baseline period and tapping test period was calculated for each channel and participant and was averaged over blocks and channels in each ROI.
For the coordination task, time series of onsets of pressure events (taps), onsets of acoustic events (metronome beats), and changes in the relative concentration of HbO2 were analyzed. Prior to event picking the magnitude of baseline noise was determined in the pressure and audio data signals. These signals were then each filtered with a median filter with a width of 11 samples. Events were identified as the onset times of regions in which the determined baseline noise level was exceeded in the filtered time series. The difference between successive event times was used to calculate inter-beat interval (IBI) and inter-tap interval (ITI) time series. Previous analyses of the task of tapping in time to heterochronous stimuli have produced varied results regarding task performance. Whereas Torre et al. (2013) found that participants were successful in consistently synchronizing their taps to the beats of heterochronous stimuli possessing a range of variability scalings, Stephen et al. (2008) contrastingly found participants unable to reliably maintain synchronization. Given these mixed results, we conservatively assumed in our analysis the possibility that participants’ performances may not be reliably phase locked with the stimuli in the investigated coordination task. Our analysis of coordination task data was designed assuming the possibility that coordination between taps and beats may not be reliable, and that taps and beats may differ in number. Potential causes of taps differing in number from beats include measurement error (i.e. taps not being registered by the force sensor), absence of coordination (i.e. participants not performing the task), and poor coordination (i.e. taps not being phase locked to beats). To remove biases on the calculation of standard deviation (SD) and scaling exponent α due to measurement errors and absences of coordination ITIs greater than 0.75 s (1.5 × mean IBI) and less than 0.25 s (0.5 × mean IBI) were excluded from our analyses. These outliers were removed from the time series and replaced with missing values. The SD of IBIs and ITIs were calculated either globally, for all measured intervals in the trial (SDall), or locally, for a subset of interval time series points. Two measures of the magnitude of local variability were calculated by measuring SD in time series windows of either 30 (SD30) or 100 (SD100) consecutive points. The calculation was performed at all possible window locations and an average over window locations was evaluated.
Coordination between beats and taps was quantified using an analysis of discrete relative phase (DRP) (Jeka, 1992; Diedrich and Warren, 1995). Importantly, DRP analysis does not assume a 1:1 mapping between beats and taps, or require the determination of a unique beat-to-tap mapping when the number of taps is not equal to the number of beats. In DRP the timing of taps is evaluated as a fraction of the time between the preceding and succeeding beats. This fraction is expressed in the range 0°–360°. To identify regions of poor coordination DRP values were unwrapped (Byblow and Chua, 1998) so that the rate of change in DRP could be continuously evaluated. For this analysis the unwrapped DRP time series was smoothed using a seven point moving average, interpolated using a cubic spline fit, and low pass filtered with a cutoff of 0.1 Hz (solid gray line in Fig. 4B). Regions where the absolute rate of change of this time series exceeded 30°/s were identified and counted as instances of loss of coordination.
Fig. 4.

The distribution of ratios of the number of produced taps (# taps) to number of stimulus beats (# beats) in coordination task trials.
HbO2 time series were measured relative to pre-task HbO2 values. This value was determined by averaging 5 s of data prior to the start of each trial. Following Eke and Hermán (1999), the HbO2 time series were not filtered so as not to affect the temporal structure contained in the signal.
For DFA each time series was integrated (i.e., cumulatively summed) prior to analysis. This step is performed as DFA works on the diffusive property of fractional Brownian motions. In the DFA of each time series, the time series was broken into bins of a size (n). Local linear trends were computed within each bin, and the root mean square variation around this linear trend was calculated. The root mean square variation was then averaged across all bins yielding a summary score F. The process was repeated for a ranges of bin sizes allowing the magnitude of fluctuations for each bin size (F(n)) to be plotted as a function of bin size in log–log coordinates. The slope of this function is the scaling exponent α and was estimated by calculating the slope of regression line fitted to the data across a particular range of bin sizes (Fig. 7).
Fig. 7.

Distributions of the variability scaling exponents of inter-beat intervals.
In the analysis of IBIs and ITIs, DFA was performed on 210 intervals taken from the middle of each trial. Following Damouras et al. (2010), small and large bin sizes were excluded from the estimates of the exponent α. Bin size ranges of 10–51, 51–256, and 10–256 intervals were used to produce estimates of α for each trial spanning shorter (αshort), longer (αlong), and shorter and longer (αall) timescales respectively. In the analysis of ITIs, identified outliers were replaced with missing values in an attempt to preserve the temporal order of the time series. This method has been shown to produce reliable estimates of the exponent α even under extreme dilution of samples (Mirzayof and Ashkenazy, 2010). In DFA, persistent structure yields α > 0.5. Anti-persistent structure yields α < 0.5, while α = 0.5 denotes an absence of nested temporal dependencies. In the analysis of HbO2, DFA was performed on 213 intervals taken from the middle of each trial. Bin size ranges were selected to approximately match the scaling ranges selected in the DFA analysis of IBIs and ITIs. This resulted in bin size ranges of 50–255, 255–1280, and 50–1280 samples that were used to produce estimates of the exponent α spanning shorter (αshort), longer (αlong), and shorter and longer (αall) timescales. The α exponents of HbO2 time series were calculated for each trial and for each fNIRS channel. The α exponents in ROIs were calculated by averaging the α’s of the four channels in each ROI.
Statistical analysis
Each of the separate variables involved in each planned statistical analysis were inspected. Histograms were used to assess the consistency of the data in each variable, and to detect outliers that might suggest that errors in measurement had occurred, or that subjects were not actually performing the task. A team member with expertise in Biostatistics, reviewed tests of normality (e.g. Shapiro–Wilk tests) and normality plots (e.g. Q–Q plots), to determine departures from normality that would make the use of general linear model analyses inappropriate. In such cases, appropriate non-parametric tests were performed, and histograms are presented in the figure.
During our inspections of mean ITI data we discovered evidence suggesting that one participant was not performing the task (i.e. they were not coordinating their tapping with the beats of the metronomes). This participant had mean ITIs of 0.36, 0.35, 0.36, and 0.41 s in the IM, HMα = 0.5, HMα = 1.0, and HMα = 1.5, coordination task conditions respectively that markedly differed from the other participants (compare Fig. 6A). We removed this participant from all analyses.
Fig. 6.

Distributions of means and standard deviations of auditory stimuli inter-beat intervals.
RESULTS
Were task-specific changes in cortical HbO2 concentrations detectible?
For the tap/no-tap task, contralateral side measurements of HbO2 concentrations were greater during the tapping test periods than the no-tapping baseline periods. This was the case for both the sensorimotor ROI, F(1, 15) = 17.50, p < .001, ηp = .54 and the motor ROI, F(1, 15) = 17.50, p < .001, ηp = .54 (Fig. 3A). No such changes were observed on the ipsilateral side for either the sensorimotor ROI, F(1, 15) = 1.31, p = .27, ηp = .27, or the motor ROI, F(1, 15) = 2.84, p = .11, ηp = .16 (Fig. 3B). These results confirm that the measurement of cortical HbO2 concentrations at the chosen ROIs were sensitive to the performance of thumb to index finger tapping and to the laterality of the task (i.e. right-handed tapping).
Fig. 3.

Differences in mean HbO2 concentrations for the tapping test period relative to the no-tapping baseline period (test – baseline) observed in the tap/no-tap task for a contralateral ROIs and B) Ipsilateral ROIs.
What were the properties of uncoordinated (self-paced) tapping?
The mean ITI in the self-paced tapping baseline condition was 0.505 s (SD = 0.128). As anticipated, the chosen mean IBI of the stimuli (0.5 s) approximated the participants self-selected ITIs. The magnitudes of global variability (SDall), and local variability over window sizes of 100 (SD100) and 30 (SD30) intervals was 0.110 s (SD = 0.126), and 0.046 s (SD = 0.020) and 0.044 s (SD = 0.019) respectively. The fractal scaling of ITIs, measured as αall, αshort, and αlong exponents, was 0.752 (SD = 0.153), 0.694 (SD = 0.149), and 0.802 (SD = 0.225) respectively. No difference was observed between αshort and αlong (F(1, 16) = 4.16, p = .06). All observed α exponents exhibited a persistent fractal scaling structure (α > 0.5) consistent with previous investigations of observed scaling structures for ITIs during self-paced tapping (Gilden et al., 1995; Delignières et al., 2004; Torre et al., 2011).
Was tapping coordinated with the auditory stimuli?
In the coordinated tapping task, the number of taps produced by participants did not consistently equal to the number of presented beats. As shown in Fig. 4, instances of both the number of taps exceeding the number of beats and the number of taps being fewer than the number of beats were observed. The percentage of total trial duration with ITIs greater than 0.75 s (1.5 × mean IBI) was 1.62%. ITIs greater than 0.75 s were classified as absences of coordination due to either an absence of tapping or a failure in the measurement of tapping. To minimize the biasing on investigated measures resulting from absences of coordination, ITIs greater than 0.75 s were replaced by missing values in the analysis of ITI α exponents and variability magnitudes.
To quantify poor beat–tap coordination (as opposed to an absence of task performance) instances of smooth phase wrapping were identified by evaluating a criterion rate of change of unwrapped DRP (Fig. 5A). On average, 4.4 instances of phase wrapping were identified on each experimental trial. Of the identified wraps 86.4% possessed a negative rate of change of DRP (Fig. 5A, top graph), suggesting the frequency of taps was greater than the frequency of beats during these episodes.
Fig. 5.

Phase wrapping. (A) Time series plots of the discrete relative phase (DRP) of taps relative to beats revealing instances of negative phase wrapping (top) and positive phase wrapping (bottom). Correspondence in time of beats (gray circles) and taps (black crosses) during the phase wraps are shown below each DRP time series plot. (B) Distributions of the percentages of each trial that phase wrapped was observed.
The measure of percentage of each trial exhibiting phase wrapping was not normally distributed (Fig. 5B). Median percentages were 0.64%, 1.24%, 1.17%, and 0.70% across the IM, HMα = 0.5, HMα = 1.0, and HMα = 1.5, coordination task conditions respectively. Although no significant effect of coordination task condition was observed, χ2(3) = 0.56, p = .91, it is worthy of note that the pattern of these results matches that of the local variability of IBI and ITI (Fig. 5). This hints at a relationship between the magnitude of local variability and the stability of coordination.
What were the properties of the auditory stimuli?
The audio signal played to participants was analyzed to determine if the designed properties of the stimuli were preserved in playback during the coordination task trials. Analysis of the audio signal revealed the mean IBIs were not normally distributed (Fig. 6A). Medians values for the IM, HMα = 0.5, HMα = 1.0, and HMα = 1.5, conditions were 0.500, 0.500, 0.501, and 0.489 s respectively, suggesting that the mean IBIs for each of the auditory stimuli were close to designed value of 0.5 s. Numerically small, yet significant, differences in mean IBI were observed, χ2(3) = 45.00, p < .001. Dunn’s pairwise post hoc tests with Bonferroni’s corrections for multiple testing revealed that HMα = 1.5 differed from each of the other conditions.
The standard deviations of IBIs in each trial were not normally distributed (Fig. 6B, C). In the IM condition, the median SDall of IBIs was 0.005 s. In the HMα = 0.5, HMα = 1.0, and HMα = 1.5, conditions, median values were, 0.021, 0.021, and 0.021 s respectively. An effect of auditory stimulus condition was observed, χ2(3) = 28.84, p < .001. Dunn’s pairwise post hoc tests with Bonferroni’s corrections for multiple testing revealed that the IM condition differed from each of the HM conditions. Effects of auditory stimulus condition were observed for both measures of local variability magnitude, SD30, χ2(3) = 45.00, p < .001, and SD100, χ2(3) = 45.00, p < .001. For SD30, median values were 0.005, 0.021, 0.014, and 0.007 s, in the IM, HMα = 0.5, HMα = 1.0, and HMα = 1.5 conditions respectively. For SD100, median values were 0.005, 0.021, 0.015, and 0.009 s, in the IM, HMα = 0.5, HMα = 1.0, and HMα = 1.5 conditions respectively. For both SD30 and SD100 measures, Dunn’s pairwise post hoc tests with Bonferroni’s corrections for multiple testing revealed that IM differed from HMα = 0.5, HMα = 1.0 conditions, and that HMα = 0.5 and HMα = 1.5 conditions differed. These results capture the reduction in local, but not global, variability across the HM stimuli with increasing degree of persistent structure.
The measures of IBI variability scaling were not normally distributed (Fig. 7). For αall, median values were 0.021, 0.505, 0.992, and 1.401, in the IM, HMα = 0.5, HMα = 1.0, and HMα = 1.5 conditions respectively. An effect of auditory stimulus condition was observed, χ2(3) = 45.00, p < .001. Dunn’s pairwise post hoc tests with Bonferroni’s corrections for multiple testing revealed differences between IM and HMα = 1.0, IM and HMα = 1.5, and HMα = 0.5 and HMα = 1.5 stimulus conditions. This pattern of results was reproduced for both αshort and αlong measures. For αshort, median values were 0.040, 0.483, 0.918, and 1.347, in the IM, HMα = 0.5, HMα = 1.0, and HMα = 1.5 conditions respectively. An effect of auditory stimulus condition was observed, χ2(3) = 45.00, p < .001. Dunn’s pairwise post hoc tests with Bonferroni’s corrections for multiple testing revealed differences between IM and HMα = 1.0, IM and HMα = 1.5, and HMα = 0.5 and HMα = 1.5 stimulus conditions. For αlong, median values were 0.006, 0.533, 1.111, and 1.436, in the IM, HMα = 0.5, HMα = 1.0, and HMα = 1.5 conditions respectively. An effect of auditory stimulus condition was observed, χ2(3) = 45.00, p < .001. Dunn’s pairwise post hoc tests with Bonferroni’s corrections for multiple testing revealed differences between IM and HMα = 1.0, IM and HMα = 1.5, and HMα = 0.5 and HMα = 1.5 stimulus conditions. Measures of αshort and αlong were found to differ, Z = 3.41, p < .001. These analyses suggest that while the differences in the α’s of the auditory stimuli appear to be respectively compressed and enlarged in the measurement of lower and higher scaling ranges, the designed pattern of the scaling exponents was reliably preserved within each of the two scaling ranges considered.
Did the properties of tapping match the properties of the auditory stimuli?
The measure of mean ITI was not normally distributed (Fig. 8). For mean ITI, median values were 0.500, 0.500, 0.501, and 0.489, in the IM, HMα = 0.5, HMα = 1.0, and HMα = 1.5 conditions respectively. Differences in mean ITI were observed across auditory stimulus conditions, χ2(3) = 38.78, p < .001. Dunn’s pairwise post hoc tests with Bonferroni’s corrections for multiple testing revealed that HMα = 1.5 differed from each of the other conditions. The observed pattern of the mean ITIs mirrors the pattern of small but consistent differences in mean IBIs observed in the stimuli.
Fig. 8.

Distribution of the variability scaling exponents of inter-tap intervals.
All measures of the ITI variability magnitudes differed as function of IM and HM conditions (Fig. 9B), SDall, F(3, 45) = 6.71, p < .001, ηp = .31, SD30, F(3, 45) = 7.14, p < .001, ηp = .32, SD100, F(3, 45) = 6.10, p < .001, ηp = .29. For SDall, direct comparison of the means (Bonferroni-adjusted for multiple comparisons, p < .05) revealed that the IM condition differed from each of the HM conditions. For both SD30 and SD100, IM differed from HMα = 0.5 and HMα = 1.0 conditions. For the SDall measure, HM conditions did not differ from each other. By contrast for SD30, a difference between HMα = 0.5 and HMα = 1.5 was observed. The general pattern of results for ITI variability magnitudes matched what was observed in the analysis of IBI variability magnitudes (Fig. 9A).
Fig. 9.

Coordination task standard deviations (SDs) for auditory stimulus conditions. SD is calculated globally over the whole trial (SDall), and locally over window sizes of 100 intervals (SD100) and 30 intervals (SD30) for (A) inter-beat intervals (IBIs) and (B) inter-tap interval (ITIs).
The αall values for ITIs differed as a function of auditory stimulus condition, F(1.45, 21.77) = 100.39, p < .001, ηp = .87 (Fig. 10B). The ordering of the means mirrored that of the IBIs of the stimuli (Fig. 10A). Direct comparison of the means (Bonferroni-adjusted for multiple comparisons, p < .05) revealed that all IM and HM conditions differed from one another. A combined analysis of αshort and αlong (see) revealed an interaction effect of the scaling range (i.e. αshort vs. αlong) and auditory stimuli, F(3, 45) = 84.67, p < .001, ηp = .85, as well as main effects of both the scaling range F(1, 15) = 313.27.18, p < .001, ηp = .95, and the auditory stimulus, F(1.42, 21.25) = 96.16, p < .001, ηp = .87.
Fig. 10.

Scaling exponent α from DFA for (A) inter-beat intervals (IBIs) and (B) inter-tap intervals (ITIs). α is evaluated for scaling regions of 10–255 (αall), 10–51 (αshort), and 51–255 (αshort) intervals.
The observed interaction effect captures the expected compression of differences across auditory stimulus conditions for αshort, as well as an ordering of means that does not match that of the stimuli. Separate analyses for αshort and αlong revealed main effects of auditory stimulus condition for both the αshort, F(3, 45) = 30.53, p < .001, ηp = .67, and αlong, F(1.69, 25.34) = 113.32, p < .001, ηp = .88. For αshort, a direct comparison of the means revealed all auditory stimulus conditions to differ. In contrast for αlong, all IM and HM conditions were observed to differ, and the ordering of the means mirrored that of the stimuli.
As hypothesized, the matching of ITI variability scaling to that of the auditory stimuli was only clearly observed for the longer timescale ranges of the DFA analysis (compare Fig. 6A, B). This pattern of results is also shown in Fig. 11 which depicts the fitting of regression lines to the DFA diffusion plots from each condition for a single participant.
Did the properties of neural dynamics match those of tapping and auditory stimuli?
Given the absence of reliable baselines for each trial in the coordination task, the effect of conditions on mean HbO2 concentrations was not investigated. Variability magnitudes of HbO2 concentration calculated over the whole trial (SDall), and within local windows matched for temporal length to 30 IBIs (SD30), and 100 IBIs (SD100), revealed a main effect of ROI, F(1, 15) = 6.86, p < .05, ηp = .31, F(1, 15) = 5.10, p < .05, ηp = .25 and F(1, 15) = 6.57, p < .05, ηp = .30 respectively. In each case magnitude of variability for the sensorimotor ROI was greater than the motor ROI. An interaction of ROI side and auditory stimulus condition was observed for SDall, F(3, 45) = 3.409, p < .05, ηp = .19 (Fig. 12A), but not for SD30 or SD100 (Fs < 1). This increase in global variability magnitude without a corresponding increase in local variability is consistent with increased time series persistence.
Fig. 12.

Effects of auditory stimulus condition and ROI side for measures of variability magnitude (A), and variability scaling measured at short (B) and long (C) time scale ranges of the DFA analysis.
Given the results observed for ITIs (Fig. 10B), we predicted that variability scaling entrainment between HbO2 concentrations and the auditory stimuli would only be observable on long scaling ranges of the DFA analysis. Separate analyses for both αshort and αlong revealed an interaction of ROI side and auditory stimulus condition for αlong, F(3, 45) = 5.10, p < .01, ηp = .25 (Fig. 12C), but not for αshort, F < 1 (Fig. 12B). Inspection of Fig. 12B suggests that there was a difference between those auditory stimulus conditions possessing persistent variability scaling structure (HMα = 1.0 and HMα = 1.5) and those not possessing persistent variability scaling structure (IM and HMα = 0.5), for the contralateral ROIs. Separate analyses for both αshort and αlong with ROI side and persistence as independent variables revealed an interaction of ROI side and persistence for αlong, F(1, 15) = 7.21, p < .05, ηp = .33, but not for αshort, F(1, 15) = 1.33, p = .27, ηp = .08.
DISCUSSION
In this study the task of task of tapping finger and thumb to a variable beat was investigated. We tested the hypothesis that the scaling of variability magnitudes in the fluctuations of tap-to-tap intervals and the fluctuations of associated neural dynamics, would become drawn toward (i.e. entrained to) the variability scaling structure of the auditory stimuli. The IBIs of the auditory stimuli were matched for mean and global standard deviation but varied in variability scaling structures. Participants tasked with coordinating to these stimuli became entrained not only to the frequency of stimulus, but also to the variability scaling structure of the stimulus. Consistent with the findings of Marmelat et al. (2014), the entrainment of ITI variability scaling to the IBI variability scaling of the stimulus was dependent upon the scaling range evaluated in the DFA analysis. Specifically, only ITI variability scaling evaluated within longer scaling ranges was found to mirror the pattern of changes in variability scalings that varied across the auditory stimuli, as well as to approximate the variability scaling values of the auditory stimuli. The dependence of our results upon the timescales evaluated in the DFA analysis suggests the existence of distinct scaling regions. This interpretation is reinforced by the pattern evident in the diffusion plots in Fig. 7. Distinct scaling regions have been observed for varied measures of human activity including the fluctuations of postural control (Collins et al., 1995), heart beats (Peng et al., 1993; Pittman-Polletta et al., 2013), and cerebral hemodynamics (Eke et al., 2006). In each of these cases, the observation of distinct scaling values, and scaling regions, has been interpreted as resulting from the interaction of control processes/mechanisms operating at particular scales.
Event-based models of temporal synchronization propose mechanisms of cycle-to-cycle adjustments, made with respect to either the IBIs and beat–tap asynchronies of external event stimuli (Torre et al., 2013), or with respect to internally generated beats (i.e. rhythmic neural dynamics) such as in the case of continuation tapping tasks (Wing and Kristofferson, 1973; Vorberg and Wing, 1996; Vorberg and Schulze, 2002). Anti-persistent scaling structure present for shorter timescales of variability scaling analyses is taken to be indicative of short range event-based corrective mechanisms (Torre and Delignières, 2008; Marmelat et al., 2014). In the case of continuation tapping tasks, variability scaling is observed to possess anti-persistent scaling structure at shorter timescales, and persistent structure at longer timescales (Yamada, 1995; Chen et al., 2002; Delignières et al., 2004; Madison, 2004). In tasks in which tapping is synchronized to the beat of an IM stimuli, anti-persistent scaling structure is evident for both shorter and longer timescales (Torre and Delignières, 2008). The tendency in our results for ITI variability scaling evaluated at shorter timescales to tend toward antipersistence or an absence of persistence, is consistent with event-based corrective mechanisms being implicated in the studied coordination task.
Measures of HbO2 levels in sensorimotor and motor cortical areas were studied as indicators of brain activity dynamics. Variability scaling was observed in HbO2 levels. As hypothesized, the variability scaling of HbO2 fluctuations in both investigated ROIs was drawn toward the variability scaling values of the constructed auditory stimuli. This result parallels the recent findings of Lin et al. (2016). They studied the task of perceptually discriminating auditory metronomes that differed with respect to the variability scaling of their pitch fluctuations. They observed that the variability scaling structure of both slow cortical potentials and α-oscillation amplitudes, measured via MEG, predicted subjects’ discrimination performance in the auditory task. Both findings suggest that complex auditory stimuli—and by extension environmental events—engage the central nervous system at the level of variability scaling structure.
The variability scaling entrainment of HbO2 fluctuations was observed only at the long timescales of the DFA analysis, matching the pattern of results for ITI fluctuation variability scaling. The shared timescale-dependencies of HbO2 fluctuations with motor output fluctuations, rather than with auditory stimuli fluctuations, suggest that the role of the investigated ROIs was sensory–motor rather than sensory.
Consistent with a dynamical systems perspective on complex adaptive behavior (Chiel and Beer, 1997; Delignières and Marmelat, 2013; Harrison and Stergiou, 2015) we have assumed here that dynamical processes operating at various time scales underly the effective coordination of body, nervous-system, and environment. We have also assumed that the underlying dynamical processes that are implicated in the studied task will affect the variability structure that is quantified by DFA analysis. Various mechanisms have been put forward as potential bases for variability scaling entrainment. Simulations by Torre et al. (2013) reveal that autoregressive models of event-based corrective adjustments can produce ITI entrainment to isochronous stimuli, and heterochronous stimuli possessing both persistent and non-persistent structure. Fine et al. (2015) has shown that in tasks that involve the coordination of elements with oscillatory dynamics (i.e. without discrete events), variability scaling entrainment depends upon the frequency/phase entrainment dynamics of coupled oscillatory systems. Lastly, Stephen and Dixon (2011) consider that variability scaling entrainment should be conceived as a product of multiplicative cascade dynamics, entailing a coordination of fluctuations among multiple time scales. This viewpoint fits most closely with the notion of complexity matching and suggests more global mechanisms, such as that of “1/f resonance” between connected complex networks (Aquino et al., 2011). Auto-correlation analyses of ITI time series and beat-tap asynchrony time series, as well as cross-correlation analyses of IBI and ITI time series, have been used in previous studies to provide insight into the process of dynamical modulation implicated in coordinating action to isochronous stimuli (e.g. Torre and Delignières, 2008). Such analyses were not performed presently due to the inherent autocorrelative structure of the heterochronous stimuli investigated, as well as complications arising from high level of tapping performance variability observed. With respect to the issue of performance variability, instances of phase wrapping made it impossible to determine a 1:1 beat-to-tap correspondence. Consequently, hypotheses regarding the implication of specific cycle-to-cycle adjustment processes could not be evaluated directly.
Neural mechanisms underlying variability scaling entrainment are suggested by neural resonance theory (Large and Snyder, 2009). This theory proposes that neural rhythms in the neural networks underlying both rhythm perception and coordination become synchronized to acoustic rhythms (Large et al., 2015; Nozaradan et al., 2016). Additional neural mechanisms of variability scaling entrainment are potentially implicated in the known sensitives of the investigated motor cortex and sensorimotor cortical areas. BOLD indicators of activity in these areas have been observed to be affected by the intensity of simple manual motor tasks (Kuboyama et al., 2004; Shibuya et al., 2008; Shibusawa et al., 2009), the frequency of coordinated manual actions (Obrig et al., 1996; Kuboyama et al., 2004, 2005; Brigadoi et al., 2012), and the relative phase of coordinated effectors in bimanual rhythmic coordination tasks (Oullier et al., 2005). These dependencies may offer a rudimentary mechanism for understanding the observed entrainment of HbO fluctuations.
Whether the presently observed variability scaling entrainment is taken to be driven by short range or more global mechanisms, the variability scaling entrainment in the studied measures suggest distant functional connectivity between neural activity, body movement, and environmental event structure, as well as the possibility of mutual responsiveness to multiscaled dynamics between these functional subsystems. Mutual responsiveness is of theoretical significance for understanding adaptive behavior, that is, for understanding the ability of behavior to be adapted to the demands of the situation in which it is embedded. The primary theoretical significance of multiscale entrainment and responsiveness is that the meaningfulness of environmental encounters spans a wide range of spatial and temporal scales. Consequently, across nervous system, body, and environment, behavior at any scale is only functional to the extent that it is adaptively situated with respect to levels above and acts to situate the levels below (Turvey and Fonseca, 2014; Harrison and Stergiou, 2015).
Understanding the specific form of functional connectivity underlying the presently revealed entrainment of fluctuation magnitudes may benefit from some changes and refinements of the presently adopted methods. Auditory–motor event-based synchronization is known to be supported by a network of functionally connected cortical and subcortical neural regions (Chen et al., 2008b). This network is believed to include the dorsal lateral prefrontal cortex, pre-supplementary motor area, inferior parietal lobule, and cerebellum lobule VI, and dorsal premotor cortex. Expanding the analysis across these regions may reveal that variability scaling structures are constrained in ROI-specific ways. This prediction is motivated by measure-specific variability scaling effects observed in studies of motor coordination (Coey et al., 2013; Terrier et al., 2005). Our analysis was also limited by the lack of beat-to-tap correspondence. Reliable beat to tap correspondence supports additional measures of sensorimotor synchronization that are revealing of underlying timing mechanisms in the cycle-to-cycle dynamics of coordination (Repp, 2005). Beat-to-tap correspondence may be improved by attempting to increase the motivation and alertness of participants. The incorporation of EEG measures would allow the neural dynamics unfolding at multiple timescales to be separated out and distinctly evaluated, including those of cycle-to-cycle movement dynamics (Nozaradan et al., 2013). Given such an analysis it would be fruitful to investigate auditory stimuli in which variability is selectively manipulated at specific timescales.
Of last note, in contrast to the analysis of ITIs, the observed magnitudes of changes of variability scaling values across conditions for HbO2 levels did not approximate those of either the ITI or the IBI variability scaling values. Moreover, the range of variation across conditions for HbO2 level variability scaling values was significantly compressed compared to the other measures. This compression and shifting is not evident in recent EEG studies designed to examine variability scaling (Smit et al., 2013), thus the basis for these data qualities may be due our use of HbO2 as a measure, or our choices regarding HbO2 data post-processing.
ACKNOWLEDGMENTS
This work was supported by the Center for Research in Human Movement Variability of the University of Nebraska Omaha and the NIH (R01GM105045, R01AG034995, P20GM109090).
Abbreviations:
- DFA
detrended fluctuation analysis
- HbO2
oxygenated hemoglobin
- ROI
regions of interest
- IM
isochronous metronome
- HM
heterochronous metronomes
- IBI
possessing inter-beat interval
- DRP
discrete relative phase
REFERENCES
- Abney DH, Paxton A, Dale R, Kello CT (2014) Complexity matching in dyadic conversation. J Exp Psychol-Gen 143:2304–2316. [DOI] [PubMed] [Google Scholar]
- Almurad ZM, Roume C, Delignières D (2017) Complexity matching in side-by-side walking. Hum Mov Sci 54:125–136. [DOI] [PubMed] [Google Scholar]
- Anderson JR, Schooler LJ (1991) Reflections of the environment in memory. Psychol Sci 2:396–408. [Google Scholar]
- Aquino G, Bologna M, West BJ, Grigolini P (2011) Transmission of information between complex systems: 1/f resonance. Phys Rev E 83(5) 051130. [DOI] [PubMed] [Google Scholar]
- Bassett DS, Bullmore E (2006) Small-world brain networks. Neuroscientist 12:512–523. [DOI] [PubMed] [Google Scholar]
- Bassett DS, Meyer-Lindenberg A, Achard S, Duke T, Bullmore E (2006) Adaptive reconfiguration of fractal small-world human brain functional networks. Proc Natl Acad Sci U S A 103(51):19518–19523. [DOI] [PMC free article] [PubMed] [Google Scholar]
- Bédard C, Kroeger H, Destexhe A (2006) Does the 1/f frequency scaling of brain signals reflect self-organized critical states? Phys Rev Lett 97. 118–102. [DOI] [PubMed] [Google Scholar]
- Bernstein NA (1996) On dexterity and its development. In: Latash M, Turvey MT, editors. Dexterity and its development. Mahwah, NJ: Lawrence Erlbaum. p. 3–244. [Google Scholar]
- Bijsterbosch JD, Lee KH, Dyson-Sutton W, Barker AT, Woodruff PW (2011) Continuous theta burst stimulation over the left pre-motor cortex affects sensorimotor timing accuracy and supraliminal error correction. Brain Res 1410:101–111. [DOI] [PubMed] [Google Scholar]
- Blau JJ, Petrusz SC, Carello C (2013) Fractal structure of event segmentation: lessons from reel and real events. Ecol Psychol 25:81–101. [Google Scholar]
- Boas DA, Dale AM, Franceschini MA (2004) Diffuse optical imaging of brain activation: approaches to optimizing image sensitivity, resolution, and accuracy. Neuroimage 23:S275–S288. [DOI] [PubMed] [Google Scholar]
- Brigadoi S, Cutini S, Scarpa F, Scatturin P, Dell’Acqua R (2012) Exploring the role of primary and supplementary motor areas in simple motor tasks with fNIRS. Cogn Process 13(1):97–101. [DOI] [PubMed] [Google Scholar]
- Brown GD, Neath I, Chater N (2007) A temporal ratio model of memory. Psychol Rev 114(3):539. [DOI] [PubMed] [Google Scholar]
- Bullmore E, Sporns O (2012) The economy of brain network organization. Nat Rev Neurosci 13(5):336–349. [DOI] [PubMed] [Google Scholar]
- Buxton RB, Uludağ K, Dubowitz DJ, Liu TT (2004) Modeling the hemodynamic response to brain activation. Neuroimage 23:S220–S233. [DOI] [PubMed] [Google Scholar]
- Byblow WD, Chua R (1998) Information-based dynamics and manual asymmetries in perception and action. In: Piek JP, editor. Motor behavior and human skill: a multidisciplinary approach. Champaign, IL: Human Kinetics Publishers Inc.. p. 161–190. [Google Scholar]
- Chen Y, Ding M, Kelso JAS (1997) Long memory processes (1/fα type) in human coordination. Phys Rev Lett 79(22):4501. [Google Scholar]
- Chen Y, Repp BH, Patel AD (2002) Spectral decomposition of variability in synchronization and continuation tapping: Comparisons between auditory and visual pacing and feedback conditions. Hum Mov Sci 21(4):515–532. [DOI] [PubMed] [Google Scholar]
- Chen JL, Penhune VB, Zatorre RJ (2008a) Listening to musical rhythms recruits motor regions of the brain. Cereb Cortex 18:2844–2854. [DOI] [PubMed] [Google Scholar]
- Chen JL, Penhune VB, Zatorre RJ (2008b) Moving on time: brain network for auditory-motor synchronization is modulated by rhythm complexity and musical training. J Cogn Neurosci 20:226–239. [DOI] [PubMed] [Google Scholar]
- Chiel HJ, Beer RD (1997) The brain has a body: adaptive behavior emerges from interactions of nervous system, body and environment. Trends Neurosci 20(12):553–557. [DOI] [PubMed] [Google Scholar]
- Coey CA, Hassebrock J, Kloos H, Richardson MJ (2013) Fractal structure of the nested actions in keeping the beat. In: Knauff M, Pauen M, Sebanz N, Wachsmuth I, editors. Proceedings of the 35th annual conference of the cognitive science society. Austin, TX: Cognitive Science Society. p. 172–177. [Google Scholar]
- Collins JJ, De Luca CJ, Burrows A, Lipsitz LA (1995) Age-related changes in open-loop and closed-loop postural control mechanisms. Exp Brain Res 104(3):480–492. [DOI] [PubMed] [Google Scholar]
- Cope M, Delpy DT (1988) System for long-term measurement of cerebral blood and tissue oxygenation on newborn infants by near infra-red transillumination. Med Biol Eng Comput 26(3):289–294. [DOI] [PubMed] [Google Scholar]
- Cui X, Bray S, Bryant DM, Glover GH, Reiss AL (2011) A quantitative comparison of NIRS and fMRI across multiple cognitive tasks. Neuroimage 54(4):2808–2821. [DOI] [PMC free article] [PubMed] [Google Scholar]
- Damouras S, Chang MD, Sejdić E, Chau T (2010) An empirical examination of detrended fluctuation analysis for gait data. Gait Posture 31(3):336–340. [DOI] [PubMed] [Google Scholar]
- Del Olmo MF, Cheeran B, Koch G, Rothwell JC (2007) Role of the cerebellum in externally paced rhythmic finger movements. J Neurophysiol 98(1):145–152. [DOI] [PubMed] [Google Scholar]
- Delignières D, Marmelat V (2013) Degeneracy and long-range correlations. Chaos 23(4) 043109. [DOI] [PubMed] [Google Scholar]
- Delignières D, Lemoine L, Torre K (2004) Time intervals production in tapping and oscillatory motion. Hum Mov Sci 23(2):87–103. [DOI] [PubMed] [Google Scholar]
- Delignières D, Almurad ZM, Roume C, Marmelat V (2016) Multifractal signatures of complexity matching. Exp Brain Res 234(10):2773–2785. [DOI] [PubMed] [Google Scholar]
- Den Hartig R, Marmelat V, Cox R (2018) Multiscale coordination between athletes: complexity matching in ergometer rowing. Hum Mov Sci 57:434–441. [DOI] [PubMed] [Google Scholar]
- Di Ieva A, Grizzi F, Jelinek H, Pellionisz AJ, Losa GA (2014) Fractals in the neurosciences, part I: general principles and basic neurosciences. Neuroscientist 20(4):403–417. [DOI] [PubMed] [Google Scholar]
- Diedrich FJ, Warren WH Jr (1995) Why change gaits? Dynamics of the walk-run transition. J Exp Psychol Hum Percep Perform 21(1):183. [DOI] [PubMed] [Google Scholar]
- Diniz A, Wijnants ML, Torre K, Barreiros J, Crato N, Bosman AM, Hasselman F, Cox RF, van Orden GC, Delignières D (2011) Contemporary theories of 1/f noise in motor control. Hum Mov Sci 30(5):889–905. [DOI] [PubMed] [Google Scholar]
- Drake C, Jones MR, Baruch C (2000) The development of rhythmic attending in auditory sequences: attunement, referent period, focal attending. Cognition 77(3):251–288. [DOI] [PubMed] [Google Scholar]
- Eke A, Hermán P (1999) Fractal analysis of spontaneous fluctuations in human cerebral hemoglobin content and its oxygenation level recorded by NIRS. Adv Exp Med Biol 471:49–55. [DOI] [PubMed] [Google Scholar]
- Eke A, Herman P, Bassingthwaighte J, Raymond G, Percival D, Cannon M, Ellipsis Ikrényi C (2000) Physiological time series: distinguishing fractal noises from motions. Pflügers Archiv 439(4):403–415. [DOI] [PubMed] [Google Scholar]
- Eke A, Hermán P, Hajnal M (2006) Fractal and noisy CBV dynamics in humans: influence of age and gender. J Cereb Blood Flow Metab 26(7):891–898. [DOI] [PubMed] [Google Scholar]
- Fine JM, Likens AD, Amazeen EL, Amazeen PG (2015) Emergent complexity matching in interpersonal coordination: Local dynamics and global variability. J Exp Psychol Hum Percep Perform 41(3):723. [DOI] [PubMed] [Google Scholar]
- Fletcher NH (1999) The nonlinear physics of musical instruments. Rep Prog Phys 62(5):723. [Google Scholar]
- Freeman WJ, Holmes MD (2005) Metastability, instability, and state transition in neocortex. Neural Netw 18:497–504. [DOI] [PubMed] [Google Scholar]
- Friston KJ (1997) Transients, metastability, and neuronal dynamics. Neuroimage 5:164–171. [DOI] [PubMed] [Google Scholar]
- Gilden DL (2001) Cognitive emissions of 1/f noise. Psychol Rev 108:33–56. [DOI] [PubMed] [Google Scholar]
- Gilden DL, Thornton T, Mallon MW (1995) 1/f noise in human cognition. Science 267(5205):1837–1839. [DOI] [PubMed] [Google Scholar]
- Hardstone R, Poil SS, Schiavone G, Jansen R, Nikulin VV, Mansvelder HD, Linkenkaer-Hansen K (2012) Detrended fluctuation analysis: a scale-free view on neuronal oscillations. In: He BJ, Daffertshofer A, Boonstra TW, editors. Scale-free dynamics and critical phenomena in cortical activity. Luasaane, Switzerland: Frontiers Media SA. p. 75. [DOI] [PMC free article] [PubMed] [Google Scholar]
- Harrison SJ, Stergiou N (2015) Complex adaptive behavior and dexterous action. Nonlinear Dyn Psychol Life Sci 19(4):345. [PMC free article] [PubMed] [Google Scholar]
- Hatakenaka M, Miyai I, Mihara M, Sakoda S, Kubota K (2007) Frontal regions involved in learning of motor skill—a functional NIRS study. Neuroimage 34(1):109–116. [DOI] [PubMed] [Google Scholar]
- Hausdorff JM, Peng C-K, Ladin Z, Wei JY, Goldberger AL (1995) Is walking a random walk? Evidence for long-range correlations in stride interval of human gait. J Appl Physiol 78:349–1995. [DOI] [PubMed] [Google Scholar]
- He BJ (2011) Scale-free properties of the functional magnetic resonance imaging signal during rest and task. J Neurosci 31(39):13786–13795. [DOI] [PMC free article] [PubMed] [Google Scholar]
- Hennig H (2014) Synchronization in human musical rhythms and mutually interacting complex systems. Proc Natl Acad Sci U S A 111:12974–12979. [DOI] [PMC free article] [PubMed] [Google Scholar]
- Herman P, Sanganahalli BG, Hyder F, Eke A (2011) Fractal analysis of spontaneous fluctuations of the BOLD signal in rat brain. Neuroimage 58(4):1060–1069. [DOI] [PMC free article] [PubMed] [Google Scholar]
- Herzel H (1993) Bifurcations and chaos in voice signals. Appl Mech Rev 46(7):399–413. [Google Scholar]
- Hirth C, Obrig H, Valdueza J, Dirnagl U, Villringer A (1997) Simultaneous assessment of cerebral oxygenation and hemodynamics during a motor task. In: Elwell CE, Leung TS, Harrison DK, editors. Advances in experimental medicine and biology: oxygen transport to tissue XVIII. NM, US: Springer. p. 461–469. [DOI] [PubMed] [Google Scholar]
- Holper L, Biallas M, Wolf M (2009) Task complexity relates to activation of cortical motor areas during uni-and bimanual performance: a functional NIRS study. Neuroimage 46(4):1105–1113. [DOI] [PubMed] [Google Scholar]
- Hoshi Y, Kobayashi N, Tamura M (2001) Interpretation of near-infrared spectroscopy signals: a study with a newly developed perfused rat brain model. J Appl Physiol 90(5):1657–1662. [DOI] [PubMed] [Google Scholar]
- Hunt N, McGrath D, Stergiou N (2014) The influence of auditory-motor coupling on fractal dynamics in human gait. Sci Rep 4:5879. [DOI] [PMC free article] [PubMed] [Google Scholar]
- Hurst HE (1951) Long-term storage capacity of reservoirs. Trans Am Soc Civil Eng 116:770–799. [Google Scholar]
- Itoh K, Nakada T (2013) Human brain detects short-time nonlinear predictability in the temporal fine structure of deterministic chaotic sounds. Phys Rev E 87(4) 042916. [DOI] [PubMed] [Google Scholar]
- Jasper HH (1958) The ten-twenty electrode system of the International Federation. Electroenceph Clin Neurophysiol 10:371–375. [PubMed] [Google Scholar]
- Jeka JJ (1992) Asymmetric dynamics of human limb coordination Ph. D. diss. Florida Atlantic University. [Google Scholar]
- Kaipust JP, McGrath D, Mukherjee M, Stergiou N (2013) Gait variability is altered in older adults when listening to auditory stimuli with differing temporal structures. Ann Biomed Eng 41(8):1595–1603. [DOI] [PubMed] [Google Scholar]
- Khoa TQD, Nakagawa M (2008) Recognizing brain activities by functional near-infrared spectroscope signal analysis. Nonlinear Biomed Phys 2(1):3. [DOI] [PMC free article] [PubMed] [Google Scholar]
- Kornysheva K, Schubotz RI (2011) Impairment of auditory-motor timing and compensatory reorganization after ventral premotor cortex stimulation. PLoS One 6(6) e21421. [DOI] [PMC free article] [PubMed] [Google Scholar]
- Kuboyama N, Nabetani T, Shibuya KI, Machida K, Ogaki T (2004) The effect of maximal finger tapping on cerebral activation. J Physiol Anthropol Appl Human Sci 23(4):105–110. [DOI] [PubMed] [Google Scholar]
- Kuboyama N, Nabetani T, Shibuya K, Machida K, Ogaki T (2005) Relationship between cerebral activity and movement frequency of maximal finger tapping. J Physiol Anthropol Appl Human Sci 24(3):201–208. [DOI] [PubMed] [Google Scholar]
- Kumar A, Mullick SK (1996) Nonlinear dynamical analysis of speech. J Acoust Soc Am 100(1):615–629. [Google Scholar]
- Lakatos P, Shah AS, Knuth KH, Ulbert I, Karmos G, Schroeder CE (2005) An oscillatory hierarchy controlling neuronal excitability and stimulus processing in the auditory cortex. J Neurophysiol 94:1904–1911. [DOI] [PubMed] [Google Scholar]
- Large EW (2008) Resonating to musical rhythm: theory and experiment. In: Grondin S, editor. The psychology of time. Bingley, UK: Emerald. p. 189–231. [Google Scholar]
- Large EW, Snyder JS (2009) Pulse and meter as neural resonance. Ann N Y Acad Sci 1169:46–57. [DOI] [PubMed] [Google Scholar]
- Large EW, Herrera JA, Velasco MJ (2015) Neural networks for beat perception in musical rhythm. Front Syst Neurosci 9:159. [DOI] [PMC free article] [PubMed] [Google Scholar]
- Leff DR, Orihuela-Espina F, Elwell CE, Athanasiou T, Delpy DT, Darzi AW, Yang GZ (2011) Assessment of the cerebral cortex during motor task behaviours in adults: a systematic review of functional near infrared spectroscopy (fNIRS) studies. Neuroimage 54(4):2922–2936. [DOI] [PubMed] [Google Scholar]
- Lin A, Maniscalco B, He BJ (2016) Scale-free neural and physiological dynamics in naturalistic stimuli processing. eNeuro 3(5):1–13. [DOI] [PMC free article] [PubMed] [Google Scholar]
- Linkenkaer-Hansen K, Nikouline VV, Palva JM, Ilmoniemi RJ (2001) Long-range temporal correlations and scaling behavior in human brain oscillations. J Neurosci 21(4):1370–1377. [DOI] [PMC free article] [PubMed] [Google Scholar]
- Madison G (2004) Fractal modeling of human isochronous serial interval production. Biol Cybern 90(2):105–112. [DOI] [PubMed] [Google Scholar]
- Mafahim JU, Lambert D, Zare M, Grigolini P (2015) Complexity matching in neural networks. New J Phys 17(1):015003. [Google Scholar]
- Mandelbrot B (1990) Fractals-a geometry of nature. New Sci. 127:38–43. [Google Scholar]
- Marmelat V, Delignières D (2012) Strong anticipation: complexity matching in interpersonal coordination. Exp Brain Res 222(1–2):137–148. [DOI] [PubMed] [Google Scholar]
- Marmelat V, Torre K, Beek PJ, Daffertshofer A (2014) Persistent fluctuations in stride intervals under fractal auditory stimulation. PLoS ONE 9(3) e91949. [DOI] [PMC free article] [PubMed] [Google Scholar]
- Mirzayof D, Ashkenazy Y (2010) Preservation of long range temporal correlations under extreme random dilution. Physica A Stat Mech Appl 389(24):5573–5580. [Google Scholar]
- Novikov E, Novikov A, Shannahoff-Khalsa D, Schwartz B, Wright J (1997) Scale-similar activity in the brain. Phys Rev E 56:R2387. [Google Scholar]
- Nozaradan S, Peretz I, Missal M, Mouraux A (2011) Tagging the neuronal entrainment to beat and meter. J Neurosci 31:10234–10240. [DOI] [PMC free article] [PubMed] [Google Scholar]
- Nozaradan S, Zerouali Y, Peretz I, Mouraux A (2013) Capturing with EEG the neural entrainment and coupling underlying sensorimotor synchronization to the beat. Cereb. Cortex 25(3):736–747. [DOI] [PubMed] [Google Scholar]
- Nozaradan S, Peretz I, Keller PE (2016) Individual Differences in Rhythmic Cortical Entrainment Correlate with Predictive Behavior in Sensorimotor Synchronization. Sci Rep 6:20612. [DOI] [PMC free article] [PubMed] [Google Scholar]
- Obrig H, Villringer A (2003) Beyond the visible—imaging the human brain with light. J Cereb Blood Flow Metab 23(1):1–18. [DOI] [PubMed] [Google Scholar]
- Obrig H, Hirth C, Junge-Hulsing JG, Doge C, Wolf T, Dirnagl U, Villringer A (1996) Cerebral oxygenation changes in response to motor stimulation. J Appl Physiol 81(3):1174–1183. [DOI] [PubMed] [Google Scholar]
- Okamoto M, Dan I (2005) Automated cortical projection of head-surface locations for transcranial functional brain mapping. Neuroimage 26(1):18–28. [DOI] [PubMed] [Google Scholar]
- Okamoto M, Dan H, Sakamoto K, Takeo K, Shimizu K, Kohno S, Oda I, Isobe S, Suzuki T, Kohyama K, Dan I (2004) Three-dimensional probabilistic anatomical cranio-cerebral correlation via the international 10–20 system oriented for transcranial functional brain mapping. Neuroimage 21(1):99–111. [DOI] [PubMed] [Google Scholar]
- Oullier O, Jantzen KJ, Steinberg FL, Kelso JAS (2005) Neural substrates of real and imagined sensorimotor coordination. Cereb Cortex 15:975–985. 10.1093/cercor/bhh198. [DOI] [PubMed] [Google Scholar]
- Peng CK, Mietus J, Hausdorff JM, Havlin S, Stanley HE, Goldberger AL (1993) Long-range anticorrelations and non-Gaussian behavior of the heartbeat. Phys Rev Lett 70(9):1343. [DOI] [PubMed] [Google Scholar]
- Pittman-Polletta BR, Scheer FA, Butler MP, Shea SA, Hu K (2013) The role of the circadian system in fractal neurophysiological control. Biol Rev 88(4):873–894. [DOI] [PMC free article] [PubMed] [Google Scholar]
- Plichta MM, Herrmann MJ, Ehlis AC, Baehne CG, Richter MM, Fallgatter AJ (2006) Event-related visual versus blocked motor task: detection of specific cortical activation patterns with functional near-infrared spectroscopy. Neuropsychobiology 53(2):77–82. [DOI] [PubMed] [Google Scholar]
- Pollok B, Rothkegel H, Schnitzler A, Paulus W, Lang N (2008) The effect of rTMS over left and right dorsolateral premotor cortex on movement timing of either hand. Eur J Neurosci 27(3):757–764. [DOI] [PubMed] [Google Scholar]
- Rankin SK, Limb CJ (2014) Auditory-motor synchronization with temporally fluctuating sequences is dependent on fractal structure but not musical expertise. Front Psychol 5:970–977. [DOI] [PMC free article] [PubMed] [Google Scholar]
- Rankin SK, Fink PW, Large EW (2014) Fractal structure enables temporal prediction in music. J Acoust Soc Am 136(4):EL256–EL262. [DOI] [PubMed] [Google Scholar]
- Repp B (2002) The embodiment of musical structure: effects of musical context on sensorimotor synchronization with complex timing patterns. In: Prinz W, Hommel B, editors. Common mechanisms in perception and action: attention and performance XIX. Oxford: Oxford University Press. p. 245–265. [Google Scholar]
- Repp BH (2005) Sensorimotor synchronization: a review of the tapping literature. Psychon Bull Rev 12(6):969–992. [DOI] [PubMed] [Google Scholar]
- Repp BH, Su YH (2013) Sensorimotor synchronization: a review of recent research (2006–2012). Psychon Bull Rev 20(3):403–452. [DOI] [PubMed] [Google Scholar]
- Rhodes T, Turvey MT (2007) Human memory retrieval as Lévy foraging. Phys A 385:255–260. [Google Scholar]
- Sato T, Ito M, Suto T, Kameyama M, Suda M, Yamagishi Y, Ohshima A, Uehara T, Fukuda M, Mikuni M (2007) Time courses of brain activation and their implications for function: a multichannel near-infrared spectroscopy study during finger tapping. Neurosci Res 58(3):297–304. [DOI] [PubMed] [Google Scholar]
- Shibusawa M, Takeda T, Nakajima K, Ishigami K, Sakatani K (2009) Functional near-infrared spectroscopy study on primary motor and sensory cortex response to clenching. Neurosci Lett 449(2):98–102. [DOI] [PubMed] [Google Scholar]
- Shibuya K, Sadamoto T, Sato K, Moriyama M, Iwadate M (2008) Quantification of delayed oxygenation in ipsilateral primary motor cortex compared with contralateral side during a unimanual dominant-hand motor task using near-infrared spectroscopy. Brain Res 1210:142–147. [DOI] [PubMed] [Google Scholar]
- Smit DJ, Linkenkaer-Hansen K, de Geus EJ (2013) Long-range temporal correlations in resting-state alpha oscillations predict human timing error dynamics. J Neurosci 33:11212–11220. [DOI] [PMC free article] [PubMed] [Google Scholar]
- Stephen DG, Anastas J (2011) Fractal fluctuations in gaze speed visual search. Atten Percept Psychophys 73(3):666–677. [DOI] [PubMed] [Google Scholar]
- Stephen DG, Dixon JA (2011) Strong anticipation: multifractal cascade dynamics modulate scaling in synchronization behaviors. Chaos Solitons Fractals 44(1):160–168. [Google Scholar]
- Stephen DG, Stepp N, Dixon J, Turvey MT (2008) Strong anticipation: Sensitivity to long-range correlations in synchronization behavior. Phys. A 387:5271–5278. [Google Scholar]
- Stephen DG, Arzamarski R, Michaels CF (2010) The role of fractality in perceptual learning: exploration in dynamic touch. J Exp Psychol Hum Percep Perform 36:1161–1173. [DOI] [PubMed] [Google Scholar]
- Stergiou N, Harbourne RT, Cavanaugh JT (2006) Optimal movement variability: a new theoretical perspective for neurologic physical therapy. J Neurol Phys Ther 30:120–129. [DOI] [PubMed] [Google Scholar]
- Strangman G, Culver JP, Thompson JH, Boas DA (2002) A quantitative comparison of simultaneous BOLD fMRI and NIRS recordings during functional brain activation. Neuroimage 17(2):719–731. [PubMed] [Google Scholar]
- Terrier P, Turner V, Schutz Y (2005) GPS analysis of human locomotion: further evidence for long-range correlations in stride-to-stride fluctuations of gait parameters. Hum Mov Sci 24(1):97–115. [DOI] [PubMed] [Google Scholar]
- Thurner S, Windischberger C, Moser E, Walla P, Barth M (2003) Scaling laws and persistence in human brain activity. Phys A Stat Mech Appl 326(3):511–521. [Google Scholar]
- Tognoli E, Kelso JS (2014) The metastable brain. Neuron 81(1):35–48. [DOI] [PMC free article] [PubMed] [Google Scholar]
- Toronov V, Webb A, Choi JH, Wolf M, Michalos A, Gratton E, Hueber D (2001) Investigation of human brain hemodynamics by simultaneous near-infrared spectroscopy and functional magnetic resonance imaging. Med Phys 28(4):521–527. [DOI] [PubMed] [Google Scholar]
- Torre K, Delignières D (2008) Distinct ways of timing movements in bimanual coordination tasks: Contribution of serial correlation analysis and implications for modeling. Acta Psychol 129(2):284–296. [DOI] [PubMed] [Google Scholar]
- Torre K, Wagenmakers EJ (2009) Theories and models for 1/fβ noise in human movement science. Hum Mov Sci 28(3):297–318. [DOI] [PubMed] [Google Scholar]
- Torre K, Balasubramaniam R (2011) Disentangling stability, variability and adaptability in human performance: Focus on the interplay between local variance and serial correlation. J Exp Psychol Hum Percept Perform 37(2):539–550. [DOI] [PubMed] [Google Scholar]
- Torre K, Delignieres D, Lemoine L (2007) 1/fβ fluctuations in bimanual coordination: an additional challenge for modeling. Exp Brain Res 183(2):225–234. [DOI] [PubMed] [Google Scholar]
- Torre K, Balasubramaniam R, Rheaume N, Lemoine L, Zelaznik HN (2011) Long-range correlation properties in motor timing are individual and task specific. Psychon Bull Rev 18(2):339–346. [DOI] [PubMed] [Google Scholar]
- Torre K, Varlet M, Marmelat V (2013) Predicting the biological variability of environmental rhythms: weak or strong anticipation for sensorimotor synchronization? Brain Cogn 83(3):342–350. [DOI] [PubMed] [Google Scholar]
- Turvey MT, Fonseca ST (2014) The medium of haptic perception: a tensegrity hypothesis. J Mot Behav 46(3):143–187. [DOI] [PubMed] [Google Scholar]
- Ulanovsky N, Las L, Farkas D, Nelken I (2004) Multiple time scales of adaptation in auditory cortex neurons. J Neurosci 24(46):10440–10453. [DOI] [PMC free article] [PubMed] [Google Scholar]
- van Orden GC, Holden JG, Turvey MT (2003) Self-organization of cognitive performance. J Exp Psychol Gen 132(3):331–350. [DOI] [PubMed] [Google Scholar]
- van Orden G, Kloos H, Wallot S (2009) Living in the pink: intentionality, well-being, complexity. In: Hooker C, editor. Handbook of the philosophy of science, vol. 10. New York: Elsevier. p. 639–683. [Google Scholar]
- Vorberg D, Schulze HH (2002) Linear phase-correction in synchronization: predictions, parameter estimation, and simulations. J Math Psychol 46(1):56–87. [Google Scholar]
- Vorberg D, Wing A (1996) Modeling variability and dependence in timing. In: Heuer H, Keele SW, editors. Handbook of perception and action, vol. 2. London, UK: Academic Press. p. 181–262. [Google Scholar]
- Werner G (2010) Fractals in the nervous system: conceptual implications for theoretical neuroscience. Front Physiol 1:15. [DOI] [PMC free article] [PubMed] [Google Scholar]
- West BJ, Geneston EL, Grigolini P (2008) Maximizing information exchange between complex networks. Phys Rep 468(1):1–99. [Google Scholar]
- Will U, Berg E (2007) Brain wave synchronization and entrainment to periodic acoustic stimuli. Neurosci Lett 424:55–60. [DOI] [PubMed] [Google Scholar]
- Wilson TW, Kurz MJ, Arpin DJ (2014) Functional specialization within the supplementary motor area: a fNIRS study of bimanual coordination. Neuroimage 85:445–450. [DOI] [PMC free article] [PubMed] [Google Scholar]
- Wing AM, Kristofferson AB (1973) Response delays and the timing of discrete motor responses. Percept Psychophys 14:5–12. [Google Scholar]
- Wing A, Daffertshofer A, Pressing J (2004) Multiple time scales in serial production of force. A tutorial on power spectral analysis of motor variability. Hum Mov Sci 23:569–590. [DOI] [PubMed] [Google Scholar]
- Yamada N (1995) Nature of variability in rhythmical movement. Hum Mov Sci 14(3):371–384. [Google Scholar]
- Yu Y, Romero R, Lee TS (2005) Preference of sensory neural coding for 1/f signals. Phys Rev Lett 94(10) 108103. [DOI] [PubMed] [Google Scholar]
- Zapata-Fonseca L, Dotov D, Fossion R, Froese T (2016) Time-series analysis of embodied interaction: movement variability and complexity matching as dyadic properties. Front Psychol 7:1940. [DOI] [PMC free article] [PubMed] [Google Scholar]
- Zhang Y, Brooks DH, Franceschini MA, Boas DA (2005) Eigenvector-based spatial filtering for reduction of physiological interference in diffuse optical imaging. J Biomed Opt 10:11014. [DOI] [PubMed] [Google Scholar]