


Keywords: kidney disease, kidney transplant, nephron number, positron emission tomography, radiolabeled cationic ferritin
Abstract
Nephron number varies widely in humans. A low nephron endowment at birth or a loss of functioning nephrons is strongly linked to increased susceptibility to chronic kidney disease. In this work, we developed a contrast agent, radiolabeled cationic ferritin (RadioCF), to map functioning glomeruli in vivo in the kidney using positron emission tomography (PET). PET radiotracers can be detected in trace doses (<30 nmol), making them useful for rapid clinical translation. RadioCF is formed from cationic ferritin (CF) and with a radioisotope, Cu-64, incorporated into the ferritin core. We showed that RadioCF binds specifically to kidney glomeruli after intravenous injection in mice, whereas radiolabeled noncationic ferritin (RadioNF) and free Cu-64 do not. We then showed that RadioCF-PET can distinguish kidneys in healthy wild-type (WT) mice from kidneys in mice with oligosyndactylism (Os/+), a model of congenital hypoplasia and low nephron mass. The average standardized uptake value (SUV) measured by PET 90 min after injection was 21% higher in WT mice than in Os/+ mice, consistent with the higher glomerular density in WT mice. The difference in peak SUV from SUV at 90 min correlated with glomerular density in male mice from both WT and Os/+ cohorts (R2 = 0.98). Finally, we used RadioCF-PET to map functioning glomeruli in a donated human kidney. SUV within the kidney correlated with glomerular number (R2= 0.78) measured by CF-enhanced magnetic resonance imaging in the same locations. This work suggests that RadioCF-PET appears to accurately detect nephron mass and has the potential for clinical translation.
INTRODUCTION
Approximately one-third of adults are at risk for chronic kidney disease (CKD) (1). The prevalence of CKD continues to increase due to the growing number of patients with diabetes and hypertension. Common clinical markers of kidney failure, such as serum creatinine, are insensitive to the early stages of CKD. Late detection of CKD has resulted in a significant number of patients entering end-stage kidney disease (ESKD), requiring dialysis and transplant. Transplant kidneys are primarily evaluated by demographic or clinical markers and biopsy. There is currently a shortage of kidneys available to patients requiring a transplant, in part due to the lack of technologies to sensitively assess the health of individual organs. There is also a dire need for more sensitive methods to rapidly detect progression to allograft failure in recipients. Sensitive monitoring of kidney structure could facilitate interventions to slow the progression of CKD, improve transplant allocation, and increase graft survival times.
Nephron mass has been proposed as a potential predictor of kidney health (2, 3). A low nephron endowment at birth or a loss of nephrons later in life may increase an individual’s susceptibility to CKD or cardiovascular disease (4–6). Loss of functioning nephrons is thought to induce compensatory hyperfiltration of remaining nephrons to maintain total glomerular filtration rate (7–9). This compensatory hyperfiltration of remaining glomeruli and tubules eventually leads to ESKD in high-risk individuals. Compensatory hyperfiltration is a potential reason that early kidney disease is undetected. The quality and quantity of the remaining nephrons are thus potential markers of susceptibility to CKD. Identifying patients with low nephron endowment or reduced nephron mass may help to stratify populations at risk for CKD and could enable therapies to avoid progression to ESKD.
Our understanding of the role of nephron mass in kidney health is largely derived from studies using stereological techniques, applied postmortem in humans. Human nephron number appears to range from ∼200,000 to >2,000,000 between individuals (10, 11). Nephron number has also been indirectly estimated in patients through a combination of biopsy and X-ray computed tomography (CT) (2, 12). These tools have also allowed estimates of average single-nephron glomerular filtration rate in healthy patients being evaluated for kidney donation (13). Recent work in animals indicates that small to moderate reductions in nephron mass may increase susceptibility to kidney disease (3).
Nephron mass has recently been directly measured ex vivo in rats, mice, rabbits, and humans (14–17) and in vivo in rats and mice (18, 19) using magnetic resonance imaging (MRI) after intravenous injection of cationic ferritin (CF). CF is formed by conjugating a short cationic cross-linker to the surface of the ferritin protein. CF binds transiently to the glomerular basement membrane (GBM), providing image contrast between individual glomeruli and surrounding tissue in MR images. Individual glomeruli can then be detected and counted, and individual glomerular volumes can be spatially mapped (15, 16). Importantly, CF-enhanced MRI (CFE-MRI) can be used with other high-resolution MR image acquisition strategies to provide a three-dimensional (3-D) view of vascular, glomerular, and, possibly, tubulointerstitial microstructure (20, 21). However, the required dose of CF used for CFE-MRI (∼10 mg/100 g body wt) necessitates a detailed and lengthy evaluation for use in patients, despite an apparent lack of toxicity in rodents (22, 23). These hurdles could delay the use of nephron mass as a clinical tool.
To facilitate translation of nephron mass as a clinical imaging biomarker, we propose a new radiolabeled analog of CF, radiolabeled cationic ferritin (RadioCF), for use with positron emission tomography (PET). RadioCF is formed by incorporating the radioisotope Cu-64 into the CF core, allowing its detection by PET in doses considered subpharmacological by the United States Food and Drug Administration. This work introduces RadioCF as a targeted radiotracer to noninvasively measure nephron mass using PET.
METHODS
RadioCF Synthesis
The formation and use of RadioCF are illustrated in Fig. 1A. Apoferritin subunits, self-assembled in vivo or in solution, form the shell of the ferritin 24-mer (step 1). In the presence of Fe2+ (intracellular or in solution) a superparamagnetic iron oxide nanoparticle can be formed within the core (step 2) (24, 25). The holoferritin nanoparticle, assembled in step 2, is detectable with MRI. Conjugating a NH3+-containing cross-linker to the outer surface of ferritin (step 3) makes it cationic. Finally, Cu-64 is incorporated within the cationic ferritin core by temporarily lowering the pH (step 4). RadioCF is then purified and prepared for imaging using MRI or PET.
Figure 1.

Synthesis and characterization of radiolabeled cationic ferritin (RadioCF). A: illustration of the synthesis of RadioCF for positron emission tomography (PET) or magnetic resonance imaging (MRI). Step 1: apoferritin is self-assembled from H and L subunits. Step 2: iron (red) can be added to form an iron oxide nanoparticle within the ferritin core. Step 3: amines (orange) are conjugated to the surface to provide a cationic charge. Step 4: Cu-64 (yellow) is added to form RadioCF, used in PET or MRI to measure glomerular number or density. B and C: the typical structure of the ferritin molecule is retained after cationization and radiolabeling, as seen in images from transmission electron microscopy (TEM). Scale bars = 20 nm in B and C. D: zeta potentiometry was used to confirm that RadioCF was cationic in solution. Three-dimensional gradient echo MRI of mouse kidneys labeled with horse spleen cationic ferritin (CF) after intravenous in vivo injection (n = 1; E and H) and RadioCF (n = 1; F and I) confirmed glomerular labeling visible as punctate dark spots in the kidney cortex. A mouse kidney that did not receive contrast enhancement exhibited no dark spots (n = 1; G and J). Scale bars = 1 mm in E–G and 0.2 mm in H–J. K: dynamic light scattering (DLS) was performed in solutions of native ferritin (NF), horse spleen CF, and RadioCF. NF exhibited a distinct peak at ∼12 nm, consistent with the known size of ferritin. CF and RadioCF also exhibited peaks at ∼100 nm, indicating some flocculation. n, number of animals.
To form RadioCF, we first exchanged the buffer of stock horse spleen cationic ferritin (CF; Sigma, St. Louis, MO) in 0.15 M saline with 10 mM sodium acetate at pH 5. Stock CF (150 µL) was centrifuged at 14,000 g for 5 min in an Amicon-10K centrifugal filter (Millipore) and then diluted with the sodium acetate. This exchange process was repeated three times. CF was then rinsed from the filter and the volume was adjusted to 400 µL with the sodium acetate buffer. The CF solution was allowed to mix overnight at pH 5. Cu-64 in 0.1 M HCl was obtained from the Washington University Cyclotron Facility, diluted with 100 µL 10 mM sodium acetate buffer at pH 5, and then added to the ferritin solution. The solution was heated to 50°C for 90 min in an Eppendorf Thermomixer C (Eppendorf, Hamburg, Germany) and then cooled to 25°C. pH was raised by adding 6 µL of 1 N NaOH and 15 µL of 10 mM diethylenetriamine pentaacetate acid (DTPA). This was mixed for 15 min. The DTPA was added to complex any free Cu-64 not incorporated within the ferritin core. The Cu-DTPA was separated from the RadioCF using chromatography. The RadioCF was then purified on a disposable column (Bio-Rad, Hercules, CA) packed with 2 g of Sephadex G-25 superfine resin, preswollen overnight with deionized water (dH2O). The product was applied to the column bed and then eluted in 1 mL fractions of dH2O. RadioCF was typically eluted in fractions 10–12. These fractions were combined and the RadioCF was concentrated using an Amicon Ultra-15 filter and centrifuged at 5,000 g for 8 min. Total reaction time was ∼3 h. Radiolabeled native ferritin without cationization (RadioNF) was prepared the same way and served as a control. Cu-64 control solution was formed using stock Cu-64 in 0.1 M HCl and diluting in 10 mM sodium acetate at pH 5. Synthesis was performed four times with similar results.
Characterization of RadioCF
Radiochemical purity was assessed using radio thin-layer chromatography (radio-TLC). A 1 µL aliquot was spotted onto a silica gel TLC plate and developed using 1:1 methanol/10% sodium acetate. The radioactivity on the plate was measured using a Bioscan AR-2000 radio-TLC scanner (Eckert & Ziegler, Berlin, Germany).
All further material characterization was performed using nonradioactive copper to avoid radiation exposure during analysis. First, CuCl2 was dissolved in 0.5 M HCl. Aliquots of 0.4 µg of the nonradioactive copper solution were used in each experiment. The same procedure for RadioCF synthesis was then followed to form nonradioactive RadioCF (nrRadioCF). The purified nrRadioCF was examined by dynamic light scattering (DLS) to measure hydrodynamic radius, zeta potentiometry to measure charge, and by transmission electron microscopy (TEM) to confirm that ferritin structure had not been altered during the incorporation of copper. DLS and zeta potentiometry were performed on 1 mg/mL samples in a plastic capillary cell using a Malvern ZEN3600 DLS (Malvern Instruments, Worcestershire, UK). TEM was performed with a JEOL JEM-1400 120 kV TEM (JEOL, Ltd.; Tokyo, Japan).
To verify that the synthesized RadioCF had bound to glomeruli after injection and to confirm RadioCF could still also be used as an MRI contrast agent, we performed CFE-MRI on kidneys of a mouse that had received nrRadioCF. CFE-MRI has been used in numerous studies to detect and measure kidney glomeruli (14, 16, 26). A healthy male C57BL/6 wild-type (WT) mouse received a total dose of 0.33 mg of nrRadioCF intravenously, separated in two injections with 90 min between injections. Ninety minutes after the second injection, the animal was transcardially perfused with saline followed by formalin, and kidneys were resected (14). We compared CFE-MRI of kidneys labeled with nrRadioCF to a kidney labeled with the typical intravenous dose (5.75 mg/100 g body wt) of CF (Sigma) for CFE-MRI as a positive control, and a kidney that did not receive contrast agent as a negative control (14). Kidneys were imaged together on an Agilent 11.74 T DirectDrive MRI (Palo Alto, CA) using a quadrature volume coil and a 3-D gradient-recalled echo pulse sequence. Pulse sequence parameters were as follows: echo time (TE)/repetition time (TR) = 25/100 ms, flip angle = 30°, and resolution = 52.7 × 52.7 × 58.6 µm3.
PET Imaging: Animal
All experiments were approved by the Institutional Animal Care and Use Committee at Washington University in St. Louis. We performed two separate studies. Study 1 was to determine whether RadioCF could be used as a targeted contrast agent to label kidney glomeruli for RadioCF-PET. Study 2 was a proof-of-principle study to determine whether RadioCF-PET could be used to distinguish mice with reduced nephron number from healthy controls. Data from study 1 were used to perform a power analysis to determine the required cohort sizes for study 2. An effect size was calculated using the average standardized uptake value (SUV) at 15 min and 90 min, which ranged from 2.00 to 2.94. For study 2, a power analysis suggested a total sample size of 8–10 animals divided evenly between the groups would be sufficient to detect differences with α = 0.05 and β = 0.20. We conducted an interim analysis in study 2 and found that a statistically significant difference was already present at the lower end of our project sample size. The animals included in study 1 were healthy male C57BL/6 wild-type (WT) mice with RadioCF (n = 4), RadioNF (n = 4), or free Cu64 (n = 4). All mice in study 1 were acquired from Charles River Laboratories (Wilmington, MA). Study 2 used healthy WT mice (n = 4, 2 male and 2 female) and mice with an oligosyndactylism (Os/+; C57BL/6 background; n = 3, 2 male and 1 female), modeling congenital reduced nephron number and glomerular hypertrophy. WT and Os/+ mice were obtained from a colony at the University of Virginia, and the Os/+ phenotype was confirmed by syndactylism of the toes (14, 27).
For imaging, mice were anesthetized using 1–2% isoflurane in an induction chamber and placed on the scanner bed. Anesthesia was maintained during imaging by nose cone. Respiratory rate and basal body temperature were controlled to ensure anesthesia. Mice were injected with 50–80 µCi of RadioCF (2.6 µg in 100 µL), RadioNF, or Cu-64 by tail vein catheter. Imaging was performed on the Siemens (Munich, Germany) Inveon PET/CT. After injection, images were collected every minute for 10 min and then every 5 min until 90 min post injection. List-mode data were reconstructed using an ordered subset expectation-maximization algorithm. Images were generated on the Inveon Research Workstation.
Following PET, the mice were euthanized by cervical dislocation under isoflurane anesthesia. The kidney, liver, lung, heart, brain, pancreas, intestine, and blood were removed and weighed for biodistribution studies. Biodistribution of each agent was measured using a Beckman 8000 gamma counter (Beckman Coulter, Brea, CA). Radioactivity was compared to the injected dose (ID) to report %ID per organ and %ID per gram of tissue. %ID per gram of tissue was calculated by measuring the total radiation in the organ and dividing the weight of the organ. Whole kidneys were cut in half. One half was embedded in optimal cutting temperature (OCT) compound and frozen using a Leica CM 1860 fast-freezing shelf (Leica Biosystems, Wetzlar, Germany). The remaining half was submerged in fixative (2% glutaraldehyde in phosphate buffer; Poly Scientific, Bay Shore, NY) and saved for stereology. Frozen kidneys were sectioned at 20-µm thickness on a Leica CM 1860 cryostat. The sections were then imaged with radio-phosphorimaging using a Typhoon FLA 9500 system (GE Healthcare, Chicago, IL) to localize agent accumulation within cortex or medulla.
Postprocessing: Animal
Whole kidneys and kidney cortex were segmented from the CT and PET images. We computed SUVs in the PET images using the animal’s weight and delivered dose. In study 1, 3-D regions of interest (ROIs) were drawn on the cortex and the descending aorta near the renal arteries using Inveon Research Workplace software (Siemens). In study 2, the cortex was segmented and we fitted the mean time-activity curve, both uptake and washout, with a biexponential curve (28). The biexponential function was as follows:
| (1) |
Here, C1 is a scaling constant, C3 is the decay rate after peak, C4 is the rise rate to peak, C5 is an additive constant, and C2 is a time-shifting constant. Fitting was performed using MATLAB software (The MathWorks, Inc., Natick, MA).
Stereology
Remaining kidney halves from study 2 were used for stereology to confirm the lower nephron number and glomerular density in the Os/+ strain (WT, n = 2; Os/+, n = 2; male only). Glomerular number was measured with the Weibel–Gomez approach, which provides similar results to model free dissector-fractionator stereology in adult mice (29–32). Fixed kidneys were embedded in paraffin and sectioned at 3 µm thickness using a Leica 2135 Microtome. Sections were stained using Masson’s trichrome method with a kit from Poly Scientific.
Images of stained tissue were acquired using a Leica DM1000 LED light microscope. The images were manually stitched using FIJI (33), and MATLAB. Amira (Thermo Fisher Scientific, Waltham, MA) was used to segment glomeruli, cortex, and medulla in the images. Cortical volume (VCortex) was calculated from kidney weights and using published data correlating kidney weight to cortex volume in the same strains of mice (14). We assumed that the percent volume (VV) of glomeruli in the kidney is reflected in the percent area of glomerular profiles (AA) in a two-dimensional (2-D) slice, i.e., AA = VV. The density of glomeruli throughout the entire volume (NV) was calculated as follows:
| (2) |
Here, constants k and β are used to correct for size distribution and glomerular shape, respectively, and were defined as: k = 1.04, β = 1.38. A tissue shrinkage coefficient from paraffin embedment (δ) of 1.395 was also used. All constants were based on published literature (32, 34, 35). Glomerular number (Nglom) was calculated by Nglom = NV × VCortex.
PET Imaging: Human Transplant Kidney
We performed a proof-of-principle study to determine whether RadioCF-PET could be applied to map nephron mass in a human kidney. A human kidney was obtained from the International Institute for the Advancement of Medicine. The kidney donor profile index (KDPI) was 98%, and the kidney was not accepted for transplant. A high KDPI was used in this study because the kidney was expected to exhibit grossly heterogeneous nephron loss, allowing us to compare nephron mass between regions within the kidney (15). At procurement, the kidney was perfused with 2–3 L of University of Wisconsin (UW) preservation solution, submerged in UW solution, and placed on ice for transport. The kidney was received with aorta intact. Excess fat was removed and the renal artery was catheterized. The procedure for RadioCF labeling was adapted from CFE-MRI (15). CFE-MRI has been used to detect total functioning glomeruli in a number of human kidneys with and without overt pathology. All solutions were at room temperature. The kidney was first flushed with 120 mL of PBS. It was then perfused with ∼400 µCi of RadioCF (0.57 mg), followed by another 120 mL of PBS. RadioCF that flowed out of the kidney was collected, and radioactivity was measured and compared to an equivalent control dose to determine the total dose of RadioCF delivered to the kidney. PET and CT images of the kidney at a single time point were acquired on a Siemens Inveon PET/CT. CT images were used to anatomically localize the kidney and later coregister with MRI. PET images were reconstructed using an ordered subset expectation-maximization algorithm.
Following PET and CT, the kidney was prepared for CFE-MRI as previously described (15). The kidney was first flushed with 60 mL of PBS, followed by 30 mg/100 g kidney weight of CF (Sigma) diluted in 60 mL of PBS. The kidney was then flushed with another 120 mL of PBS, followed by 60 mL of 10% neutral buffered formalin (Sigma). After a delay of 7 days to allow for radioactive decay, the kidney was imaged on an Agilent 11.74 T DirectDrive MRI using a quadrature volume coil and a 3-D gradient-recalled echo (GRE) pulse sequence with TE/TR = 14.5/100 ms, resolution = 117.2 × 117.2 × 107.4 µm3, and flip angle =30°.
Postprocessing: Human Kidney
The three-dimensional PET, CT, and MR images of the kidney were processed in Amira and MATLAB. Amira was used to coregister the images using the “Affine Registration” toolbox. Rigid coregistration was followed by nonlinear coregistration.
CFE-MRI was used to validate RadioCF-PET. Maps of glomeruli were created using MIPAR (MIPAR Image Analysis, Worthington, OH) software. Kidneys were segmented using a combination of manual segmentation in Amira and automated segmentation in MIPAR using the following parameters: Smart Cluster function: classes = 3, edge clean = 0, sped = 1; next, a circular dilation with radius equal to 1 voxel; next, a size filter = 1; and lastly followed by a circular erosion with a radius equal to 7 voxels. The MIPAR recipe for glomerular detection contained the following functions and parameters: adaptive threshold with select 51% dark voxels, box median, 10 window size, rejecting features with area >20 voxels. Glomeruli were then mapped and counted in 3-D using MATLAB with a guided watershed algorithm with a connectivity of 6 (14). Glomerular density was calculated for each glomerulus by measuring the number of neighbor glomeruli in an isotropic 3-D region of interest (21 voxels in every direction).
ROI analysis was performed using 3-D PET and CFE-MR images. We compared SUV to glomerular number in randomly selected ROIs from coregistered 3-D CFE-MRI and RadioCF-PET images of the same kidney. The ROIs were first manually segmented in the RadioCF-PET images. A Gaussian blurring algorithm was applied to the PET image with the “imgaussfilt” function in MATLAB and a standard deviation of 0.05. Filtered images were then binarized using a threshold twice the average noise value measured from an ROI outside the kidney. Resultant binary images were then multiplied with the binary hand-drawn ROI images. The final ROIs were used for measurements.
RESULTS
Synthesis and Characterization of PET Agents
We radiolabeled cationic ferritin (CF) with Cu-64 to form RadioCF. Radiolabeled noncationic native ferritin (RadioNF) was also synthesized and served as a control. RadioCF had the same spherical shape and 13 nm diameter as commercial CF, with a core diameter of ∼7 nm, seen in TEM (Fig. 1, B and C). The hydrodynamic radii of RadioCF and commercial CF were similar, 50–100 nm. The hydrodynamic radius of native ferritin (NF) was ∼10 nm, suggesting some flocculation in both CF and RadioCF in solution (Fig. 1K). Flocculation was not observed in TEM. Zeta potentiometry confirmed that RadioCF was cationic (Fig. 1D). RadioTLC showed that RadioCF remained at the baseline of the TLC plate, whereas any free Cu-64/DTPA coordination complex traveled toward the solvent front (not shown).
CFE-MR images of the kidney of a mouse that had received an MRI-detectable dose of nrRadioCF (CF labeled with nonradioactive copper) exhibited dark, punctate spots throughout the cortex (Fig. 1, E–F and H–I). This was identical to glomerular labeling in mouse kidneys using commercial CF (14, 19). No glomerular labeling was visible in the control kidney that received no CF or RadioCF, consistent with numerous published studies (14, 26, 36) (Fig. 1, G and J).
RadioCF-PET as a Targeted Tracer to Detect Renal Glomeruli
We investigated the use of RadioCF-PET to detect glomeruli in vivo. RadioCF (n = 4), RadioNF (n = 4), and free Cu-64 (n = 4) were injected intravenously into separate mice and scanned by PET over 90 min. PET images revealed selective uptake of RadioCF in the kidney cortex, as shown in images of mice from each cohort at 90 min in Fig. 2, A–F. There was no specific enhancement of the RadioNF or free Cu-64 in the cortex. RadioCF was also detected in the lungs and liver, whereas RadioNF and Cu-64 were detected primarily in the liver.
Figure 2.

Positron emission tomography (PET) and radiophosphorous imaging after intravenous injection of either radiolabeled native ferritin (RadioCF), radiolabeled cationic ferritin (RadioCF), or Cu-64 alone. PET images are shown in mice 90 min after injection of RadioNF (n = 4; A and D), RadioCF (n = 4; B and E), or Cu-64 (n = 4; C and F). Several organs were visible in PET images [kidney (K), liver (Lv), lung (Lu), and spleen (Sp)]. RadioCF uptake in the kidney was specific to the renal cortex, whereas uptake of RadioNF and Cu-64 in the kidney was lower and nonspecific. This was confirmed by radiophosporous imaging of 20-µm frozen tissue sections from the same animals. Representative images from each cohort are shown in G–I. Only RadioCF was specifically bound to the kidney cortex. Dynamic PET time-activity curves were analyzed in regions of interest (ROIs). Time-activity curves from ROIs taken from the aorta near the renal arteries (J) and in the kidney cortex (K) are shown for RadioNF, RadioCF, and Cu-64. Standardize uptake value (SUV) was calculated in PET images. In only RadioCF, SUV remained elevated after the initial peak. SEs are shown (gray highlight). CT, computed tomography; n , number of animals.
Autoradiography confirmed the binding of the RadioCF, but not RadioNF or Cu-64, to the kidney cortex, as shown in Fig. 2, G–I. The distribution of radiation in the cortex was consistent with retention of RadioCF but not RadioNF or Cu-64 in glomeruli (Fig. 1, F and I).
The time-activity curve of RadioCF uptake was examined using ROI analysis in segmented regions of the aorta (blood pool) near the renal arteries and kidney cortex of both kidneys in PET images. The average time-activity curve was calculated for each cohort and for each of these ROIs, as shown in Fig. 2, J–K. After injection of RadioCF, RadioNF, or Cu-64, the SUV rose rapidly. After injection of RadioCF only, the SUV remained elevated in the cortex for the remainder of the study, whereas the SUV from both RadioNF and Cu-64 returned to near baseline, consistent with the specific retention of the RadioCF in the cortex.
The biodistributions of RadioCF, RadioNF, and Cu-64 were assessed in each organ as percent of injected dose per gram (%ID/g) of tissue or percent-injected dose per organ (%ID/organ). These data are shown in Fig. 3 for the kidney, liver, spleen, lung, intestine, and blood, with statistically significant (P < 0.05) and highly statistically significant (P < 0.01) differences indicated in each organ. In the kidney, RadioCF was ∼100% higher per gram and per organ than RadioNF or Cu-64. In the lung and spleen, RadioCF was also detected in higher concentrations than both RadioNF and Cu-64, consistent with PET. RadioNF concentration was significantly higher in liver and blood compared to RadioCF (pLiver < 0.05, pBlood < 0.01). These data were consistent with the longer blood residence time of RadioNF observed in mean time-activity curve taken from the aorta in PET (Fig. 2J).
Figure 3.

Biodistribution of radiolabeled native ferritin (RadioCF), radiolabeled cationic ferritin (RadioCF), and Cu-64 in major tissues 90 min after intravenous injection. The percent injected dose (%ID) was calculated. A Student’s t test was performed comparing RadioNF, RadioCF, and Cu-64. *Significant difference between values (P < 0.05); **highly significant difference (P < 0.01). Uptake was significantly elevated in the kidney only in mice that received RadioCF compared with RadioNF or Cu-64. Error bars show SDs.
Detection of Nephron Loss in the Os/+ Mouse Model with RadioCF-PET
We investigated whether RadioCF-PET could distinguish healthy (WT) and Os/+ mice with reduced nephron number (Fig. 4). The right kidney in each animal was used for analysis in PET to avoid overlap from the liver. Stereology was performed on the same kidney for direct comparison with RadioCF-PET. We examined total cortical uptake of CF, accounting for the difference in kidney size between the WT and Os/+ mice (14). Os/+ mice had kidney weights that were 46% lower, Nglom that was 62% lower, and a mean glomerular density in the cortex that was 35% lower than in WT mice. The difference in kidney size was apparent in both PET images in vivo and radiophosporous imaging of tissue sections. Glomerular number was measured through stereology in a subset of animals from both cohorts to confirm the difference in glomerular number. Glomerular density was then calculated from stereology. Mean Nglom in male WT and male Os/+ mice were 14,316 ± 563 and 5,372 ± 188, respectively. Mean glomerular density in male WT and male Os/+ mice were 106.4 ± 31.1/mm3 and 68.7 ± 9.7/mm3, respectively. Values for Nglom and glomerular density in a single WT female were 14,941 and 141.6/mm3, respectively.
Figure 4.

Radiolabeled cationic ferritin (RadioCF)-positron emission tomography (PET) in healthy mice and in a mouse model of reduced nephron mass. A and B: healthy wild-type (WT) mice (n = 4) and mice with oligosyndactylism (Os/+; n = 3), a model of reduced nephron mass, received RadioCF and were imaged with PET. Images were then overlain on computed tomography (CT). Only the cortex within the kidney was visible in both WT and Os/+ mice. C and D: autoradiography showing 10% lower pixel-average intensity in Os/+ kidney sections compared with controls. E: PET time-activity curves from the segmented kidney cortex were fitted to a biexponential model. WT mice exhibited a larger peak standardized uptake value (SUV) and SUV at 90 min compared with Os/+ mice, consistent with the increase in average intensity per pixel in autoradiography images in WT mice. *Significant difference (P < 0.05, Student’s t test). SEs are reported (gray highlight). F: there was a significant difference in the percent injected dose (%ID)/organ between WT and Os/+ mice from biodistribution studies using radiophosphorous imaging. SDs are shown. G: percent difference of peak SUV and SUV at 90 min was correlated with glomerular density (n = 4) calculated from stereology. MRI, magnetic resonance imaging; n, number of animals.
The time-activity curve for each voxel in segmented cortex was fitted to a biexponential curve in WT and Os/+ mice. RadioCF accumulated in the cortex in both strains, as shown at 90 min in Fig. 4, A–B. Average R2 for fitting was 0.83. Differences in all fitted parameters between WT and Os/+ cohorts were highly statistically significant (P < 0.01) except C3, representing the decay rate after peak, which was still statistically significant (P < 0.05). The average values of fitted parameters C2, C3, C4, and C5 were all higher in the WT cohort compared with Os/+ (WT: C2 = 1.20, C3 = 1.23, C4 = 0.06, C5 = 1.62 and Os/+: C2 = 0.84, C3 = 1.04, C4 = 0.05, C5 = 1.03). Average C1, a scaling constant, was the only parameter to decrease in WT compared with Os/+ (WT: C1 = −2.72 and Os/+: C1 = −3.79). The key difference between the WT and Os/+ mice was the total accumulation of RadioCF in the cortex measured by the significant difference in peak SUV, as shown in Fig. 4E. Peak SUV in the cortex was 18% higher in the WT mice, and SUV at 90 min was 21% higher in WT mice, consistent with the higher glomerular density in this strain. Using only male mice, we calculated the percent difference in the SUV value at profile peak from SUV at 90 min and correlated the percent difference with glomerular density from stereology (R2 = 0.98, n = 4).
In autoradiography, WT mouse kidneys had a 13% higher activity-per-voxel compared with Os/+ mouse kidneys, on average, consistent with a higher retention of RadioCF compared with Os/+ mouse kidneys (Fig. 4, C and D). Percent injected dose (%ID) per gram was not significantly different between WT and Os/+ mice in the kidney and was 14% lower in the liver in Os/+ mice. %ID/organ was significantly lower by 38% in Os/+ kidneys (Fig. 4F). There were no other statistically significant differences in RadioCF biodistribution between the two strains.
PET Imaging of a Human Transplant Kidney
We applied RadioCF-PET to image a donated human kidney. The kidney was obtained from a 75-yr-old Caucasian female who had no history of diabetes. It was not known if she had hypertension. Peak values of creatine, blood urea nitrogen, and albumin were 33 mg/dL, 1.7 mg/dL, and 4.9 g/dL, respectively. The kidney was injected with RadioCF to label glomeruli for imaging with PET, followed by commercial CF for CFE-MRI.
Three dimensional images of the kidney acquired from PET, CT, and MRI were colocalized (Fig. 5, A–G). RadioCF-PET was compared with CFE-MRI (15), as shown in Fig. 5, H–I. Glomerular number measured with CFE-MRI was 0.47 × 10⁶. PET enhancement corresponded to the same regions where glomeruli were visible in CFE-MRI. Total SUV in each ROI was strongly correlated with Nglom in each ROI (R2 = 0.78, Fig. 5J).
Figure 5.
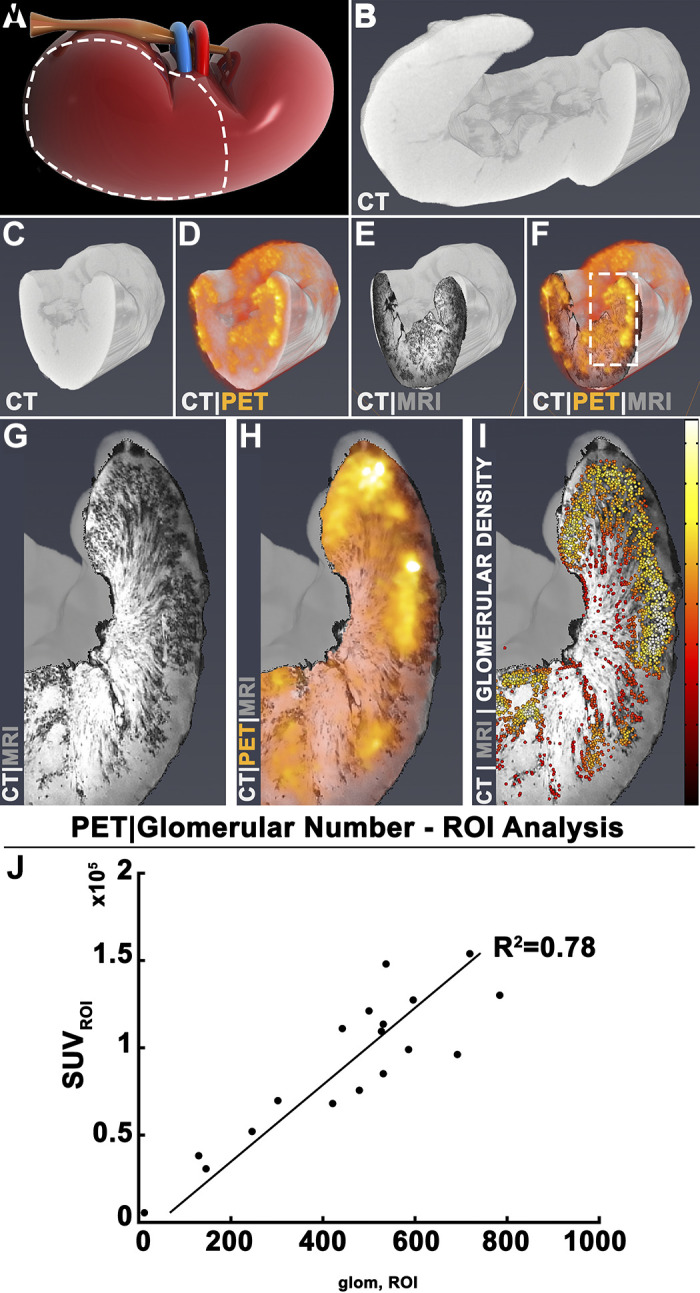
Radiolabeled cationic ferritin (RadioCF)-positron emission tomography (PET) to measure nephron mass in a perfused human kidney. A–D: a human kidney, rejected for transplantation and consented for research, received RadioCF and was imaged with PET, shown overlain on X-ray-computed tomography (CT) images for localization. E: cationic ferritin enhanced magnetic resonance imaging (CFE-MRI) of the same kidney. F: three-dimensional images were coregistered. G and H: RadioCF-PET revealed RadioCF accumulation in the kidney cortex, which was also labeled by CFE-MRI. I: glomerular number (Nglom) and density were measured from CFE-MRI. Color bar scale = 0–20 mm−3. Randomly chosen regions of interest (ROIs) were selected from RadioCF-PET images and three-dimensional maps of glomeruli from CFE-MRI. J: the total standardized uptake value (SUV) in each ROI was plotted against total Nglom in the same ROIs.
DISCUSSION
This work demonstrates the synthesis and use of RadioCF, a glomerulus-targeted contrast agent for PET. To our knowledge, this is the first report of a targeted PET tracer to detect nephron mass. Intravenously injected RadioCF selectively accumulated in the renal cortex of healthy mice, but not in controls injected with RadioNF or Cu-64. MRI confirmed that RadioCF bound to the glomeruli. The measured amount of RadioCF in the kidney cortex of Os/+ mice was lower than in WT mice. The average SUV at 90 min was 21% lower in Os/+ mice than in WT mice, consistent with lower nephron mass and nephron density in the Os/+ mice. We observed a strong correlation between glomerular density with the percent difference of peak SUV and SUV at 90 min, in both WT and Os/+ mice. However, %ID/gram measured by autoradiography was not significantly different between WT and Os/+ mice. This is likely because glomeruli occupy only a small fraction of the whole kidney; %ID/gram is measured by total radiation per kidney weight, whereas PET was measured in voxels within cortex. Finally, RadioCF accumulation detected by PET was highly correlated with Nglom measured by CFE-MRI in a human kidney.
The ferritin protein has several features that may be advantageous for use as a kidney-targeted imaging agent in humans. It is water soluble, readily functionalized, and contains a core size of ∼7 nm that allows the deposition of metals and other compounds (24, 37). The 13 nm outer diameter of ferritin allows it to traverse the glomerular endothelial fenestrae, and a simple modification of the surface causes the ferritin to bind transiently to anionic molecules, such as proteoglycans, within the GBM.
An advantage of PET over MRI is its sensitivity, allowing detection in trace concentrations. CFE-MRI, like RadioCF-PET, detects perfused or functional glomeruli and maps the intrarenal distribution of glomeruli throughout the kidney. CFE-MRI will remain a valuable preclinical tool for the study of kidney disease and as an important tool to validate RadioCF-PET. RadioCF-PET is more expensive than CFE-MRI for the studies performed in this work. We envision RadioCF-PET primarily as a translatable tool for future clinical use, but it will likely have preclinical applications. For example, RadioCF-PET could be used to monitor kidney function in response to new therapies as a component of both preclinical testing and a final clinical application. There may also be preclinical models, particularly in larger animals, for which RadioCF-PET would be more cost-effective than CFE-MRI due to the significantly lower required dose of the radiotracer.
This study has several limitations. First, we did not investigate the effect of glomerular volume on RadioCF uptake. Second, PET signal bleed through from nearby organs and the lack of the clear interorgan contrast in both CT and PET images can make consistent imaging of both kidneys difficult in small animals. Third, we have not yet established RadioCF-PET to measure nephron mass in the presence of pathology. We have previously observed diffuse labeling of CF during CFE-MRI of a human kidney with a similar KDPI (KDPI = 93) to that used here (15). Pathology, including focal and segmental glomerulosclerosis and vascular sclerosis, can cause diffuse rather than punctate labeling by CF (15, 26). Fourth, a comprehensive toxicology study has not been performed for RadioCF. The radiation dose used here was ∼1% of typical agent (e.g., [18F]fluorodeoxyglucose) doses currently used in whole body human PET scans (38). We have previously investigated CF biodistribution and biocompatibility in rodents using MRI-detectable doses of 5.75 mg/100 g and observed minimal toxicity (22, 23, 26). Serum biomarkers of injury did not differ significantly from controls in acute (1.5 h after CF injection) or subacute studies (1 and 2 wk after CF injection) (22). In a dedicated toxicity study performed by our group in 2016, adult male mice that received normal- or high-dose CF had a mild, but transient weight loss with a mild inflammatory response that was abrogated by the administration of hydrocortisone before CF (23). CF did not appear to be nephrotoxic, hepatotoxic, or cause iron toxicity (17, 23). Biodistribution studies have shown that most intravenously injected CF accumulates in the liver, spleen, and kidney and takes more than a day to clear (22). Toxicity studies have also demonstrated that CF does not appear to cause nephrotoxicity or hepatotoxicity in a mouse model of CKD. RadioCF is likely to be safe in humans; we have observed only minimal, transient, and treatable inflammatory effects of much higher doses of CF used for MRI, and RadioCF-PET requires trace doses of RadioCF. In addition, we have begun to develop a human recombinant form of CF and RadioCF, which may overcome any inflammatory effects of the horse-based RadioCF. Future work will focus on optimizing synthesis of RadioCF for stability in solution, specific activity, and dosing, to prepare RadioCF for clinical use.
In summary, we have developed and applied a targeted contrast agent, RadioCF, to map nephron mass in the kidney in vivo using PET. This work provides a foundation for the direct measurement of nephron mass as a potential clinical marker of kidney health.
GRANTS
This work was supported by Washington University MIR Departmental Funding. This work was also supported by National Institutes of Health (NIH) Grants R01DK110622 (to K.M.B. and J.R.C.) and R01DK111861 (to K.M.B. and J.R.C.). E.J.B. is supported by NIH Grant TL1TR002344.
DISCLAIMERS
The content is solely the responsibility of the authors and does not necessarily represent the official views of the National Institutes of Health.
DISCLOSURES
J.R.C. and K.M.B. are co-owners of Sindri Technologies, LLC. K.M.B and E.J.B. are co-owners of XN Biotechnologies, LLC. K.M.B. has a research agreement with Janssen Pharmaceuticals.
AUTHOR CONTRIBUTIONS
E.J.B., S.C.B., and K.M.B. conceived and designed research; E.J.B., D.R., N.F., A.K., and K.M.B. performed experiments; E.J.B., D.R. and L.S. analyzed data; E.J.B., D.R., K.I.S., A.K., and K.M.B. interpreted results of experiments; E.J.B. prepared figures; E.J.B., D.R., L.S., N.F., and K.M.B. drafted manuscript; E.J.B., D.R., K.I.S., S.C.B., J.R.C., A.K., and K.M.B. edited and revised manuscript; E.J.B., D.R., K.I.S., S.C.B., J.R.C., L.S., N.F., A.K., and K.M.B. approved final version of manuscript.
ACKNOWLEDGMENTS
We gratefully acknowledge the Preclinical Imaging Facility and Biomedical Magnetic Resonance Laboratory at Washington University as well as the Nano Research Facility, Jens Molecular and Nanoscale Analysis Laboratory, and S. Chavalmane at Washington University for contrast agent characterization. We also acknowledge the Washington University Center for Cellular Imaging, G. Stout for electron microscopy, and Dr. M. Schuelke and the Washington University’s Division of Biostatistics for statistical analysis. We thank K. DeRonde at the University of Virginia for the assistance with histology.
REFERENCES
- 1.Centers for Disease Control. Chronic Kidney Disease in the United States, 2019. Atlanta, GA: US Department of Health and Human Services, Centers for Disease Control and Prevention, 2019. [Google Scholar]
- 2.Denic A, Lieske JC, Chakkera HA, Poggio ED, Alexander MP, Singh P, Kremers WK, Lerman LO, Rule AD. The substantial loss of nephrons in healthy human kidneys with aging. J Am Soc Nephrol 28: 313–320, 2017. doi: 10.1681/ASN.2016020154. [DOI] [PMC free article] [PubMed] [Google Scholar]
- 3.Imberti B, Pezzotta A, Perico L, Corna D, Rottoli D, Perico N, Zoja C, Remuzzi G, Benigni A, Morigi M. Decreased nephron number within physiologic ranges increases susceptibility to chronic renal diseases later in life. SSRN J, 2020. doi: 10.2139/ssrn.3514596 [DOI] [Google Scholar]
- 4.Bertram JF, Douglas-Denton RN, Diouf B, Hughson MD, Hoy WE. Human nephron number: implications for health and disease. Pediatr Nephrol 26: 1529–1533, 2011. doi: 10.1007/s00467-011-1843-8. [DOI] [PubMed] [Google Scholar]
- 5.Hoy WE, Hughson MD, Bertram JF, Douglas-Denton R, Amann K. Nephron number, hypertension, renal disease, and renal failure. J Am Soc Nephrol 16: 2557–2564, 2005. doi: 10.1681/ASN.2005020172. [DOI] [PubMed] [Google Scholar]
- 6.Luyckx VA, Brenner BM. The clinical importance of nephron mass. J Am Soc Nephrol 21: 898–910, 2010. doi: 10.1681/ASN.2009121248. [DOI] [PubMed] [Google Scholar]
- 7.Brenner BM, Garcia DL, Anderson S. Glomeruli and blood pressure. Less of one, more the other? Am J Hypertens 1: 335–347, 1988. doi: 10.1093/ajh/1.4.335. [DOI] [PubMed] [Google Scholar]
- 8.McArdle Z, Schreuder MF, Moritz KM, Denton KM, Singh RR. Physiology and pathophysiology of compensatory adaptations of a solitary functioning kidney. Front Physiol 11: 2188, 2020. doi: 10.3389/fphys.2020.00725. [DOI] [PMC free article] [PubMed] [Google Scholar]
- 9.Shea SM, Raskova J, Morrison AB. A stereologic study of glomerular hypertrophy in the subtotally nephrectomized rat. Am J Pathol 90: 201–210, 1978. [PMC free article] [PubMed] [Google Scholar]
- 10.Bertram JF. Analyzing Renal Glomeruli with the New Stereology. Elsevier, 1995, p. 111–172. [DOI] [PubMed] [Google Scholar]
- 11.Hoy WE, Douglas-Denton RN, Hughson MD, Cass A, Johnson K, Bertram JF. A stereological study of glomerular number and volume: preliminary findings in a multiracial study of kidneys at autopsy. Kidney Int Suppl 63: S31–S37, 2003. doi: 10.1046/j.1523-1755.63.s83.8.x. [DOI] [PubMed] [Google Scholar]
- 12.Sasaki T, Tsuboi N, Okabayashi Y, Haruhara K, Kanzaki G, Koike K, Kobayashi A, Yamamoto I, Takahashi S, Ninomiya T, Shimizu A, Rule AD, Bertram JF, Yokoo T. Estimation of nephron number in living humans by combining unenhanced computed tomography with biopsy-based stereology. Sci Rep 9: 14400, 2019. doi: 10.1038/s41598-019-50529-x. [DOI] [PMC free article] [PubMed] [Google Scholar]
- 13.Denic A, Mathew J, Lerman LO, Lieske JC, Larson JJ, Alexander MP, Poggio E, Glassock RJ, Rule AD. Single-nephron glomerular filtration rate in healthy adults. N Engl J Med 376: 2349–2357, 2017. doi: 10.1056/NEJMoa1614329. [DOI] [PMC free article] [PubMed] [Google Scholar]
- 14.Baldelomar EJ, Charlton JR, Beeman SC, Hann BD, Cullen-McEwen L, Pearl VM, Bertram JF, Wu T, Zhang M, Bennett KM. Phenotyping by magnetic resonance imaging nondestructively measures glomerular number and volume distribution in mice with and without nephron reduction. Kidney Int 89: 498–505, 2016. [Erratum in Kidney Int 89: 1166–1167, 2016]. doi: 10.1038/ki.2015.316. [DOI] [PMC free article] [PubMed] [Google Scholar]
- 15.Beeman SC, Cullen-McEwen LA, Puelles VG, Zhang M, Wu T, Baldelomar E, Dowling J, Charlton JR, Forbes MS, Ng A, Wu QZ, Armitage JA, Egan GF, Bertram JF, Bennett KM. MRI-based glomerular morphology and pathology in whole human kidneys. Am J Physiol Renal Physiol 306: F1381–F1390, 2014. doi: 10.1152/ajprenal.00092.2014. [DOI] [PMC free article] [PubMed] [Google Scholar]
- 16.Beeman SC, Zhang M, Gubhaju L, Wu T, Bertram JF, Frakes DH, Cherry BR, Bennett KM. Measuring glomerular number and size in perfused kidneys using MRI. Am J Physiol Renal Physiol 300: F1454–F1457, 2011. doi: 10.1152/ajprenal.00044.2011. [DOI] [PubMed] [Google Scholar]
- 17.Charlton JR, Baldelomar EJ, deRonde KA, Cathro HP, Charlton NP, Criswell SJ, Hyatt DM, Nam S, Pearl V, Bennett KM. Nephron loss detected by MRI following neonatal acute kidney injury in rabbits. Pediatr Res 87: 1185–1192, 2019. doi: 10.1038/s41390-019-0684-1 [DOI] [PMC free article] [PubMed] [Google Scholar]
- 18.Baldelomar EJ, Charlton JR, Beeman SC, Bennett KM. Measuring rat kidney glomerular number and size in vivo with MRI. Am J Physiol Renal Physiol 314: F399–F406, 2018. doi: 10.1152/ajprenal.00399.2017. [DOI] [PMC free article] [PubMed] [Google Scholar]
- 19.Baldelomar EJ, Charlton JR, deRonde KA, Bennett KM. In vivo measurements of kidney glomerular number and size in healthy and Os(/+) mice using MRI. Am J Physiol Renal Physiol 317: F865–F873, 2019. doi: 10.1152/ajprenal.00078.2019. [DOI] [PMC free article] [PubMed] [Google Scholar]
- 20.Parvin N, Charlton JR, Baldelomar EJ, Derakhshan J, Bennett KM. Mapping vascular and glomerular pathology in a rabbit model of acute kidney injury using MRI. Anat Rec 303: 2716–2728, 2020. doi: 10.1002/ar.24419. [DOI] [PMC free article] [PubMed] [Google Scholar]
- 21.Xie L, Bennett KM, Liu C, Johnson GA, Zhang JL, Lee VS. MRI tools for assessment of microstructure and nephron function of the kidney. Am J PRenal Physiol 311: F1109–F1124, 2016. doi: 10.1152/ajprenal.00134.2016. [DOI] [PMC free article] [PubMed] [Google Scholar]
- 22.Beeman SC, Georges JF, Bennett KM. Toxicity, biodistribution, and ex vivo MRI detection of intravenously injected cationized ferritin. Magn Reson Med 69: 853–861, 2013. doi: 10.1002/mrm.24301. [DOI] [PubMed] [Google Scholar]
- 23.Charlton JR, Pearl VM, Denotti AR, Lee JB, Swaminathan S, Scindia YM, Charlton NP, Baldelomar EJ, Beeman SC, Bennett KM. Biocompatibility of ferritin-based nanoparticles as targeted MRI contrast agents. Nanomedicine 12: 1735–1745, 2016. doi: 10.1016/j.nano.2016.03.007. [DOI] [PMC free article] [PubMed] [Google Scholar]
- 24.Clavijo Jordan V, Caplan MR, Bennett KM. Simplified synthesis and relaxometry of magnetoferritin for magnetic resonance imaging. Magn Reson Med 64: 1260–1266, 2010. doi: 10.1002/mrm.22526. [DOI] [PubMed] [Google Scholar]
- 25.Macara IG, Hoy TG, Harrison PM. The formation of ferritin from apoferritin. Kinetics and mechanism of iron uptake. Biochem J 126: 151–162, 1972. doi: 10.1042/bj1260151. [DOI] [PMC free article] [PubMed] [Google Scholar]
- 26.Bennett KM, Zhou H, Sumner JP, Dodd SJ, Bouraoud N, Doi K, Star RA, Koretsky AP. MRI of the basement membrane using charged nanoparticles as contrast agents. Magn Reson Med 60: 564–574, 2008. doi: 10.1002/mrm.21684. [DOI] [PMC free article] [PubMed] [Google Scholar]
- 27.Zalups RK. The OS/+ mouse:a genetic animal model of reduced renal mass. Am J Physiol Renal Physiol 264: F53–F60, 1993. doi: 10.1152/ajprenal.1993.264.1.F53. [DOI] [PubMed] [Google Scholar]
- 28.Schipper MJ, Koral KF, Avram AM, Kaminski MS, Dewaraja YK. Prediction of therapy tumor-absorbed dose estimates in I-131 radioimmunotherapy using tracer data via a mixed-model fit to time activity. Cancer Biother Radiopharm 27: 403–411, 2012. doi: 10.1089/cbr.2011.1053. [DOI] [PMC free article] [PubMed] [Google Scholar]
- 29.Weibel ER, Gomez DM. A principle for counting tissue structures on random sections. J Appl Physiol 17: 343–348, 1962. doi: 10.1152/jappl.1962.17.2.343. [DOI] [PubMed] [Google Scholar]
- 30.Weibel ER. Stereological methods, Vol 1. Practical Methods for Biological Morphometry. London: Academic Press, 1979. [Google Scholar]
- 31.Weibel ER. Stereological methods, Vol 2. Theoretical Foundations. London: Academic Press, 1979. [Google Scholar]
- 32.Zhong J, Perrien DS, Yang H-C, Kon V, Fogo AB, Ichikawa I, Ma J. Maturational regression of glomeruli determines the nephron population in normal mice. Pediatr Res 72: 241–248, 2012. doi: 10.1038/pr.2012.81. [DOI] [PMC free article] [PubMed] [Google Scholar]
- 33.Schindelin J, Arganda-Carreras I, Frise E, Kaynig V, Longair M, Pietzsch T, Preibisch S, Rueden C, Saalfeld S, Schmid B, Tinevez J-Y, White DJ, Hartenstein V, Eliceiri K, Tomancak P, Cardona A. Fiji: an open-source platform for biological-image analysis. Nat Methods 9: 676–682, 2012. doi: 10.1038/nmeth.2019. [DOI] [PMC free article] [PubMed] [Google Scholar]
- 34.Amann K, Nichols C, Tornig J, Schwarz U, Zeier M, Mall G, Ritz E. Effect of ramipril, nifedipine, and moxonidine on glomerular morphology and podocyte structure in experimental renal failure. Nephrol Dial Transplant 11: 1003–1011, 1996. doi: 10.1093/oxfordjournals.ndt.a027447. [DOI] [PubMed] [Google Scholar]
- 35.Haas CS, Amann K, Schittny J, Blaser B, Müller U, Hartner A. Glomerular and renal vascular structural changes in alpha8 integrin-deficient mice. J Am Soc Nephrol 14: 2288–2296, 2003. doi: 10.1097/01.ASN.0000082999.46030.FE. [DOI] [PubMed] [Google Scholar]
- 36.Beeman SC, Mandarino LJ, Georges JF, Bennett KM. Cationized ferritin as a magnetic resonance imaging probe to detect microstructural changes in a rat model of non-alcoholic steatohepatitis. Magn Reson Med 70: 1728–1738, 2013. doi: 10.1002/mrm.24619. [DOI] [PMC free article] [PubMed] [Google Scholar]
- 37.Clavijo Jordan MV, Beeman SC, Baldelomar EJ, Bennett KM. Disruptive chemical doping in a ferritin-based iron oxide nanoparticle to decrease r2and enhance detection with T1-weighted MRI. Contrast Media Mol Imaging 9: 323–332, 2014. doi: 10.1002/cmmi.1578. [DOI] [PMC free article] [PubMed] [Google Scholar]
- 38.Karakatsanis NA, Fokou E, Tsoumpas C. Dosage optimization in positron emission tomography: state-of-the-art methods and future prospects. Am J Nucl Med Mol Imaging 5: 527–547, 2015. [PMC free article] [PubMed] [Google Scholar]