Glycolysis is an ancient pathway that evolved well before oxygen was present in the Earth's atmosphere and is highly conserved among living organisms. Glycolysis was the first metabolic pathway elucidated and is also referred to as the Embden–Meyerhof–Parnas pathway (see Box 1). The word “glycolysis” is derived from the Greek “glykys,” meaning “sweet,” and “lysis,” which means “to split.” This refers to the splitting of one glucose molecule into two molecules of pyruvate, the end product of glycolysis. In the presence of oxygen, pyruvate usually enters the mitochondria where it is oxidized to acetyl-CoA, whereas in the absence of oxygen, pyruvate is reduced into lactate. Glycolysis involves 10 reactions that take place in the cytosol and generates two ATP molecules without the requirement of molecular oxygen. In contrast, oxidative phosphorylation in the mitochondria generates 30 ATP molecules but requires oxygen (see Chandel 2020a). Multiple simple sugars can enter glycolysis, including the monosaccharides glucose, galactose, and fructose. Most of us ingest these simple sugars through consumption of products that contain the disaccharides sucrose (table sugar) or lactose (milk sugar). Sucrose is composed of one molecule of glucose and fructose, whereas lactose contains one molecule of glucose and galactose. The digestive enzymes sucrase and lactase break down sucrose and lactose into simple sugars.
The overall reaction of glycolysis is exergonic (ΔG = −96 kJ/mol in erythrocytes):
BOX 1.
OTTO FRITZ MEYERHOF AND ENERGY TRANSFORMATION IN THE CELL
Archibald Vivian Hill described Otto Fritz Meyerhof (1884–1951) as “…always been betwixt and between: a physiological chemist or a chemical physiologist, perhaps we should call him a ‘chemiologist’.” These characteristics are precisely what enabled Meyerhof and his coworkers to dissect the glycolysis pathway. Meyerhof had won the 1922 Nobel Prize in Physiology or Medicine (awarded in 1923 because of a quirk of Alfred Nobel's will) “for his discovery of the fixed relationship between the consumption of oxygen and the metabolism of lactic acid in the muscle” with Hill “for his discovery relating to the production of heat in the muscle.” Meyerhof initially thought he would pursue psychiatry and philosophy, but in 1909 he crossed paths with Otto Warburg, who persuaded him to study physiology. Early in his career, Meyerhof believed that the laws of physics and chemistry should apply to living organisms, and in 1913 he lectured on a theory of the thermodynamics of living matter—“The Energetics of Cell Processes.” In the late 1920s through the 1930s at the Institute of Physiology of the Kaiser Wilhelm Institute of Medical Research in Heidelberg, Meyerhof put together several key discoveries, including Gustav Embden's isolation of AMP and his outline of the glycolysis pathway (just before his death), Jakub Parnas's work on phosphorolysis, and Karl Lohman's discovery of ATP, and combined them with precise laboratory work to dissect and rebuild the glycolysis pathway and identify one-third of the enzymes involved. By identifying these intermediate reactions and showing the series of transformations that make energy available to the cell, Meyerhof answered the questions posed in his 1913 lecture about how energy transformations and chemical changes affect the function of cells. He later confirmed that the glycolysis pathway in muscle and yeast was the same, thus showing it to be an essential pathway in living organisms. That Meyerhof was much respected as a mentor and investigator is reflected in the “who's who” of researchers who passed through his laboratories in Germany—among them, David Nachmansohn, Severo Ochoa, Fritz Lipmann, George Wald, Andre Lwoff, Fritz Haber, and Otto Kahn.
THERE ARE THREE MAJOR FEATURES OF GLYCOLYSIS
It is the only pathway that can generate ATP in the absence of oxygen (anaerobic conditions) or in cells lacking mitochondria, such as red blood cells (erthyrocytes). In these scenarios, pyruvate is converted into lactate.
In the presence of oxygen, glycolysis generates pyruvate, which enters the TCA cycle (also called the citric acid cycle and the Krebs cycle) located within mitochondria to produce ATP.
Many of the metabolites of glycolysis and the TCA cycle can also enter anabolic pathways that generate NADPH and the building blocks needed for generation of glycogen, lipid, nucleotide, and protein synthesis. The biosynthetic pathways that glycolytic intermediates funnel into include the pentose phosphate, the hexosamine, and the serine and glycerol biosynthetic pathways.
QUICK GUIDE TO THE ENERGY-GENERATING CAPACITY OF GLYCOLYSIS (FIG. 1)
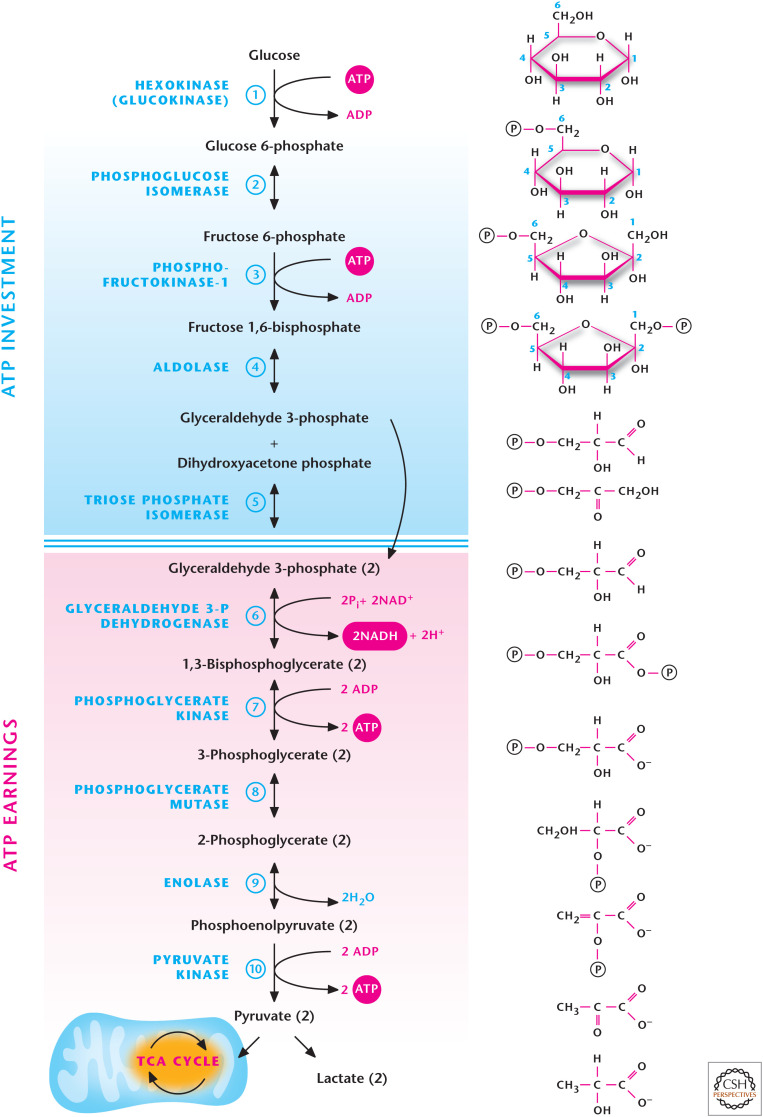
Figure 1.
The 10 steps of glycolysis.
Glycolysis takes place in the cytosol and does not require oxygen to generate ATP. Note that there is no net loss of carbon or oxygen atoms in glycolysis.
The 10 enzymatic reactions can be divided into two phases: ATP investment (reactions 1–5) and ATP payoff (reactions 6–10).
Every one molecule of glucose entering glycolysis generates two molecules of glyceraldehyde 3-phosphate using two molecules of ATP during the ATP investment phase.
The two molecules of glyceraldehyde 3-phosphate are metabolized into two molecules of pyruvate, generating four molecules of ATP during the ATP payoff phase.
ATP is generated by substrate-level phosphorylation (see below).
The net ATP generation is 2ATP: 4 (payoff phase) – 2 (investment phase).
Two molecules of NAD+ are reduced to NADH, generated during glycolysis.
Nine of the 10 glycolytic intermediates are phosphorylated metabolites, which cannot diffuse out of the cell because of their negative charge.
Glycolysis has three key regulatory steps (1, 3, and 10) catalyzed by hexokinase, phosphofructokinase, and pyruvate kinase. These have large negative ΔG values and are essential to drive the overall flux to pyruvate. These regulatory steps are essentially irreversible.
Pyruvate can either be converted to lactate or enter mitochondria to fuel the TCA cycle.
QUICK GUIDE TO BIOSYNTHETIC CAPACITY OF GLYCOLYTIC INTERMEDIATES (FIG. 2)
Figure 2.
Glycolytic intermediates funnel into biosynthetic pathways.
In addition to generating ATP, glycolytic intermediates can funnel into multiple biosynthetic pathways. Mitochondria provide the bulk of ATP in most cells when oxygen is abundant. Hence, the major function of glycolysis is to generate intermediates that fuel these biosynthetic pathways. In contrast, in the absence of oxygen, glycolysis's major role is to provide ATP for survival.
Glucose 6-phosphate can enter the pentose phosphate pathway, resulting in the generation of NADPH to maintain antioxidant capacity, and ribose, the backbone of nucleotides and, hence, DNA or RNA.
Glucose 6-phosphate can generate glycogen.
Fructose 6-phosphate can enter the hexosamine biosynthetic pathway to generate amino sugars used for synthesis of glycoproteins, glycolipids, and proteoglycans.
Dihydroxyacetone phosphate can be converted into glycerol 3-phosphate to generate lipids.
1,3-Bisphosphoglycerate generates 2,3-bisphosphoglycerate, an allosteric regulator of hemoglobin, in red blood cells.
3-Phosphoglycerate can be converted into serine, a precursor for synthesis of the amino acids cysteine and glycine.
Pyruvate can generate the amino acid alanine.
WHAT DRIVES THE 10 REACTIONS OF GLYCOLYSIS FORWARD?
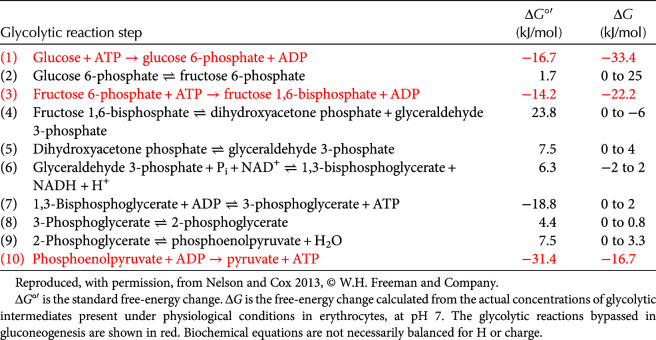
The directionality of reactions is governed by initial reactant (glucose), enzyme concentration, and activity, as well as the ΔG defined as ΔG°′ + RT ln([products]/[reactants]) (Chandel 2020b). Glucose concentration in the blood is typically ∼5 mm, which is at a higher concentration than the Km of basal glucose transporters and hexokinases (step 1 of glycolysis) in most cells. The Gibbs free energy, ΔG, has to be either negative or close to 0 if glycolysis is to proceed in the forward direction. The ΔG°′ and ΔG of all 10 reactions are provided in Table 1. ΔG calculations are based on the steady-state metabolite concentration of products and reactants of each reaction in red blood cells and, thus, are different than the ΔG°′. A careful examination of the table indicates that most of the reactions (2, 4, 5, 6, 7, 8, and 9) are near equilibrium because their ΔG is close to 0 (Table 1). This indicates that these reactions are reversible. In fact, these reactions do go in reverse during gluconeogenesis (the process of converting pyruvate back to glucose). The three irreversible reactions are reactions 1, 3, and 10 because they all have a large negative ΔG and are, thus, highly favorable.
Table 1.
Free-energy changes of glycolytic reactions in erythrocytes
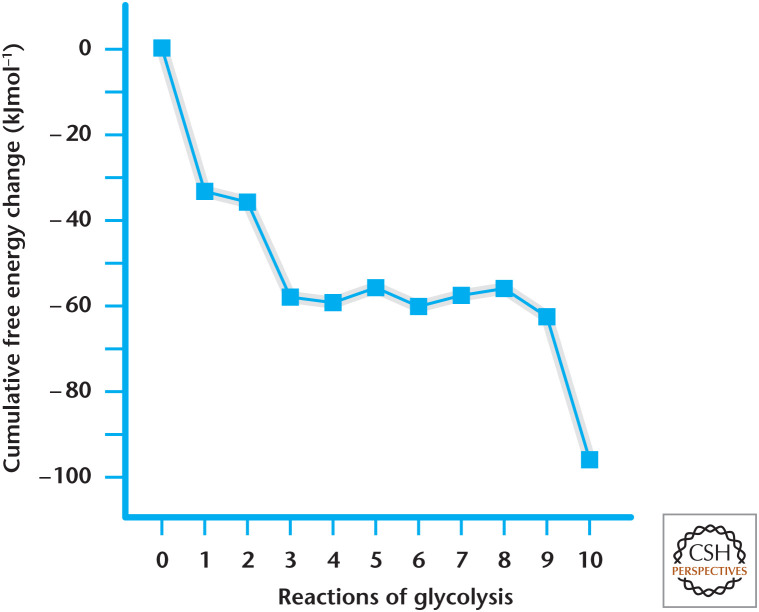
Note that there is a difference between ΔG°′ and ΔG primarily because ΔG reflects both the ΔG°′ and the ratio of products/reactants (see Chandel 2020b for a discussion of the law of mass action) (Fig. 3). The products of each reaction are quickly removed by the following reaction in glycolysis, thus keeping an overall favorable Gibbs free energy. For example, take a look at reaction 4, which requires a large positive ΔG°′ (+23.8) to drive the reaction forward, resulting in catalysis of a six-carbon fructose 1,6-bisphosphate into two three-carbon molecules, glyceraldehyde 3-phosphate and dihydroxyacetone phosphate. However, these three-carbon molecules are quickly removed by the subsequent reactions of glycolysis, ensuring a low ratio between the concentrations of product and reactants and a negative ΔG. In fact, we look at the cumulative free-energy change from each reaction, and then we arrive at a favorable overall Gibbs free-energy change for glycolysis at –96 kJ/mol in erythrocytes (Fig. 3).
Figure 3.
Gibbs free-energy change in 10 steps of glycolysis. The free-energy changes are based on Table 1. Note that the Gibbs free-energy changes in reactions 6–10 are multiplied by 2 because one molecule of glucose is converted into two molecules of glyceraldehyde 3-phosphate.
WHY USE ATP TO MAKE ATP?
A puzzling aspect of glycolysis is the use of 2ATP in the first phase (ATP investment) and the generation of 4ATP in the second phase (ATP payoff). Why consume 2ATP in the first place? There are two explanations. First, the phosphorylation of glucose using ATP makes the glycolytic intermediates into phosphorylated metabolites, which cannot diffuse out of the cell because of their negative charge. Second, the phosphorylated metabolites can be used for substrate-level phosphorylation, a process in which a phosphoryl (PO3) group is transferred from a phosphorylated metabolite, like 1,3-bisphosphoglycerate, to ADP to generate ATP. The generation of ATP requires +30.5ΔG°′ when bound to Mg2+ and has to be coupled to reactions that have a large negative ΔG°′. There are two glycolytic reactions that have a large negative ΔG°′ and are coupled to the generation of ATP. In step 7, the conversion of 2,3-bisphoshoglycerate to 2-phosphoglycerate has a ΔG°′ of –37.6 kJ/mol, and in step 10 the conversion of 2 phosphoenolpyruvate to 2 pyruvate has a ΔG°′ of –62.8 kJ/mol. To generate these three-carbon phosphate molecules from glucose, the first phase of glycolysis phosphorylates glucose using two ATP molecules and converts it from one six-carbon glucose molecule into two three-carbon glyceraldehyde 3-phosphate molecules. Subsequently, glyceraldehyde 3-phosphate dehydrogenase couples NAD+ reduction to NADH to the addition of inorganic phosphate to glyceraldehyde-3-phosphate, resulting in the generation of 1,3-bisphosphoglycerate, whereas subsequent reactions produce phosphoenolpyruvate.
In the presence of oxygen, NADH and pyruvate are transported into the mitochondria where ATP is generated, as discussed in the next section. It is important to note that under ample oxygen conditions, glycolysis serves to provide intermediates that can fuel the biosynthetic pathways in most cells. Glycolytic ATP generation is paramount when oxygen is limiting to the generation of mitochondrial-dependent ATP. There are exceptions, such as erythrocytes that contain no mitochondria or cells such as neutrophils and endothelial cells that contain few mitochondria. In these cases, the flux through glycolysis is high enough to sustain both ATP generation and fueling of the biosynthetic pathways.
WHAT HAPPENS TO THE NADH AND PYRUVATE GENERATED DURING GLYCOLYSIS?
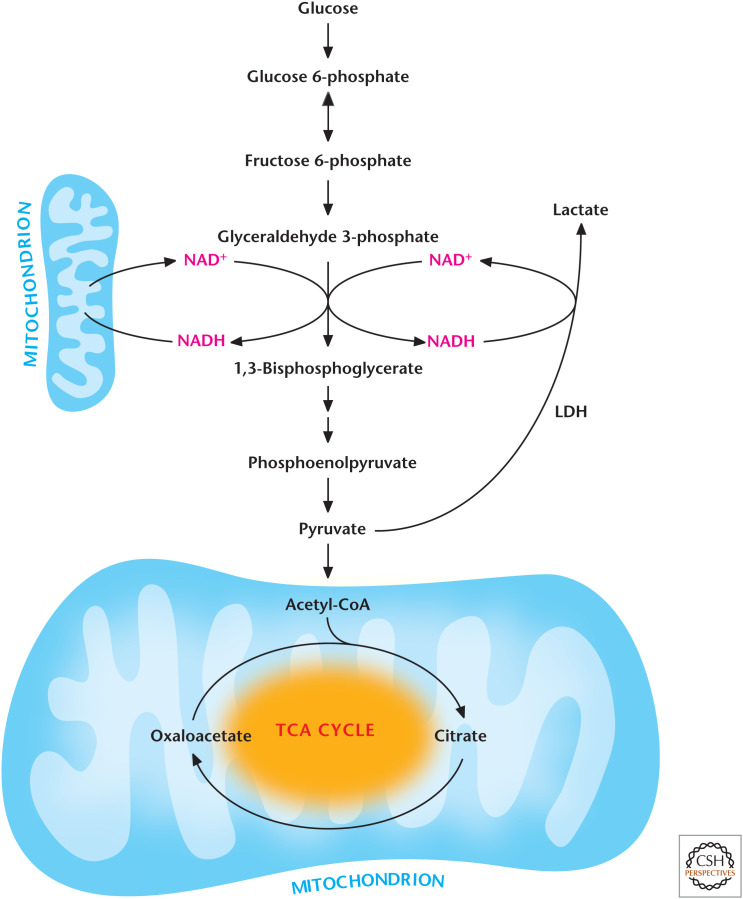
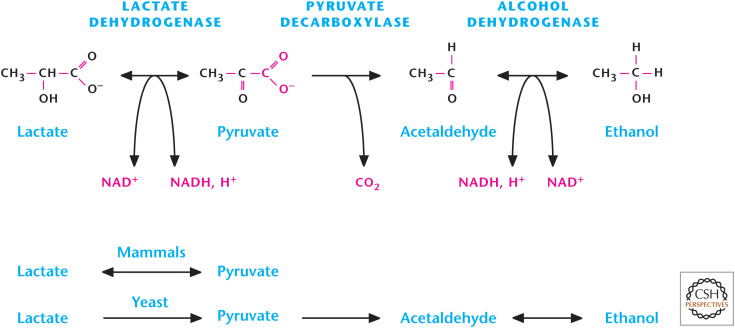
The fate of NADH and pyruvate is intimately linked. In the presence of ample oxygen, both pyruvate and NADH are transported into the mitochondria, where pyruvate enters the TCA cycle while NADH is oxidized to NAD+ by the electron transport chain (see Chandel 2020a) and transported back into the cytosol to promote glycolysis (Fig. 4). The transport of NADH and NAD+ in and out of mitochondria involves intricate shuttling mechanisms (Chandel 2020a), resulting in a slower regeneration of cellular NAD+ pools compared with the anaerobic mechanism in which lactate dehydrogenase (LDH) reduces pyruvate into lactate by coupling this reaction to NADH oxidation to NAD+. Many of us experience a buildup of lactate upon vigorous exercise. Under these conditions, oxygen cannot be delivered fast enough to muscle mitochondria to keep up with the high metabolic demands placed on muscle cells. In the absence of oxygen, the electron transport chain cannot regenerate NAD+, making the LDH reaction critical for NAD+ regeneration and continuous flux through glycolysis. This is sometimes referred to as anaerobic glycolysis or homolactic fermentation. The production of lactic acid is one form of fermentation using pyruvate. The other form of fermentation is the one most of us think of when we use yeast to make beer. This two-step process regenerates NAD+ with two essential products required for beer, CO2 and ethanol (Fig. 5). Yeast make greater amounts of ethanol through glucose consumption under anaerobic conditions compared with aerobic conditions, a phenomenon first observed by Louis Pasteur. This slowing down of fermentation in the presence of oxygen is referred to as the Pasteur effect. The opposite effect, in which the presence of high levels of glucose slows mitochondria from generating ATP under aerobic conditions, is called the Crabtree effect. Although the molecular details underlying the Pasteur and Crabtree effects are not fully understood, the short-term regulation of the Pasteur and Crabtree effects is controlled by metabolites regulating glycolytic enzymes (see the next section), whereas the long-term regulation is controlled by transcription factors regulating expression of glycolytic enzymes (Chandel 2020c).
Figure 4.
Regeneration of NAD+ by LDH or mitochondria.
Figure 5.
Fermentation in mammals and yeast.
WHAT ARE THE KEY STEPS OF REGULATION?
The three irreversible reactions of glycolysis catalyzed by hexokinase, phosphofructokinase-1, and pyruvate kinase are important regulatory nodes within the glycolytic pathway. There are multiple ways to elicit changes in the activity of these enzymes, including product inhibition, metabolites that act as allosteric modulators, signaling pathways that cause phosphorylation or acetylation of the enzymes, and changes in concentrations of these enzymes caused by transcriptional fluctuations. The metabolic hormones insulin and glucagon also regulate glucose-dependent metabolic pathways (see Chandel 2020c,d). For now, we will just discuss the allosteric regulation of the three irreversible reactions. Chandel (2020c) covers signaling pathways and transcriptional regulation of metabolic enzymes in more detail.
There are two reasons to have regulation of glycolytic enzymes. First, when there is ample ATP, the cell should not needlessly devote resources to manufacturing ATP. Second, glycolytic intermediates are also precursors to biosynthetic pathways. Thus, regulating glycolytic enzymes can balance between the energy-generating and the biosynthetic capacity of glycolytic intermediates. There are four hexokinases (HKI–IV) that catalyze step 1 of glycolysis. HKI, -II, and -III have a low Km (<0.5 mm) for glucose and are inhibited by glucose 6-phosphate, which accumulates if glycolysis is inhibited downstream from this reaction, a process referred to as feedback inhibition. This regulatory step ensures that glucose and ATP (in reactions 1 and 3) are not committed to glycolysis unless necessary. In contrast, hexokinase IV (also called glucokinase) has a high Km (6 mm) for glucose and is not inhibited by glucose 6-phosphate. Glucokinase has a higher Vmax compared with the other hexokinases. Mean blood glucose levels in nondiabetic humans are typically ∼5 mm, but can increase up to 8 mm after a carbohydrate-rich meal full of sugar molecules. Glucokinase, which is abundant in the liver, has a high Vmax and effectively removes excess glucose from blood to minimize hyperglycemia after eating. Because of glucokinase's high Km, its enzymatic activity diminishes once the blood sugar levels decrease to <6 mm.
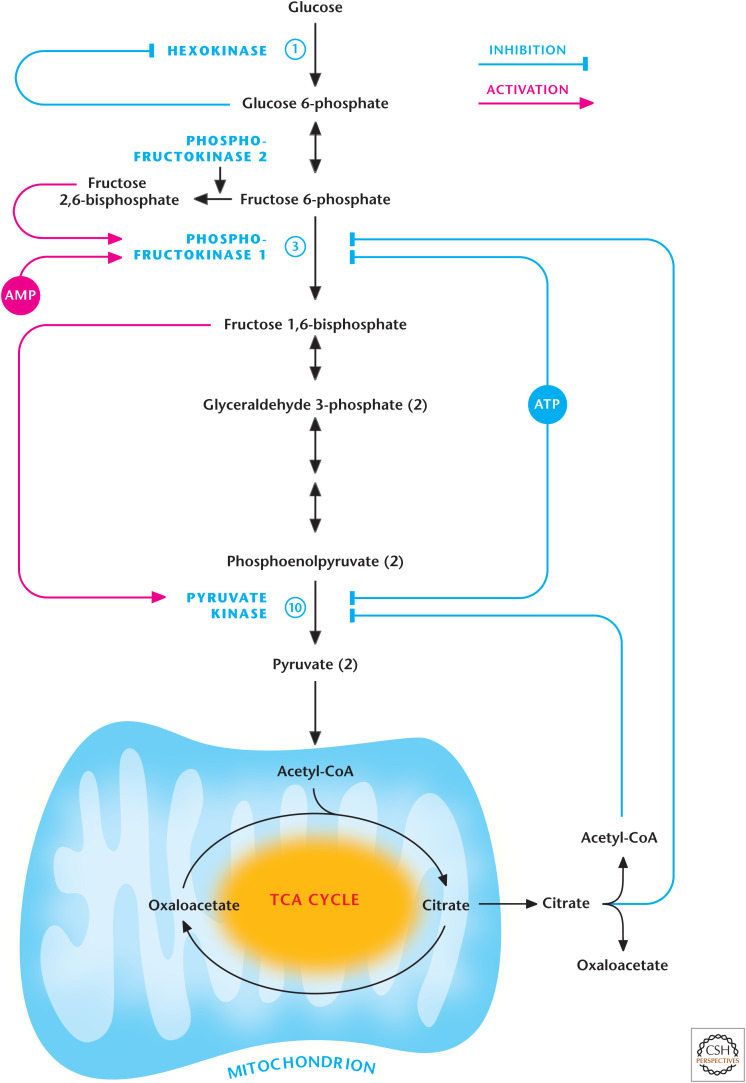
High levels of ATP allosterically inhibit reactions 3 and 10, which are catalyzed by phosphofructokinase-1 (PFK1) and pyruvate kinase, respectively (Fig. 6). In contrast, when cellular ATP usage increases, the resulting ADP is quickly converted into ATP and AMP by adenylate kinase, buffering against a dramatic decrease in ATP levels (see the discussion in Chandel 2020b about energy charge). AMP levels can increase drastically during high ATP usage. AMP overcomes the ATP inhibition of PFK1. Another powerful regulatory mechanism involves the activity of the enzyme phosphofructokinase-2, which produces fructose 2,6-bisphosphate from fructose 6-phosphate, an allosteric activator of PFK1. Fructose 2,6-bisphosphate decreases the inhibitory effects of ATP and inhibits fructose 1,6-bisphosphatase, an enzyme involved in gluconeogenesis that catalyzes the reversal of reaction 3. This ensures that glycolysis occurs over gluconeogenesis. The product of PFK1, fructose 1,6-bisphosphate, activates pyruvate kinase to ensure the concentration of metabolites is low between fructose 1,6-bisphosphate and pyruvate, thus making these reactions thermodynamically favorable in the forward direction. This is an example of a feed-forward activation mechanism; it coordinates the upstream and downstream reactions of glycolysis. TCA cycle intermediary metabolites can also regulate glycolysis. If the TCA cycle becomes saturated, the buildup of citrate and acetyl-CoA inhibit PFK1 and pyruvate kinase, respectively. This slows glycolysis to prevent further accumulation of pyruvate.
Figure 6.
Regulation of glycolysis by metabolites.
AEROBIC GLYCOLYSIS—THE WARBURG EFFECT—AND CANCER
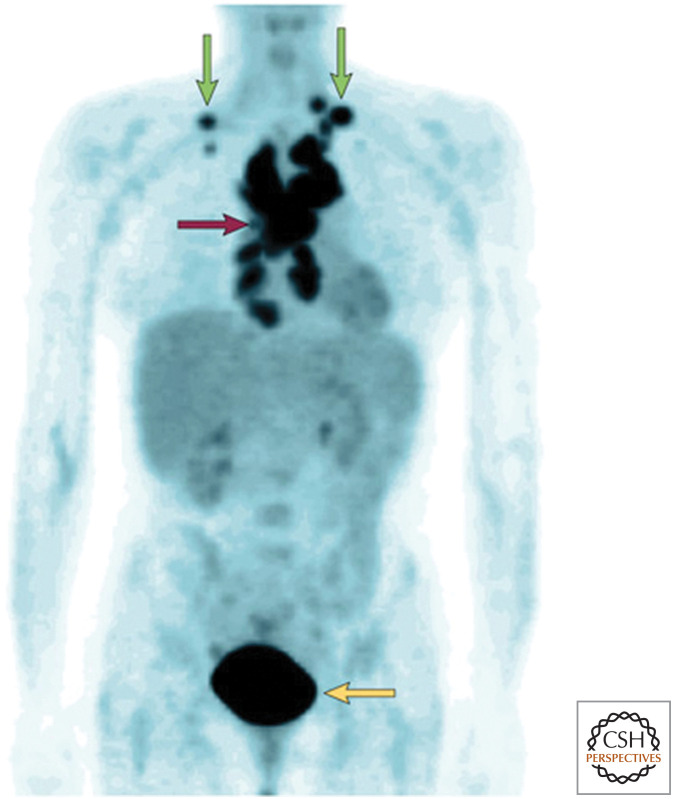
To appreciate the importance of glycolysis, let us briefly examine cancer cell metabolism, which currently is enjoying renewed interest. In the 1920s, Otto Warburg observed that tumor slices consume glucose and secrete lactate at a higher rate than normal tissue, even under aerobic conditions. This metabolic reprogramming, resulting in a high rate of aerobic glycolysis, is now known as the Warburg effect. Since this seminal finding, many reports have documented the Warburg effect in a variety of different tumors. In fact, the clinical application of positron emission tomography (PET), which uses a glucose analog to detect a significant increase in glucose uptake in tumors as compared with other tissue, is based on Warburg's initial observation (Fig. 7). But what accounts for this high rate of glucose metabolism? Initially, Warburg hypothesized that the increase in glycolysis under normal oxygen conditions arose from defects in mitochondrial function. This would shunt the majority of the pyruvate to lactate under aerobic conditions. However, subsequent studies showed that the majority of cancer cells have functional mitochondrial metabolism. Furthermore, many highly proliferative normal cells such as lymphocytes (T cells) show the Warburg effect. Recent studies indicate that, under aerobic conditions, both normal proliferating cells and cancer cells activate signaling pathways and transcription factors to substantially increase the activity and expression of enzymes, respectively, to increase metabolic flux through glycolysis and the associated biosynthetic pathways (see discussion in Chandel 2020e). The advantage of the Warburg effect lies not necessarily in generating copious amounts of glycolytic ATP but in the biosynthetic capacity of glycolysis. Mitochondria are able to generate ample ATP in most proliferating cells, including cancer cells. The duplication of a cell into two daughter cells involves de novo synthesis of macromolecules such as lipids and nucleotides. Many of the glycolytic intermediates are precursors to anabolic pathways, including the pentose phosphate pathway (which generates NADPH and ribose 5-phosphate), the hexosamine pathway for glycosylation, and amino acid and lipid synthesis.
Figure 7.
Positron-emission tomography (PET) imaging with 18fluorodeoxyglucose (FDG) of a patient with lymphoma. The mediastinal nodes (purple arrow) and supraclavicular nodes (green arrows) show high uptake of FDG, indicating that tumors in these nodes have high levels of glucose metabolism. The bladder (yellow arrow) also has high activity because of excretion of the radionuclide. (Reprinted from Gatenby and Gillies 2004, with permission from Macmillan Publishers.)
Footnotes
From the recent volume Navigating Metabolism by Navdeep S. Chandel
Additional Perspectives on Metabolism available at www.cshperspectives.org
SUGGESTED READING
*Reference is also in this collection.
- Bar-Even A1, Flamholz A, Noor E, Milo R. 2012. Rethinking glycolysis: on the biochemical logic of metabolic pathways. Nat Chem Biol 8: 509–517. 10.1038/nchembio.971 [DOI] [PubMed] [Google Scholar]
- *.Chandel NS. 2020a. Mitochondria. Cold Spring Harb Perspect Biol 10.1101/cshperspect.a040543 [DOI] [PMC free article] [PubMed] [Google Scholar]
- *.Chandel NS. 2020b. Basics of metabolic reactions. Cold Spring Harb Perspect Biol 10.1101/cshperspect.a040527 [DOI] [PMC free article] [PubMed] [Google Scholar]
- *.Chandel NS. 2020c. Signaling and metabolism. Cold Spring Harb Perspect Biol 10.1101/cshperspect.a040600 [DOI] [PMC free article] [PubMed] [Google Scholar]
- *.Chandel NS. 2020d. Carbohydrate metabolism. Cold Spring Harb Perspect Biol 10.1101/cshperspect.a040568 [DOI] [PMC free article] [PubMed] [Google Scholar]
- *.Chandel NS. 2020e. Metabolism of proliferating cells. Cold Spring Harb Perspect Biol 10.1101/cshperspect.a040618 [DOI] [PMC free article] [PubMed] [Google Scholar]
- Crabtree HG. 1928. The carbohydrate metabolism of certain pathological overgrowths. Biochem J 22: 1289–1298. 10.1042/bj0221289 [DOI] [PMC free article] [PubMed] [Google Scholar]
- Gatenby RA, Gillies RJ. 2004. Why do cancers have high aerobic glycolysis? Nat Rev Cancer 4: 891–899. 10.1038/nrc1478 [DOI] [PubMed] [Google Scholar]
- KEGG Pathway: Glycolysis/gluconeogenesis. http://www.genome.jp/kegg-bin/show_pathway?map00010
- Koppenol WH, Bounds PL, Dang CV. 2011. Otto Warburg's contributions to current concepts of cancer metabolism. Nat Rev Cancer 11: 325–337. 10.1038/nrc3038 [DOI] [PubMed] [Google Scholar]
- Locasale JW, Cantley LC. 2011. Metabolic flux and the regulation of mammalian cell growth. Cell Metab 14: 443–451. 10.1016/j.cmet.2011.07.014 [DOI] [PMC free article] [PubMed] [Google Scholar]
- Lunt SY, Vander Heiden MG. 2011. Aerobic glycolysis: meeting the metabolic requirements of cell proliferation. Annu Rev Cell Dev Biol 27: 441–464. 10.1146/annu-rev-cellbio-092910-154237 [DOI] [PubMed] [Google Scholar]
- Minakami S, de Verdier CH. 1976. Calorimetric study on human erythrocyte glycolysis heat production in various metabolic conditions. Eur J Biochem 65: 451–460. 10.1111/j.1432-1033.1976.tb10360.x [DOI] [PubMed] [Google Scholar]
- Nelson DL, Cox MM. 2013. Lehninger principles of biochemistry, 6th ed. WH Freeman, New York. [Google Scholar]
- Warburg O. 1956. On the origin of cancer cells. Science 123: 309–314. 10.1126/science.123.3191.309 [DOI] [PubMed] [Google Scholar]


