

Abstract
Pancreatic ductal adenocarcinoma (PDAC) is characterized by hypoxic niches that lead to treatment resistance. Therefore, studies of tumor oxygenation and metabolic profiling should contribute to improved treatment strategies. Here we define two imaging biomarkers that predict differences in tumor response to therapy: 1) partial oxygen pressure (pO2), measured by EPR imaging; and 2) [1-13C] pyruvate metabolism rate, measured by hyperpolarized 13C MRI. Three human PDAC xenografts with varying treatment sensitivity (Hs766t, MiaPaCa-2, and Su.86.86) were grown in mice. The median pO2 of the mature Hs766t, MiaPaCa-2, and Su.86.86 tumors was 9.1±1.7, 11.1±2.2, and 17.6±2.6 mmHg, and the rate of pyruvate-to-lactate conversion was 2.72±0.48, 2.28±0.26, and 1.98±0.51 min−1, respectively (n=6, each). These results are in agreement with steady state data of matabolites quantified by mass spectroscopy and histological analysis indicating glycolytic and hypoxia profile in Hs766t, MiaPaca-2, and Su.86.86 tumors. Fractionated radiation therapy (5 Gy x 5) resulted in a tumor growth delay of 16.7±1.6 and 18.0±2.7 days in MiaPaca-2 and Su.86.86 tumors, respectively, compared to 6.3±2.7 days in hypoxic Hs766t tumors. Treatment with gemcitabine, a first-line chemotherapeutic agent, or the hypoxia-activated prodrug TH-302 was more effective against Hs766t tumors (20.0±3.5 and 25.0±7.7 days increase in survival time, respectively) than MiaPaCa-2 (2.7±0.4 and 6.7±0.7 days) and Su.86.86 (4.7±0.6 and 0.7±0.6 days) tumors. Collectively, these results demonstrate the ability of molecular imaging biomarkers to predict the response of PDAC to treatment with radiation therapy and TH-302.
Significance:
pO2 imaging data and clinically available metabolic imaging data provide useful insight into predicting the treatment efficacy of chemotherapy, radiation, and a hypoxia-activated prodrug as monotherapies and combination therapies, in PDAC tumor xenograft models.
Keywords: EPR imaging, Hyperpolarized 13C MRI, Hypoxia-activated prodrug, Pancreatic cancer, Tumor hypoxia
Introduction
Pancreatic ductal adenocarcinoma (PDAC), which constitutes 95% of pancreatic cancers, is one of the most aggressive and fatal cancers, with a 5-year survival rate of 5% (1). As PDAC is so insidious, more than 80% of PDAC cases are already advanced and metastatic when diagnosed, beyond the stage capable of surgical resection (2).
PDAC is commonly classified as a hypovascular and hypoxic tumor (3). However, quantitative and non-invasive methods of evaluating oxygenation of this cancer are limited. The only study, to the best of our knowledge, of quantitative oxygen measurement of pancreatic tumors was reported by Koong et al. using the invasive Eppendorf electrode method (4). The partial oxygen pressure (pO2) in tumors across the 7 patients in this study ranged from 0 to 5.3 mmHg, which is significantly hypoxic compared with the values for a normal pancreas (9.3–92.7 mmHg) (4). On the other hand, substantial interpatient heterogeneity of the extent of tumor hypoxia was observed. Matsuo et al. reported the results of a larger scale, but not quantitative, study of oxygen levels in PDAC (5). In this study, expression of a hypoxia marker, hypoxia-inducible factor 1α (HIF-1α), in PDAC tissues was measured histochemically, and nearly half of the tumors showed non-detectable or low levels of HIF-1α expression. The HIF-1α level was significantly (P=0.035) correlated with poor prognosis. Metran-Nascente et al. reported striking interpatient variation in the hypoxic fraction of tumors in pancreatic cancer patients using a 2-nitroimidazole-based PET tracer, 18F-fluoroazomycin arabinoside (6). In their study, the hypoxic fraction ranged widely, from <5% to >50%, and 5 out of 20 evaluable patients did not exhibit any detectable tumor hypoxia.
These reports suggest that not all human pancreatic tumors are hypoxic. Tumor response to treatment in individual patients and the resulting overall survival rate can vary, depending either directly on a tumor’s oxygenation status or indirectly on the downstream hypoxia signaling induced by the characteristic hypoxic and acidotic microenvironments. A priori knowledge of these microenvironmental features allows the appropriate choice between anti-proliferative therapies, such as chemotherapeutic, radiation-based modalities for well oxygenated tumors, and hypoxia-activated prodrugs for hypoxic tumors.
Electron paramagnetic resonance imaging (EPRI) is a spectroscopic imaging technique similar to MRI, which is available in preclinical study but not yet applied for human. EPRI detects paramagnetic species that have unpaired electrons such as transition metal complexes and free radicals. With the availability of trityl radical probes as in vivo-compatible paramagnetic tracers, EPRI is being explored for mapping tissue oxygen levels in live animals (7,8). The collisional interaction between the oxygen-sensitive tracer and dissolved paramagnetic oxygen leads to a broadening of the spectral line width of the tracer, which linearly correlates with local oxygen concentration, providing quantitative imaging capability of EPRI in determining tissue pO2. EPRI has capabilities to provide quantitative maps of tumor pO2 in preclinical studies (7,8), and being evaluated for clinical implementation. On the other hand, hyperpolarized 13C MRI monitoring of pyruvate metabolism via oxidative phosphorylation or by aerobic glycolysis is a novel metabolic imaging technique which can potentially provide biochemical information related to tumor oxygenation and is already clinically implemented in humans(9). Cancer cells within hypoxic tumor regions survive by promoting aerobic glycolysis for energy production, where pyruvate is metabolized to lactate by lactate dehydrogenase (LDH). Although the underlying molecular mechanisms of the shift in energy metabolism are complex, diverse, and dependent on the kinds of genomic mutations in individual tumors, the resulting alteration of pyruvate metabolism offers opportunities for non-invasively characterizing tumor physiology and predicting tumor response to particular treatments.
We recently reported that three PDAC xenografts (Hs766t, MiaPaCa-2, and Su.86.86) showed quite different response to a hypoxia-activated prodrug TH-302 and the different treatment efficacy was attributed to the difference in tumor oxygenation status which can be artificially modified by a transient hypoxia induction agent (10). Based on the previous observation, we investigated if two non-invasive imaging biomarkers, pO2 measured by EPRI and [1-13C] pyruvate metabolism rate measured by hyperpolarized 13C MRI, could capture the difference in oxygenation status in three human PDAC xenografts and predict their response to three representative pancreatic cancer treatments, including a first-line chemotherapy, a hypoxia-activated prodrug, and fractionated radiotherapy.
Materials and Methods
Human pancreatic xenografts and treatments
Female athymic nude mice were supplied by the Frederick Cancer Research Center, Animal Production (Frederick, MD). Three human PDAC cell lines were used for tumor model development. Su.86.86 and Hs766t cells were obtained from Threshold Pharmaceuticals (Redwood City, CA), and MiaPaCa-2 cells were obtained from the American Type Culture Collection (ATCC, Manassas, VA). All cell lines were tested in May 2013 and authenticated by IDEXX RADIL (Columbia, MO) using a panel of microsatellite markers. PDAC xenografts were established by subcutaneously injecting 2×10⁶ cells into the hind legs of mice. Tumor volumes were measured every 2–4 days by T2-weighted MR images and calculated with the formula: (length) × (width) × (height) × π/6.
Tumor-bearing mice were treated with either 1) 150 mg/kg of gemcitabine (LC Laboratories) i.p. on day 0 and 2, 2) fractionated X-irradiation 3 Gy x 5 days (X-RAD 320, Precision X-ray Inc.), or 3) 80 mg/kg of TH-302 (Threshold Pharmaceuticals) i.p. daily for 5 days. In combination therapies, chemotherapeutic drugs, same doses as monotherapy, were given 30 min after X-irradiation, or TH-302 was given 30 min after gemcitabine administration. The survival data for control and TH-302 groups in survival analysis were duplicates of our previously published study (10).
EPRI for oxygen imaging
Technical details of the EPR scanner and oxygen image reconstruction were described previously (11). Parallel coil resonators tuned to 300 MHz were used for EPRI. After the animal was placed in the resonator, an oxygen-sensitive paramagnetic trityl radical probe, OX063 (1.125 mmol/kg bolus), was injected intravenously under isoflurane anesthesia. The free induction decay (FID) signals were collected following the radiofrequency excitation pulses (65 ns) with a nested looping of the x, y, and z gradients, and each time point in the FID underwent phase modulation, enabling 3D spatial encoding. Because FIDs last for 1 to 5 μsec, it is possible to generate a series of T2* maps, i.e., EPR line width maps, which linearly correlate with the local concentration of oxygen if the concentration of Ox063 is low enough to avoid the contribution of self line-broadening, and allow pixel-wise estimation of tissue pO2. The repetition time was 8.0 μsec. The number of averages was 4,000. After EPRI measurement, anatomic T2-weighted MR images were collected with a 7T or 1T scanner (Bruker BioSpin MRI GmbH). Because pyruvate injection transiently affects tumor oxygenation, EPRI measurement is always conducted prior to 13C MRI study of hyperpolarized pyruvate metabolism when run both scans on the same day.
Hyperpolarized 13C MRI of pyruvate metabolism
Details of the hyperpolarization procedure were reported previously (12,13). Briefly, samples of [1-13C] pyruvic acid (30 μL) containing 15 mM Ox063 and 2.5 mM of the gadolinium chelate ProHance (Bracco Diagnostics, Milano, Italy) were polarized in a Hypersense DNP polarizer (Oxford Instruments). After 40–60 min, the hyperpolarized sample was rapidly dissolved in 4.5 mL of a superheated HEPES-based alkaline buffer. NaOH was added to the dissolution buffer to pH 7.4 after mixture with [1-13C] pyruvic acid. Hyperpolarized [1-13C] pyruvate solution (12 μL/g body weight) with a 13C polarization of 20–25% was intravenously injected through a catheter placed in the tail vein of each mouse.
Hyperpolarized 13C MRI studies were performed on a 4.7T scanner (Bruker Bio-Spin MRI GmbH) using a 17-mm home-built 13C solenoid coil placed inside of a saddle coil tuned to 1H frequency. Dynamic spectroscopic images were acquired every 6 sec after the start of pyruvate injection from a 32 × 32 mm field of view in a 8 mm coronal slice through the tumor, with matrix size of 12 × 12, spectral width of 6010 Hz, repetition time of 41.6 ms, and a 250 μs Gaussian excitation pulse with a flip angle of 10°. The total time required to acquire 40 serial images was 4 min.
Immunohistochemistry
Tumor tissues were excised 1 h after intravenous injection of pimonidazole (60 mg/kg, Hypoxyprobe Inc., Burlington, MA) and fixed with 4% paraformaldehyde overnight. The tumor tissues were frozen with Tissue-Tek O.C.T. compound (Sakura Finetek USA Inc., Torrance, CA) in cold ethanol and 10 μm thick sections were obtained. The tissue sections were stained for pimonidazole (rabbit, Hypoxyprobe-1 Omni Kit, Hypoxyprobe Inc.), CD31 (rabbit, NBP1–49805, Novus Biologicals, Littleton, CO), carbonic anhydrase IX (rabbit, NB100–417, Novus Biologicals), and LDH-A (rabbit, NBP1–48336, Novus Biologicals). Horseradish peroxidase-conjugated secondary antibodies and 3,3’ diaminobenzidine were used to detect primary antibodies. The stained slides were scanned using a BZ-9000 microscope (Keyence), and the immunostain-positive area was quantified using ImageJ software (downloaded from https://imagej.nih.gov/ij/).
Metabolome analysis
When tumor size was >600 mm3, tumor tissues were excised, immediately frozen in liquid nitrogen, and stored at 80 °C until analysis. A total of 116 metabolites involved in glycolysis, the pentose phosphate pathway, the tricarboxylic acid cycle, the urea cycle, and polyamine, creatine, purine, glutathione, nicotinamide, choline, and amino acid metabolism were analyzed using CE-TOF and QqQ mass spectrometry (Carcinoscope Package, Human Metabolome Technologies, Inc., Boston, MA).
Statistical analysis
All of the results are expressed as the means ± SD. The differences in the means of groups were determined by Student’s 2-tailed t test. The survival rate was estimated with the Kaplan-Meier survival analysis, where survival rate was defined as tumor volume increasing by <2.5-fold from the original size. The difference between control group and other groups are assessed by the log-rank test. The minimum level of significance was set at p <0.05.
Study approval
All of the animal experiments were performed in compliance with the Guide for the Care and Use of Laboratory Animal Resources (National Research Council, 1996) and were approved by the National Cancer Institute Animal Care and Use Committee (NCI-CCR-ACUC, Bethesda, MD, protocol nos. RBB-153, 155, and 159).
Results
Histological and metabolic characterization of three human pancreatic cancer xenografts
Three xenografts of human PDAC (Hs766t, MiaPaCa-2, and Su.86.86) were resected for histochemical analysis to investigate if there is any difference in the levels of markers related to tumor oxygenation and metabolism in these tumors. Representative images from two different tumors in each tumor type are shown in Fig. 1. Tumor vascularization was evaluated with immunostaining of vascular marker CD31. The fraction of CD31-positive area in Su.86.86 tumors (22.5±8.5%) was higher than that of Hs766t (16.4±7.1%) and MiaPaCa-2 (14.4±12.0%) tumors, suggesting that Su.86.86 tumors are well vascularized compared with the other two PDAC tumors. Immunostaining of an exogenous hypoxia marker, pimonidazole (34.5±7.9%, 20.9±10.6%, and 15.9±8.2% for Hs766t, MiaPaCa-2, and Su.86.86, respectively), and endogenous hypoxia markers CA-IX (34.1±15.1%, 33.1±18.7%, and 13.9±7.3%) and LDH-A (65.6±13.8%, 55.0±18.8%, and 12.2±5.9%), whose expression is controlled by HIFs, also suggested that Hs766t and MiaPaCa-2 tumors were more hypoxic than Su.86.86 tumors (Fig. 1).
Fig. 1.
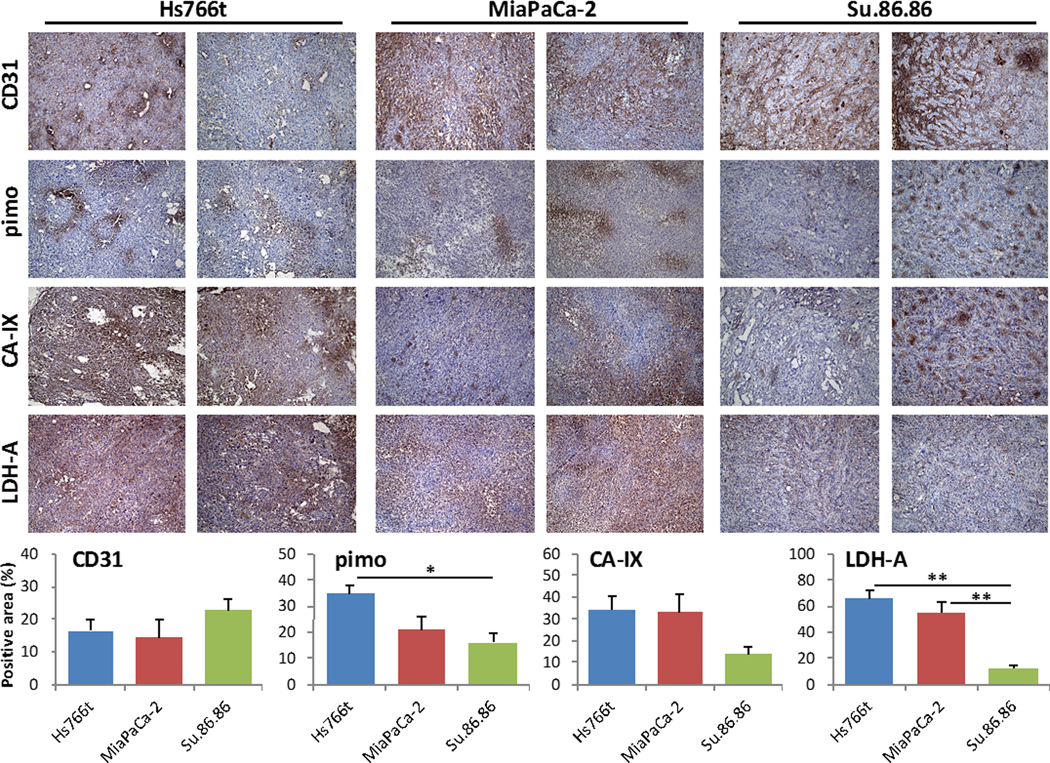
Histological characterization of three human pancreatic cancer xenografts. When tumor volume reached 800 mm3, xenografts were surgically resected and formalin fixed for histological analysis. Frozen sections of tumors were stained for blood vessel marker CD31, exogenous hypoxia marker pimonidazole (pimo), and endogenous hypoxia markers CA-IX and LDH-A in Hs766t, MiaPaCa-2, and Su.86.86 tumors. Quantitative data are presented as mean ± SD of 5 tumor samples. The histological analysis shows Hs766t and MiaPaCa-2 tumors may be more hypoxic than Su.86.86 tumors. * p<0.05, ** p<0.01.
In order to further investigate the metabolic differences in the three PDAC tumors, mass spectroscopy-based metabolome analysis was conducted. Among 116 metabolites detected, the concentrations of representative metabolites related to energy metabolism are shown in Fig. 2. Concentrations of 3-phosphoglycerate and pyruvate were highest in Hs766t (15.2±4.2 and 42.0±6.7 nmol/g, respectively, expressed as mean±SEM), intermediate in MiaPaCa-2, (4.3±1.5 and 26.0±8.6 nmol/g) and lowest in Su.86.86 tumors (2.4±0.4 and 18.0±2.8 nmol/g), implying an increased glucose uptake in Hs766t tumors. Higher adenylate energy charge in Hs766t tumors compared to other two tumor lines can be also explained by the upregulated glycolysis in Hs766t tumors. Citrate concentration and NADH/NAD ratio were higher in Su.86.86 tumors (593±55 nmol/g and 0.049±0.0069, respectively) compared to Hs766t (411±41 nmol/g and 0.020±0.0011) and MiaPaCa-2 (380±12 nmol/g and 0.029±0.0035) tumors, whereas lactate concentration was higher in Hs766t and MiaPaCa-2 tumors than Su.86.86 tumors (14,433±857, 10,341±2888, and 6,250±504 mmol/g, respectively). These results suggest that mitochondrial oxidative phosphorylation is down-regulated and pyruvate is metabolized to generate more lactate in Hs766t and MiaPaCa-2 tumors. Lower concentrations of glutamate and total glutathione in Hs766t tumors are consistent with the decreased metabolic flux of the tricarboxylic cycle. Interestingly, substantially decreased concentrations of fumarate and malate were detected in MiaPaCa-2 tumors, whereas no difference was observed in upstream succinate levels among the three PDCA tumors, suggesting impairment of succinate dehydrogenase (SDH) activity in MiaPaCa-2 tumors. Immunoblotting of SDH isoforms revealed decreased SDH expression in MiaPaCa-2 tumors (Supplemental Figure S1), which may contribute to up-regulated glycolysis.
Fig. 2.
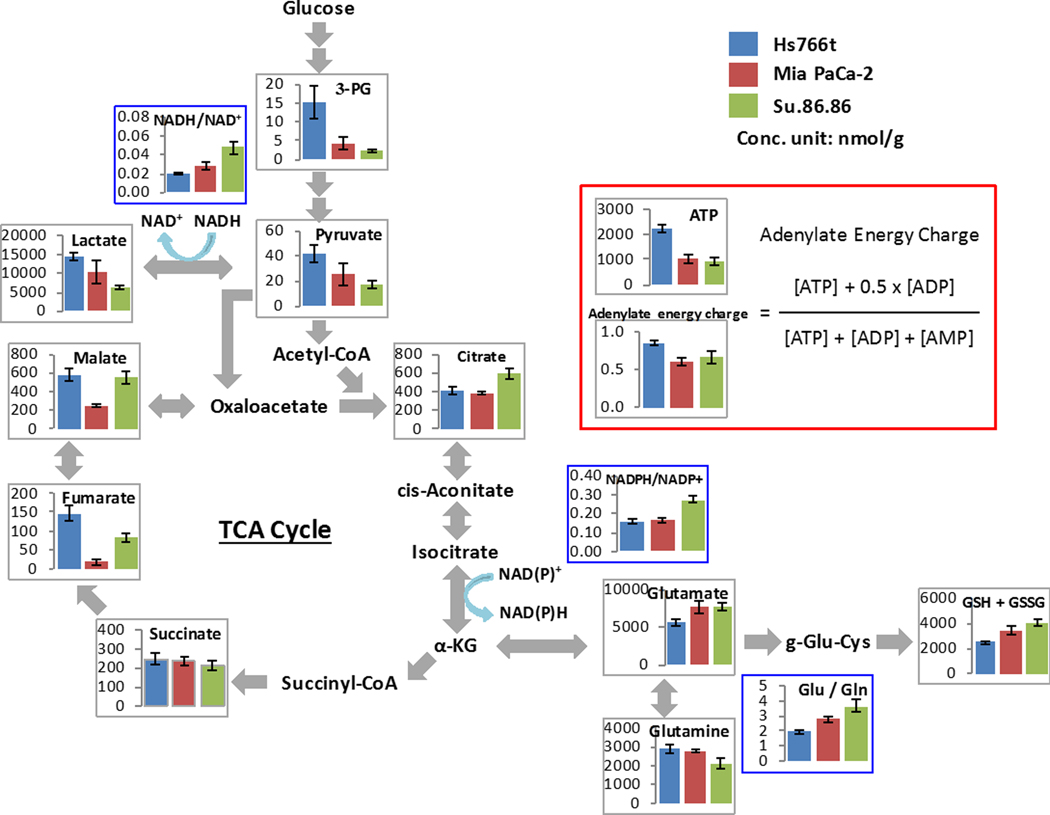
Metabolome analysis of three PDAC tumors. When tumor volume reached 800 mm3, xenografts were excised and immediately frozen by liquid nitrogen, and sent for a metabolome analysis (Carcinoscope package of Human Metabolome Technology Inc.). Graphs of representative metabolites from a total of 116 metabolites are shown. The metabolome analysis revealed the glycolytic character of Hs766t and MiaPaCa-2 tumors compared to Su.86.86 tumors. Data are presented as mean ± SD of 3 tumor samples for each cell line.
EPR oxygen imaging of three human pancreatic cancer xenografts
To investigate the tumor oxygenation levels among the three pancreatic tumors examined, EPR oxygen imaging studies were conducted. T2-weighted MR images of the centers of tumors and corresponding 2D slices extracted from 3D EPR oxygen image data set of the PDAC tumors are shown in Fig. 3A and 3B, respectively. Tumor areas were determined using the T2-weighted MR images. Quantitative oxygen analysis was performed on the whole tumor area in the 3D oxygen images and histograms of pO2 distribution of representative tumors are shown in Fig. 3C. The median pO2 values of the tumors studied were 9.1±1.7, 11.1±2.2, and 17.6±2.6 mmHg, and the corresponding hypoxic tumor fractions (defined as <10 mmHg of oxygen) were 57.7±13.3%, 46.6±7.4%, and 27.3±13.5% for Hs766t, MiaPaCa-2, and Su.86.86 tumors, respectively (Fig. 3D–E). Supplemental Figure S2 shows the representative images of whole mount immunostaining of pimonidazole. The results of quantitative oxygen imaging were consistent with the results of immunostaining and the metabolome analysis, confirming that the PDAC xenografts studied have significant variation in the level of tumor oxygenation. Median pO2 and HF10 of individual PDAC tumors in EPR oxygen imaging study were listed in supplementary table S1.
Fig. 3.
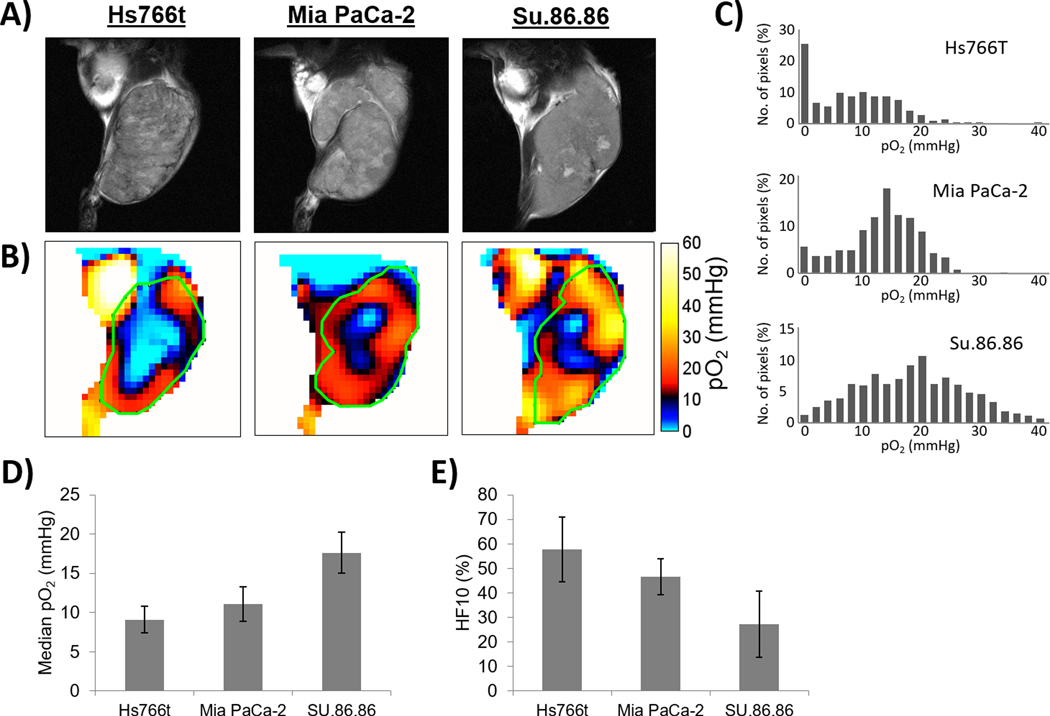
EPR oxygen imaging of three PDAC xenografts. A) Anatomic T2-weighted MR images of Hs766t, MiaPaCa-2, and Su.86.68 tumors. B) Three dimensional oxygen imaging of the PDAC tumors obtained by EPR imaging. C) Histograms of pO2 distribution of the PDAC tumors. D-E) Median pO2 D-E) Median pO2 (D) and hypoxic fraction with less than <10 mmHg pO2 (E) of the three PDCA tumors. Quantitative oxygen imaging revealed that Hs766t is the most hypoxic and Su.86.86 is the most oxygenated tumor of the three PDAC tumors. Data are presented as mean ± SD of 5 tumors for each cell line.
Hyperpolarized 13C MRI of pyruvate metabolism rates in three human pancreatic cancer xenografts
To better understand the metabolic profile of the three PDAC tumor xenograft models, hyperpolarized 13C MRI using [1–13C] pyruvate was performed. After the tail vain injection of hyperpolarized [1-13C] pyruvate (0.1 mg/g body weight), pyruvate-to-lactate conversion in the tumor region was observed in 13C MRI scans acquired every 6 second (Fig. 4A). The pyruvate and lactate signals were plotted, and the conversion rate constant (kpyr-lac) was calculated based on the plot. Fig. 4B shows how the conversion rate constant kpyr-lac varies across the tumor area and between tumor types. From the data, it can be seen that Hs766t tumors showed the highest kpyr-lac whereas Su.86.86 tumors showed the lowest. As expected, the kpyr-lac was negatively correlated to the tumor pO2 levels (Fig. 4C). Lactate to pyruvate ratio and kpyr-lac of individual PDAC tumors in hyperpolarized 13C MRI study were listed in supplementary table S2.
Fig. 4.
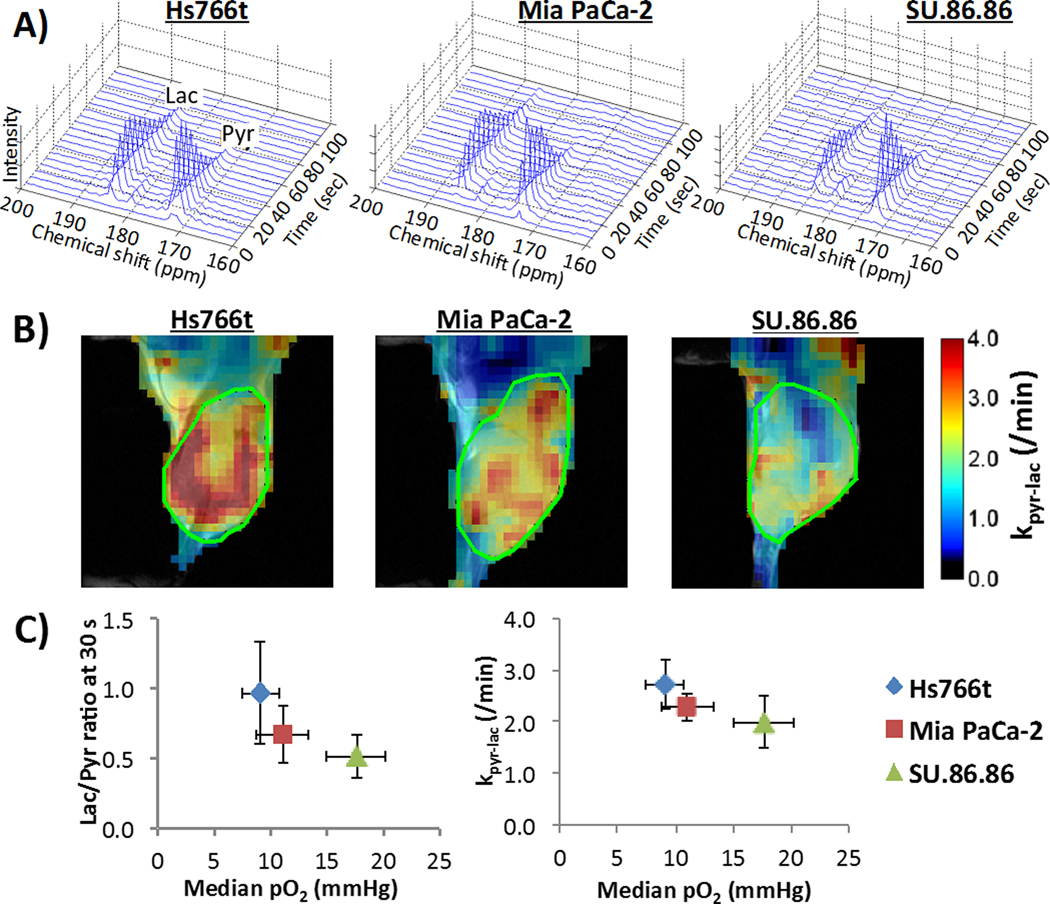
MRI of hyperpolarized 13C pyruvate metabolism in three PDCA xenografts. A) Representative dynamic 13C NMR spectra of a tumor voxel from three PDAC tumors. B) Kinetic constant maps of pyruvate-to-lactate conversion rate constants (kpyr/lac), i.e. LDH activity, calculated from serial spectroscopic 13C MR images obtained every 6 sec after hyperpolarized 13C pyruvate injection. C) Correlation between lactate / pyruvate ratio (left) at 30 sec after pyruvate injection or pyruvate-to-lactate conversion rate (right) from hyperpolarized 13C MRI (left) and median tumor pO2 from EPR imaging in three pancreatic tumor xenografts. Data are presented as mean ± SD of 6 tumors for each cell line.
Treatment responses of three PDAC tumors to chemotherapy and radiotherapy
To further examine the relationship between the oxygenation/aerobic glycolysis profiles and therapeutic effect of anti-cancer therapies, treatment responses to monotherapies and combination therapies of gemcitabine, TH-302, and fractionated radiotherapy on the three PDAC xenograft models were examined in vivo by measuring the tumor size after the treatments. The data for control and TH-302 monotherapy groups in survival analysis were from our previously published study (10). The doubling time of untreated control tumors were 7.0±1.0, 8.0±2.0, and 8.0±1.2 days for Hs766t, MiaPaca-2, and Su.86.86 tumors, respectively. TH-302 was employed as a hypoxia-targeting therapy and fractionated radiotherapy was employed as an oxygen-dependent therapy. Gemcitabine was also examined as a first-line drug for PDAC treatment in clinical settings. The results are presented as Kaplan-Meier survival curves, in which an end point was set at a tumor volume of 2.5-fold increase from the original size. Figure 5 shows the survival curves of the tumor-bearing mice treated with the monotherapies for three PDAC tumors. Although all tumors had similar survival time without treatment, the responses to the three treatments were significantly different. Supplementary figure S3 shows the plots of tumor growth delay vs. HF10, pO2 and lac/pyr ratio.
Fig. 5.
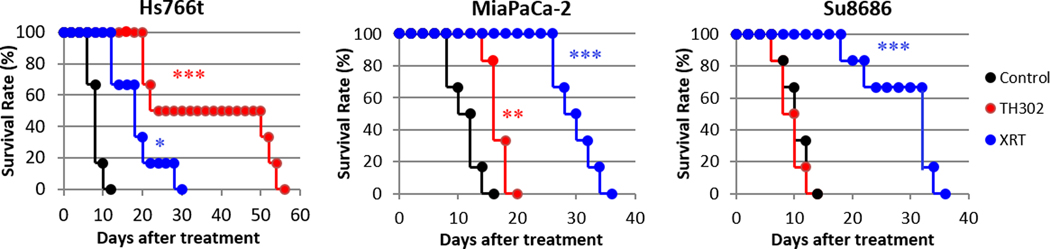
Response of three pancreatic tumors to cancer treatments. Mice beari ng one of three PDAC tumors were treated with either gemcitabine (bolus 125 mg/kg), fractionated X-radiation (XRT; 3 Gy x 5 days), or hypoxia-activated prodrug TH-302 (80 mg/kg daily x 5 days). “Survival” was defined as tumor volume increasing by <2.5-fold from the original size. MiaPaCa-2 and Su.86.86 tumors responded best to radiation therapy, whereas TH-302 produced the best survival rate in Hs766t tumors. The data for control and TH-302 groups in survival analysis were duplicates of our previously published study (10). See Table 1 for statistical results on treatment benefit. Each treatment group was compared with control group by log-rank test. *, >0.05; **, >0.01; ***, >0.001.
Table 1 reports the tumor growth delay produced by monotherapies and combination therapies. Fractionated radiotherapy improved the survival time the most in oxygenated Su.86.86 tumors (18.0±2.7 days), while TH-302 was most effective in hypoxic Hs766t tumors (25.0±7.7 days). Gemcitabine displayed treatment responses unrelated to the tumor oxygenation. Hs766t tumors were most sensitive to gemcitabine (20.0±3.5 days) and other two tumors also showed moderate treatment responses (2.7±0.4 and 4.7±0.4 days in MiaPaca-2 and Su.86.86 tumors, respectively). Since the Hs755t tumor exhibited the most hypoxia among the three tumor types evaluated (see Figure 3), we conducted an in vitro experiment to determine if Hs766t cells were exceptionally sensitive to gemcitabine under hypoxic conditions (< 10 ppm oxygen) compared to aerobic conditions. The study revealed a 1.8-fold enhancement in cell killing from gemcitabine under hypoxic treatment compared to aerobic conditions (Supplementary Figure S4). The reason for the Hs766t tumor cell enhancement in vitro and in vivo will require further study.
Table 1.
Treatment benefit (growth delay) of monotherapy and combination therapy
| Hs766t | MiaPaca-2 | Su.86.86 | p values | |
|---|---|---|---|---|
| TH-302 | 25.0 ± 7.7 | 6.7 ± 0.7 | 0.7 ± 0.6 | *HS vs SU, ***MP vs SU |
| GEM | 20.0 ± 3.5 | 2.7 ± 0.4 | 4.7 ± 0.6 | ***HS vs MP, ***HS vs SU, *MP vs SU |
| XRT | 6.3 ± 2.7 | 16.7 ± 1.6 | 18.0 ± 2.7 | ***HS vs MP, **HS vs SU |
| XRT + | ***HS vs MP, ***HS vs SU, ***MP vs SU | |||
| TH-302 | >50.7 ± 0.7 | >37.7 ± 3.1 | 22.3 ± 0.7 | |
| XRT + GEM | >48.7 ± 1.3 | 21.7 ± 0.0 | 30.3 ± 1.8 | ***HS vs MP, ***HS vs SU, ***MP vs SU |
| GEM + | ***HS vs MP, ***HS vs SU | |||
| TH-302 | >47.3 ± 1.4 | 16.7 ± 1.4 | 15.7 ± 2.2 | |
Treatment benefit (days) = (days to 2.5 times))- (non-treat)
“>” represents the group include mice that survived past 60-day end point. Gem, gemcitabine; XRT, X-radiation therapy. Each group contains 6–9 mice.
Each treatment benefit was compared between tumor types.
p<0.05
p<0.01
p<0.001 (HS, Hs766t; MP, MiaPaca-2, SU, Su.86.86).
Figure 6 and Supplementary Table S3 show the synergistic effect of combination therapies calculated by the following equation: growth delay (A+B) / [{growth delay (A)} + {growth delay (B)}]. All combinations of the three therapies showed more than additive effects, presumably due to their different mechanisms of action. The combination of oxygen-dependent radiation therapy and hypoxia-targeting TH-302 therapy was effective in Hs766t and MiaPaCa-2 tumors that were relatively hypoxic, while less hypoxic Su.86.86 tumors showed less treatment benefit, suggesting TH-302 was not effective against Su.86.86 tumors, even when combined with radiation therapy, which is known to induce temporary hypoxia but the timing and duration of radiation induced transient hypoxia is largely different dependent on the dose of radiation and tumor types (14–16). The combination therapies containing gemcitabine treatment showed unexpected results. When combined with gemcitabine, oxygen-dependent radiation therapy showed the strongest synergistic effect on the most hypoxic tumor (Hs766t), suggesting a strong radiosensitizing effect by gemcitabine.
Fig. 6.
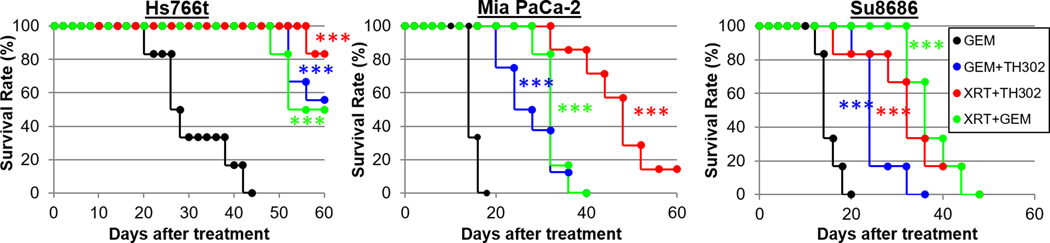
Response of three pancreatic tumors to combination therapy. Mice bearing one of three PDAC tumors were treated with a gemcitabine or the following combination therapies: fractionated X-radiation and TH-302, fractionated radiation and gemcitabine, or gemcitabine and TH-302. Survival” was defined as tumor volume increasing by <2.5-fold from the original size. See Table 1 for statistical results on treatment benefit. Each combination treatment group was compared with untreated control group in Fig.5 by log-rank test. ***, p<0.001.
Discussion
In the present study, we used two novel molecular imaging techniques, EPR-based pO2 imaging and hyperpolarized 13C MRI, to characterize the tumor microenvironment and examine the ability of physiologic and metabolic status to reliably predict the response to three cancer treatment modalities. EPRI can provide a quantitative pO2 measurement in vivo. As the treatment outcome of radiation therapy or HAPs is known to be closely related to pO2 in the tumor, oximetry by EPRI is considered to be a useful imaging assessment tool to predict the response to such treatments. However, due to the limitations of EPRI such as specific absorption rate and lower penetration depth of microwave, it has not been applied in clinical setting. On the other hand, 13C MRI of pyruvate is a clinically available imaging technique that provides in vivo metabolic information. Exogenously administered hyperpolarized pyruvate can be delivered into cancer cells where the conversion of pyruvate to either lactate by the enzyme LDH, or acetyl-CoA and downstream intermediates through oxidative phosphorylation, generates characteristic spectral signatures. The lactate:pyruvate ratio (L/P) indicates local LDH activity that is usually enhanced in cancer cells and can also be enhanced in hypoxic environments. Thus, monitoring the L/P ratio can be considered as a means to examining indirectly the pO2 status of the tumor.
The three PDAC xenograft models were first examined using histological and metabolomic analysis. Histological analysis revealed that Hs766t tumors were hypoxic, hypovascular, and glycolytic, whereas Su.86.86 tumors were less hypoxic, vascular rich, and less glycolytic. MiaPaCa-2 tumors showed an intermediate profile (Fig. 1). Metabolomic analyses confirmed the glycolytic profiling of these tumors by showing elevated levels of steady-state metabolites of consistent with glycolysis in Hs766t and MiaPaca-2 tumors (Fig. 2). Such characterization of PDACs was also non-invasively performed by EPR oximetry and hyperpolarized 13C MRI of pyruvate. The oxygenation profiles of the three PDAC models obtained from EPR oximetry were consistent with the pimonidazole-positive area in histological analysis (Fig. 1C and Fig. 3D, 3E) and the metabolic profiles obtained from kpyr-lac in hyperpolarized 13C MRI (Fig. 4C) was also consistent with the LDH-positive area in histological analysis (Fig. 1D). The negative correlation between pO2 and glycolytic efficiency in PDACs revealed by these imaging modalities suggests a metabolic adaptation represented by activation of hypoxia inducible factors (HIF) that are known to regulate the expression of more than 800 genes. However, the contribution from anaerobic glycolysis to the lactate:pyruvate ratio cannot be separated. Lactate dehydrogenase A and pyruvate dehydrogenase kinase 1 are known to be upregulated by HIF and enhance pyruvate to lactate flux.
The tumor growth experiments showed that the most hypoxic tumor type, Hs766t, showed the longest growth delay (25 ± 7.7 days) upon treatment with the hypoxia-activated pro-drug TH-302 and shortest delay (6.3 ± 2.7 days) after radiation, whereas the least hypoxic tumor type, Su.86.86, showed the shortest delay (0.7 ± 0.6 days) with TH-302 treatment and the longest delay (18.0 ± 2.7 days) after radiation (Fig. 5, Table 1). This indicates that metabolic profiling by hyperpolarized 13C MRI as well as tumor oximetry by EPR imaging can potentially serve molecular imaging modalities to predict treatment efficacy of radiation and TH-302 therapies. Gemcitabine monotherapy unexpectedly showed the highest treatment response in Hs766t, the most hypoxic tumor type, although hypoxic tumors are, in general, considered to poorly respond to anti-proliferative chemotherapies (17–19). Previous reports have identified proline and glutamine as negatively correlated markers and aspartate, hydroxyproline, creatine, and creatinine as positively correlated markers for gemcitabine resistance in two other human cancer cell lines (20). In our metabolomic data, the levels of such markers were similar between MiaPaCa-2 tumors and Hs766t tumors and did not predict the differential response to gemcitabine. Further investigations are required to establish whether alterations of metabolites are observed in gemcitabine-resistant PDACs.
Gemcitabine is an anti-metabolite agent which is widely used to treat PDAC tumors. Gemcitabine is a nucleoside analog in which the hydrogen atoms on the 2’ carbon of deoxycytidine are replaced by fluorine atoms. Gemcitabine is known to masquerade as a cytidine and get incorporated into new DNA strands, leading to apoptotic cell death. Radiation therapy is known to cause single or double strand breaks in DNA and generate reactive oxygen species (ROS) that inhibit DNA repair. Thus, oxygenated regions in tumors are susceptible to radiation therapy and hypoxic regions are not. On the other hand, TH-302 was developed to selectively target these less perfused hypoxic regions. TH-302 contains a nitroimidazole moiety covalently linked to a bromo-isophosphoramide (Br-IPM) moiety; it undergoes 1-electron reduction followed by unimolecular fragmentation to release the DNA alkylating Br-IPM at low concentrations of oxygen (21). In vitro studies showed a ~1,000-fold lower IC50 for cellular cytotoxicity in cells under hypoxia than cells under normoxic conditions (22).
The treatment responses to combination therapy were also compared with the imaging results. It should be noted that the nitroimidazole moiety of TH-302 is well known to enhance cancer cells to radiation therapy (10,21) and gemcitabine is reported to enhance the effect of radiation therapy by inhibiting homologous recombination repair even at a low dose (23). As reported in several previous studies (21,24,25), the combination of radiation and TH-302 resulted in better outcomes than monotherapy in all three PDAC tumor types, presumably by targeting both hypoxic and non-hypoxic regions. The radiosensitizing effect of TH-302 might also potentiate the anti-tumor effects. All gemcitabine-containing combination regimens showed more than additive effects. Interestingly, a higher synergistic effect of radiation + gemcitabine combination therapy was observed in hypoxic Hs766t tumors than in less hypoxic Su.86.86 tumors (Supplementary Table S1). This was thought to be the result of the radiosensitizing effect of gemcitabine in Hs766t tumors (23), which is supported by the fact that this combination therapy was not as synergistic in Su.86.86 tumors as in Hs766t tumors. Su.86.86 tumors might be too inherently radiosensitive to benefit from radiosensitization effects of gemcitabine. This result suggested that radiation therapy can be a powerful adjuvant therapy, even for radiation-resistant tumors with large hypoxic regions, when added to gemcitabine treatment. Of the three combination therapies investigated, only the combination of gemcitabine and TH-302 showed large synergistic effects in all three PDAC tumor types. This supports the results of a clinical trial investigating this combination therapy and reinforces the rationale for it (26).
The results of in vivo tumor growth experiments indicated the potential use of metabolic imaging by hyperpolarized 13C MRI to assess hypoxia (27). Of note, we measured pyruvate metabolism in a single slice through the center of tumor to improve time resolution and accurately track the kinetic profile. Multisliced imaging may be preferable if taking into account the possible heterogeneity of tumor physiology. The enhanced glycolysis can potentially predict the oxygenation profile of a cancer and its response to oxygen-dependent or hypoxia-targeting treatments. This will expand the clinical application of metabolic profiling by hyperpolarized 13C MRI and lead to better treatment strategies. Several anti-cancer therapies were reported to modulate the metabolic profile of tumors, leading to a more accurate assessment of therapeutic effects. Further investigation is required to determine whether examining data from pre-treated and post-treated cancers leads to even more accurate treatment selection.
Conclusion
In this study, we characterized the tumor microenvironment of three different PDAC xenografts in mice on a metabolic and physiologic basis and obtained imaging biomarkers that were predictive of the differential response to various treatments. The imaging results were consistent with the metabolomic and histologic information obtained from these three xenografts. The imaging data provided useful insight into predicting the treatment efficacy of gemcitabine, TH-302, and radiation, both as monotherapies and combination therapies, in three types of PDAC tumor xenograft models.
Supplementary Material
Acknowledgments
This study was mainly supported by the intramural research program of the NCI/NIH (S.Matsumoto, S.Kishimoto, K.Saito, Y.Takakusagi, N.Devasahayam, J.B.Mitchell, M.C.Krishna). This study was partially supported by JST PREST (S.Matsumoto), Toyota Physical and Chemical Research Institute (S.Matsumoto), and Takeda Science Foundation (S.Matsumoto). We thank Melissa Stauffer for editing the manuscript.
Footnotes
The authors have declared that no conflict of interest exists.
References
- 1.Hidalgo M, Von Hoff DD. Translational Therapeutic Opportunities in Ductal Adenocarcinoma of the Pancreas. Clin Cancer Res. 2012;18:4249–56. [DOI] [PubMed] [Google Scholar]
- 2.Stathis A, Moore MJ. Advanced pancreatic carcinoma: current treatment and future challenges. Nat Rev Clin Oncol; 2010;7:163–72. [DOI] [PubMed] [Google Scholar]
- 3.Erkan M, Hausmann S, Michalski CW, Fingerle AA, Dobritz M, Kleeff J, et al. The role of stroma in pancreatic cancer: diagnostic and therapeutic implications. Nat Rev Gastroenterol Hepatol; 2012;9:454–67. [DOI] [PubMed] [Google Scholar]
- 4.Koong AC, Mehta VK, Le QT, Fisher GA, Terris DJ, Brown JM, et al. Pancreatic tumors show high levels of hypoxia. Int J Radiat Oncol Biol Phys. 2000;48:919–22. [DOI] [PubMed] [Google Scholar]
- 5.Matsuo Y, Ding Q, Desaki R, Maemura K, Mataki Y, Shinchi H, et al. Hypoxia inducible factor-1 alpha plays a pivotal role in hepatic metastasis of pancreatic cancer: an immunohistochemical study. J Hepatobiliary Pancreat Sci. 2014;21:105–12. [DOI] [PubMed] [Google Scholar]
- 6.Metran-Nascente C, Yeung I, Vines DC, Metser U, Dhani NC, Green D, et al. Measurement of Tumor Hypoxia in Patients with Advanced Pancreatic Cancer Based on 18F-Fluoroazomyin Arabinoside Uptake. J Nucl Med. 2016;57:361–6. [DOI] [PubMed] [Google Scholar]
- 7.Matsumoto K, Subramanian S, Devasahayam N, Aravalluvan T, Murugesan R, Cook JA, et al. Electron paramagnetic resonance imaging of tumor hypoxia: Enhanced spatial and temporal resolution for in vivo pO2 determination. Magn Reson Med. 2006;55:1157–63. [DOI] [PubMed] [Google Scholar]
- 8.Matsumoto S, Hyodo F, Subramanian S, Devasahayam N, Munasinghe J, Hyodo E, et al. Low-field paramagnetic resonance imaging of tumor oxygenation and glycolytic activity in mice. J Clin Invest. American Society for Clinical Investigation; 2008;118:1965–73. [DOI] [PMC free article] [PubMed] [Google Scholar]
- 9.Nelson SJ, Kurhanewicz J, Vigneron DB, Larson PEZ, Harzstark AL, Ferrone M, et al. Metabolic Imaging of Patients with Prostate Cancer Using Hyperpolarized [ 1– 13 C ] Pyruvate. Sci Transl Med. 2013;5:198ra108. [DOI] [PMC free article] [PubMed] [Google Scholar]
- 10.Wojtkowiak JW, Cornnell HC, Matsumoto S, Saito K, Takakusagi Y, Dutta P, et al. Pyruvate sensitizes pancreatic tumors to hypoxia-activated prodrug TH-302. Cancer Metab. 2015;3:2. [DOI] [PMC free article] [PubMed] [Google Scholar]
- 11.Matsumoto S, Saito K, Yasui H, Morris HD, Munasinghe JP, Lizak M, et al. EPR oxygen imaging and hyperpolarized 13 C MRI of pyruvate metabolism as noninvasive biomarkers of tumor treatment response to a glycolysis inhibitor 3-bromopyruvate. Magn Reson Med. 2013;69:1443–50. [DOI] [PMC free article] [PubMed] [Google Scholar]
- 12.Matsumoto S, Saito K, Takakusagi Y, Matsuo M, Munasinghe JP, Morris HD, et al. In Vivo Imaging of Tumor Physiological, Metabolic, and Redox Changes in Response to the Anti-Angiogenic Agent Sunitinib: Longitudinal Assessment to Identify Transient Vascular Renormalization. Antioxid Redox Signal. 2014;21:1145–55. [DOI] [PMC free article] [PubMed] [Google Scholar]
- 13.Saito K, Matsumoto S, Takakusagi Y, Matsuo M, Morris HD, Lizak MJ, et al. 13C-MR Spectroscopic Imaging with Hyperpolarized [1–13C]pyruvate Detects Early Response to Radiotherapy in SCC Tumors and HT-29 Tumors. Clin Cancer Res. 2015;21:5073–81. [DOI] [PMC free article] [PubMed] [Google Scholar]
- 14.Brown SL, Nagaraja TN, Aryal MP, Panda S, Cabral G, Keenan KA, et al. MRI-Tracked Tumor Vascular Changes in the Hours after Single-Fraction Irradiation. Radiat Res. The Radiation Research Society; 2015;183:713–21. [DOI] [PubMed] [Google Scholar]
- 15.White DA, Zhang Z, Li L, Gerberich J, Stojadinovic S, Peschke P, et al. Developing oxygen-enhanced magnetic resonance imaging as a prognostic biomarker of radiation response. Cancer Lett. 2016;380:69–77. [DOI] [PMC free article] [PubMed] [Google Scholar]
- 16.Goda F, O’Hara JA, Rhodes ES, Liu KJ, Dunn JF, Bacic G, et al. Changes of oxygen tension in experimental tumors after a single dose of X-ray irradiation. Cancer Res. 1995;55:2249–52. [PubMed] [Google Scholar]
- 17.Chan N, Koritzinsky M, Zhao H, Bindra R, Glazer PM, Powell S, et al. Chronic hypoxia decreases synthesis of homologous recombination proteins to offset chemoresistance and radioresistance. Cancer Res. 2008;68:605–14. [DOI] [PubMed] [Google Scholar]
- 18.Song J, Qu Z, Guo X, Zhao Q, Zhao X, Gao L, et al. Hypoxia-induced autophagy contributes to the chemoresistance of hepatocellular carcinoma cells. Autophagy. Taylor & Francis; 2009;5:1131–44. [DOI] [PubMed] [Google Scholar]
- 19.Chan N, Koritzinsky M, Zhao H, Bindra R, Glazer PM, Powell S, et al. Chronic Hypoxia Decreases Synthesis of Homologous Recombination Proteins to Offset Chemoresistance and Radioresistance. Cancer Res. American Association for Cancer Research; 2008;68:605–14. [DOI] [PubMed] [Google Scholar]
- 20.Fujimura Y, Ikenaga N, Ohuchida K, Setoyama D, Irie M, Miura D, et al. Mass Spectrometry-Based Metabolic Profiling of Gemcitabine-Sensitive and Gemcitabine-Resistant Pancreatic Cancer Cells. Pancreas. 2014;43:311–8. [DOI] [PubMed] [Google Scholar]
- 21.Takakusagi Y, Kishimoto S, Naz S, Matsumoto S, Saito K, Hart CP, et al. Radiotherapy Synergizes with the Hypoxia-Activated Prodrug Evofosfamide: In Vitro and In Vivo Studies. Antioxid Redox Signal. 2018;28:131–40. [DOI] [PMC free article] [PubMed] [Google Scholar]
- 22.Takakusagi Y, Kishimoto S, Sarwat N, Matsumoto S, Saito K, Hart C, et al. Radiotherapy synergizes with the hypoxia-activated prodrug evofosfamide. In vitro and in vivo studies. Antioxid Redox Signal. 2017;0:ars.2017.7106. [DOI] [PMC free article] [PubMed] [Google Scholar]
- 23.Doyle TH, Mornex F, Mckenna WG. The Clinical Implications of Gemcitabine Radiosensitization The Clinical Implications of Gemcitabine Radiosensitization. Clin Cancer Res. 2001;7:226–8. [PubMed] [Google Scholar]
- 24.Hajj C, Russell J, Hart CP, Goodman KA, Lowery MA, Haimovitz-Friedman A, et al. A Combination of Radiation and the Hypoxia-Activated Prodrug Evofosfamide (TH-302) is Efficacious against a Human Orthotopic Pancreatic Tumor Model. Transl Oncol. 2017;10:760–5. [DOI] [PMC free article] [PubMed] [Google Scholar]
- 25.Peeters SGJA Zegers CML, Biemans R Lieuwes NG, van Stiphout RGPM, Yaromina A, et al. TH-302 in Combination with Radiotherapy Enhances the Therapeutic Outcome and Is Associated with Pretreatment [18F]HX4 Hypoxia PET Imaging. Clin Cancer Res. 2015;21:2984–92. [DOI] [PubMed] [Google Scholar]
- 26.Borad MJ, Reddy SG, Bahary N, Uronis HE, Sigal D, Cohn AL, et al. Randomized phase II trial of gemcitabine plus TH-302 versus gemcitabine in patients with advanced pancreatic cancer. J Clin Oncol. 2015;33:1475–81. [DOI] [PMC free article] [PubMed] [Google Scholar]
- 27.Bluff JE, Reynolds S, Metcalf S, Alizadeh T, Kazan SM, Bucur A, et al. Measurement of the acute metabolic response to hypoxia in rat tumours in vivo using magnetic resonance spectroscopy and hyperpolarised pyruvate. Radiother Oncol. Elsevier; 2015;116:392–9. [DOI] [PMC free article] [PubMed] [Google Scholar]
Associated Data
This section collects any data citations, data availability statements, or supplementary materials included in this article.