Abstract
In this study, we evaluate the use of video-based markerless motion tracking based on deep neural networks for the analysis of ataxia-specific movement abnormalities in rodent models of cerebellar ataxia. Based on a small amount of manually labeled video frames, the markerless motion tracking enables the extraction of movement trajectories and parameters characterizing ataxia-specific movement abnormalities and even identifies subtle movement changes in mice, which reveal no observable abnormalities by visual inspection. These prototypical results suggest the capability of the presented methods for the application in upcoming therapeutic intervention trials to identify subtle changes in movement behavior.
I. Introduction
Animal models of adult-onset neurodegenerative diseases have significantly enhanced the understanding of the molecular (patho-)mechanisms and have offered enormous potential for therapeutic target evaluation in many neurodegenerative diseases including Alzheimer’s disease, Parkinson’s disease or spinocerebellar ataxias [1]. In the last decades, rodent models were used to specifically investigate the (i) underlying disease mechanisms by molecular and neuropathological analyses, (ii) natural history and (iii) potential therapeutic interventions. In order to evaluate such therapeutic interventions, objectively measurable biomarkers are needed to quantify disease progression and therapeutic response. Especially the identification of early markers, which represent the presymptomatic phase of the disease, are urgently needed. For future clinical settings in neurodegenerative diseases, it is widely accepted that neuroprotective interventions in presymptomatic or early disease stages would be more effective [2, 3]. Therefore, more attention should be dedicated to pathological and behavioral phenotypic markers of early disease stages in rodent models. To quantify subtle behavioral changes in complex movements, standardized phenotypic readouts with proven relevance to human studies should be encouraged [4]. Importantly, reliable behavioral measurements to access longitudinal disease progression and to analyze potential therapeutic efficacy of treatments are needed.
In this study, a video-based behavioral tracking method based on deep neural networks was employed to capture the movement behavior of two different rodent models for cerebellar ataxia, a degenerative neurological disorder which mainly affects the cerebellum and manifests with symptoms like gait abnormalities, limb coordination deficits and instability [5]. Based on the recorded movement videos and the traced marker trajectories, we investigate the capability to extract features for the quantitative description of ataxia-specific characteristics in different movement tasks. In particular, we are seeking for movement tasks and features which enable the identification of subtle movement changes in very early stages of the progressively degenerating disease.
II. Methods
A. Rodent Models
In these studies we analyzed movement behavior of two different rodent models for ataxia.
In Experiment 1, we investigate the new model for X-linked tremor/ ataxia, the so called shaker rat, presenting a progressive Purkinje cell degeneration with shaking ataxia and wide stance [6]. We used previously recorded videos of 6 shaker rats and 4 wildtype (WT) rats aged 10 to 18 weeks. All rat experiments were performed in the Department of Neurology at the University of Utah, were approved by the institutional animal care and use committee of the University of Utah, and complied with US Public Health Service policy on the care and use of laboratory animals.
In Experiment 2, we examine a knock in mouse model for spinocerebellar ataxia type 3 (SCA3) expressing 304 glutamines and representing gait ataxia and coordination deficits [7, 8]. We recorded SCA3 mice of different age and disease stages compared to age-matched wildtype (WT) mice. SCA3 knock in mice show first symptoms with ~15 months in straight gait and other movement behavior. Out of the nine mice we recorded, there was one male SCA3 mouse aged 9 months compared to two age-matched male WT mice and additionally, two SCA3 mice aged 3 months (1 male, 1 female) and four age-matched WT mice (2 males, and 2 females). All mouse experiments were performed at the Hertie Institute for Clinical Brain Research (HIH) in Tübingen, Germany, were approved by the local ethics committee at the Regierungspräsidium Tübingen (HG3/13) and performed in accordance with the German Animal Welfare Act and the guidelines of the Federation of European Laboratory Animal Science Associations, based on European Union legislation (Directive 2010/63/EU).
B. Markerless motion tracking
Markerless motion capture was enabled by DeepLabCut, a software framework for animal pose estimation based on deep neural networks [9, 10]. While DeepLabCut was originally designed for tasks like trail tracking and reaching in mice and the egg-laying behavior of drosophila, it has been applied to different tasks in rats, humans, fish species, bacteria, cheetahs, racehorses and other animals. The framework is based on a ResNet-50 architecture pretrained on ImageNet images of objects and animals. Figure 1c depicts the network architecture that DeepLabCut is built upon [10]. Figure 1 displays the workflow applied in Experiment 2. First, we recorded several videos of SCA3 and WT mice. For each video, we selected a region of interest (Fig. 1a). Afterwards, we defined the interesting body parts and landmarks to be tracked. Then, we extracted a total number of 44 frames across 3 different videos of one affected and two WT mice applying a k-means clustering algorithm to obtain diverse and representative frames.
Figure 1.
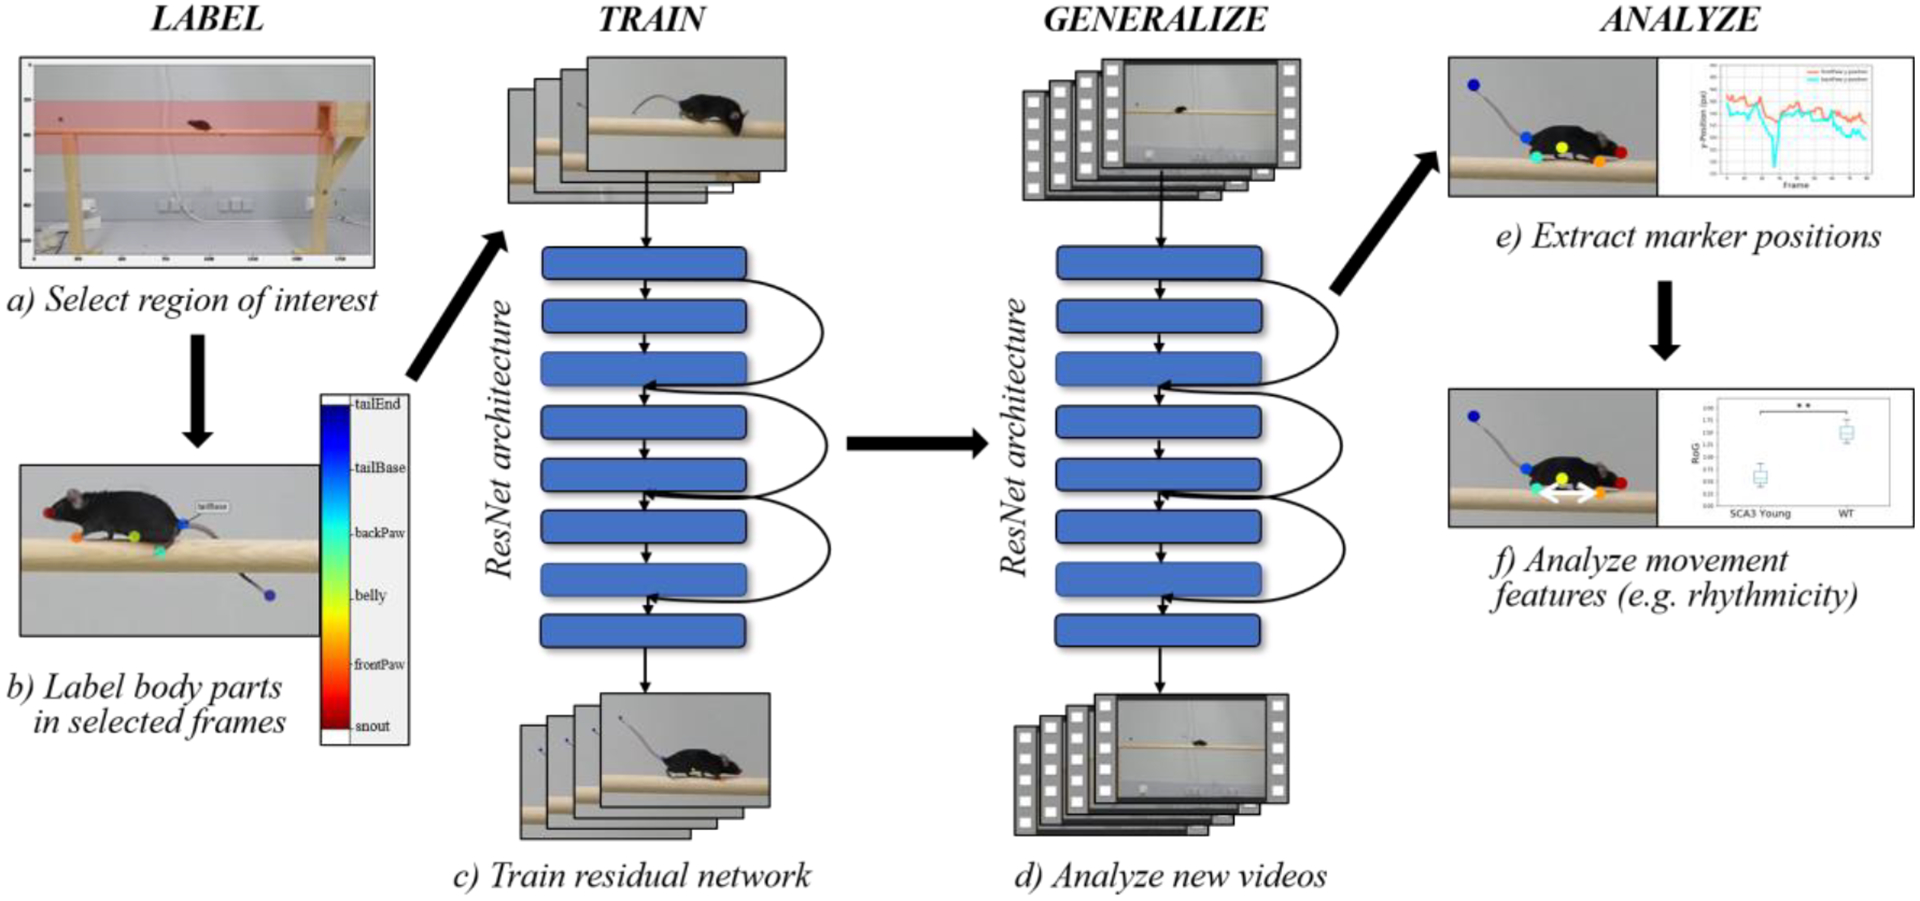
Workflow Applied in Experiment 2. Note: We increased the marker size for better visualization.
In the next step, we manually labeled the previously defined body parts in all extracted frames (Fig. 1b). Afterwards, the manually labeled frames were split into a training (41 frames) and a test (3 frames) dataset. We then trained the network on the training dataset utilizing the computational environment of Google Colaboratory (Colab) (https://colab.research.google.com), (Fig. 1c) with a batch size of 32 as recommended in the DeepLabCut methods paper [9]. Once the network converged, we evaluated the network on the test dataset and obtained the pixelwise train and test errors. With the ready-trained network, we analyzed every frame of the original videos. In Experiment 1, we then extracted outlier frames in an automated fashion and retrained the network on Colab. Next, we generated labeled videos based on the correctly labeled frames.
In the generalization phase, we applied the trained network to previously unseen videos of younger WT and SCA3 mice by directly analyzing these unseen videos without retraining (Fig. 1d). Finally, we extracted the identified marker positions for all videos and quantitatively analyzed movement features (Figure 1e–f).
III. Results
A. Experiment 1
In Experiment 1, we worked on previously recorded videos of WT and shaker rats. The shaker rat exhibits ataxic symptoms as well as tremor. These videos were recorded by the group of Stefan Pulst in the Department of Neurology at the University of Utah. The videos were recorded at a frame rate of 30 Hz during unrestricted movement in the cage (Figure 2).
Figure 2.
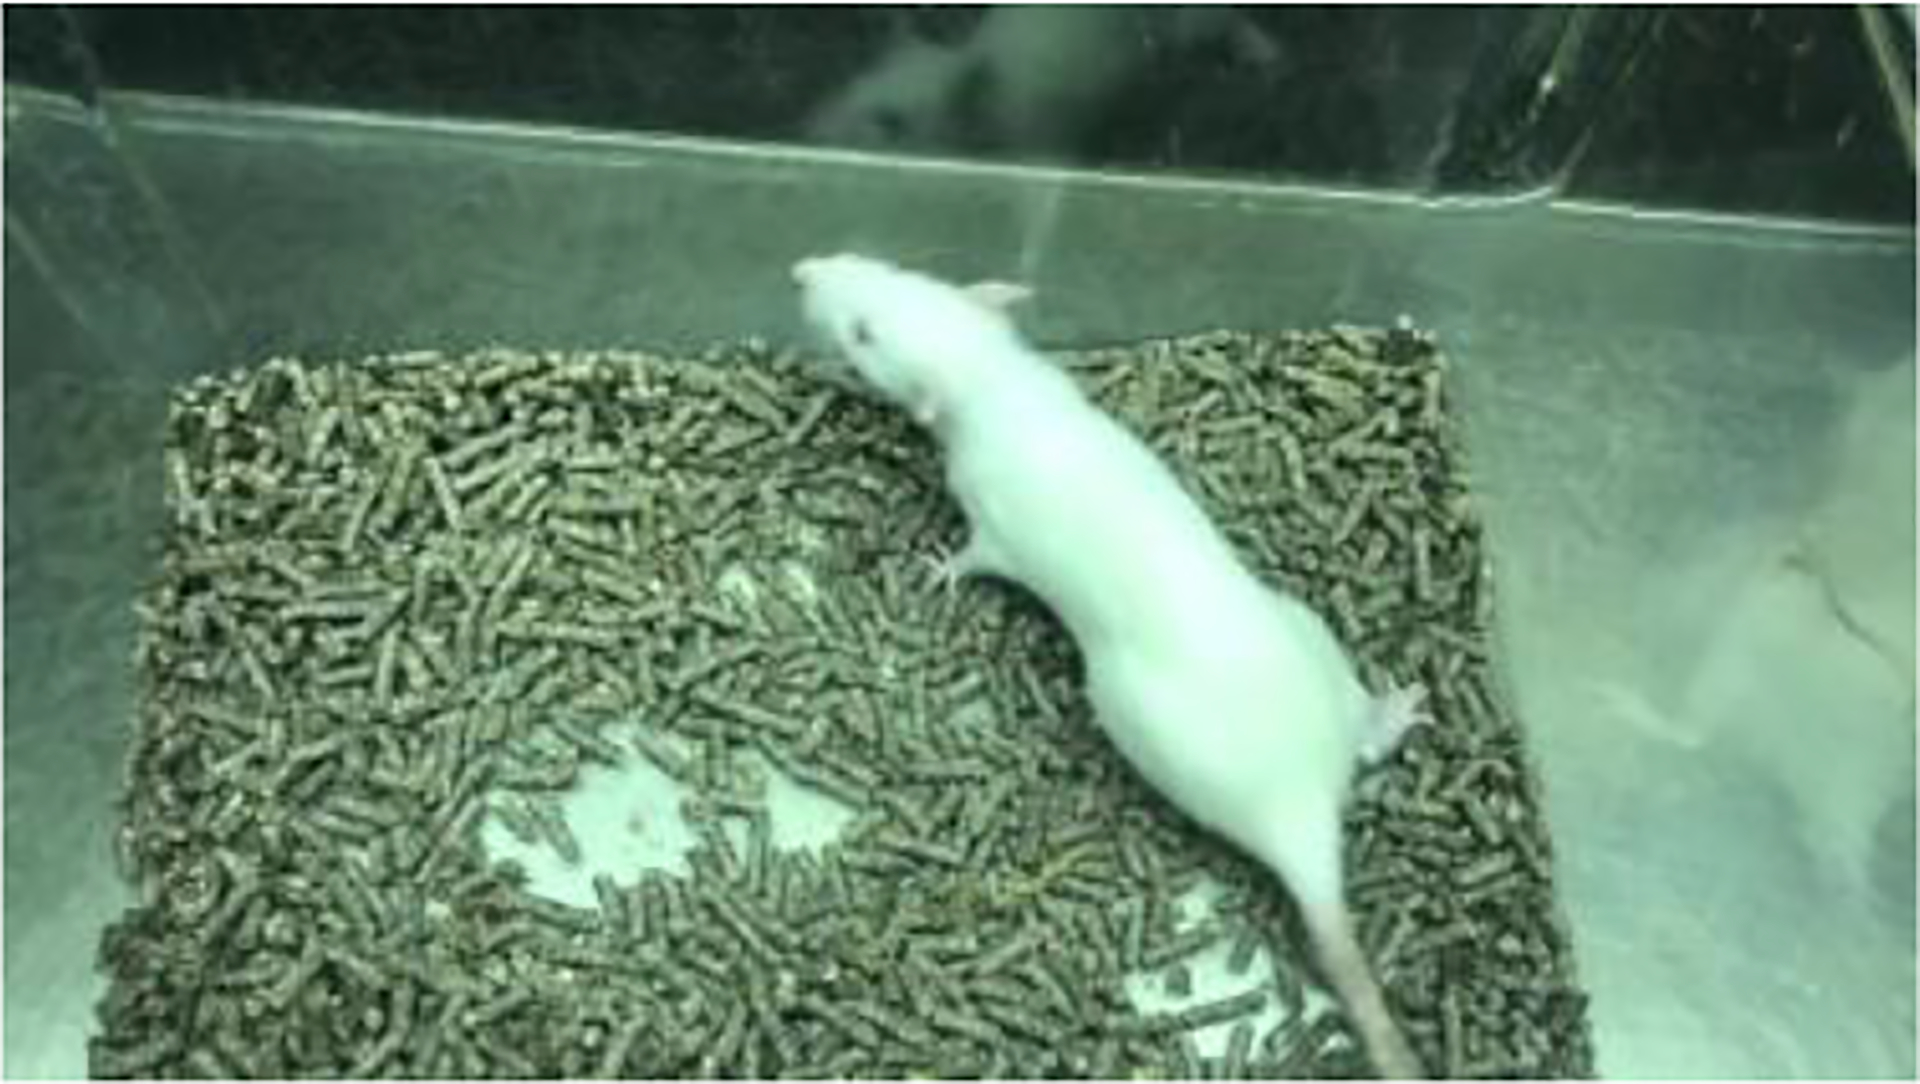
Cage Setup in the Rat Experiment.
The workflow applied in Experiment 1 mostly resembled the one presented in Figure 1. First, we defined relevant body parts that exhibit ataxic symptoms like tremor or motor disorders (Figure 3).
Figure 3.
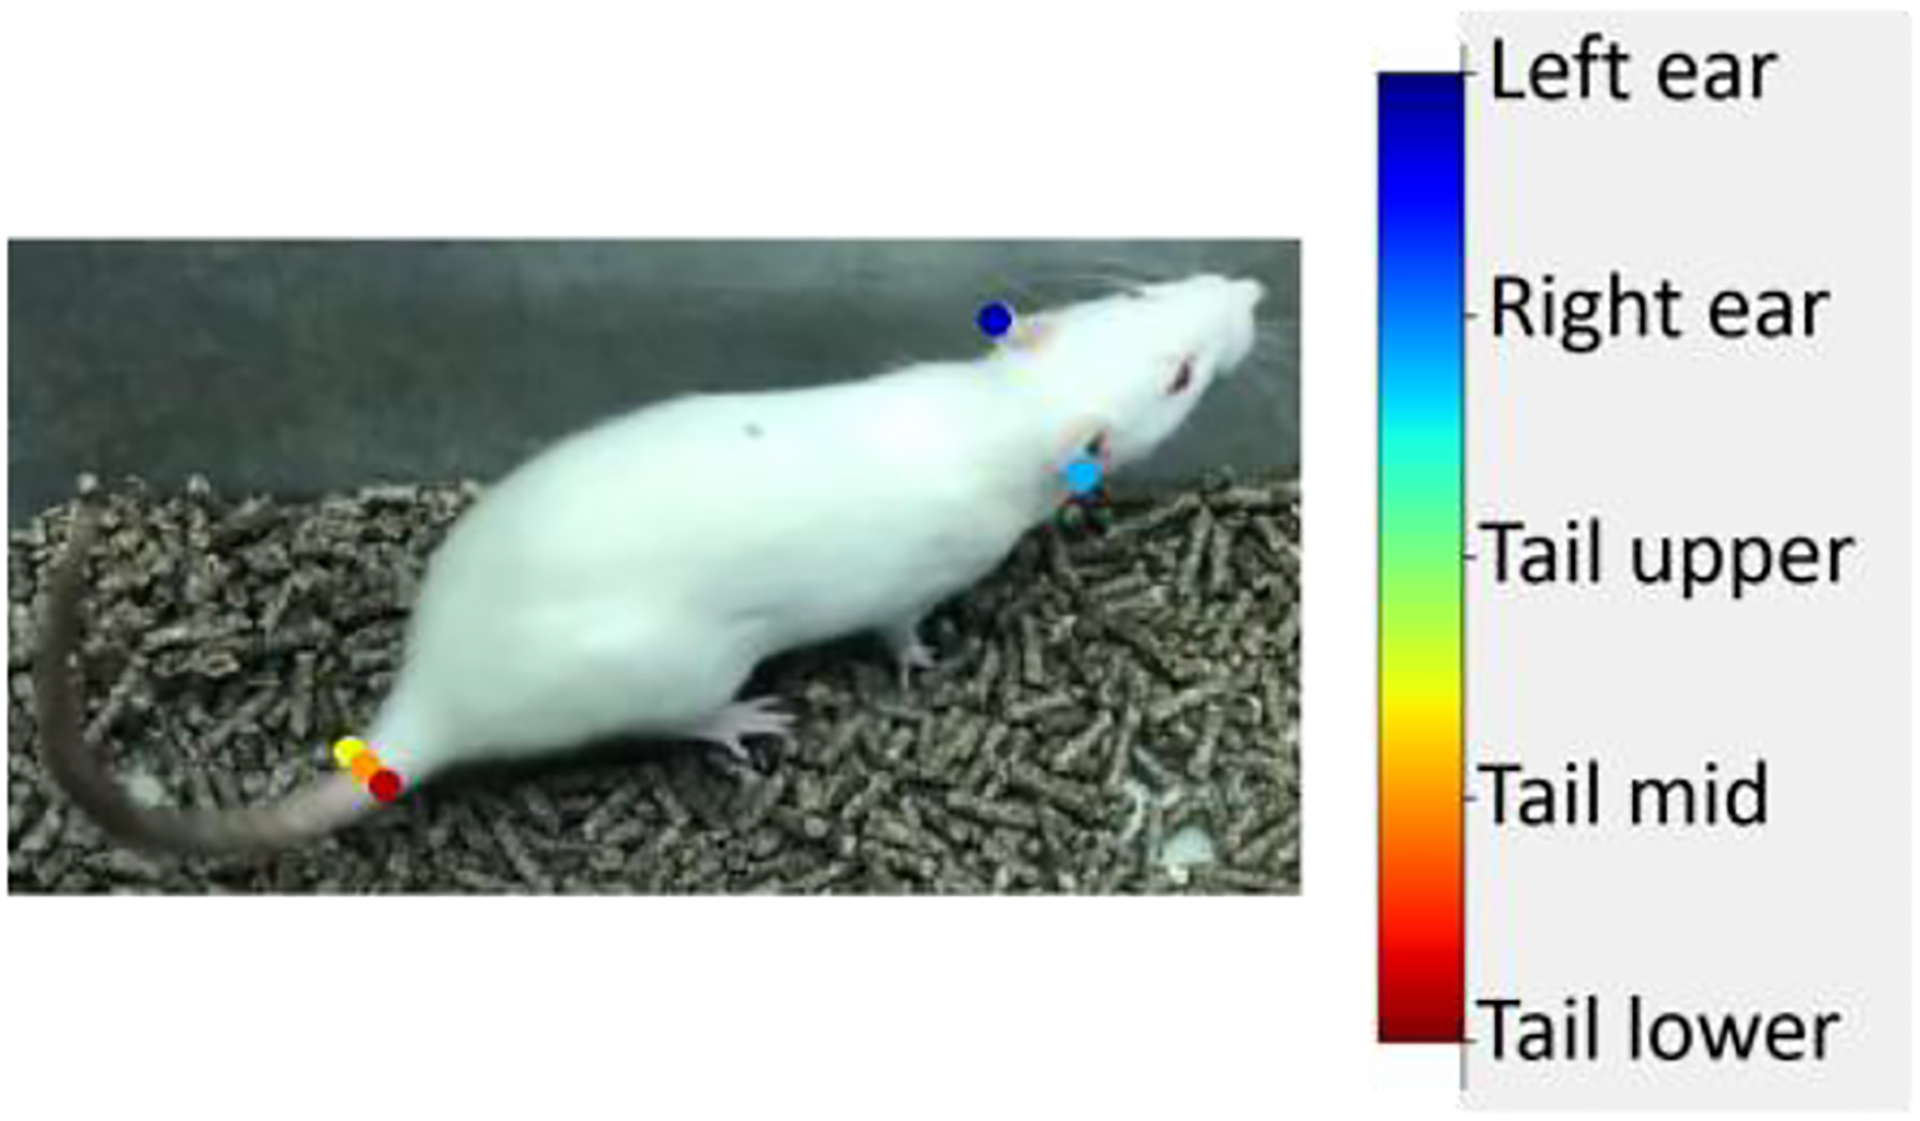
Selected Body Parts in the Rat Experiment. We selected the position of the right and left ear and defined three markers describing the tail position of the rat. Note: We increased the marker size for better visualization.
Afterwards, we extracted characteristic frames using the k-means algorithm and chose a region of interest which included the entire rat cage. We manually labeled the selected body parts in 80 frames, split the data into train (76 frames) and test set (4 frames) and trained on Colab for 20,000 iterations. The network was again initialized with weights pretrained on ImageNet data. After 20,000 iterations we obtained a train error of 5.82 pixels and a test error of 8.84 pixels. However, when analyzing the videos, we detected several errors where the network confused the rat’s eye for an ear (Figure 4). This might hint that the network learned the similar color of these body parts. We also identified some outliers where the network incorrectly interchanged the position of the markers on the tail. Due to these shortcomings, we extracted 40 outliers and refined the markers in these specific frames. We only corrected a representative subset of the eye-ear confusion errors and the tail-interchange errors. Next, we merged the training datasets and created a new training iteration. This time, we initialized the network weights with the weights learned in the previous iteration (snapshot 20,000).
Figure 4.
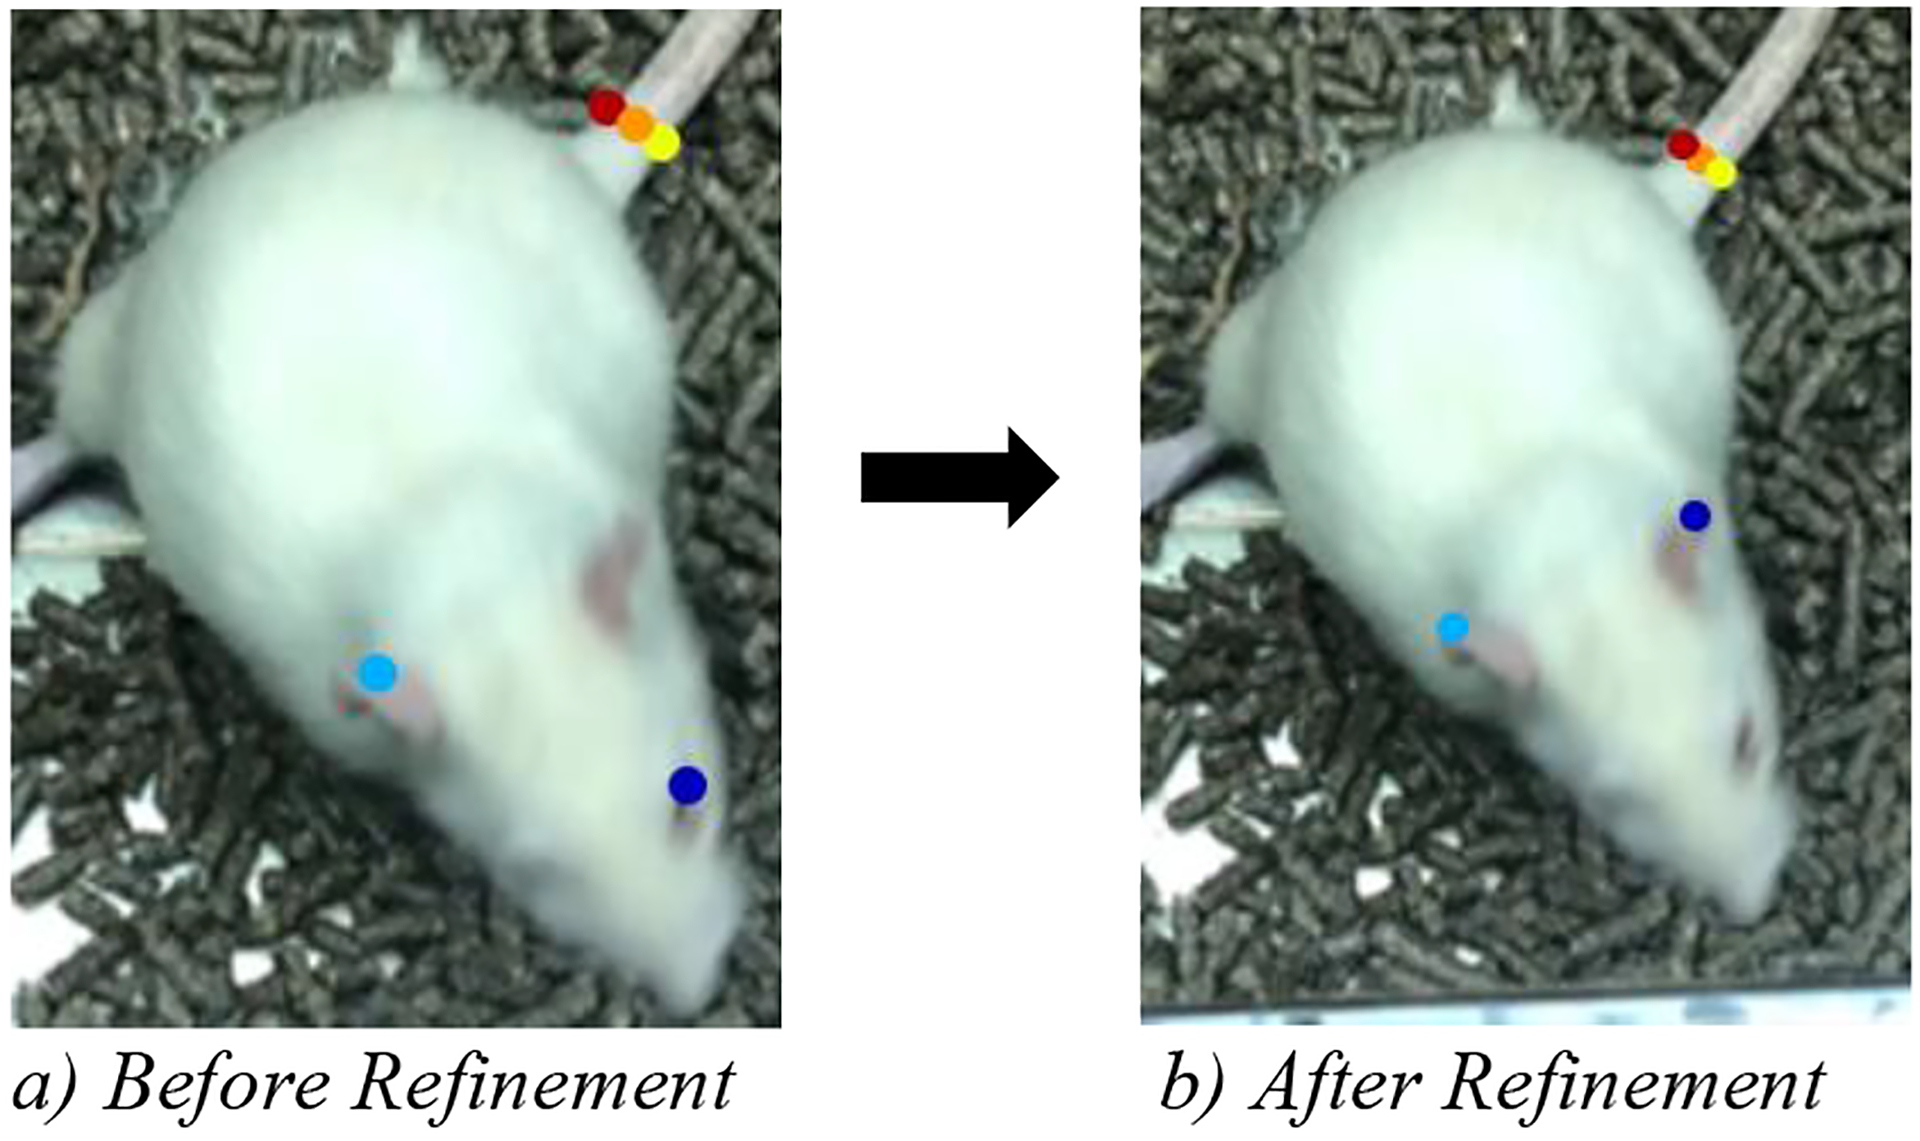
Ear-Eye Confusion of the Rat Network. Note: We increased the marker size for better visualization.
With the refined frames included in the new training dataset, we were able to bring the loss down from 0.0044 at the beginning of training to 0.0029 after iteration 22,000. We stopped training when we observed an increase of the train loss, extracted the snapshot that demonstrated the lowest loss and evaluated the network. We obtained a train error of 3.82 pixels and a test error of 7.41 pixels. When visually assessing the accuracy of the applied body part tracking, we found a very accurate representation across all frames.
In the next step, we extracted the marker positions to analyze body posture. First, we visually identified time intervals of 30 frames without steps. Next, we conducted a discrete Fourier transformation utilizing the Fast-Fourier Transformation (FFT). We applied a Hanning window to smooth values at the beginning and at the end of the 30-frame no-step sequence. The results of the FFT analysis are displayed in Figure 5 in comparison to the FFT spectrum for the identification of the shaker frequency based on force plate measurements [11]. Keeping in mind that we selected 30-frame intervals without any steps, we would expect a rather smooth curve without higher peaks. The WT rat demonstrates no deviation from this assumption. The shaker rat, however, exhibits a higher peak around a frequency of 4–5 Hz. This frequency has been identified as the tremor frequency by Anderson et al. [11] meaning that this frequency represents motion in the mediolateral axis as opposed to motion in the sagittal axis which would describe a forward or backward movement.
Figure 5.
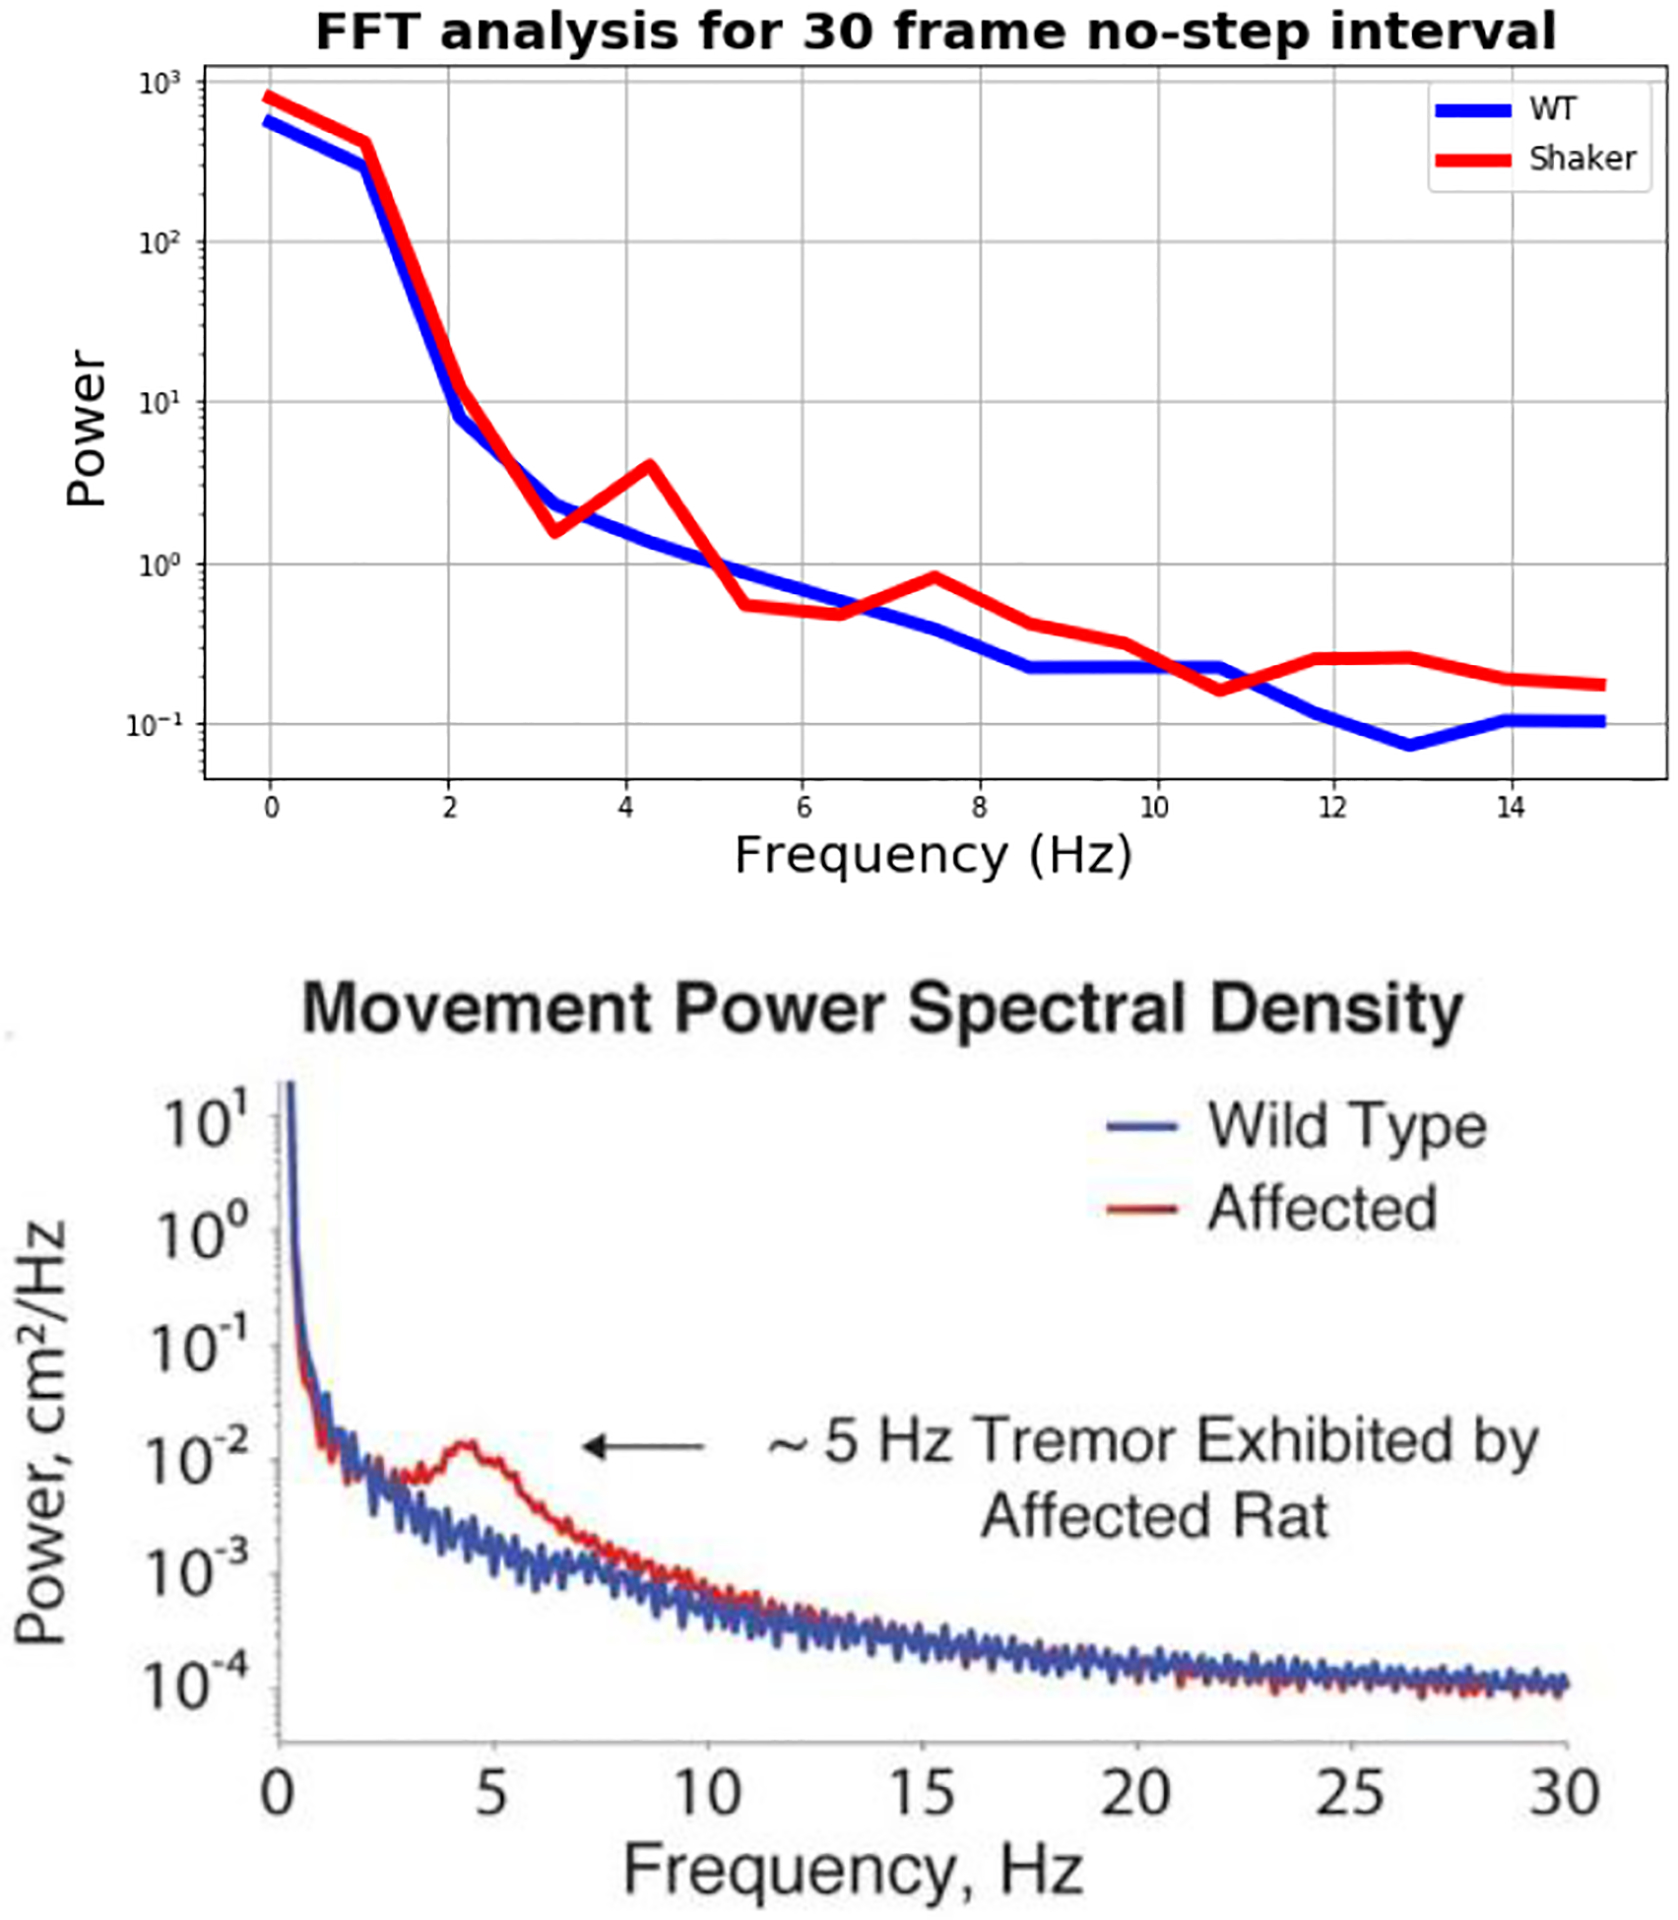
FFT Analysis for 30 Frame No-Step Interval in Comparison to the FFT Spectrum for the Identification of the Shaker Frequency Based on Force Plate Measurements (Printed with Permission) [11].
B. Experiment 2
1). Beam walking
For Experiment 2, we recorded videos of nine mice performing the beam walking balance task [12]. We utilized a wooden beam (with a length of 112 cm and a diameter of 2.5 cm). The camera (Panasonic Lumix Z91) was installed frontally to the beam in a distance of 110 cm. The videos were recorded with a frame rate of 30 Hz.
The beam walking task has been suggested to be particularly useful for detecting subtle deficits in motor skills and balance that may not be detected by other motor tests [13, 14]. In this task, the mouse is positioned on a beam and then has to walk towards a wooden box placed at one end of the beam (Figure 6). Measurements commonly determined in earlier studies include the time taken to cross the beam and the number of paw faults or slips. We recorded trials after a short habituation phase [13, 14].
Figure 6.
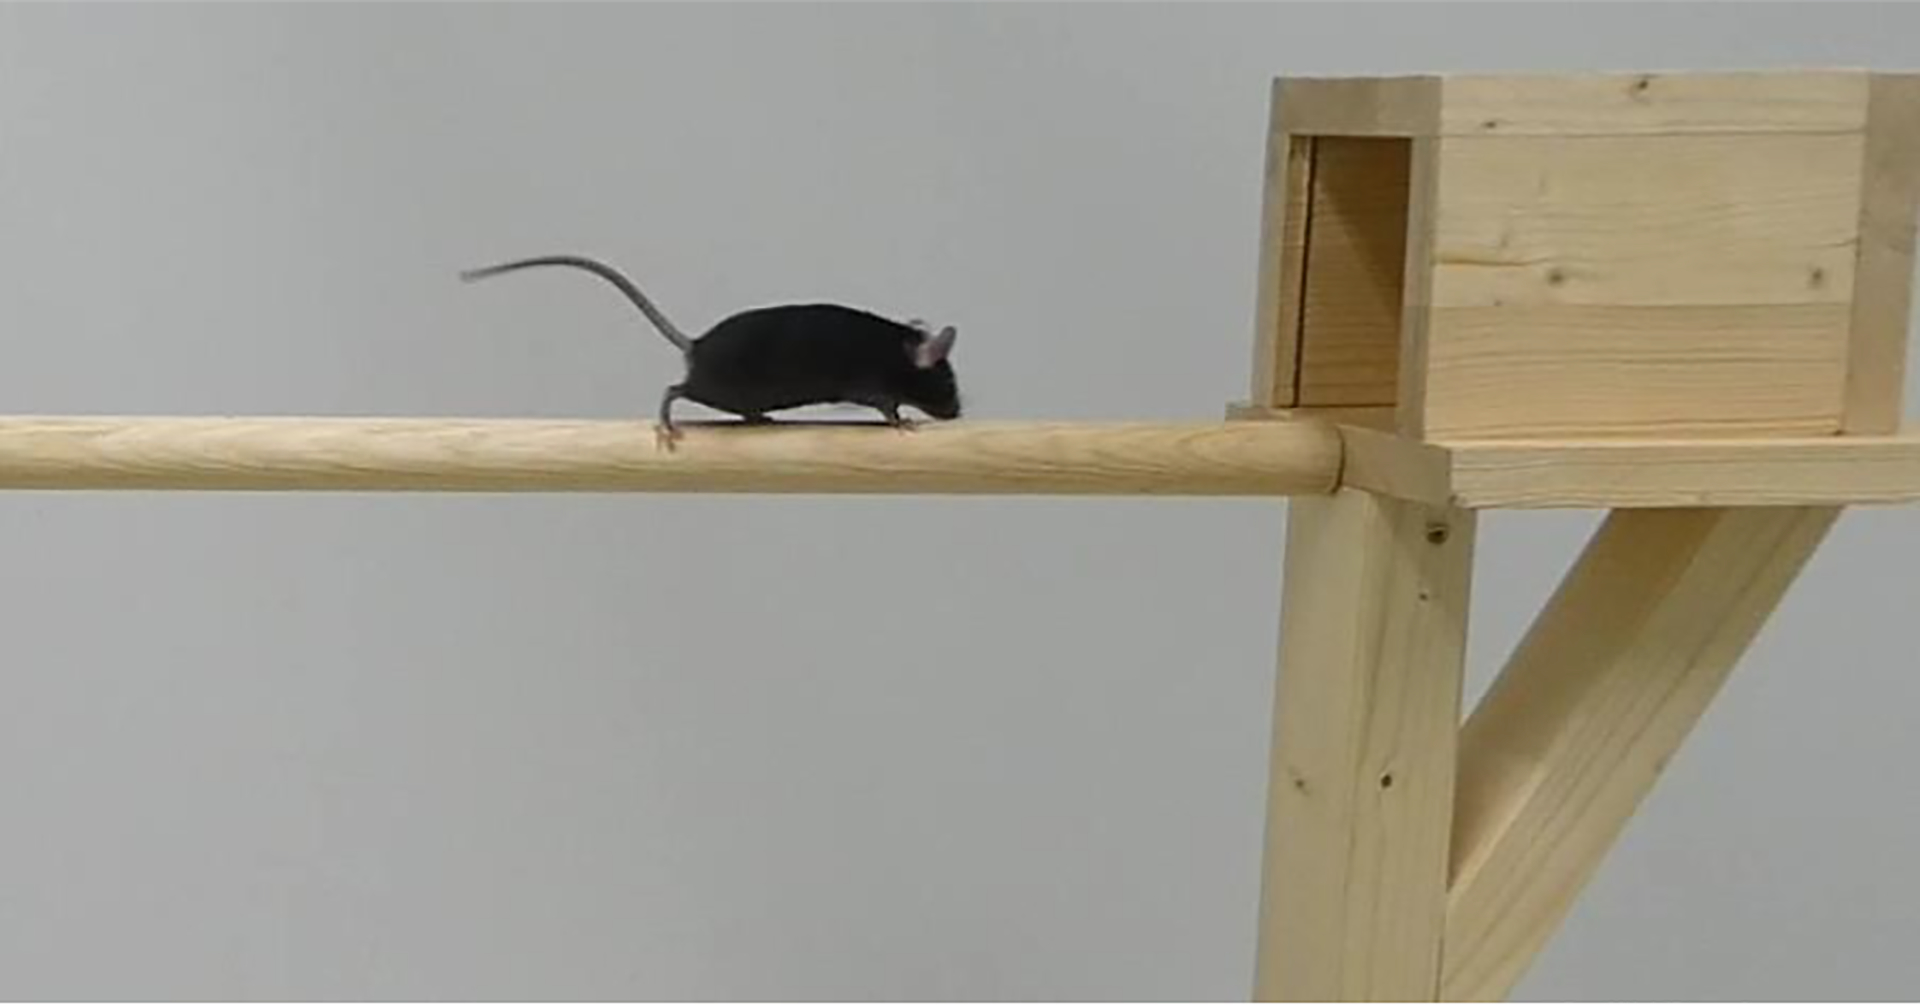
Beam Walk Setup.
2). Training the network
For Experiment 2, we recorded videos of SCA3 and WT mice performing the beam walking task, following the workflow explained in Figure 1. Table 1 displays the train loss for a specified number of iterations and the learning rate being applied. We started training with a learning rate of 0.005 and increased to 0.02 after 10,000 iterations. Table 1 also specifies the post hoc observed error in the train and test frames measured in pixels.
TABLE I.
Training Progress of the Mouse Network.
| Number of Iterations | Train Loss | Learning Rate | Train Error (in pixels) | Test Error (in pixels) |
|---|---|---|---|---|
| 1,000 | 0.0115 | 0.005 | 11.57 | 32.31 |
| 2,000 | 0.0090 | 0.005 | 6.4 | 4.97 |
| 5,000 | 0.0062 | 0.005 | 4.96 | 4.44 |
| 10,000 | 0.0050 | 0.005 | 3.97 | 4.48 |
| 15,000 | 0.0042 | 0.02 | 3.43 | 4.48 |
| 20,000 | 0.0038 | 0.02 | 2.38 | 4.58 |
| 22,000 | 0.0031 | 0.02 | 2.2 | 4.4 |
Figure 7 illustrates the generalization capabilities of the network. It shows that the determination of the marker positions for the mouse in Fig. 7b which was never encountered during training and which exhibited a higher body weight, is as accurate as the determination for the lighter-weighted mouse in Fig. 7a which was seen during training.
Figure 7.
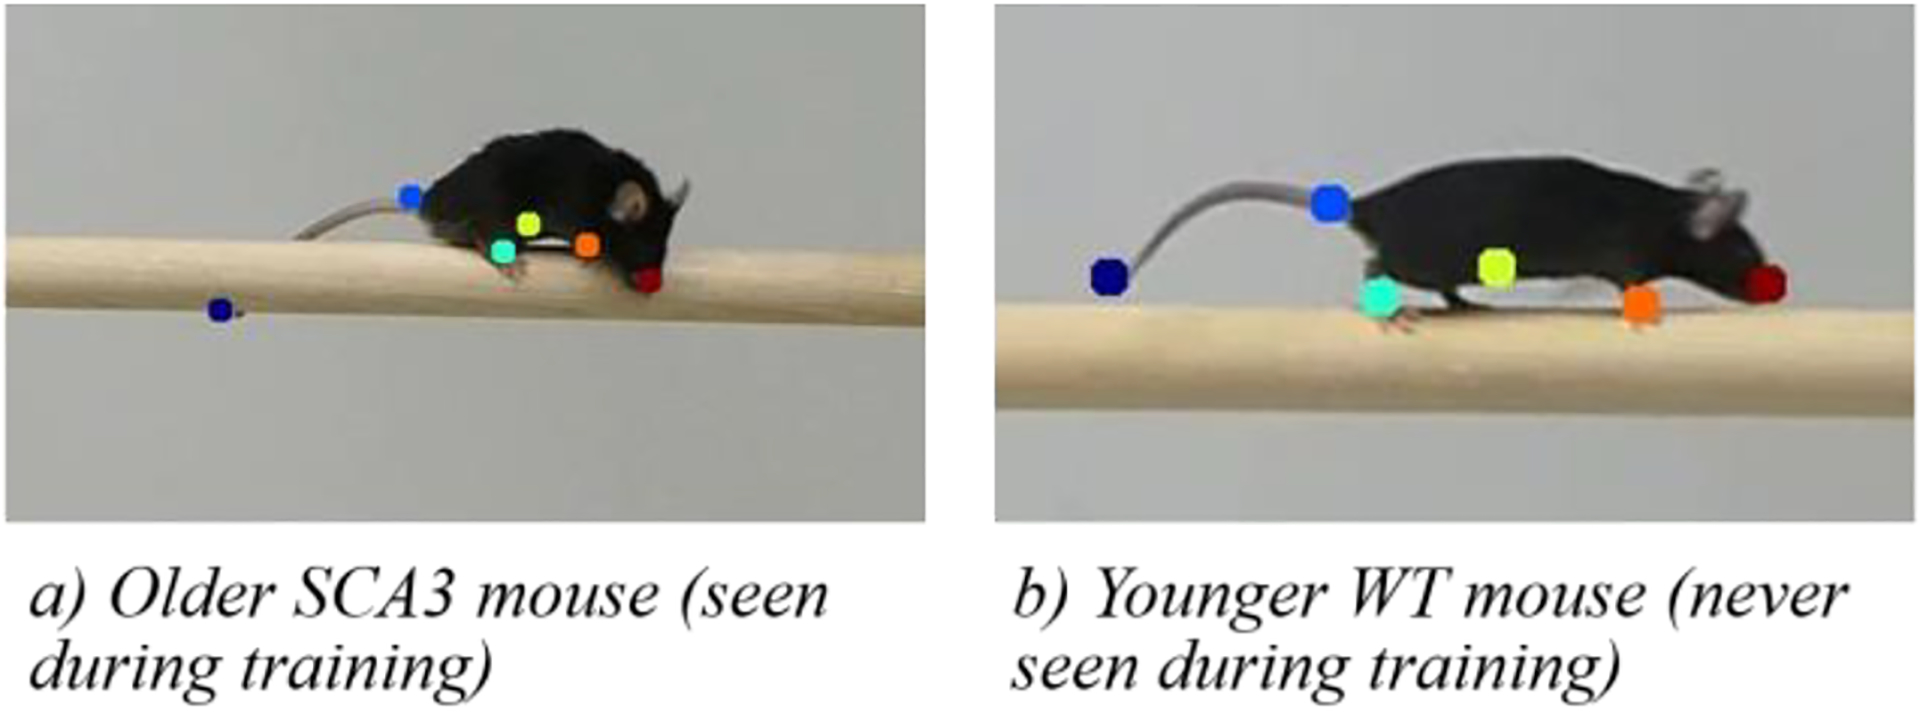
Generalization Capabilities of the Network. Note: We increased the marker size for better visualization.
3). Analyzing marker trajectories
First, we investigated the vertical belly position of WT and SCA3 mice. Visual judgement of the recorded videos suggested a lower belly posture in older SCA3 mice than in WT mice. There was, however, no visual difference between younger SCA3 and WT mice.
Therefore, we extracted the vertical belly position from the tracked data and plotted the trajectories of all genotypes and conditions over a time interval of 60 frames, measured in pixels (Figure 8). The y-axis is plotted in an inverted manner to justice to the pixel alignment in the video, having pixel 1 at the top left corner and increasing to the right and to the bottom. The figure shows that, as expected, the belly position of the older SCA3 mice lies below the belly position of the WT mice. Interestingly, the belly posture of the milder-affected, younger SCA3 mice lies in between the younger WT mice and the older SCA3 mice, suggesting that there already is a slight difference in body posture between the younger WT and the younger SCA3 mice.
Figure 8.
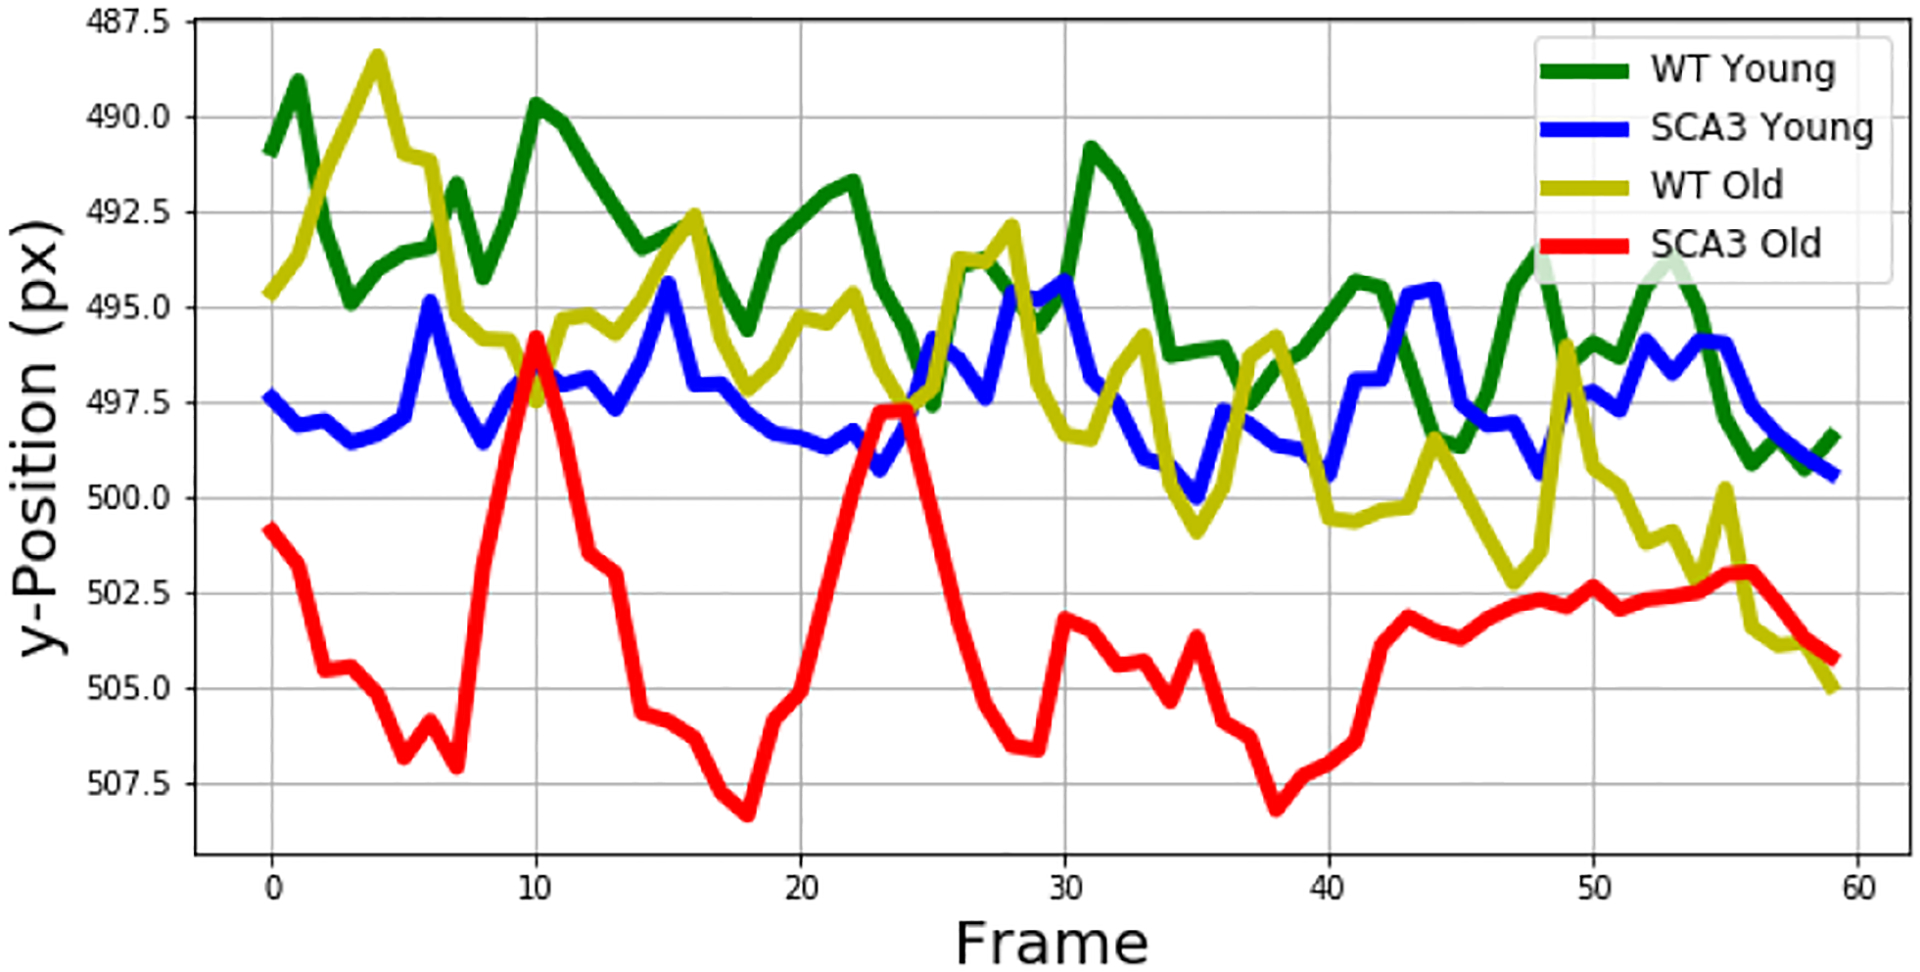
Vertical Belly Position over 60 Frames for both Age Groups.
We conducted a similar analysis to compare the vertical tail tip position, because we were able to observe a higher and more consistent position of the tail tip in the older WT mice compared to age-matched SCA3 mice. For the younger-aged mice, we observed more tail movement in general without clear distinction between WT and SCA3 mice. Analysis of the tail tip position over 60 frames demonstrated a higher vertical tail tip position of the WT mice as opposed to the younger SCA3 mice (Figure 9).
Figure 9.
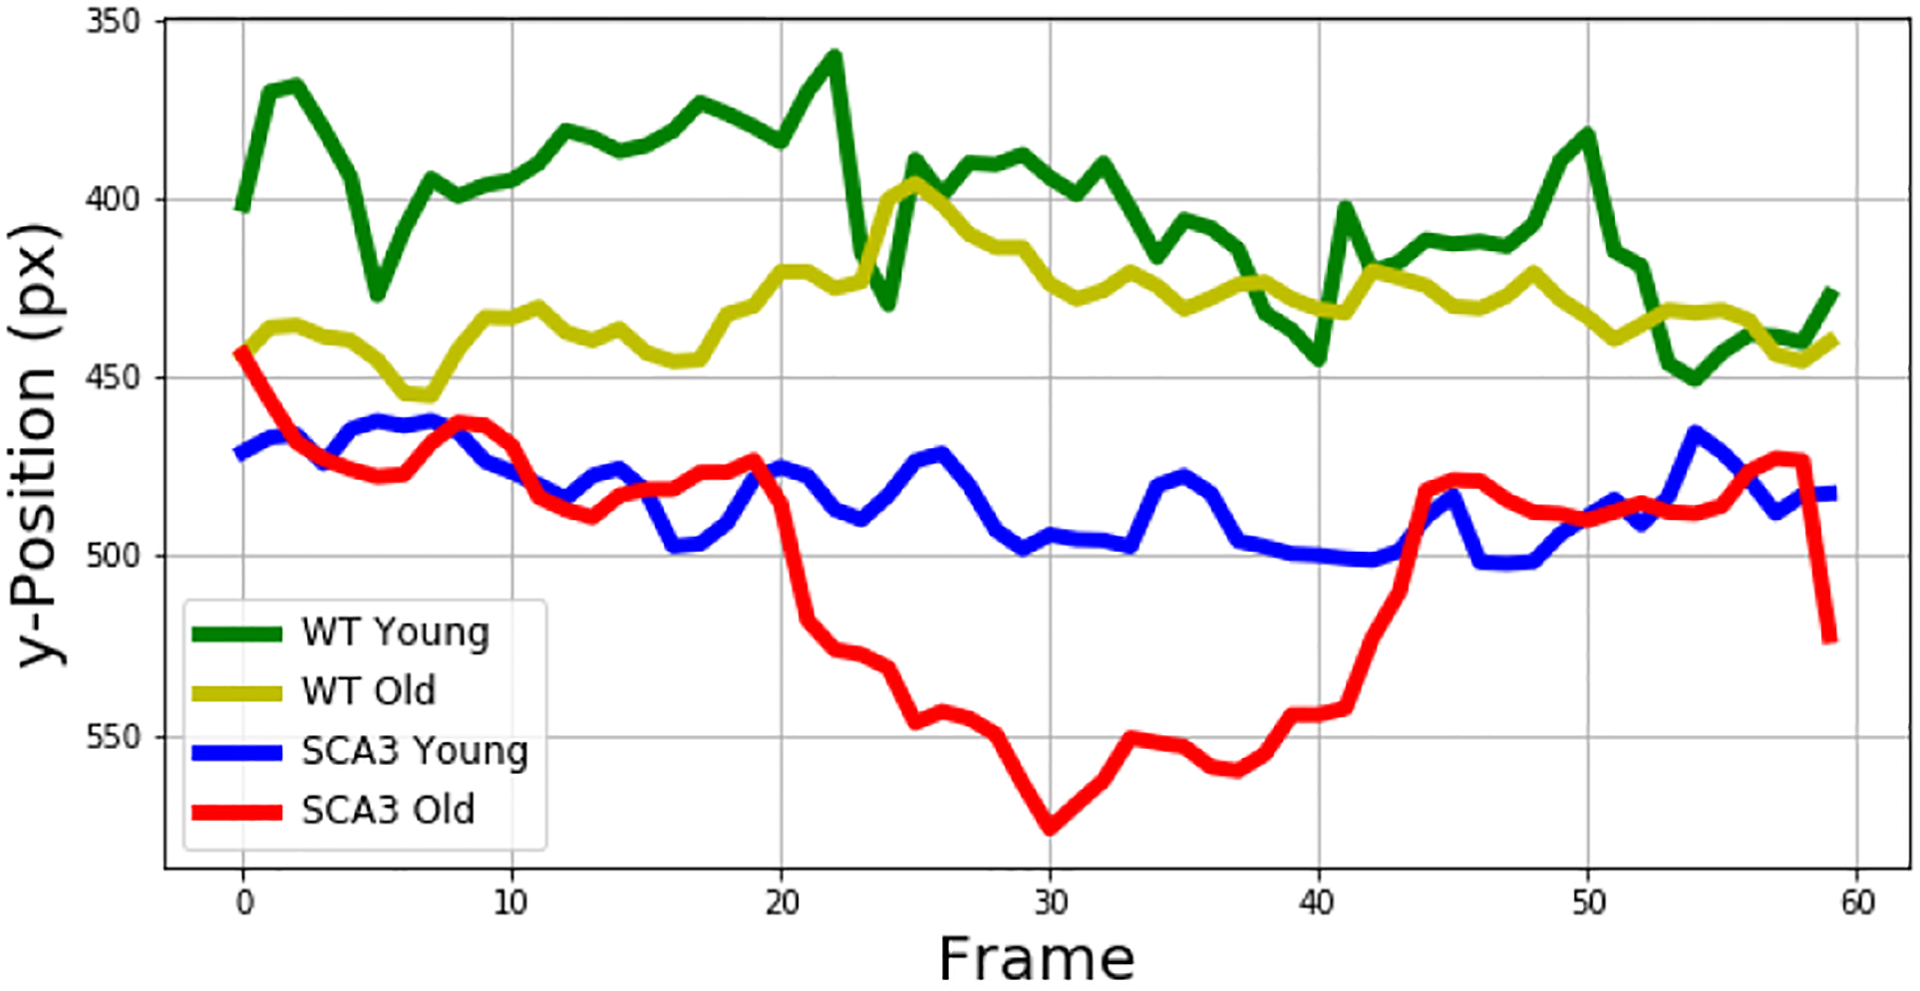
Vertical Tail Tip Position over 60 Frames for both Age Groups.
To extract gait parameters in WT and SCA3 mice, we first trimmed the videos and only kept sequences with straight movements on the beam comprising at least 3 subsequent steps. We then extracted the marker position of the right front and back paw.
Figure 10 shows the vertical front and back paw position for WT and SCA3 mice over a time interval of 80 frames. While the paw movement of the older WT mice does not demonstrate any anomalies, the older SCA3 mice show outliers in the vertical position of the back paws. Considering the inverted y-axis, downward-facing peaks represent lower positions in the video. Manual reconciliation with the recorded videos unveiled slips as the cause for these conspicuities (Figure 11). Neither the younger WT mice nor the younger SCA3 mice demonstrated similar anomalies hinting at the occurrence of slips.
Figure 10.
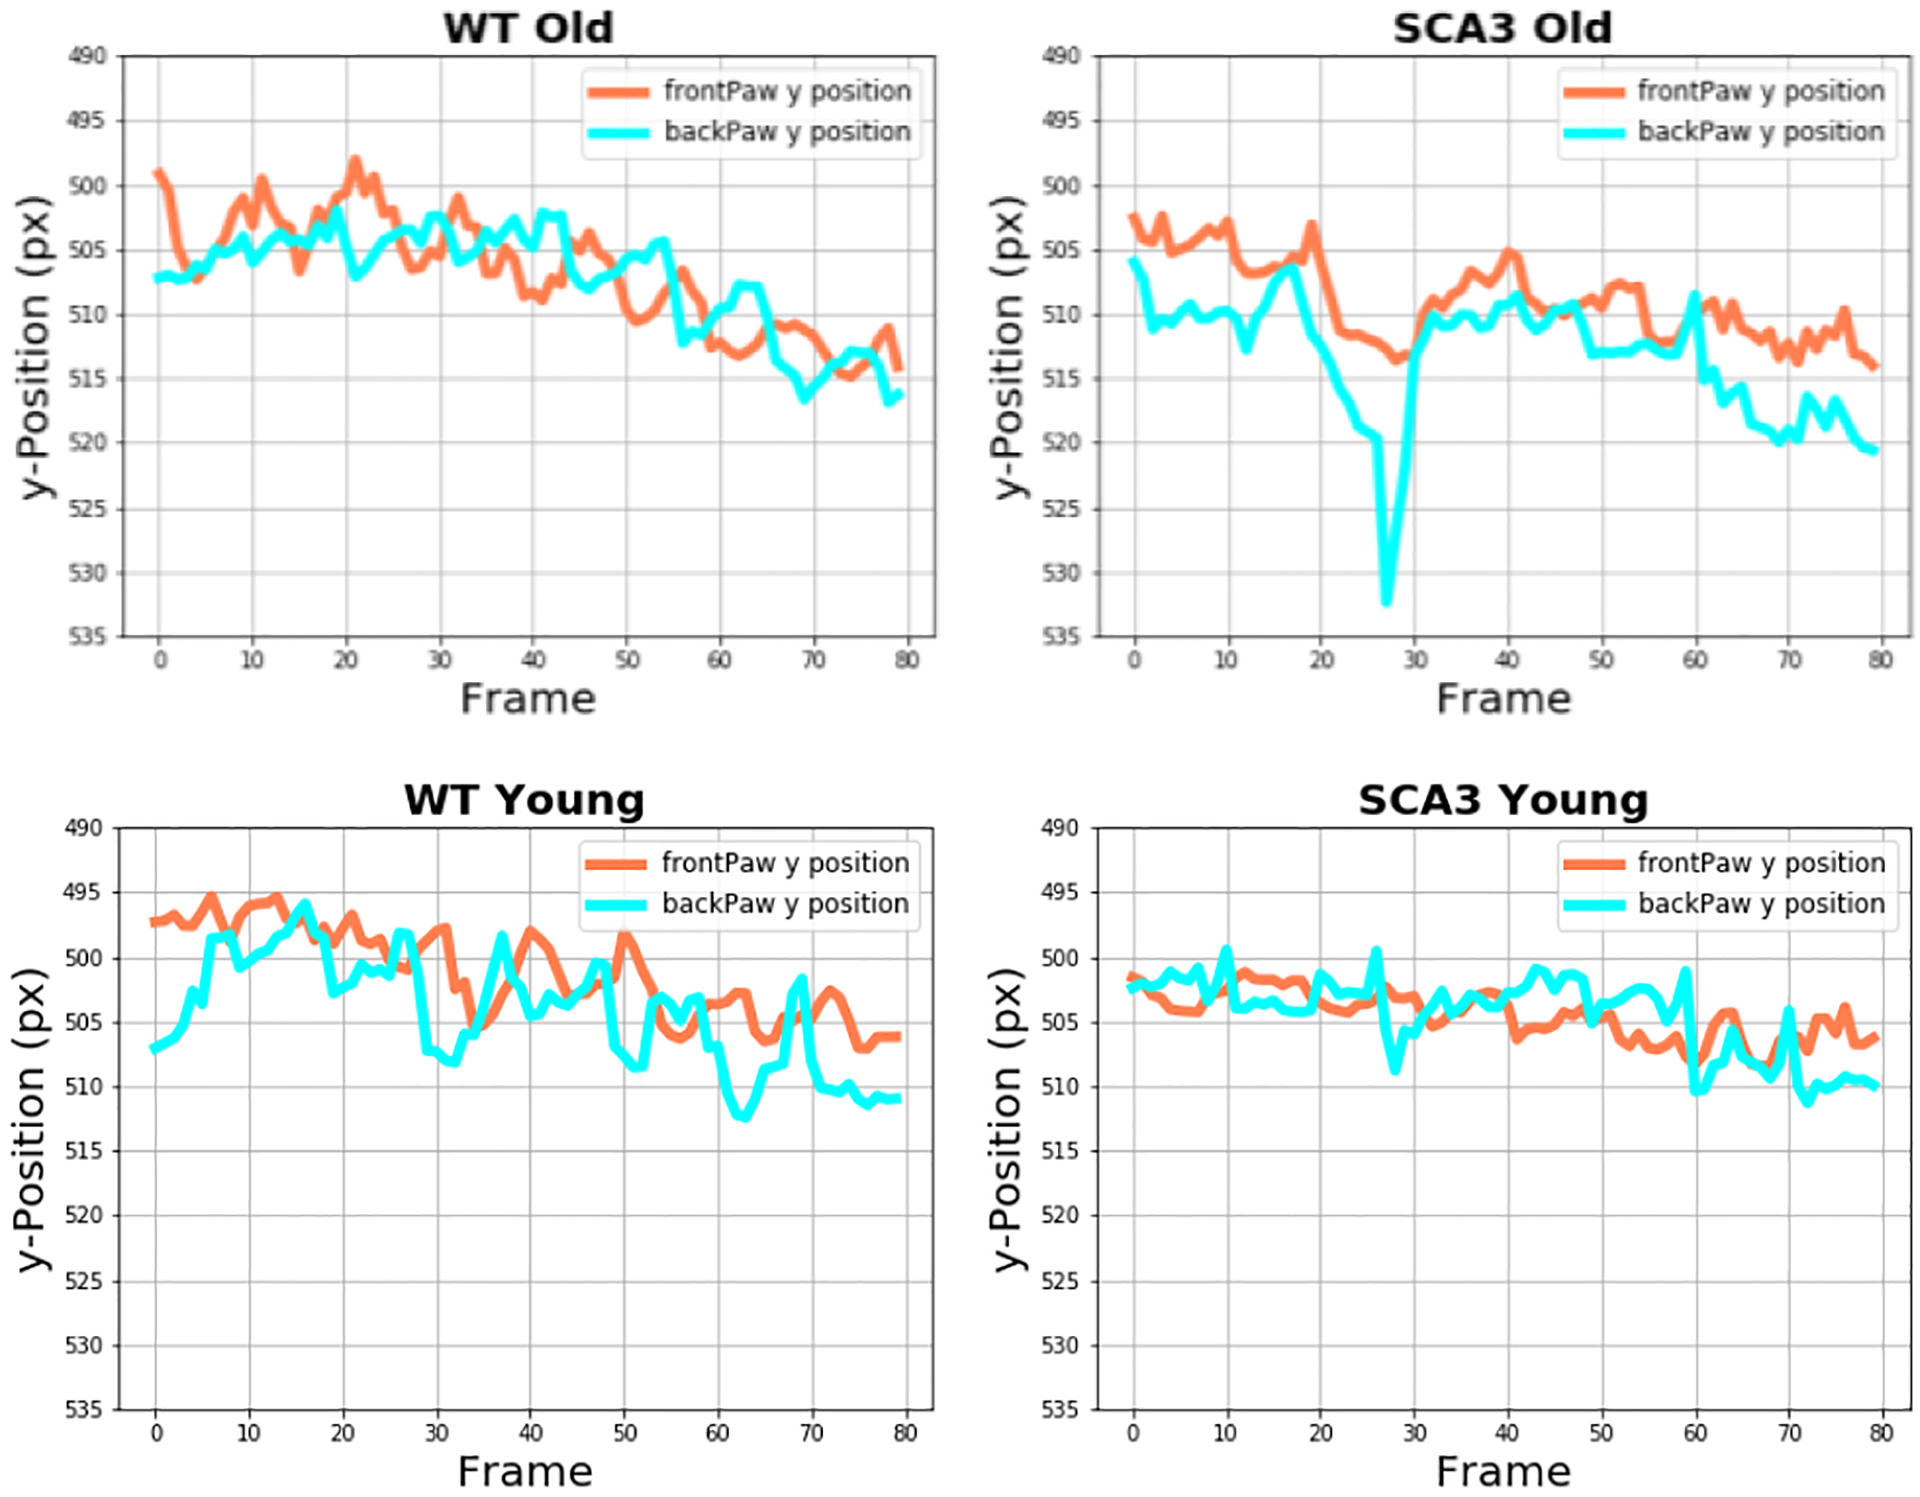
Vertical Paw Position in WT and SCA3 Mice.
Figure 11.

Generated Marker Trajectories of the Right Back Paw Exhibiting Slips.
4). Quantifying the rhythmicity of gait patterns
To further investigate gait abnormalities in the recorded mice, we looked at rhythmicity of the stride patterns, represented as the change in paw distance (pd) between front and back paw over time (1), (Figure 12).
| (1) |
Figure 12.

Quantification of the rhythmicity of gait pattern determined by the changing difference between front (orange dot) and back paw (green dot) positions. Note: We increased the marker size for better visualization.
fp_xf: horizontal front paw position at frame f
bp_xf: horizontal back paw position at frame f
fp_yf: vertical back paw position at frame f
bp_yf: vertical back paw position at frame f
Figure 13 depicts paw distance measures for WT and SCA3 mice plotted over a time interval of 80 frames. This measure is aimed at capturing slips as well as changes in leg coordination between front and back paw.
Figure 13.
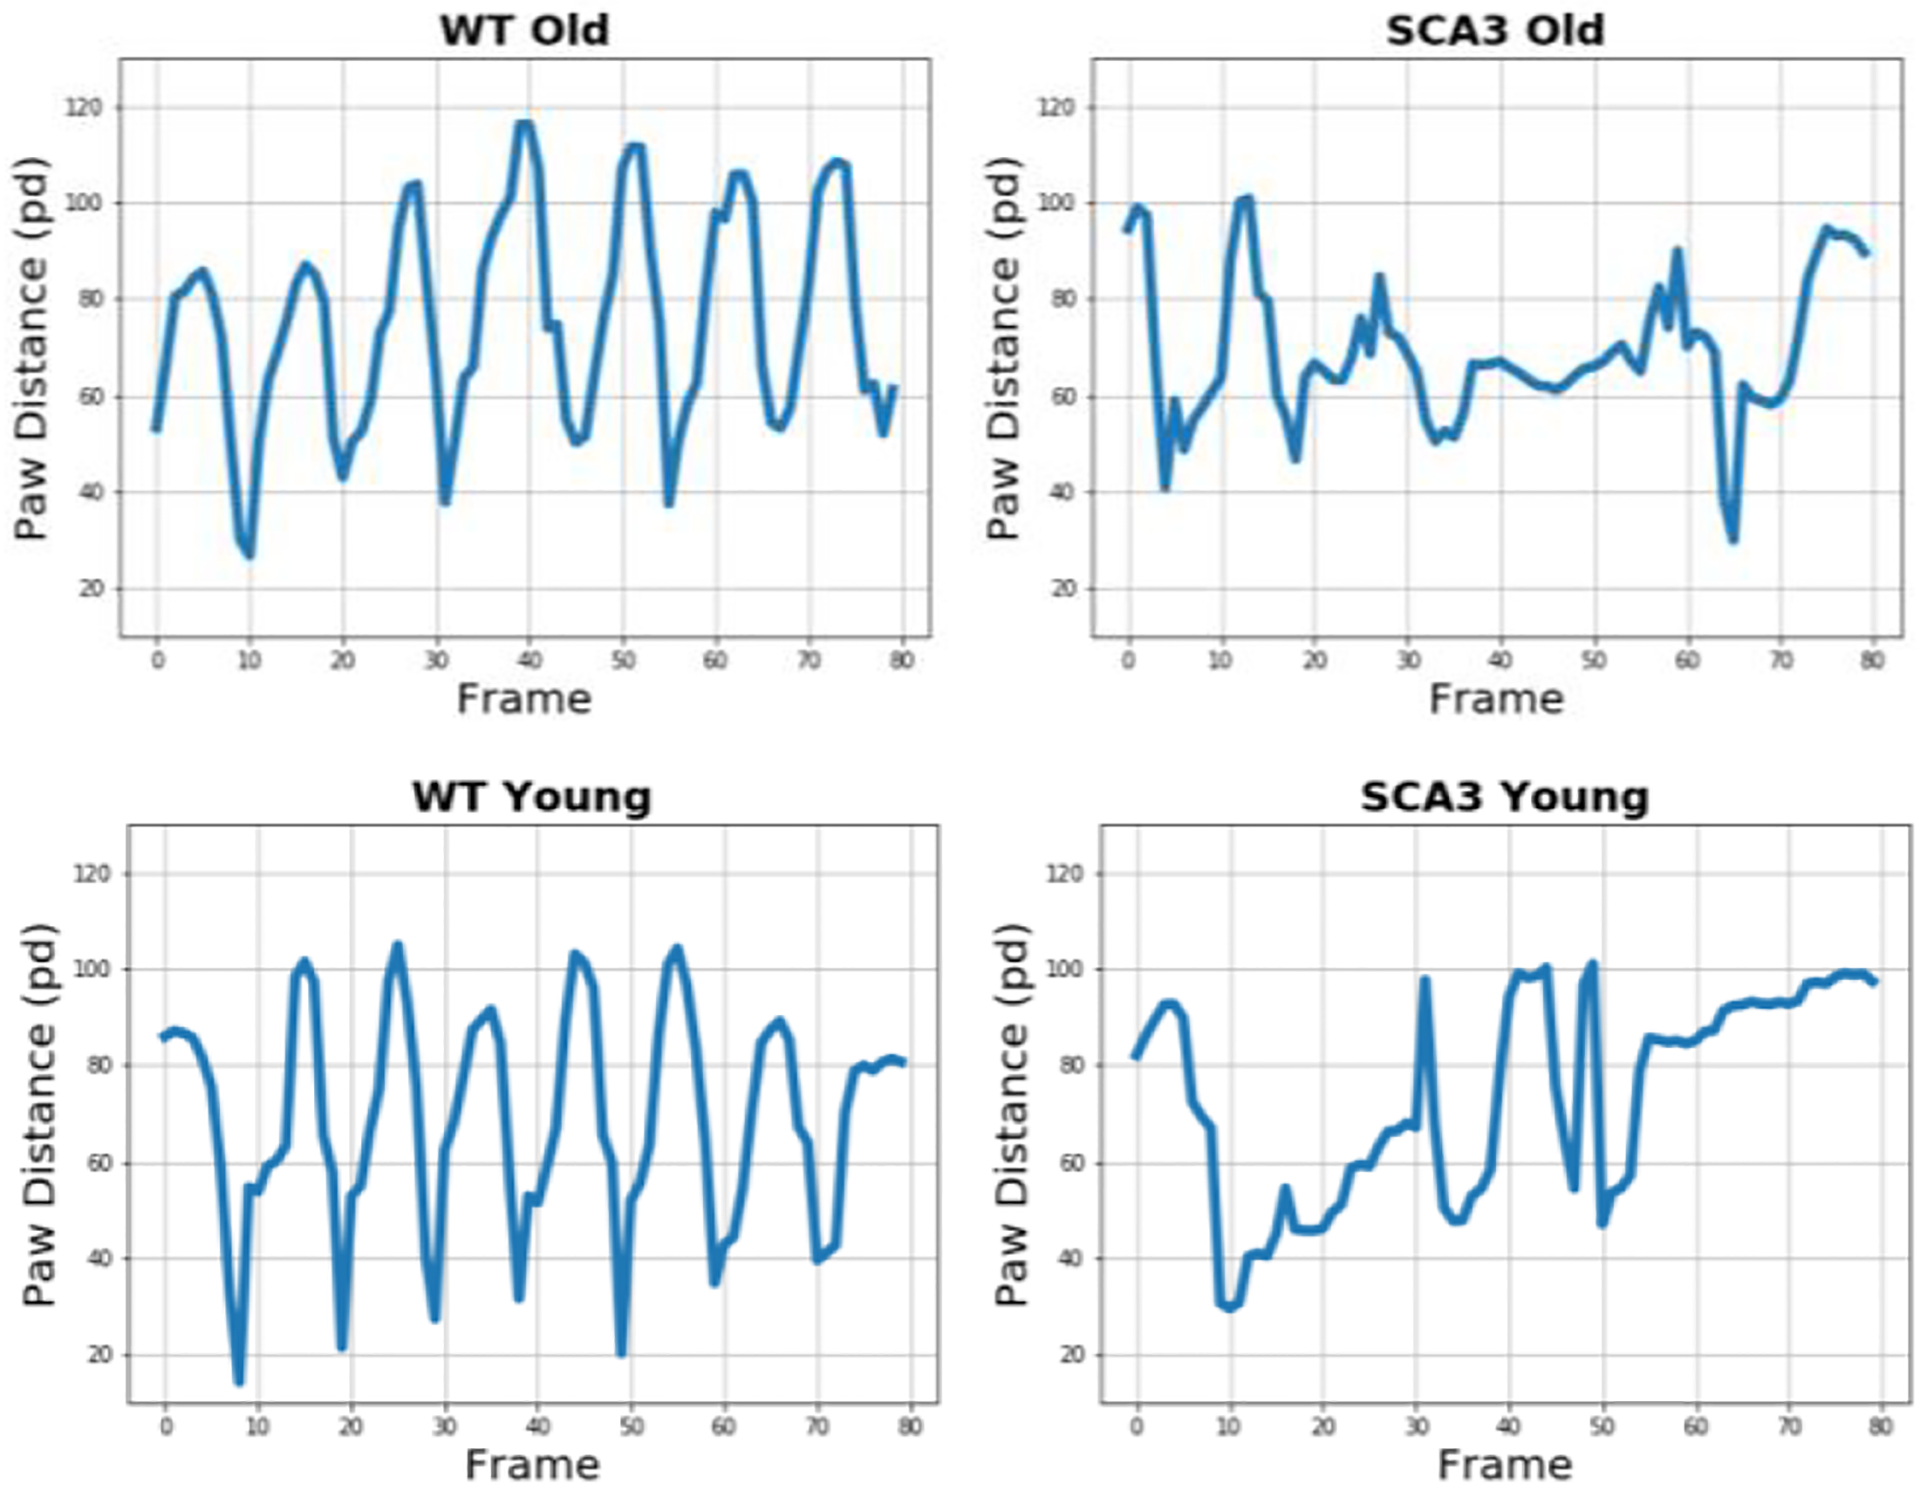
Leg Coordination Patterns in WT and SCA3 Mice.
Visual assessment of the gait patterns indicates more rhythmic steps in WT mice than in older as well as younger SCA3 mice. Taking the total absence of anomalies in the trajectories of the vertical front and back paw position in younger SCA3 mice into account, this is an interesting observation.
To quantitatively assess the rhythmicity of gait pattern, we conducted an FFT analysis applying a Hanning window to smooth any discontinuities at the beginning and at the end of the sequences. Figure 14 plots the energy of the stride sequence against the frequency. We investigated frequencies up to 15 Hz having recorded the videos at a frame rate of 30 frames per second. An ideal rhythmic gait pattern would exhibit one initial peak at the stride frequency and then rest at a minimal energy level without further fluctuations. Visual judgement indicates a more harmonic waveform in the younger and older WT mice.
Figure 14.
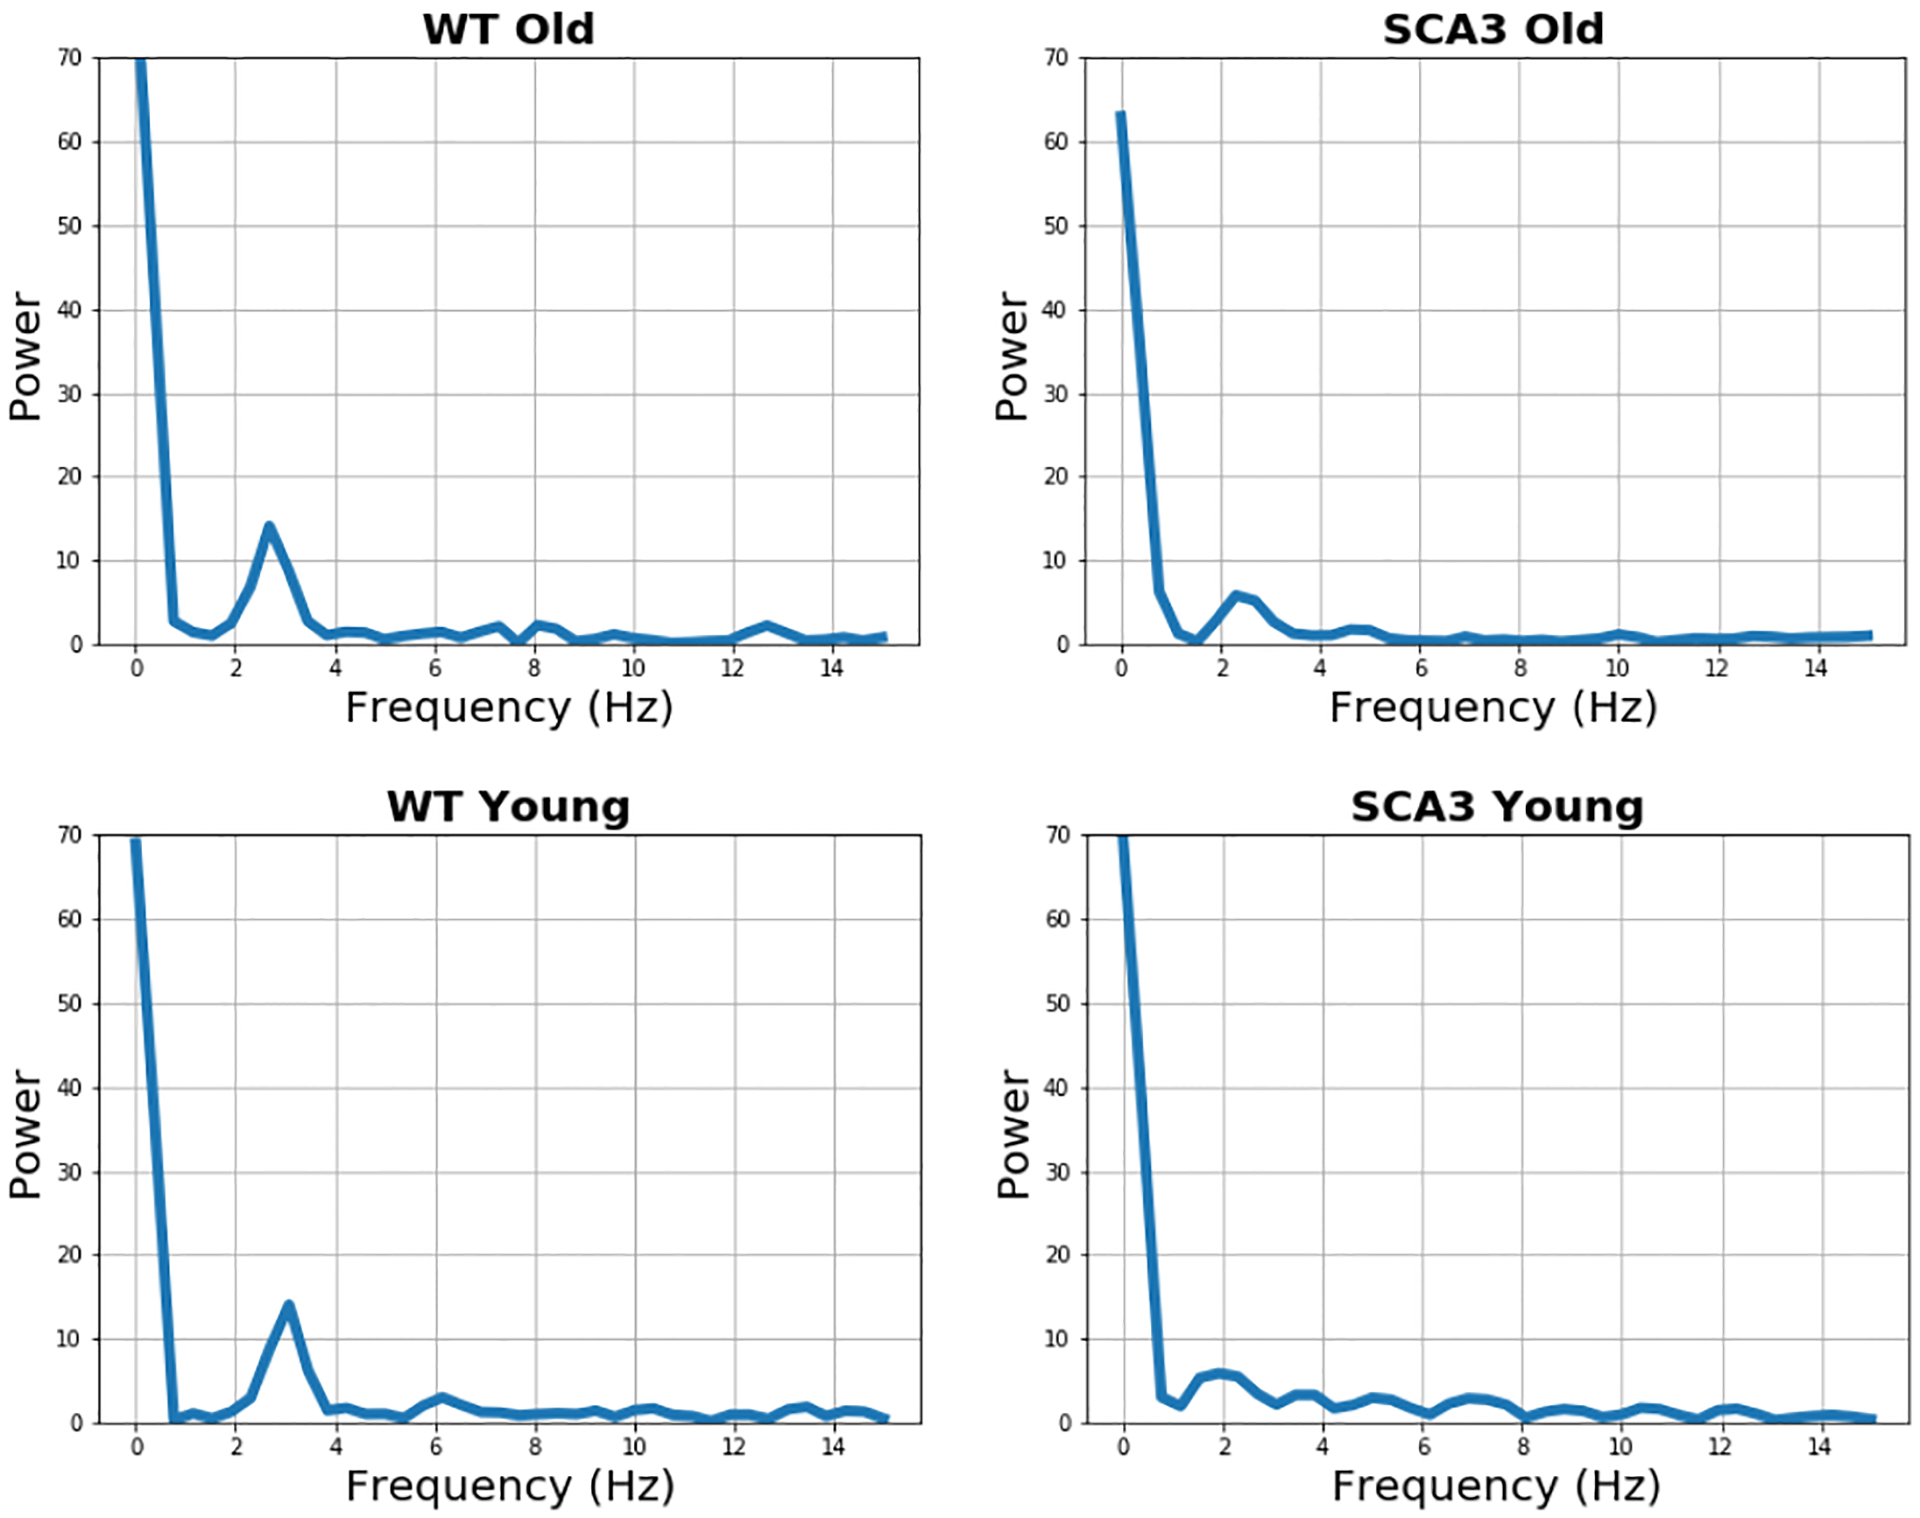
FFT Analysis of WT and SCA3 Mice.
In order to quantify the rhythmicity of the gait pattern we used the method of Total Harmonic Distortion (THD). It is defined as the ratio of the first harmonic (fundamental) to its other harmonics. Specifically, it is calculated by dividing the root sum of squares of energies of harmonics 2 to n by the energy of its fundamental (harmonic 1) [15], with Ix as the amplitude of the harmonic x (2).
| (2) |
Based on the THD value, the rhythmicity of gait (RoG) is determined by
| (3) |
For every stride sequence, we therefore extracted the peak frequency that exhibited the highest energy and defined a range of ± 1 frequency of the peak frequency as the peak frequency range. We then computed the root sum of squares of the remaining harmonics and calculated the THD ratio according to (2). Next, we inverted the THD values to obtain the RoG (3) and averaged the RoG values for each genotype and condition, categorizing into WT, younger SCA3 and older SCA3 mice, yielding RoG averages of 0.92 (sd: 0.16) for the older SCA3 mice, 0.61 (sd: 0.23) for the younger SCA3 mice and 1.51 (sd: 0.25) for the WT mice. These results demonstrate that in average stride sequences of SCA3 mice showed a lower rhythmicity than stride sequences of WT mice (Figure 15).
Figure 15.

Rhythmicity of Gait in WT and SCA3 Mice.
To statistically investigate the difference in rhythmicity, we conducted a one-way ANOVA analysis of variance with the RoG being the dependent variable and the type category (wild, SCA3 young, SCA3 old) being the independent variable. As expected, we found that the RoG of the older SCA3 mice significantly differed from the RoG of the WT mice (p = 0.025, η2 = 0.755). Interestingly, we also found that the RoG of the younger SCA3 mice significantly differed from the RoG of the WT mice (p = 0.0099, η2 = 0.842), showing that the RoG is already changed in younger SCA3 mice, which exhibit no slips, paw faults or other abnormalities in visual inspection.
IV. Conclusion
In this paper, we present a novel approach of quantifying symptoms of cerebellar ataxia in rodents. We used markerless motion tracking based on deep neural networks to extract marker trajectories which allow the calculation of ataxia-specific movement features and finally of ataxic rodents and age-matched wildtypes.
In Experiment 1, we were able to reproduce the ~5 Hz tremor frequency in the shaker rat without the usage of a force plate, but instead by post-hoc quantitative analysis of previously recorded videos. This enables novel research applications in setups where the use of a force plate is not possible due to cost, experimental settings or other constraints. We can also envision a joint application of a force plate and visual body part tracking for the analysis of more complex movements being able to track paws and center of mass with the force plate and quantifying upper body and tail movement with a marker-tracking network. In future research, this combination might help to classify milder manifestation of ataxic symptoms as well and to objectively quantify intervention effects in future therapeutical trials.
In Experiment 2, we investigated a spinocerebellar ataxia (SCA) mouse model in a beam-balancing task. First, our results showed that in accordance with earlier studies [13, 14], the complex task of beam walking is more sensitive to motor abnormalities than other motor tasks like normal gait behavior. Thus, visual inspection of beam-walking trials revealed increased amounts of paw faults and slips for mice with an age of 9 months, whereas normal gait behavior reveals visible abnormalities in the age of around 15 months. Second, establishing a parameter for the assessment of rhythmicity of gait (RoG) enables us to identify changes in beam walking performance as early as at the age of 3 months, when no motor abnormalities and no differences to age-matched wildtype mice are visible.
Taken together, our results show prototypically that the presented approach is efficient to objectively analyze ataxia-specific motor impairments. The extraction of movement features based on markerless motion tracking allowed the quantification of subtle movement differences not identifiable by pure visual inspection. Therefore the presented approach might be promising for future rodent studies investigating new treatment strategies in hereditary cerebellar ataxia [16], in particular including early and presymptomatic disease stages in rodent models, when subtle changes in motor behavior have to be identified and quantified.
Acknowledgment
J.L. thanks the German Academic Scholarship Foundation for supporting this work with a scholarship.
References
- [1].Kreiner G, “What have we learned recently from transgenic mouse models about neurodegeneration? The most promising discoveries of this millennium,” Pharmacol Rep, vol. 70, no. 6, pp. 1105–1115, December, 2018. [DOI] [PubMed] [Google Scholar]
- [2].Ahmad W, Ali A, Ali A, Khan S, Khan S, and Husain I, “Upcoming diagnostic biomarkers with promising prospects in neurological disorders,” Clinical and Experimental Pharmacology and Physiology, vol. n/a, no. n/a, 2019/November/20, 2019. [DOI] [PubMed] [Google Scholar]
- [3].Simrén J, Ashton NJ, Blennow K, and Zetterberg H, “An update on fluid biomarkers for neurodegenerative diseases: recent success and challenges ahead,” Current Opinion in Neurobiology, vol. 61, pp. 29–39, 2020/April/01/, 2020. [DOI] [PubMed] [Google Scholar]
- [4].Justice MJ, and Dhillon P, “Using the mouse to model human disease: increasing validity and reproducibility,” Disease models & mechanisms, vol. 9, no. 2, pp. 101–103, 2016. [DOI] [PMC free article] [PubMed] [Google Scholar]
- [5].Ilg W, and Timmann D, “Gait ataxia-specific cerebellar influences and their rehabilitation,” Mov Disord, vol. 28, no. 11, pp. 1566–75, September 15, 2013. [DOI] [PubMed] [Google Scholar]
- [6].Figueroa KP, Paul S, Cali T, Lopreiato R, Karan S, Frizzarin M, Ames D, Zanni G, Brini M, Dansithong W, Milash B, Scoles DR, Carafoli E, and Pulst SM, “Spontaneous shaker rat mutant - a new model for X-linked tremor/ataxia,” Dis Model Mech, vol. 9, no. 5, pp. 553–62, May 1, 2016. [DOI] [PMC free article] [PubMed] [Google Scholar]
- [7].Martier R, Sogorb-Gonzalez M, Stricker-Shaver J, Hübener-Schmid J, Keskin S, Klima J, Toonen LJ, Juhas S, Juhasova J, Ellederova Z, Motlik J, Haas E, van Deventer S, Konstantinova P, Nguyen HP, and Evers MM, “Development of an AAV-Based MicroRNA Gene Therapy to Treat Machado-Joseph Disease,” Molecular Therapy - Methods & Clinical Development, vol. 15, pp. 343–358, 2019. [DOI] [PMC free article] [PubMed] [Google Scholar]
- [8].Wilke C, Haas E, Reetz K, Faber J, Garcia-Moreno H, Santana MM, van de Warrenburg B, Hengel H, Lima M, Filla A, Durr A, Melegh B, Masciullo M, Infante J, Giunti P, Neumann M, de Vries J, Pereira de Almeida L, Rakowicz M, Jacobi H, Schuele R, Kaeser SA, Kuhle J, Klockgether T, Schoels L, Barro C, Huebener-Schmid J, and Synofzik M, “Neurofilaments as blood biomarkers at the preSCA3 and SCA3 stage of spinocerebellar ataxia type 3: a cross-species analysis in humans and mice,” medRxiv, pp. 19011882, 2019. [Google Scholar]
- [9].Nath T, Mathis A, Chen AC, Patel A, Bethge M, and Mathis MW, “Using DeepLabCut for 3D markerless pose estimation across species and behaviors,” Nat Protoc, vol. 14, no. 7, pp. 2152–2176, July, 2019. [DOI] [PubMed] [Google Scholar]
- [10].Mathis A, Mamidanna P, Cury KM, Abe T, Murthy VN, Mathis MW, and Bethge M, “DeepLabCut: markerless pose estimation of user-defined body parts with deep learning,” Nat Neurosci, vol. 21, no. 9, pp. 1281–1289, September, 2018. [DOI] [PubMed] [Google Scholar]
- [11].Anderson CJ, Figueroa KP, Dorval AD, and Pulst SM, “Deep cerebellar stimulation reduces SCA3 motor symptoms in the shaker rat,” Ann Neurol, vol. 85, no. 5, pp. 681–690, May, 2019. [DOI] [PMC free article] [PubMed] [Google Scholar]
- [12].Brooks SP, and Dunnett SB, “Tests to assess motor phenotype in mice: a user’s guide,” Nat Rev Neurosci, vol. 10, no. 7, pp. 519–29, July, 2009. [DOI] [PubMed] [Google Scholar]
- [13].Luong TN, Carlisle HJ, Southwell A, and Patterson PH, “Assessment of motor balance and coordination in mice using the balance beam,” J Vis Exp, no. 49, March 10, 2011. [DOI] [PMC free article] [PubMed] [Google Scholar]
- [14].Stanley JL, Lincoln RJ, Brown TA, McDonald LM, Dawson GR, and Reynolds DS, “The mouse beam walking assay offers improved sensitivity over the mouse rotarod in determining motor coordination deficits induced by benzodiazepines,” J Psychopharmacol, vol. 19, no. 3, pp. 221–7, May, 2005. [DOI] [PubMed] [Google Scholar]
- [15].Shmilovitz D, “On the definition of total harmonic distortion and its effect on measurement interpretation,” IEEE Transactions on Power Delivery, vol. 20, no. 1, pp. 526–528, 2005. [Google Scholar]
- [16].Ashizawa T, Oz G, and Paulson HL, “Spinocerebellar ataxias: prospects and challenges for therapy development,” Nat Rev Neurol, vol. 14, no. 10, pp. 590–605, October, 2018. [DOI] [PMC free article] [PubMed] [Google Scholar]


