Abstract
The majority of cortical synapses are local and excitatory. Local recurrent circuits could implement amplification, allowing for pattern completion and other computations1-4. Cortical circuits contain subnetworks, consisting of neurons with similar receptive fields and elevated connectivity relative to the network average5,6. Cortical neurons encoding different types of information are spatially intermingled and distributed over large brain volumes5-7, hampering experiments that probe the function of these subnetwork by perturbing them individually8. We used computational modeling, optical recordings and manipulations to probe the function of recurrent coupling in layer (L) 2/3 of vibrissal somatosensory cortex during active tactile discrimination. A neural circuit model of L2/3 revealed that recurrent excitation enhances sensory signals via amplification, but only for subnetworks with elevated connectivity. Model networks with high amplification were sensitive to damage: loss of a few subnetwork members degraded stimulus encoding. We tested this prediction by mapping neuronal selectivity7 and photoablating9,10 neurons with specific selectivity. In L2/3 of the somatosensory cortex, ablating a small proportion (10-20, < 5 % of the total) of neurons representing touch dramatically reduced responses in the spared touch representation, but not other representations. Ablations most strongly impacted neurons with stimulus responses similar to the ablated population, also consistent with network models. Recurrence among cortical neurons with similar selectivity therefore drives input-specific amplification during behavior.
Two circuit motifs contribute to neural dynamics in cortical layer (L) 2/3: recurrent excitation, which may cause amplification1-5,11,12, and feedback inhibition, which may account for the sparse activity typical of L2/312-14. We explored the role of these motifs in an integrate-and-fire model of layer (L) 2/3 of the vibrissal somatosensory ('barrel') cortex constrained by measured physiological properties15,16 (Methods).
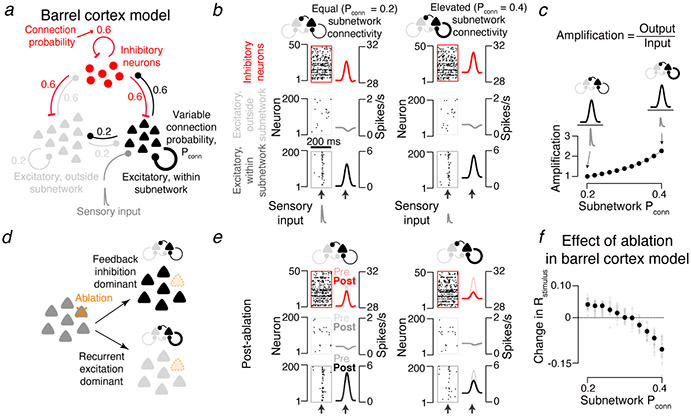
To model input-specific recurrent coupling, we restricted the sensory input to a subnetwork of the excitatory neurons (200 of 1,700), corresponding to the number of L2/3 barrel cortex neurons responding to active touch7,17 (Fig. 1a). We simulated touch-related input to L2/3 based on recordings of their L4 inputs18 (Methods). To measure the faithfulness with which neural activity reflects the sensory input, we computed an ‘encoding score’ (Rstimulus) by cross-correlating the spike rate of each neuron with the input (Methods).
Figure 1.
Ablation effect in simulated cortical L2/3 network depends on excitatory connectivity. a. The L2/3 network model comprises a subnetwork of 200 excitatory neurons (black) receiving sensory input (dark grey), a larger excitatory population (1,500 neurons; light grey) without sensory input, and 300 inhibitory neurons (red). All populations are interconnected (connection probabilities listed in figure; Methods). The probability and strength of connections within the excitatory subnetwork was varied (Pconn, thick black loop; Methods). b. Model network responses aligned to input (arrows). Left, subnetwork connectivity for excitatory subnetwork equal to overall connection probability. Right, elevated connectivity. Raster plots show a subset of neurons from an example network. Peri-stimulus time histograms show averages across all neurons and networks (N = 30). Bottom, excitatory neurons within subnetwork; middle, excitatory neurons outside subnetwork; top, inhibitory neurons. c. Amplification, defined as the ratio of network output to sensory input (Methods), as a function of subnetwork connectivity, normalized to the Pconn = 0.2 case (mean across 30 networks per Pconn). d. Predicted effects of ablation. In the equal connectivity case (top), feedback inhibition dominates and responses among spared neurons increase. In the elevated connectivity case (bottom), recurrent excitation dominates and responses decline. e. As in b, but following ablation of the 20 neurons with the strongest encoding score. f. Effect of ablation on stimulus encoding, as a function of subnetwork connectivity. Grey circles, individual network. Black circles, mean of 30 simulated networks.
We varied recurrence by changing the connection probability within the input-recipient subnetwork (‘subnetwork connectivity’; synaptic conductance was scaled proportionately 5, Methods). For each subnetwork connectivity we matched the encoding score distribution to that measured in vivo7 by adjusting the strength of the L4 input. Subnetworks with connectivity equal to and moderately elevated relative to the rest of the network (non-subnetwork connectivity, 0.2; subnetwork connectivity range, 0.2 - 0.4) produced responses consistent with those observed in vivo7 (Fig. 1b; Methods). The amplitudes of the required sensory input declined with increasing subnetwork connectivity. Amplification, defined as the ratio of network output to network input, therefore increased with subnetwork connectivity1 (Fig. 1c). Additional elevation of subnetwork connectivity (> 0.4) produced all-or-none network responses, whereby a transient input drove the network into a persistently active state 19 (Extended Data 1).
Overall, subnetwork behavior fell into three regimes, each of which produced a distinct response to removal (‘ablation’) of a small number of neurons. Subnetworks with low connectivity (0.2) amplified little, and were resistant to ablation (Fig. 1c-f). Encoding scores for spared neurons increased following simulated ablation of 10 % of the subnetwork14, because of reduced feedback inhibition13,20 (encoding score, from 0.237 ± 0.027 to 0.274 ± 0.032, grand median ± adjusted median absolute deviation, MAD, P < 0.001, Wilcoxon signed rank test, across N = 30 simulated networks with different randomized connectivity and initial conditions; Methods; Fig. 1d-f).
Subnetworks with elevated connectivity (e.g., 0.4) exhibited stronger amplification1,4 (Fig. 1c). Ablations reduced encoding scores for spared neurons, from 0.243 ± 0.049 to 0.143 ± 0.028 (connectivity = 0.4; P < 0.001, N = 30 networks), because of reduced nonlinear amplification (Fig. 1d-f). Networks in the all-or-none regime19 were robust to ablation, maintaining their response (Extended Data 1). The response of subnetworks to ablations therefore distinguishes the three regimes.
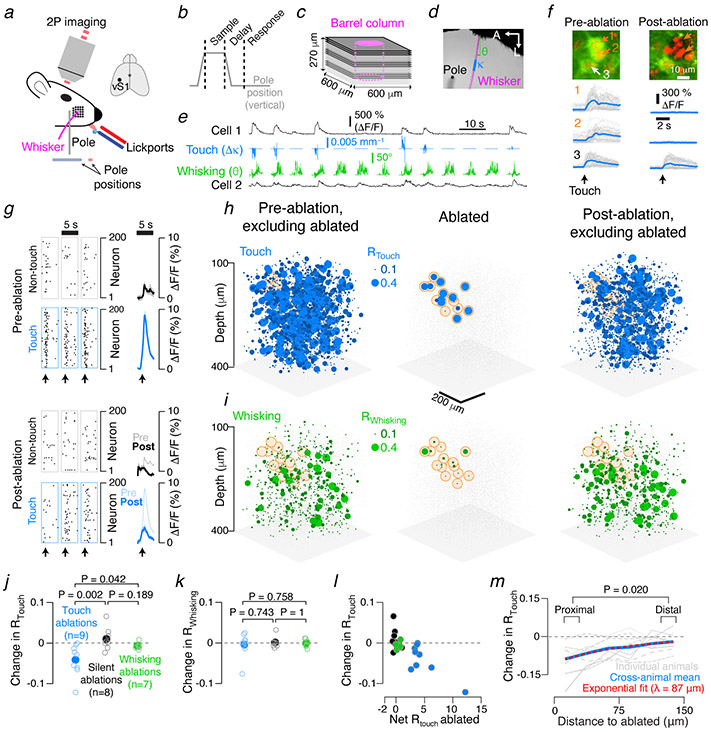
We next performed a similar analysis for actual L2/3 networks during behavior. We trained mice with a single spared whisker on an object localization task (Fig. 2a, b; Methods) and recorded neural activity with volumetric imaging7 in L2/3 of the barrel column corresponding to the spared whisker (Fig. 2c; 8,126 ± 2,436 neurons per mouse, mean ± S.D.; N = 16 mice; Extended Data Table 1; Methods). Activity in a subset of neurons encoded whisker position (‘whisking’ neurons), whereas others responded to touch-induced changes in whisker curvature (‘touch’ neurons)7 (Fig. 2d, e). An encoding model generated a prediction of neural activity from vibrissal kinematics (Methods). Correlating the prediction with the actual neural activity yielded an ‘encoding score’, which was used to assign neurons to the touch and/or the whisking representations7 (Methods). Across mice (N = 16 mice; Extended Data Table 1), 901 ± 539 neurons of the imaged neurons encoded touch (fraction: 0.108 ± 0.051) and 865 ± 364 encoded whisking (fraction: 0.106 ± 0.028).
Figure 2.
Barrel cortex touch networks are sensitive to ablation. a. Mice used one whisker to locate a pole and reported the perceived position by licking one of two lickports (red, blue). b. Task epochs (Methods). c. Imaging planes were centered on the barrel column of the spared whisker, magenta. Three planes were imaged simultaneously (same shade of grey). d. Example video frame showing the whisker (magenta), pole (black), whisker curvature (κ, blue), and whisker angle (θ, green). e. Neuronal activity for a touch (cell 1) and whisking (cell 2) cell. Blue, whisker curvature change (Δκ); green, whisker angle (θ). f. Ablations. Pyramidal neurons 1 and 2 (orange) were ablated (green, GCaMP6s; red, mCherry). Bottom, touch-aligned neuronal responses. g-i. Example experiment. g. Touch responses (dots, calcium events; Methods) for a subset of neurons before (top) and after (bottom) ablation. Grey boxes, 200 non-touch/non-whisking neurons; blue boxes, 200 touch neurons. Right, touch-aligned mean ΔF/F across these neurons for the strongest 5% of touches. Envelopes, s.e.m. h. Left, map for touch cells before ablation. Sphere size, Rtouch. Grey dots, other neurons. Orange, ablated neuron position. Center, Rtouch for ablated neurons. Right, Rtouch after ablation. i. As in h, but for whisking neurons. j. Effect of ablating different neurons on Rtouch in individual mice. Blue, touch ablations; black, silent neuron ablations; green, whisking ablations. P-values for Wilcoxon rank sum test between groups. k. As in j, but for Rwhisking. l. Ablation effect on change in Rtouch as a function of Rtouch summed over the ablated neurons. Color as in j. m. Distance-dependence (w.r.t. closest ablated neuron) of post-ablation change in Rtouch. Proximal change in Ptouch: −0.132 ± 0.246, grand median ± adjusted MAD, distal: −0.056 ± 0.241; p-value for Wilcoxon signed rank test for proximal vs. distal medians, paired by animal, N = 9 mice.
We probed the roles of recurrence by ablating members of the touch representation and examining the effect on spared neurons. Multiple excitatory neurons were ablated using multiphoton excitation9,10 (Extended Data 2, 3). Ablating a small proportion of strong touch cells (Fig. 2f; 16.8 ± 12.8 neurons, 6 % of touch neurons in the spared whisker’s barrel column, N = 9 mice; touch score, 70th ± 35th percentile) reduced responses to touch in the spared touch neurons (Fig. 2g, h). The touch encoding score (Rtouch) across touch neurons declined (from 0.123 ± 0.021 to 0.100 ± 0.037, grand median ± adjusted MAD; N = 9 mice, 8,392 neurons, P = 0.004, Wilcoxon signed rank test for animal medians, paired by animal; Fig. 2j; Methods), as did the touch neuron count (from 932 ± 634 to 716 ± 469, mean ± SD, calculations exclude ablated neurons, Methods). The whisking encoding score (Rwhisking) did not change (Fig. 2i, k; from 0.116 ± 0.013 to 0.115 ± 0.024; 6,975 neurons, P = 0.820; neuron count: from 775 ± 267 to 721 ± 241).
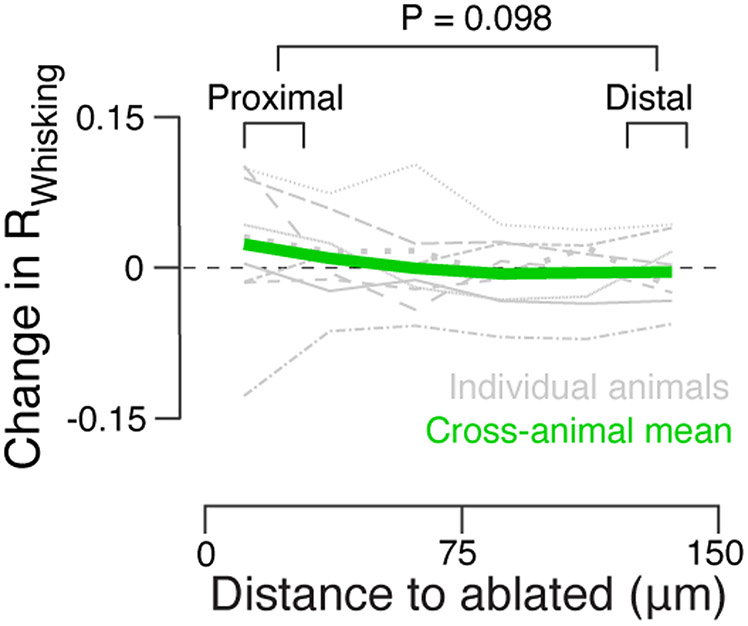
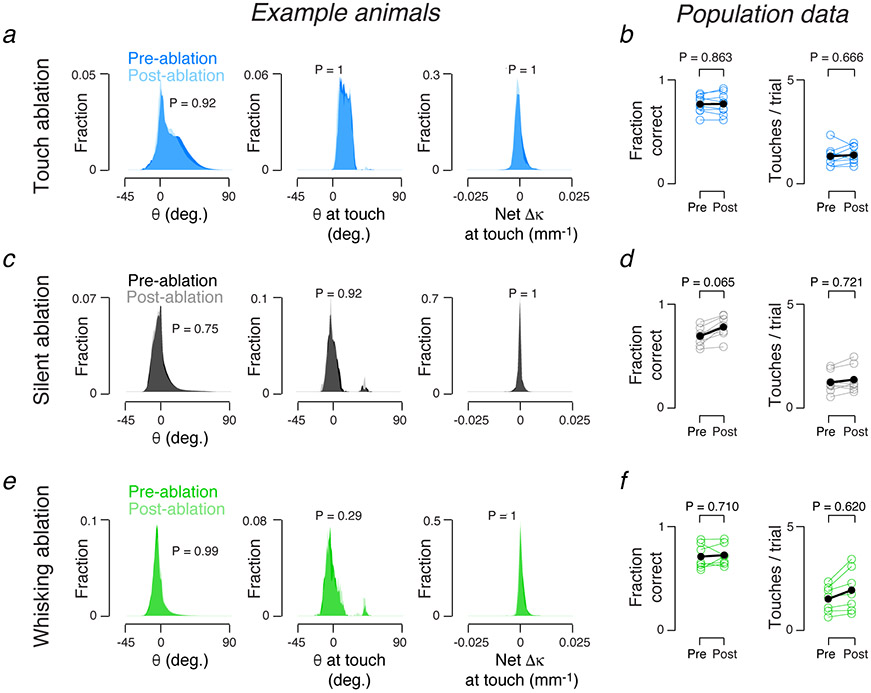
In the model, more extensive ablations caused larger encoding score declines (Extended Data 4). In agreement with this prediction, the decline in touch representation increased as more of the touch representation was ablated (Fig. 2l; Pearson correlation of change in Rtouch and net Rtouch ablated, R = −0.794, P < 0.001 across all 24 ablations; R = −0.779, P = 0.013 for the 9 touch cell ablations). Touch neurons proximal (15-35 μm) to the ablated cells experienced a larger decline in Rtouch than those distal (115-135 μm) from the ablated cells (Fig. 2m). The effects of ablating the touch neurons decayed over a distance (λ = 87 μm, exponential fit; Fig. 2m) similar to the spatial scale of local recurrent connectivity in the rodent sensory cortex21. Whisking neurons exhibited no distance-dependent change (Extended Data 5). The declining touch representation was not caused by changes in whisker movement or behavior (Extended Data 6). This result is consistent with amplification of touch responses by recurrent excitation in L2/3.
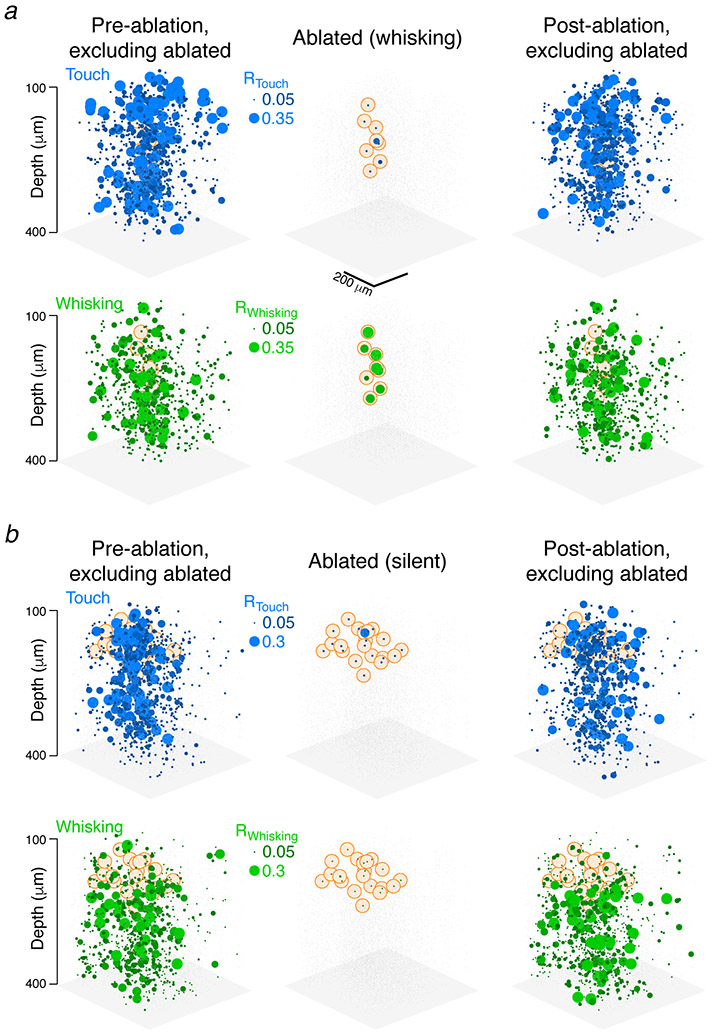
In contrast, ablating a subset of strong whisking neurons (12.7 ± 5.7 neurons, ~4 % of whisking neurons in the spared whisker’s barrel column, N = 7 mice; whisking score: 66th ± 37th percentile) produced no effect on either the touch (Extended Data 7, Fig. 2j; Rtouch from 0.112 ± 0.081 to 0.095 ± 0.069, N = 7 mice, 5,866 neurons, P = 0.109, count from 838 ± 401 to 899 ± 548) or the whisking representation (Rwhisking from 0.108 ± 0.076 to 0.107 ± 0.076, N = 6,161, P = 0.812, count from 880 ± 387 to 974 ± 558). Similarly, ablating silent neurons (event rate below 0.025 Hz; Methods; 16.3 ± 2.6 neurons, N = 8 mice) did not change the touch (Extended Data 7, Fig. 2k; Rtouch from 0.115 ± 0.021 to 0.107 ± 0.023, N = 8 mice, 7,110 neurons, P = 0.383, count from 889 ± 713 to 926 ± 681) or whisking representations (Rwhisking from 0.115 ± 0.014 to 0.114 ± 0.015, 7,684 neurons, P = 0.844, count from 961 ± 464 to 904 ± 384). Touch ablations produced significantly different encoding score changes among touch (but not whisking) representations than either whisking or silent ablations, whereas whisking ablations did not produce significantly different changes from silent ablations (Fig. 2j,k). Non-specific effects of ablation therefore do not contribute to changes in the touch representation after ablation.
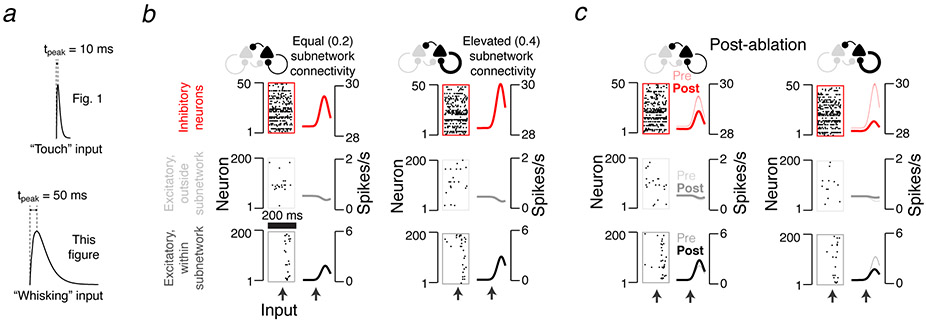
Whisking neuron ablations did not degrade the whisking representation. Our network model suggests that the slower kinetics of the whisking input do not account for this lack of effect, as networks having elevated subnetwork connectivity (0.4) with slower input (tpeak = 50 ms, vs. 10 ms for touch simulations; Methods) were sensitive to simulated ablation (Extended Data 8). Touch input is in-phase across the neural population17,18, which engages recurrent excitation. In contrast, individual neurons encode whisking input with different phases22; this asynchronous population response is expected to engage recurrent excitation less effectively. Therefore, the lack of sensitivity to ablation in the whisking population does not necessarily imply an absence of recurrent coupling.
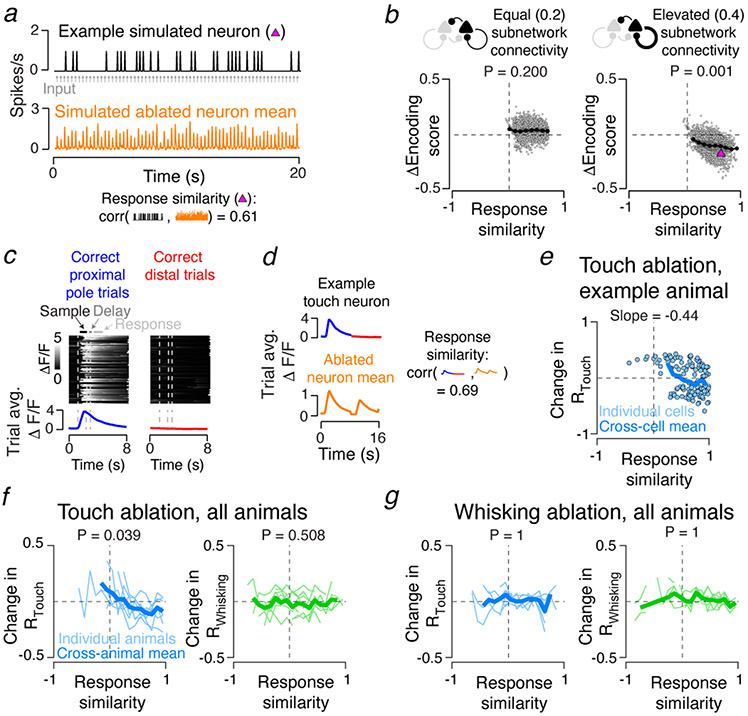
In recurrent networks connected in a feature-specific manner5, the effects of ablation on spared neurons should increase with the similarity of their tuning to the ablated population23,24. We tested this intuition in our model, defining ‘response similarity’ as the correlation of single neuron activity with the mean activity of the ablated neurons (Fig. 3a; Methods). In networks with elevated subnetwork connectivity, neurons with high response similarity showed the largest decline in encoding score following ablation (Fig. 3b). In networks without elevated subnetwork connectivity, the relationship disappeared (Fig. 3b).
Figure 3.
Effect of ablations depends on response similarity to ablated cells. a. Response similarity in simulated networks. Top, example neuron spike rate (black). Grey arrows, sensory input. Orange, mean spike rate across ablated neurons. Bottom, response similarity was computed by correlating neuronal spike rate with the mean ablated neuron spike rate. b. Dependence of post-ablation encoding score change on response similarity in model networks. Grey dots, individual neurons. Dark grey lines, single network averages; p-values for sign test that the slopes of linear fits across all networks (N=30; Pconn = 0.2 case: 3,779 neurons; Pconn = 0.4 case: 3,466 neurons) are 0. Black line, grand mean across networks. Magenta triangle, neuron from a. c. Trial averaged response for example touch neuron. Heat maps: ΔF/F for individual trials (proximal pole trials, left; distal, right). Bottom, trial averaged ΔF/F. d. Top, trial averaged ΔF/F for neuron in c. Bottom, the mean trial averaged response across ablated neurons. Right, response similarity is the correlation of individual neuron trial averaged response vectors with the mean across ablated neurons. e. Touch neuron ablation induced changes in touch score as a function of response similarity in an example animal. Blue circles, individual neurons; blue line, binned mean (Methods). Slope for a linear fit of the points is given. f. Population data for all touch ablations for both touch (blue, left) and whisking (right, green) neurons. Thin colored lines, individual animal means for a given response similarity bin; thick lines, cross-animal mean. P-values for sign test that the slope of change in encoding score as a function of response similarity is 0 are given (N=9 mice; 2,768 touch neurons; 1,085 whisking neurons). g. As in f, but for whisking neuron ablation (N=7 mice; 1,692 touch neurons; 935 whisking neurons).
We performed a similar analysis on our experimental data. Our imaging strategy sampled activity from three planes simultaneously (Fig. 2c; Methods)7. Because not all neurons were recorded simultaneously, it was not possible to compute a mean across ablated neurons or correlations between that mean and the activity of individual neurons. We therefore devised a ‘response similarity’ metric not requiring simultaneous recording. For each neuron, we averaged pre-ablation responses across both trial types (Fig. 3c). Concatenating these yielded a neuron’s trial-averaged ΔF/F (Fig. 3d). Computing the mean trial-averaged ΔF/F across all ablated neurons provided the ablated neuron mean response. Response similarity was measured for each neuron as the correlation between its trial-averaged ΔF/F response and the mean response across all ablated neurons.
Changes in Rtouch following ablation depended on response similarity (Fig. 3e, f). Rtouch in neurons with high response similarity declined. Neurons with negative response similarity showed increased Rtouch, potentially due to reduced feedback inhibition previously evoked by the ablated neurons20 (Fig. 3e). Touch neuron ablation had no effect on the whisking network (Fig. 3f). Whisker neuron ablation had no effect on either representation (Fig. 3g).
Targeted photoablation allowed us to test the roles of recurrence in cortical circuits1. The selective degradation of representations similar to the ablated neurons is consistent with amplification in recurrent networks1-4,11,12,23,25,26 (Fig. 1), but inconsistent with circuit models of sparse coding that are dominated by feedback inhibition12,14,20,27 or models with persistent activity19. Our experiments reveal that cortical circuits can be surprisingly sensitive to damage targeting specific representations, despite remarkable robustness to other kinds of perturbations28.
Methods
Network model
We modeled the L2/3 network associated with a single barrel column, one of the most extensively studied cortical microcircuits29,30, as a network of leaky integrate-and-fire neurons31. The dynamics of each neuron were governed by:
| (1) |
Here, V is the membrane potential, Vr is the rest/reset potential, τ is the membrane time constant, R is the input resistance, Iexc and Iinh are excitatory and inhibitory synaptic currents, Iext is a current representing sensory stimulus drive (e.g. from layer 4 inputs), and i indexes the neurons in the network. When the membrane potential reaches the spiking threshold, Vth, a spike is emitted, the membrane potential is reset to Vr, and the dynamics of the neuron are frozen for a short refractory period, tref. The synaptic currents follow kick-and-decay dynamics:
| (2) |
In this equation, syn denotes the type of synapse (either exc or inh), τsyn is the synaptic time constant, wij is a matrix of synaptic strengths from neuron j to neuron i, tjk is the time of the kth spike of neuron j, and td is the spike transmission delay. The sum over j is over all neurons, while the sum over k is over all spikes from that neuron.
The network comprised 2,000 neurons, of which 1,700 (85%) were excitatory and 300 (15%) were inhibitory16. Excitatory neurons had τ = 30 ms, whereas inhibitory neurons had faster dynamics with τ = 10 ms15,16. As the subthreshold dynamics for these neurons are linear, the behavior of these neurons is invariant to changes of scale in V. The meaningful quantity is ΔV = Vth - Vr, which we assume to be, on average, 35 mV for all neurons15,16. Each neuron was assigned a value chosen uniformly within a range of ±50% of this mean value. Excitatory and inhibitory post-synaptic currents (PSCs) had time constants of τexc = 2 ms and τinh = 3 ms, respectively. The refractory period for spiking was tref = 0.5 ms. Synapses had a mean synaptic delay of td = 0.6 ms15; each individual synapse was assigned a value chosen within a range of ±50% of this mean value. Although all neural parameters could be modeled as random variables, we found that jittering ΔV for the neurons and td for the synapses provided sufficient heterogeneity to give a broad range of baseline spike rates across neurons and also prevented network synchronization. The input resistance, R, was factored into the synaptic weights and the magnitudes of the external currents, as described below.
The excitatory population was subdivided into two groups: a small input-recipient subnetwork of 200 neurons and the remainder of the excitatory population (1,500 neurons). Although all neurons in L2/3 likely receive touch-related input from L432, only a small proportion are driven to spike after touch7,17, justifying this model assumption. We neglected feedforward inhibition33. This is justified because feedforward inhibition simply rescales input from L42, which in our model is adjusted to produce experimental observed population activity levels. Thus, each neuron belonged to one of three groups: the excitatory subnetwork (S), the remainder of the excitatory population (E), or the inhibitory population (I). Connections between neurons are determined by a block stochastic model. Given two neurons – the first from group A, the second from group B – there was a fixed probability of a connection from the first neuron to the second, denoted pAB.
In our ‘equal subnetwork connectivity’ network, we employed sparse connectivity between excitatory neurons, pSS = pSE = pES = pEE = 0.2, and more dense connectivity both within the inhibitory population as well as between the excitatory and inhibitory populations, pII = pIS = pIE = pSI = pEI = 0.615,16. All connections had the same strength, which was chosen so that the resulting post-synaptic potential (PSP) is 1 mV15,16. Because it is the only connectivity parameter that was varied systematically, we denote pSS as Pconn in the rest of the text.
In the ‘elevated subnetwork connectivity’ version of the network, Pconn was increased to 0.4. To replicate the experimentally observed relationship between connectivity and synaptic strength5, the synaptic weight for these connections was increased to give PSPs of 1.6 mV. Networks with other levels of connectivity within the subnetwork were produced by linear interpolation/extrapolation of both Pconn and synaptic strength between the ‘equal subnetwork connectivity’ and ‘elevated subnetwork connectivity’ cases.
The stimulus drive to the network was modeled as an external current targeting the excitatory subnetwork (group S; Iext = 0 for all neurons in groups E and I). For each stimulus presentation, the waveform of the current was modeled with a beta distribution with shape parameters α = 3 and β = 5. The beta distribution is defined on the interval [0, 1], giving a distinct beginning and end to the stimulus. For the chosen shape parameters, the beta distribution has a value of 0 at its endpoints and a peak at (α−1)/(α+ β −2). To model the fast touch stimulus, the waveform was stretched in time so that the peak occurs 10 ms after the start (full width half-max, 12.8 ms)18. The amplitude of the stimulus waveform was chosen so that the network response matched the experimental data. All neurons also receive tonic background input in the form of a Poisson spike train of excitatory spikes with a frequency of 5,000 Hz for excitatory neurons and 2,000 Hz for inhibitory neurons; these values were selected so that the tonic firing rate of these populations were ~0.5 Hz for excitatory neurons and ~10 Hz for inhibitory neurons34-36.
Simulations were performed in Python using the Brian2 simulation package37 with a step-size of dt = 0.1 ms. For each randomly sampled network connectivity, the network was first simulated for 20 s of model time (corresponding to 66 stimulus presentations) and spike trains for all neurons were recorded. The activity of each neuron was then given an encoding score, which quantifies the signal-to-noise ratio of the representation of the stimulus: the neuron’s spike train was convolved with a Gaussian kernel (standard deviation, 20 ms) to produce a firing rate; the firing rate as well as the stimulus waveform was down-sampled by a factor of 5 (to a sample period of 0.5 ms) and the normalized cross-correlation between the signals was computed for leads/lags up to 10 ms; the peak value this cross-correlation is the encoding score.
We first ran exploratory simulations to constrain the strength of the input to the subnetwork to match physiological data7. We simulated both the ‘equal subnetwork connectivity’ (Pconn = 0.2) and the ‘elevated subnetwork connectivity’ (Pconn = 0.4) networks across a range on sensory input strengths. In both cases, we examined the distributions of excitatory neuron encoding scores as a function of input strengths, selecting the input strength that produced a distribution most closely matching the experimental data (in terms of distribution shape and fraction of neurons encoding the stimulus). With input strengths defined for these two cases, we then used linear interpolation/extrapolation to select the input strength for other amounts of subnetwork connectivity. Because this procedure ensured a fixed network output following the simulated sensory stimulus, amplification (ratio of network output to sensory input; Fig. 1c) was defined as the inverse of the sensory input strength2. Amplification was normalized to the case where neurons within the input-recipient subnetwork had connectivity probabilities equal to the non-input recipient excitatory population (that is, Pconn = 0.2).
The final set of simulations explored the effects of targeted ablation across a range of subnetwork connectivity levels (Figs. 1,3, Extended Data 1), number of ablations (Extended Data 4), and input kinetics (Extended Data 8). To simulate targeted ablation, we employed 30 randomized network instances for each subnetwork connectivity level, number of ablations, and input rise time, and calculated the pre-ablation encoding score for each neuron. The 20 excitatory neurons with the highest encoding score were then removed (all outgoing synaptic strengths set to 0), the simulation was repeated, and the post-ablation encoding scores were computed. Examination of the effects of the number of ablated neurons was done with the top 0, 10, 20, 50 and 100 neurons (Extended Data 4). This was repeated for 30 different realizations of the stochastic network connectivity. Neurons were considered to be part of the sensory input representation if they had an encoding score above 0.1; the effect of the ablation (Fig. 1e, f) was quantified as the change in encoding score across all neurons that met the 0.1 encoding score criteria either before and/or after ablations. The response similarity analysis (Fig. 3) used a more stringent encoding score cutoff of 0.25; using a cutoff of 0.1 did not alter the result, but reduced the magnitude of the observed effect. The ablated neurons were excluded for both pre- and post-ablation encoding score distribution calculations, as well as in constructing peristimulus time histograms (Fig. 1b,e).
In modeling the effect of the number of neurons ablated on the change in encoding score (Extended Data 4), we restricted our modeling to the elevated subnetwork connectivity case, Pconn = 0.4. For simulations of ‘whisking’ input (Extended Data 8), we shifted from a ‘touch’-like stimulus, peaking 10 ms after stimulus onset, to one peaking 50 ms after onset to mimic the response to whisking input observed in vivo17,18,22,35. We examined both the equal (Pconn = 0.2) and elevated (Pconn = 0.4) connectivity cases.
For large subnetwork connectivity (Pconn > 0.4), the network transitioned to all-or-none behavior, where strong enough input can drive the subnetwork into a state of persistent elevated firing (Extended Data 1)19. To reset the network after such a transition, we introduced a strong pulse of excitatory current to the inhibitory population 300 milliseconds after the stimulus onset. In this regime the extrapolation scheme for setting the stimulus strength did not apply, since spike rate was dictated by network properties and not the input strength. Instead, the input strength affected the reliability with which a stimulus would cause a transition to the state of elevated firing. We found that choosing a stimulus strength of twice what our extrapolation scheme dictated produced a reasonable number of stimulus-encoding neurons. Thus, we used this criterion to set the input strength in this regime.
Peri-stimulus time histograms (PSTHs) were constructed by averaging the Gaussian-convolved (kernel standard deviation, 20 ms) responses of individual neurons, aligned to the sensory input.
Determining model synaptic weights
Model synapses were defined by kick-and-decay dynamics of the post-synaptic currents. We set the synaptic weights to produce a desired amplitude of the resulting unitary post-synaptic potential (PSP). Here, we derive the relationship between the synaptic weight and the PSP size that allows us to do this.
Assume that a synaptic current starts at I = 0 when a single spike of weight w arrives at t = 0. In the absence of any other spikes, the subsequent time-course of the current is found by integrating (2):
| (3) |
To determine the resulting behavior of V(t), make the assumption that the PSP evolves according to a difference of exponentials:
| (4) |
Differentiating (4) and using (3), one can show that this form does indeed solve (3) if we choose:
| (5) |
The PSP size is the maximum value of V(t), which we can compute as:
| (6) |
where a = τm/τs is the ratio of the time constants. Comparing this to the expression for V0 in (6) we find our desired relationship:
| (7) |
The linearity of the synaptic dynamics allows us to use (7) to avoid explicitly determining the value of R.
Animals
All procedures were performed in compliance with the Janelia Research Campus Institutional Animal Care and Use Committee and the New York University University Animal Welfare Committee. Two transgenic lines were used for these experiments, differentiated in Extended Data Table 1 by a ‘j’ or ‘n’ in Animal ID. Animals whose ID starts with the letter ‘j’ consisted of mice expressing nuclear localized mCherry in a Cre-dependent manner (R26-LSL-H2B-mCherry7; JAX 023139) crossed with mice expressing Cre in cortical pyramidal neurons (Emx1-IRES-Cre38; JAX 005628). In cortical L2/3, these animals expressed nuclear mCherry only in nuclei of excitatory neurons. Multiple (9 or 12) injections (450 μm deep, 300 μm apart; beveled pipettes, World Precision Instruments; 20 nL each, at 10 nL/min with a custom-built microinjector) of AAV2/1-syn-GCaMP6s (UPenn AV-1-PV2824) 39 were made in barrel cortex (3.6 mm lateral, 1.5 mm posterior) of young adult mice7 (6-8 week). Following viral injection, a titanium headbar was attached to the skull and the craniotomy was covered with a cranial window. Craniotomies were always over the left hemisphere. Animals whose ID starts with the letter ‘n’ consisted of mice expressing GCaMP6s in a Cre-dependent manner (Ai16240, JAX 031562), crossed with Slc17a7-IRES2-Cre40 (JAX 023527) to restrict expression to in pyramidal neurons. Surgeries for these animals did not include viral injections but were otherwise identical.
Behavior
Approximately one week after surgery, mice were trimmed to a single row of whiskers (typically the C row) and placed on water restriction41 (1 mL per day). Training commenced 5-7 days after restriction onset. Animals were trained on an object localization task (Fig. 2a, b)42,43. If the pole appeared in a range of proximal positions, the animal would be rewarded with a small water drop for licking the right lickport; pole presentation at the distal position would be rewarded upon licking the left lickport (Fig. 2a). Trials consisted of a 1-1.2 s sample epoch followed by a 0.5-1.2 s delay epoch after which a 50 or 100 ms 3.4 kHz auditory response cue signaled to the animal to respond (Fig. 2b). To prevent premature licking, the lickport was brought into tongue range by a motor (Zaber) only during the response epoch (Fig. 2b). Mice exhibiting excessive premature licking (licks before reward cue on >20% of trials; licks monitored with a laser beam; Thorlabs) were not used.
Mice were trimmed to a single whisker after reaching criterion performance (d’ > 1.5 for two consecutive days). The spared whisker barrel column was identified using the neuropil signal, as described previously7. Whisker videography was performed at 400-500 Hz. Whiskers were tracked using an automated software pipeline44 and then curated using custom browser software7.
Mice were assigned randomly to experimental groups (ablation type). Experimenters were not blind to the group.
Imaging
Calcium imaging was performed using a custom two-photon microscope (http://openwiki.janelia.org/wiki/display/shareddesigns/MIMMS) with a 16X, 0.8 NA objective (Nikon)7. GCaMP (BG22; Chroma) and mCherry (675/70 filter; Chroma) fluorescence was imaged using GaAsP PMTs (Hamamatsu). The 940 or 1000 nm (Coherent) imaging beam was steered with a 16 kHz line rate resonant galvanometer (Thorlabs); a piezo collar (Physik Instrumente) moved the focus axially. 512 x 512 pixel images were collected at 7 Hz, with three 600 x 600 μm images per piezo cycle. Planes were spaced 15 μm apart. Scanimage45 (Vidrio Technologies, http://www.vidriotech.com) controlled the microscope. Three planes, constituting a ‘subvolume’, were imaged simultaneously (4-6 subvolumes, spanning 45 μm each, 12-18 total planes, 180-270 μm in depth total), and power was modulated with depth using a length constant of 250 μm. Deeper subvolumes were typically imaged with higher power, using a similar length constant. Individual subvolumes were typically imaged for 50 trials per day, with all subvolumes usually visited on any given day. Alignment across days was performed as described previously7,46.
Imaging data were processed using a semi-automated software pipeline that included image registration, segmentation, neuropil subtraction, ΔF/F computation, and event detection7. The de-noised ΔF/F trace, which consisted of the event amplitude trace convolved with event-specific exponential rise and decay, was used for analysis.
Neuronal classification
Neurons were classified using a linear-nonlinear encoding model7,47. The model consisted of a cascaded generalized linear model that used a temporal and stimulus domain kernel to predict the activity of individual neurons given whisker angle, θ, or whisker curvature, κ, assuming Gaussian noise with input nonlinearities.
The model predicted the neuronal response, r (i.e., ΔF/F), as
Here, s1 and s2 are the whisker angle, θ, and whisker curvature, κ, respectively. The terms f1 and f2 are static, point-wise nonlinearities comprising a weighted sum of sixteen triangular basis functions
Where x is the input (s1 or s2), with each bi given by
k1 and k2 are temporal kernels consisting of 14 time points (2 seconds).
Thus, the model gives a z-scored prediction of neural activity, z, by fitting parameters k1, k2, f1, f2 for given whisker kinematic parameters, s1 and s2.
The model parameters k1, k2, f1, f2 were fit using maximum likelihood with block coordinate descent. This procedure reliably estimated model parameters within three to five iterations.
To avoid degeneracy associated with arbitrary scaling factors on either the kernels or the nonlinearities, the nonlinearities were forced to have minimum of 0 and maximum of 1. Temporal kernels were unconstrained.
A prior was used to ensure smoothness of both the temporal kernels and the nonlinearities and prevent over-fitting. Specifically, the prior added a factor to the objective function penalizing excessive second derivatives of the temporal kernels and nonlinearities. Employing such a prior corresponds to maximizing the log-posterior, with the prior adding a small penalty to the objective function. In order to fit several thousand cells efficiently, the scale factor associated with this penalty was determined from a cross-validated inspection of a random subset of neurons.
The model was fit using five-fold cross-validation across trials. That is, a randomly selected 80% of trials were used for fitting, and 20% were used for evaluation, with 5 distinct evaluation groups per fit ensuring all data was used for fitting in exactly one case. The Pearson correlation between the predicted and actual ΔF/F yielded a measure of the quality of the model fit. This correlation was used as the encoding score for barrel cortex data: Rtouch, based on Δκ for touch, and Rwhisking, based on whisker θ for whisking (Fig. 2d,e). A neuron was considered part of a representation if Rtouch or Rwhisking exceeded 0.1 and if the neuron’s score was above the 99th percentile of scores measured from matched shuffled neural activity. These criteria are more stringent than those employed previously7, because ablation predominantly impacted neurons with high encoding scores. Using a less stringent criterion did not change the underlying conclusions, but did dilute the magnitude of the effect. For the response similarity analysis (Fig. 3), a threshold of 0.25 was used for the encoding score.
Shuffled activity was generated by randomizing the timing of the calcium events to construct a novel de-noised ΔF/F trace. Matched shuffled activity was selected by using neurons from the same imaging subvolume (i.e., concurrently imaged to ensure identical animal behavior) sharing a similar event rate. Event rates were matched by partitioning the neurons from a subvolume into 10 equally sized bins (in terms of neuron count). Thus, in addition to the aforementioned encoding score threshold, a given neuron’s R had to exceed the 99th percentile of R’s obtained across neurons in the same subvolume and event rate bin whose event times were shuffled.
We examined robustness by partitioning individual days into two interdigitated pseudo-sessions, and measuring the correlation between encoding scores for the two pseudo-sessions7. The resulting correlations ranged between ~0.5-0.75. Neural classification (whisking and touch) was stable across days for trained mice. Furthermore, the touch neuron curvature kernels assumed ‘V’ or ‘L’-like shapes7, meaning that high magnitude curvature changes drove the largest responses, a result consistent with the known responses of these neurons. Finally, the kernels were stable across days7. Thus, changes in barrel cortex encoding following ablation are not a reflection of the variability inherent to the encoding model, but rather reflect genuine changes in the underlying representations.
Ablated neurons were always excluded from analysis of experimental data, including calculations of pre-ablation population encoding scores. Analyses involving ‘pre-ablation’ and ‘post-ablation’ data were pooled across multiple behavioral sessions. Pre- and post-ablation data each consisted of at least 2 (but typically 3) behavioral sessions, with each subvolume sampled on most sessions. Given that a single subvolume was imaged for around 50 trials in a session, classification typically employed around 150 behavioral trials per neuron (minimum for encoding model: 100 trials). Neurons participating in both representations in a given area were excluded from analysis. In all cases where comparisons of pre- and post-ablation distributions were made, neurons were included for analysis if they met the criteria for representation membership (described above) in the pre- or post-ablation period, or during both periods.
Multiphoton ablation
Ablations9,48,49 were performed with 880 nm (Chameleon Ultra 2; Coherent) or 1040 nm (Fidelity HP; Coherent) femtosecond laser pulses delivered through a 0.8 NA, 16 X objective (Nikon) in animals that were awake but not performing the task or lightly anesthetized using isoflurane (1-2%). On the day of ablation, a new image was acquired and a warp field transform was employed to find the target neurons46. Imaging was not performed on the day of ablation; post-ablation analyses used the imaging data from the 2-4 behavioral sessions on the days following ablation. Typically, experiments consisted of three days of pre-ablation data collection, the ablation day, and three days of post-ablation data collection.
In virally transfected mice, the mCherry signal was used to restrict ablations to pyramidal neurons7; in mice endogenously expressing GCaMP, presence of fluorophore was used for this purpose. The neurons with strongest touch or whisking encoding scores within the spared barrel column were targeted for ablation. The percentage of touch and whisking neurons ablated was calculated in relation to the estimated 1,691 pyramidal neurons in L2/316, of which 17% (287) belonged to each representation7. Neurons participating in both representations (touch and whisking) were avoided. For silent cell ablation, neurons with a calcium event rate below 0.025 Hz were targeted for ablation.
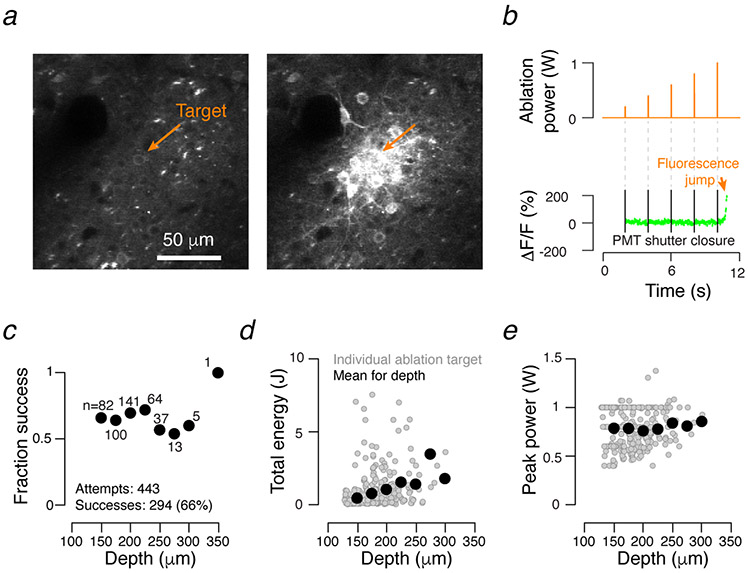
In all cases, approximately 2/3 of ablations were successful (Extended Data 2c). Proximity to vasculature, low baseline fluorescence, and excessive depth accounted for most failures. Thus, despite targeting the strongest neurons in a given representation, the actual representation strength of ablated neurons varied. The encoding score percentile of the ablated neurons is therefore reported in the text.
After ablation we consistently observed an increase in GCaMP6 fluorescence in the targeted neuron (Extended Data 2a,b). Taking advantage of this signature, the ablation protocol consisted of interleaved ‘ablation’ and ‘evaluation’ epochs (Extended Data 2b; ablation duration: 50-200 ms; evaluation: 0.1-2 s, with longer evaluation times proving more reliable). Ablation epoch power started at the evaluation epoch power (25-100 mW, measured at the specimen) and rose linearly as necessary (up to 1W) over the course of several seconds. The beam was focused on the brightest part of the targeted neuron using a pair of galvanometers (Cambridge Technology) and oscillated over a path spanning 1-2 μm. Evaluation epoch fluorescence data was collected using standard resonant galvanometer imaging7, though restricted to a single plane (~30 Hz). Ablations were terminated after observation of the fluorescence rise in the target neuron.
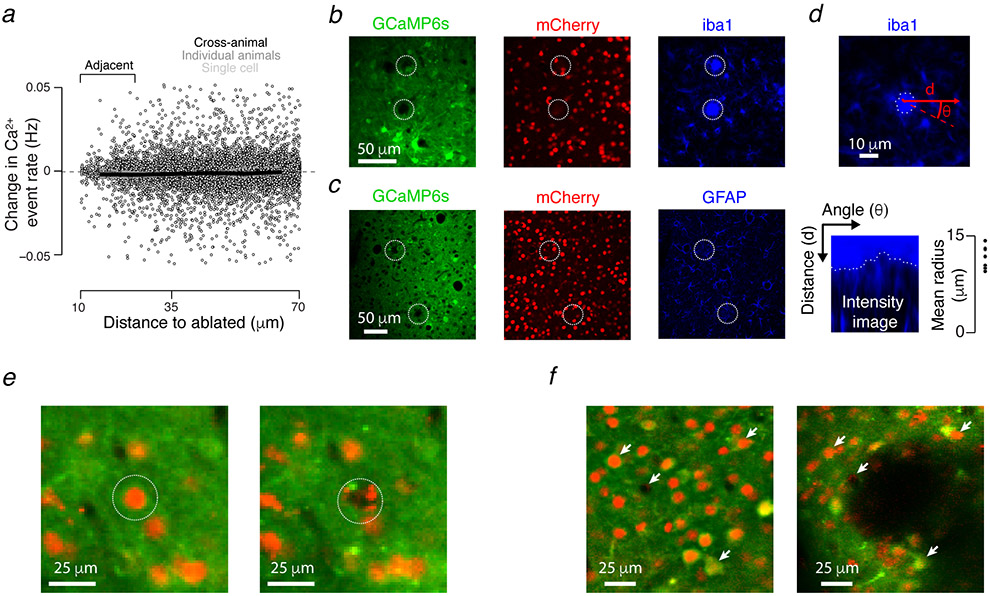
Consistent with similar protocols10,50, ablation did not produce off-target damage: calcium event rates for neurons adjacent (10-25 μm) to ablated cells did not change following the ablation of silent neurons (Extended Data 3a), and glial immunoreactivity was confined to the site of the lesioned neuron (Extended Data 3b-d).
Typically, 10-50 ablations were performed over the course of one hour. For histological analysis (Extended Data 3b-d), perfusion was performed 24h after ablation in two Emx1-Cre X LSL-H2B-mCherry animals (9 and 28 ablations were successful in these animals, approximating typical experimental conditions). Alternating cryomicrotome (Leica) sections were exposed to antibodies for either the microglial marker iba1 (Abcam, ab5076) or the astrocytic marker GFAP (Abcam, ab7260). Glial reactions were measured by first locating the ablated neuron’s center in the glial immunoreaction image. An edge detection algorithm39 that operated on an intensity image in angle-distance space from the neuron center detected the reaction’s extent (Extended Data 3d). Specifically, intensity profiles were measured across a range of angles emanating from the point within the ablation. To delimit the glial reaction, large drops in intensity were detected. Glia was considered reactive if the intensity inside the detected reaction area was two standard deviations above background image intensity.
Following ablation, nearby neurons retained sensory responses (Fig. 2f), event rate (Extended Data 3a), and maintained structural integrity (Extended Data 3b,c,e). In a few instances (N = 5) the ablation termination protocol failed, resulting in more extensive lesions (Extended Data 3f). These experiments were excluded from the study.
We excluded ablated neurons as well as neurons within a cylinder centered on ablated neurons having a radius of 10 μm and a height of 60 μm from all analyses. This excluded neurons abutting ablated cells, and ensured no neurons within a typical glial reaction radius would be included.
Response similarity
For simulated data, response similarity was measured by taking the Pearson correlation of the Gaussian-convolved (kernel standard deviation, 20 ms) activity of an individual neuron with the mean Gaussian-convolved activity of the ablated neurons (Fig. 3a). For experimental data, response similarity was measured by correlating the individual neuronal trial averaged ΔF/F to the ablated neuron trial average mean. For each neuron, trial averaged ΔF/F was calculated by taking the mean ΔF/F across all correct proximal and distal pole trials (Fig. 3c), then concatenating these two vectors (Fig. 3d). The mean of these vectors across the ablated neurons constituted the ‘ablated neuron mean’ (Fig. 3d). Response similarity is simply the Pearson correlation of the individual neuron trial averaged ΔF/F with the mean trial averaged ΔF/F across all ablated neurons. Single-network (Fig. 3b) or animal (Figs. 3e, f, g) averages were computed with response similarity bins having a width of 0.1. The grand mean of these is shown as a dark line on these plots. Only strongly responding neurons (encoding score > 0.25) were considered in this analysis (other analyses use a cutoff of 0.1).
Trial-averaged ΔF/F correlations were employed instead of raw activity correlations because neurons were not all imaged simultaneously; only neurons in a given subvolume were imaged simultaneously. Because ablated neurons came from multiple subvolumes, response similarity had to employ trial-averaged responses to allow for comparison across disjointly recorded populations.
Statistical analyses
The majority of statistical comparisons were performed using the Wilcoxon signed rank test comparing paired medians within individual animals for two conditions (e.g., before and after ablation, or proximal and distal encoding score change). For cases where values had no natural pairing (comparison of different ablation types), the Wilcoxon rank sum test comparing medians was used to compare distributions. To test if encoding score change depended on response similarity (Fig. 3), we first fit a line to individual networks or animals (e.g., Fig. 3e; the linear fit is distinct from the cross-cell mean that is shown). Next, we tested whether the slopes thus obtained were distinct from 0 across all networks or animals using the non-parametric sign test.
In all cases, we used the median of single-neuron values within an animal. That is, we treated mice, and never neurons, as independent observations. Where relevant, the total number of neurons included across all mice was given. Where given, adjusted median absolute deviation (M.A.D.) was calculated by multiplying the median absolute deviation by 1.4826 so as to approximate the standard deviation under conditions of normality. Sample sizes were similar to those used by others in the field. No statistical tests were used to determine sample sizes.
Extended Data
Extended Data 1.
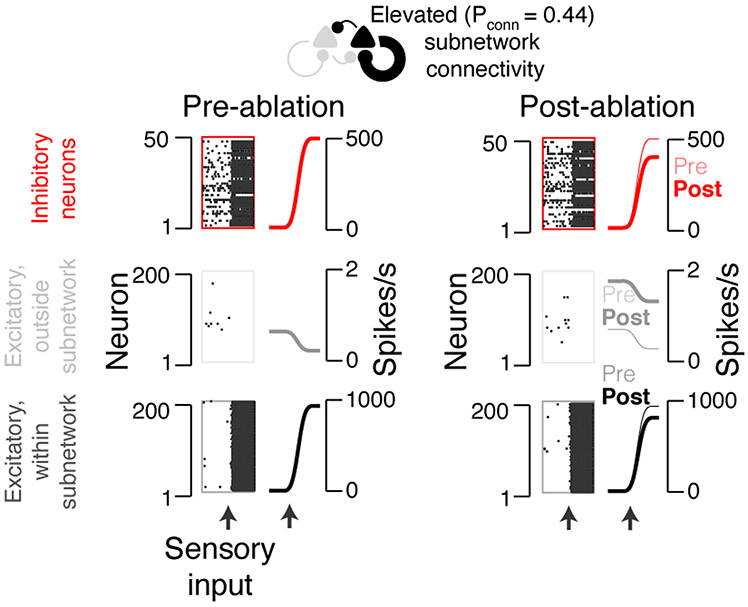
Effect of ablation in a simulated network with hyper-connectivity (i.e., Pconn > 0.4; here, Pconn = 0.44). Model network responses aligned to input (arrow, bottom). Raster plots show a subset of neurons from an example network. Peri-stimulus time histograms show averages across all neurons and networks. Bottom, excitatory neurons within subnetwork; middle, excitatory neurons outside subnetwork; top, inhibitory neurons. Left, network response before ablation of 10% of the subnetwork neurons; right, response after ablation.
Extended Data 2.
Multi-photon ablation protocol. a. Example field of view immediately before (left) and after (right) an ablation. Orange arrow, target neuron. b. Ablation protocol. Power (orange, top trace) during ablation epochs (100 ms; elevated power, orange, top) gradually increased, and the PMT shutter was closed (black bars). During the intervening evaluation epochs, power was lower and constant (orange, top), and the PMT shutter was open. Ablation was terminated when GCaMP fluorescence at the target neuron (green) jumped (orange arrow). c. Success of ablation as a function of neuron depth for all experiments included in this dataset. Individual points give mean success rate for given depth bin; bin size, 25 μm. d. Depth dependence of total energy deposition for successful ablations (successfully ablated cells only: N = 293 cells across 22 sessions, 14 animals; ablations from j250220 and j257218, along with 7 additional ablations from other animals were excluded due to incomplete logging). Grey dots, individual ablations. Black dots, means across 25 μm bins. e. As in d, but for peak power needed for ablation (N = 293 cells across 22 sessions, 14 animals).
Extended Data 3.
Multi-photon ablation produces spatially localized effects. a. Change in calcium event rate (Methods) as a function of minimal distance to an ablated neuron following silent cell ablation. Individual neurons appear as gray points, with dark gray dashed lines showing single animal averages and the dark black line showing the cross-animal (N = 8 silent ablation mice) average. Event rates among neurons adjacent to ablated silent cells did not change (pre-ablation event rate: 0.014 ± 0.008 Hz, grand median ± adjusted M.A.D., Methods, post-ablation: 0.014 ± 0.007 Hz; P = 0.055 pre- vs. post-ablation, Wilcoxon signed rank test, paired medians across N = 8 mice; 1,028 neurons across all mice). b. Confocal ex vivo image from an animal perfused 24 h following ablation. Ablation sites are indicated with dashed white circles. Green, GCaMP6s fluorescence; red, mCherry fluorescence; blue, microglial antibody iba1 fluorescence. c. As in b, but blue shows immunoreactivity for the astrocytic marker, GFAP. d. The spatial extent of glial reaction was measured by detecting the fastest intensity decline ridge (dashed white line; Methods) in the glial antibody image along lines emanating from the ablation center at varied angles. Top, ridge along ablation from b. Bottom left, intensity image in angle-distance space within which the ridge was measured. Bottom right, distribution of reaction radii; all points constitute iba1 labeling, as no detectable glial reactions were observed with GFAP: 8 of 10 iba1-labeled and 0 of 6 GFAP-labeled ablations retrieved histologically revealed a detectable glial reaction (Methods). These reactions had radii of 11.7 ± 1.7 μm (mean ± S.D.; N = 8 sites). e. Two-photon in vivo images before (left) and after (right) a successful ablation (target, white dotted line). Green, GCaMP6s fluorescence; red, mCherry fluorescence. f. As in e, but following a failure of the ablation protocol to terminate the ablation. Excess energy deposition produced a large lesion (black, center of image). White arrows, corresponding points in the two images. Animals (N = 5) with such lesions were excluded from the study.
Extended Data 4.
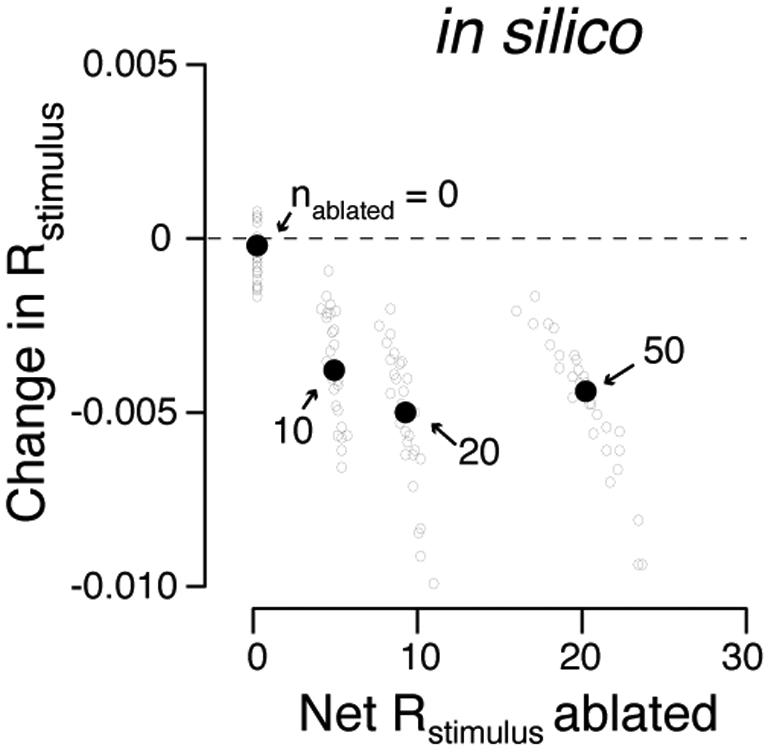
Effect of ablation on L2/3 model sensory representation increases with the number of ablated neurons. Ablation effect (change in Rstimulus) as a function of the degree of touch representation degradation (net Rstimulusacross ablated neurons). In all cases, we used elevated subnetwork connectivity (0.4; Figure 1, Methods). The Nablated neurons with the highest encoding score were selected for ablation. Grey circles, individual networks. Black dots, median across N = 30 simulated networks for a given number of ablated neurons, indicated in the plot. Beyond Nablated > 50, we observed instability, presumably because we did not attempt to restore excitatory-inhibitory balance following ablation; these data were omitted. Correlation of net Rstimulus ablated and ΔRstimulus: R = −0.65, P < 0.01.
Extended Data 5.
Touch neuron ablation does not produce distance-dependent effects in the whisking representation. Proximal (15-35 μm to nearest ablated cell) change in Pwhisking: 0.000 ± 0.192 (grand median ± adjusted M.A.D.); distal (115-135 μm): −0.023 ± 0.186, (P-value given for Wilcoxon signed rank test comparing proximal paired to distal, N = 9 mice); legend as in Fig. 2m.
Extended Data 6.
Behavior does not account for ablation effects. a. Pre- (dark blue) and post-touch neuron ablation (light blue) distributions for whisker angle (θ), angle at touch (θ at touch), and net curvature change across all touches (net Δκ at touch) in an example animal. P-values, Kolmogorov-Smirnov test comparing a variable’s distributions prior to and after ablation in individual mice. No animal showed a significant (P < 0.05) change in any of the three parameters. b. Fraction of correct trials (left) and number of touches (right) before and after touch neuron ablation. P-values, Wilcoxon signed rank test, paired by mouse, N = 9 mice. c, d. As in a, b, but for silent neuron ablations, N = 8 mice. e, f. As in a, b, but for whisking neuron ablations, N = 7 mice.
Extended Data 7.
Example effects of whisking and silent neuron ablations. a. Example whisking neuron ablation. Left, example maps for touch (top, blue) and whisking (bottom, green) cells before ablation. Sphere size corresponds to Rtouch (top) or Rwhisking (bottom). Grey dots, other neurons. These maps exclude the ablated neurons, whose position is indicated with a faint orange background. Center, Rtouch (top) and Rwhisking (bottom) for the ablated population. Right, Rtouch (top) and Rwhisking (bottom) following ablation, with ablated neurons again excluded. b. As in a, but for silent neuron ablation.
Extended Data 8.
Simulation of whisking neuron ablation produces representation degradation in networks with elevated, but not equal subnetwork connectivity. a. Whisking input was simulated by using input with a peak time of 50 ms (bottom), in contrast to 10 ms for touch (top; Fig. 1). b. Model network responses aligned to input prior to ablation. Left to right, increasing subnetwork connectivity. Bottom to top, raster plots (each showing a subset of neurons from an example network) and peristimulus time histograms (PSTHs; averaged across all neurons and networks) for the three neuronal populations in the model (Figure 1a; Methods). c. As in b, but following ablation. Thin PSTHs are before ablation. Encoding score change after ablation: from 0.143 ± 0.024 to 0.104 ± 0.013, grand median ± adjusted M.A.D., P < 0.001, Wilcoxon signed rank test paired by network, N = 30 networks.
Extended Data Table 1.
Individual mice are listed with the number of neurons imaged, the type(s) of ablation(s) performed, and the number of neurons ablated. The number of touch and whisking neurons is given (for the 0.1 encoding score criteria, Methods), as well as the change in median encoding score following ablation. Animals with IDs starting with a ‘j’ were virally transfected Emx1-Cre X LSL-H2B-mCherry7; animals with ID starting with an ‘n’ were Ai162 X Slc17a7-Cre40.
| Animal ID | Cell count |
Ablated type | Ablated count |
Touch count |
ΔRtouch | Whisking count |
ΔRwhisking |
|---|---|---|---|---|---|---|---|
| j250220 | 8,844 | touch | 50 | 867 | −0.122 | 422 | −0.076 |
| j257218 | 6,215 | silent | 20 | 743 | 0.018 | 366 | 0.032 |
| j257220 | 3,663 | touch | 9 | 389 | −0.004 | 455 | 0.025 |
| j258836 | 7,290 | silent | 16 | 481 | 0.066 | 666 | −0.012 |
| touch | 15 | 488 | −0.055 | 655 | 0.001 | ||
| j271211 | 9,415 | silent | 16 | 2,476 | −0.012 | 551 | −0.007 |
| touch | 15 | 1,951 | −0.061 | 692 | 0.021 | ||
| j278937 | 4,230 | silent | 15 | 146 | 0.004 | 379 | 0.001 |
| whisking | 12 | 150 | −0.006 | 392 | 0.011 | ||
| j278939 | 7,167 | silent | 20 | 636 | −0.024 | 698 | 0.001 |
| whisking | 13 | 523 | −0.017 | 649 | −0.015 | ||
| j281915 | 7,002 | whisking | 8 | 723 | −0.010 | 550 | 0.004 |
| touch | 11 | 601 | −0.022 | 672 | 0.008 | ||
| n274424 | 7,785 | touch | 17 | 706 | −0.029 | 718 | −0.014 |
| n272761 | 6,359 | touch | 14 | 509 | −0.001 | 410 | 0.000 |
| n274577 | 12,173 | touch | 11 | 1,380 | −0.013 | 657 | 0.004 |
| n275801 | 8,354 | silent | 14 | 220 | 0.000 | 738 | −0.007 |
| touch | 9 | 197 | −0.065 | 698 | −0.006 | ||
| n275798 | 11,364 | silent | 13 | 959 | 0.002 | 958 | 0.002 |
| whisking | 11 | 972 | 0.008 | 1,037 | 0.011 | ||
| n278288 | 9,314 | whisking | 25 | 969 | −0.008 | 813 | −0.006 |
| n276013 | 11,659 | silent | 16 | 652 | 0.028 | 1,072 | −0.001 |
| whisking | 9 | 634 | −0.012 | 968 | −0.008 | ||
| n278759 | 9,187 | whisking | 11 | 617 | −0.003 | 526 | −0.004 |
Acknowledgments
We thank Shaul Druckmann, Sandro Romani, Diego Gutnisky, Nuo Li, Jianing Yu, Hidehiko Inagaki, Nicholas Sofroniew, and Mike Economo for comments on the manuscript, Amy Hu for histology, and Hongkui Zeng for the Ai162 transgenic mice. Funding was provided by the Howard Hughes Medical Institute. RP was supported by NIH T32GM007308.
Footnotes
Data and code availability
Code for the simulations can be found at https://github.com/jwittenbach/ablation-sim.
Code used for data analysis can be found at https://github.com/peronlab/ablation.
Data can be found at CRCNS.org at http://dx.doi.org/10.6080/K0Z31WWG.
Competing interests
The authors declare no competing interests.
References:
- 1.Douglas RJ, Koch C, Mahowald M, Martin KA & Suarez HH Recurrent excitation in neocortical circuits. Science 269, 981–985 (1995). [DOI] [PubMed] [Google Scholar]
- 2.Chance FS, Nelson SB & Abbott LF Complex cells as cortically amplified simple cells. Nat Neurosci 2, 277–282, doi: 10.1038/6381 (1999). [DOI] [PubMed] [Google Scholar]
- 3.Christie IK, Miller P & Van Hooser SD Cortical amplification models of experience-dependent development of selective columns and response sparsification. J Neurophysiol 118, 874–893, doi: 10.1152/jn.00177.2017 (2017). [DOI] [PMC free article] [PubMed] [Google Scholar]
- 4.Miller KD Canonical computations of cerebral cortex. Curr Opin Neurobiol 37, 75–84, doi: 10.1016/j.conb.2016.01.008 (2016). [DOI] [PMC free article] [PubMed] [Google Scholar]
- 5.Cossell L et al. Functional organization of excitatory synaptic strength in primary visual cortex. Nature 518, 399–403, doi: 10.1038/nature14182 (2015). [DOI] [PMC free article] [PubMed] [Google Scholar]
- 6.Lee WC et al. Anatomy and function of an excitatory network in the visual cortex. Nature 532, 370–374, doi: 10.1038/nature17192 (2016). [DOI] [PMC free article] [PubMed] [Google Scholar]
- 7.Peron SP, Freeman J, Iyer V, Guo C & Svoboda K A Cellular Resolution Map of Barrel Cortex Activity during Tactile Behavior. Neuron 86, 783–799, doi: 10.1016/j.neuron.2015.03.027 (2015). [DOI] [PubMed] [Google Scholar]
- 8.Peron S & Svoboda K From cudgel to scalpel: toward precise neural control with optogenetics. Nat Methods 8, 30–34, doi: 10.1038/nmeth.f.325 (2011). [DOI] [PubMed] [Google Scholar]
- 9.Konig K, Becker TW, Fisher P, Riemann I & Halbhuber KJ Pulse-length dependence of cellular response to intense near-infrared laser pulses in multiphoton microscopes. Optics Lett. 24, 113–115 (1999). [DOI] [PubMed] [Google Scholar]
- 10.Vladimirov N et al. Brain-wide circuit interrogation at the cellular level guided by online analysis of neuronal function. Nat Methods 15, 1117–1125, doi: 10.1038/s41592-018-0221-x (2018). [DOI] [PubMed] [Google Scholar]
- 11.Rubin DB, Van Hooser SD & Miller KD The stabilized supralinear network: a unifying circuit motif underlying multi-input integration in sensory cortex. Neuron 85, 402–417, doi: 10.1016/j.neuron.2014.12.026 (2015). [DOI] [PMC free article] [PubMed] [Google Scholar]
- 12.Harris KD & Mrsic-Flogel TD Cortical connectivity and sensory coding. Nature 503, 51–58, doi: 10.1038/nature12654 (2013). [DOI] [PubMed] [Google Scholar]
- 13.Mateo C et al. In vivo optogenetic stimulation of neocortical excitatory neurons drives brain-state-dependent inhibition. Curr Biol 21, 1593–1602, doi: 10.1016/j.cub.2011.08.028 (2011). [DOI] [PubMed] [Google Scholar]
- 14.Barrett DG, Deneve S & Machens CK Optimal compensation for neuron loss. Elife 5, doi: 10.7554/eLife.12454 (2016). [DOI] [PMC free article] [PubMed] [Google Scholar]
- 15.Avermann M, Tomm C, Mateo C, Gerstner W & Petersen CC Microcircuits of excitatory and inhibitory neurons in layer 2/3 of mouse barrel cortex. J Neurophysiol 107, 3116–3134, doi: 10.1152/jn.00917.2011 (2012). [DOI] [PubMed] [Google Scholar]
- 16.Lefort S, Tomm C, Floyd Sarria JC & Petersen CC The excitatory neuronal network of the C2 barrel column in mouse primary somatosensory cortex. Neuron 61, 301–316, doi: 10.1016/j.neuron.2008.12.020 (2009). [DOI] [PubMed] [Google Scholar]
- 17.Crochet S, Poulet JF, Kremer Y & Petersen CC Synaptic mechanisms underlying sparse coding of active touch. Neuron 69, 1160–1175, doi: 10.1016/j.neuron.2011.02.022 (2011). [DOI] [PubMed] [Google Scholar]
- 18.Hires SA, Gutnisky DA, Yu J, O'Connor DH & Svoboda K Low-noise encoding of active touch by layer 4 in the somatosensory cortex. Elife 4, doi: 10.7554/eLife.06619 (2015). [DOI] [PMC free article] [PubMed] [Google Scholar]
- 19.Litwin-Kumar A & Doiron B Slow dynamics and high variability in balanced cortical networks with clustered connections. Nat Neurosci 15, 1498–1505, doi: 10.1038/nn.3220 (2012). [DOI] [PMC free article] [PubMed] [Google Scholar]
- 20.Chettih SN & Harvey CD Single-neuron perturbations reveal feature-specific competition in V1. Nature 567, 334–340, doi: 10.1038/s41586-019-0997-6 (2019). [DOI] [PMC free article] [PubMed] [Google Scholar]
- 21.Holmgren C, Harkany T, Svennenfors B & Zilberter Y Pyramidal cell communication within local networks in layer 2/3 of rat neocortex. J Physiol 551, 139–153, doi: 10.1113/jphysiol.2003.044784 (2003). [DOI] [PMC free article] [PubMed] [Google Scholar]
- 22.Curtis JC & Kleinfeld D Phase-to-rate transformations encode touch in cortical neurons of a scanning sensorimotor system. Nat Neurosci 12, 492–501 (2009). [DOI] [PMC free article] [PubMed] [Google Scholar]
- 23.Marshel JH et al. Cortical layer-specific critical dynamics triggering perception. Science 365, doi: 10.1126/science.aaw5202 (2019). [DOI] [PMC free article] [PubMed] [Google Scholar]
- 24.Carrillo-Reid L, Han S, Yang W, Akrouh A & Yuste R Controlling Visually Guided Behavior by Holographic Recalling of Cortical Ensembles. Cell 178, 447–457 e445, doi: 10.1016/j.cell.2019.05.045 (2019). [DOI] [PMC free article] [PubMed] [Google Scholar]
- 25.Lien AD & Scanziani M Tuned thalamic excitation is amplified by visual cortical circuits. Nat Neurosci 16, 1315–1323, doi: 10.1038/nn.3488 (2013). [DOI] [PMC free article] [PubMed] [Google Scholar]
- 26.Daie K, Svoboda K & Druckmann S Targeted photostimulation uncovers circuit motifs supporting short-term memory. bioRxiv, 623785, doi: 10.1101/623785 (2019). [DOI] [PubMed] [Google Scholar]
- 27.Hansel D & van Vreeswijk C The mechanism of orientation selectivity in primary visual cortex without a functional map. J Neurosci 32, 4049–4064, doi: 10.1523/JNEUROSCI.6284-11.2012 (2012). [DOI] [PMC free article] [PubMed] [Google Scholar]
- 28.Li N, Daie K, Svoboda K & Druckmann S Robust neuronal dynamics in premotor cortex during motor planning. Nature, doi: 10.1038/nature17643 (2016). [DOI] [PMC free article] [PubMed] [Google Scholar]
- 29.Petersen CC & Crochet S Synaptic computation and sensory processing in neocortical layer 2/3. Neuron 78, 28–48, doi: 10.1016/j.neuron.2013.03.020 (2013). [DOI] [PubMed] [Google Scholar]
- 30.Petersen CCH Sensorimotor processing in the rodent barrel cortex. Nat Rev Neurosci 20, 533–546, doi: 10.1038/s41583-019-0200-y (2019). [DOI] [PMC free article] [PubMed] [Google Scholar]
- 31.Brette R et al. Simulation of networks of spiking neurons: a review of tools and strategies. J Comput Neurosci 23, 349–398, doi: 10.1007/s10827-007-0038-6 (2007). [DOI] [PMC free article] [PubMed] [Google Scholar]
- 32.Bureau I, von Saint Paul F & Svoboda K Interdigitated Paralemniscal and Lemniscal Pathways in the Mouse Barrel Cortex. PLoS Biol 4, e382 (2006). [DOI] [PMC free article] [PubMed] [Google Scholar]
- 33.Xue M, Atallah BV & Scanziani M Equalizing excitation-inhibition ratios across visual cortical neurons. Nature 511, 596–600, doi: 10.1038/nature13321 (2014). [DOI] [PMC free article] [PubMed] [Google Scholar]
- 34.Gentet LJ et al. Unique functional properties of somatostatin-expressing GABAergic neurons in mouse barrel cortex. Nat Neurosci 15, 607–612, doi: 10.1038/nn.3051 (2012). [DOI] [PubMed] [Google Scholar]
- 35.Yu J, Gutnisky DA, Hires SA & Svoboda K Layer 4 fast-spiking interneurons filter thalamocortical signals during active somatosensation. Nat Neurosci 19, 1647–1657, doi: 10.1038/nn.4412 (2016). [DOI] [PubMed] [Google Scholar]
- 36.Yu J, Hu H, Agmon A & Svoboda K Recruitment of GABAergic Interneurons in the Barrel Cortex during Active Tactile Behavior. Neuron 104, 412–427 e414, doi: 10.1016/j.neuron.2019.07.027 (2019). [DOI] [PMC free article] [PubMed] [Google Scholar]
- 37.Stimberg M, Brette R & Goodman DF Brian 2, an intuitive and efficient neural simulator. Elife 8, doi: 10.7554/eLife.47314 (2019). [DOI] [PMC free article] [PubMed] [Google Scholar]
- 38.Gorski JA et al. Cortical excitatory neurons and glia, but not GABAergic neurons, are produced in the Emx1-expressing lineage. The Journal of neuroscience : the official journal of the Society for Neuroscience 22, 6309–6314, doi:20026564 (2002). [DOI] [PMC free article] [PubMed] [Google Scholar]
- 39.Chen TW et al. Ultrasensitive fluorescent proteins for imaging neuronal activity. Nature 499, 295–300, doi: 10.1038/nature12354 (2013). [DOI] [PMC free article] [PubMed] [Google Scholar]
- 40.Daigle TL et al. A Suite of Transgenic Driver and Reporter Mouse Lines with Enhanced Brain-Cell-Type Targeting and Functionality. Cell 174, 465–480 e422, doi: 10.1016/j.cell.2018.06.035 (2018). [DOI] [PMC free article] [PubMed] [Google Scholar]
- 41.Guo ZV et al. Procedures for behavioral experiments in head-fixed mice. PLoS One 9, e88678, doi: 10.1371/journal.pone.0088678 (2014). [DOI] [PMC free article] [PubMed] [Google Scholar]
- 42.O'Connor DH et al. Vibrissa-based object localization in head-fixed mice. J Neurosci 30, 1947–1967, doi: 10.1523/JNEUROSCI.3762-09.2010 (2010). [DOI] [PMC free article] [PubMed] [Google Scholar]
- 43.Guo ZV et al. Flow of cortical activity underlying a tactile decision in mice. Neuron 81, 179–194, doi: 10.1016/j.neuron.2013.10.020 (2014). [DOI] [PMC free article] [PubMed] [Google Scholar]
- 44.Clack NG et al. Automated tracking of whiskers in videos of head fixed rodents. PLoS Comput Biol 8, e1002591, doi: 10.1371/journal.pcbi.1002591 (2012). [DOI] [PMC free article] [PubMed] [Google Scholar]
- 45.Pologruto TA, Sabatini BL & Svoboda K ScanImage: Flexible software for operating laser-scanning microscopes. BioMedical Engineering OnLine 2, 13 (2003). [DOI] [PMC free article] [PubMed] [Google Scholar]
- 46.Huber D et al. Multiple dynamic representations in the motor cortex during sensorimotor learning. Nature 484, 473–478, doi: 10.1038/nature11039 (2012). [DOI] [PMC free article] [PubMed] [Google Scholar]
- 47.Ahrens MB, Paninski L & Sahani M Inferring input nonlinearities in neural encoding models. Network 19, 35–67, doi: 10.1080/09548980701813936 (2008). [DOI] [PubMed] [Google Scholar]
- 48.Orger MB, Kampff AR, Severi KE, Bollmann JH & Engert F Control of visually guided behavior by distinct populations of spinal projection neurons. Nat Neurosci 11, 327–333, doi: 10.1038/nn2048 (2008). [DOI] [PMC free article] [PubMed] [Google Scholar]
- 49.Allegra Mascaro AL, Sacconi L & Pavone FS Multi-photon nanosurgery in live brain. Frontiers in neuroenergetics 2, doi: 10.3389/fnene.2010.00021 (2010). [DOI] [PMC free article] [PubMed] [Google Scholar]
- 50.Canty AJ et al. In-vivo single neuron axotomy triggers axon regeneration to restore synaptic density in specific cortical circuits. Nat Commun 4, 2038, doi: 10.1038/ncomms3038 (2013). [DOI] [PubMed] [Google Scholar]


