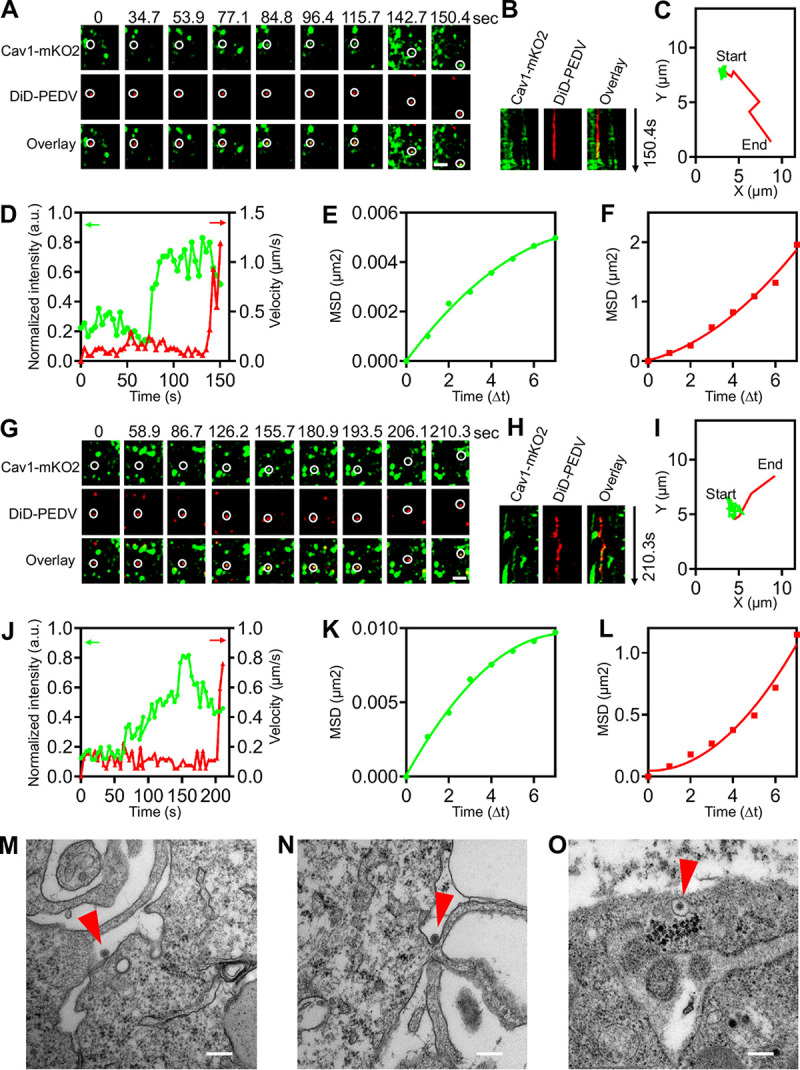
FIG 4.

Productive CavME of PEDV. (A) Time-lapse images of two PEDVs (red) entering cells expressing Cav1-mKO2 (green). Scale bar, 2 μm. (B) Kymographs at viral binding site. (C) Trajectories of PEDV infection during viral binding (green) and moving (red) stages. (D) Time-lapse Cla-EGFP fluorescence intensities at viral binding sites and PEDV velocities. (E, F) MSD plots of the PEDV movements during viral binding and moving stages, respectively. (G to L) Another set of time-lapse images and analysis of PEDV entry via CME. Scale bar, 2 μm. (M to O) Ultrastructural analysis on CavME of PEDV, and in O, PEDV indicated with arrow was invaginated in a smooth vesicle. Scale bar, 200 nm.
