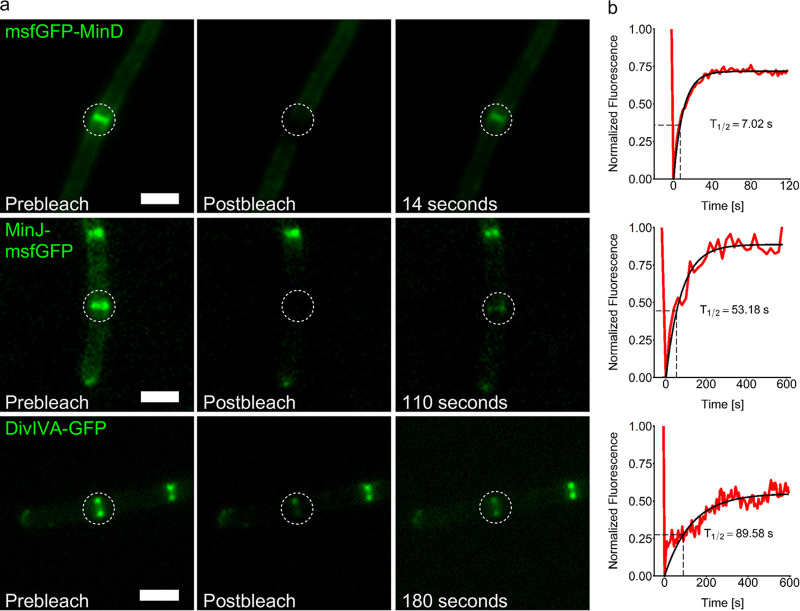
FIG 1.
FRAP experiments in growing B. subtilis cells reveal Min protein dynamics. (a) Representative microscopy images of msfGFP-MinD (BHF017), MinJ-msfGFP (BHF007), and DivIVA-GFP (1803) before bleaching of the indicated spot with a 488-nm laser pulse, directly after bleaching, and after recovery of fluorescence. Scale bars, 2 μm. (b) Representation of the normalized fluorescence recovery in the green channel over time. T1/2 = time when fluorescence recovery reaches half height of total recovery; the shown value corresponds to the displayed cell, indicated on the graph with a dashed square. The red line represents measured values of the displayed cell, and the black line represents the fitted values. Values were obtained as described in Materials and Methods (equations 1 to 3).

