FIG 5.
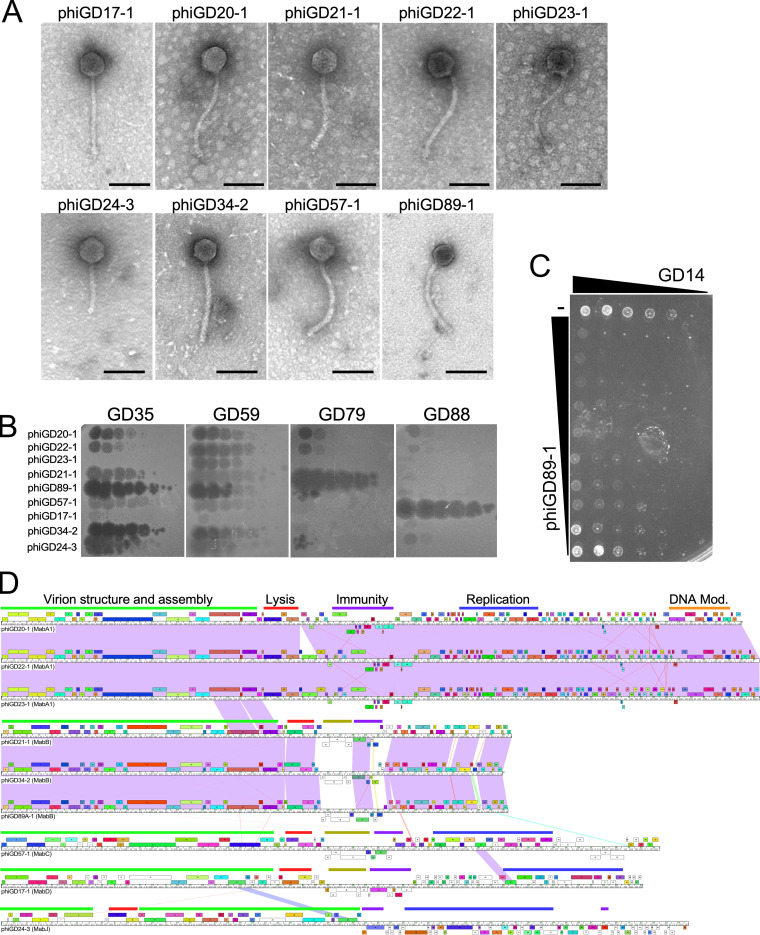
Lytically propagating phiGDxx phages. (A) Electron micrographs of nine lytically growing phages released by spontaneous prophage induction. Scale bar is 100 nm. (B) The nine lytically growing phages recovered from M. abscessus GD strains (as shown) were 10-fold serially diluted and spotted onto lawns of GD35, GD59, GD79, and GD88 to illustrate infection profiles. Full infection profiles are shown in Fig. 3. (C) Killing assay showing reduction in viability of M. abscessus GD14 by phiGD89-1. Configuration is as shown in Fig. 4C. (D) Genome maps of the nine lytically growing phages recovered from M. abscessus strains, with pairwise nucleotide sequence similarity shown as spectrum colored shading, with violet indicating closest similarity and red the least above a threshold BLASTN E value of 10−4. Genes are shown as boxes above (transcribed rightward) and below (transcribed leftward) each genome; boxes are colored according to the gene phamilies they are assigned (50). Slim bars above genome sequence identify categories of gene functions: green bar, structural genes; red bar, lysis cassette; purple bar, immunity cassette; blue bar, replication genes, orange bar, DNA modification genes; and olive bars, polymorphic toxin genes. Detailed genome maps for all phages are in Fig. S1 to S5 and Fig. S6 to S9 in the supplemental material (https://phagesdb.org/documents/categories/15/).

