

Abstract
Polycomb repressive complexes 1 and 2 (PRC1/2) maintain transcriptional silencing of developmental genes largely by catalyzing mono-ubiquitination of histone H2A at lysine 119 (H2AK119ub1) and trimethylation of histone H3 at lysine 27 (H3K27me3), respectively. How Polycomb domains are reprogrammed during mammalian preimplantation development remains largely unclear. Here we show that, although H2AK119ub1 and H3K27me3 are highly colocalized in gametes, they undergo differential reprogramming dynamics following fertilization. H3K27me3 maintains thousands of maternally biased domains up to the blastocyst stage, whereas maternally biased H2AK119ub1 distribution in zygotes is largely equalized at the two-cell stage. Notably, while maternal PRC2 depletion has a limited effect on global H2AK119ub1 in early embryos, it disrupts allelic H2AK119ub1 at H3K27me3 imprinting loci including Xist. By contrast, acute H2AK119ub1 depletion in zygotes does not affect H3K27me3 imprinting maintenance, at least by the four-cell stage. Importantly, loss of H2AK119ub1, but not H3K27me3, causes premature activation of developmental genes during zygotic genome activation (ZGA) and subsequent embryonic arrest. Thus, our study reveals distinct dynamics and functions of H3K27me3 and H2AK119ub1 in mouse preimplantation embryos.
Polycomb group proteins (PcGs) are chromatin regulators that play a profound role in normal development and disease progression. The catalytic core of PRC1 contains the E3 ubiquitin ligase RING1A or RING1B and one of the six PcG finger proteins (PCGFs)1–3. PRC1 can be further divided into canonical PRC1 and variant PRC1 (vPRC1), depending on whether it possesses a chromobox subunit3,4. The PRC2 core subunits include the histone methyltransferase EZH1 or EZH2 and the structural components embryonic ectoderm development (EED) and SUZ12 (ref.5). PRC1/2 are usually colocalized at developmental gene promoters demarcated by both H2AK119ub1 (H2Aub) and H3K27me3 (ref.6). Early studies indicated that PRC2-deposited H3K27me3 can recruit canonical PRC1 through binding of H3K27me3 by the chromo domain of the chromobox subunit7–9. However, recent studies indicated that vPRC1 mediates H2Aub-dependent PRC2 recruitment10–13. Both models underscore a coordinated function of PRC1/2 in PcG-mediated gene silencing.
Critical roles of PRC1/2 in embryonic stem cells (ESCs) and somatic tissue development have been well-established by both epigenomic and functional studies5,14,15. However, PcG activities in mammalian preimplantation embryos have remained underexplored due to the paucity of cells for epigenomic analyses. Recent development of low-input chromatin profiling techniques has made it feasible to investigate genome-wide histone modifications in mammalian germ cells and early embryos16–18. It was shown that oocyte-derived H3K27me3 can persist through preimplantation development to mediate germline DNA methylation-independent genomic imprinting (also known as noncanonical imprinting or H3K27me3 imprinting)19–21. By contrast, H3K27me3 at developmental gene promoters, the typical PcG targets, is largely depleted upon fertilization and is only fully re-established after implantation22. These intriguing observations suggest that regulation of PcG activities in mouse oocytes and preimplantation embryos is likely different from that discovered in other systems such as ESCs. Thus, we sought to investigate the dynamics and function of H2Aub, as well as the interplay between H3K27me3 and H2Aub during early development in mice.
Results
H2Aub is highly dynamic during early development in mice.
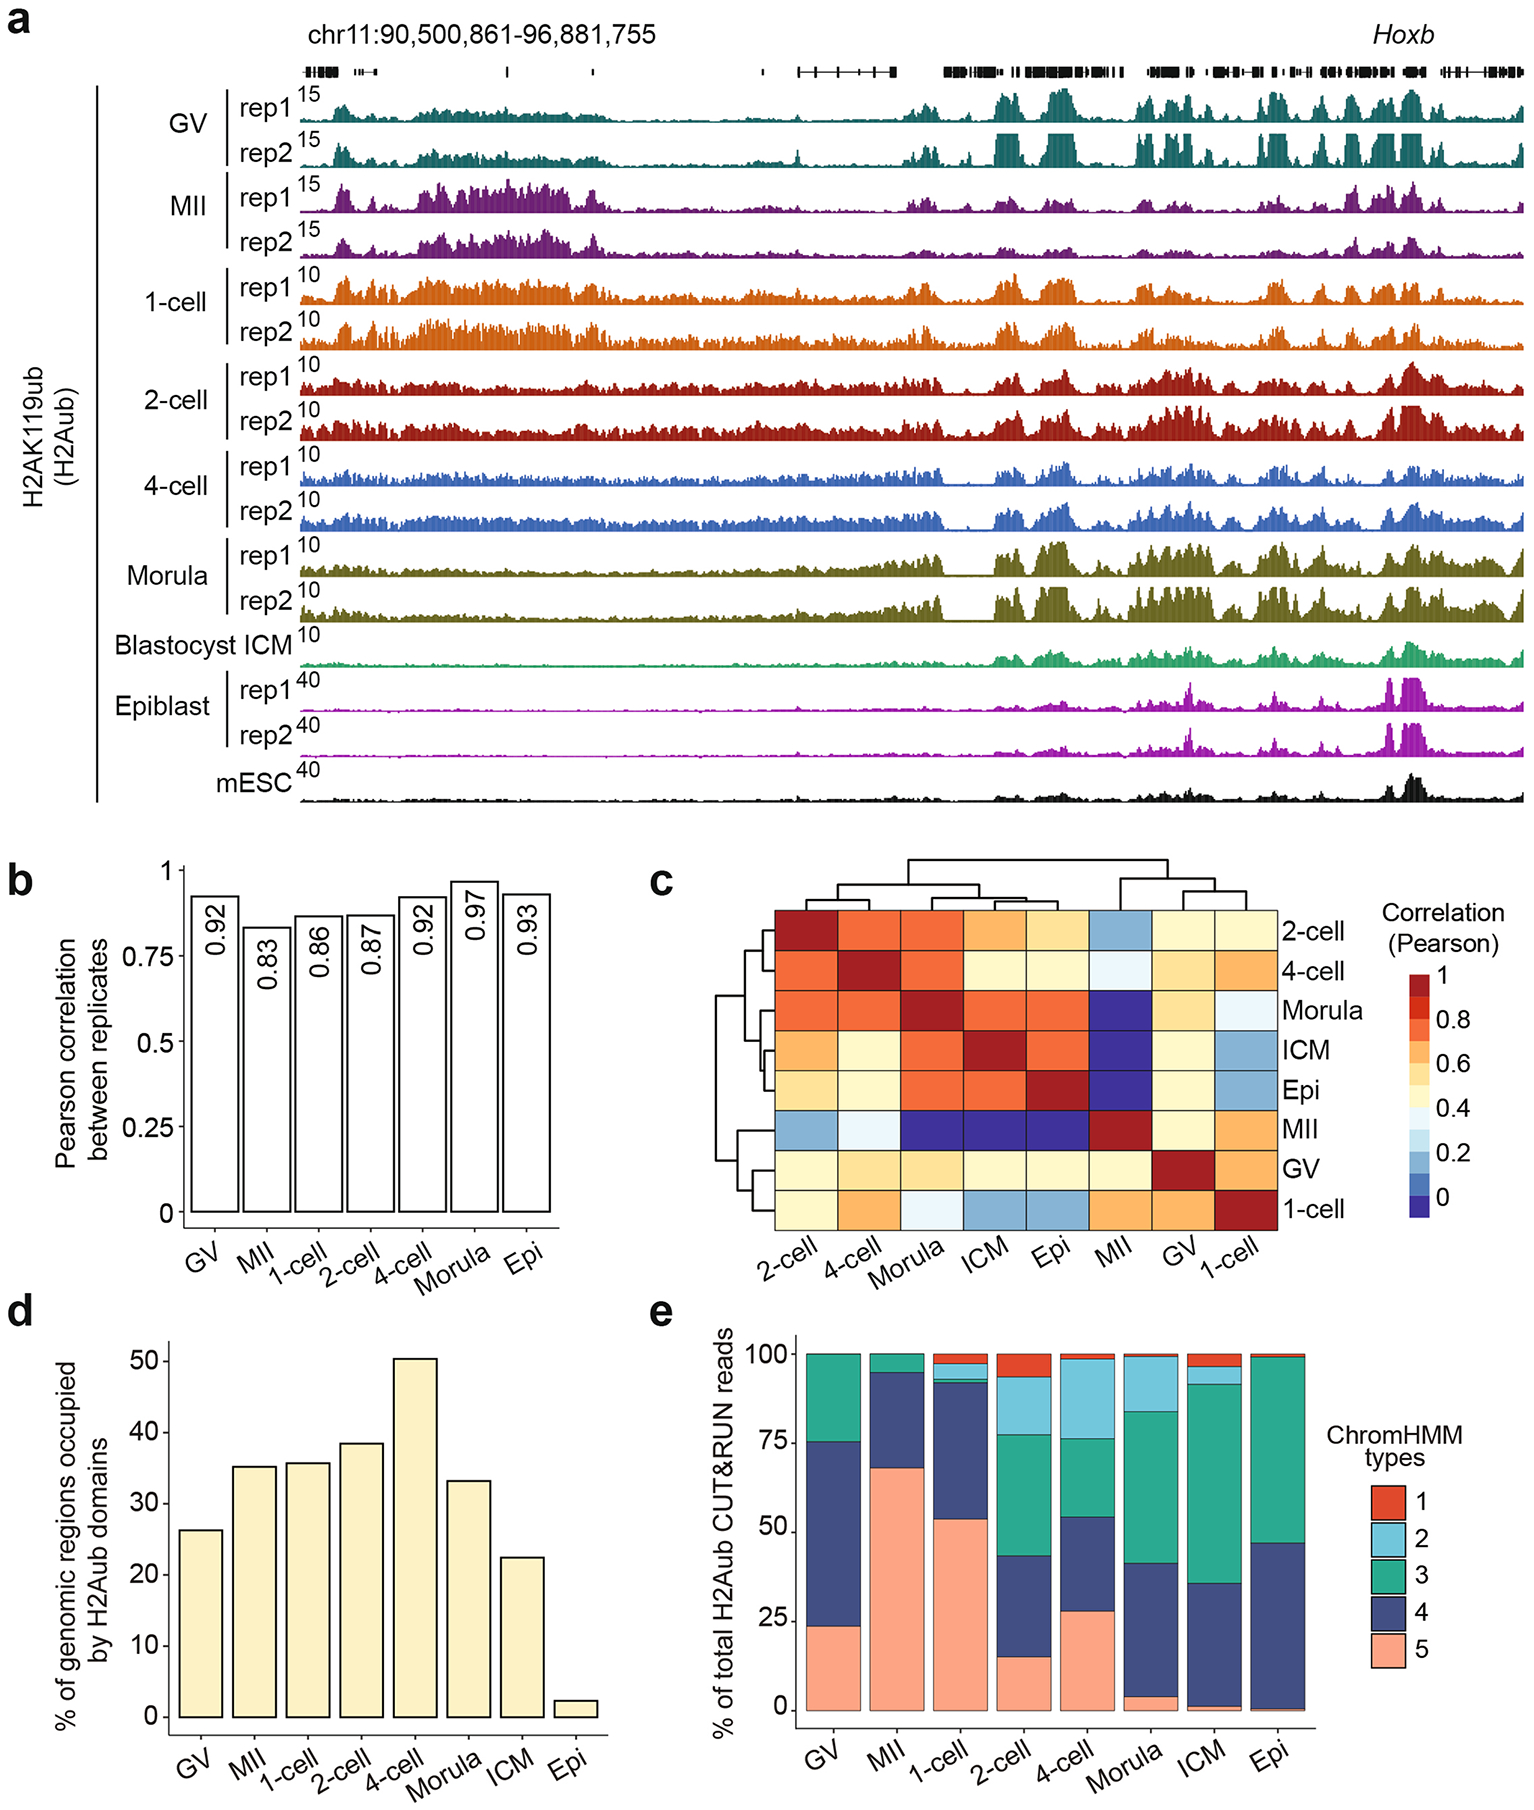
To investigate H2Aub dynamics during early development in mice, we performed cleavage under targets and release using nuclease (CUT&RUN) analysis23 in germinal vesicle (GV) oocytes, meta-phase II (MII) oocytes, zygotes, two-cell embryos, four-cell embryos, morulae, inner cell mass (ICM) from blastocysts and epiblasts from embryonic day (E)6.5 embryos (Fig. 1a and Supplementary Table 1). Biological replicates were pooled for downstream analyses after confirming their reproducibility (Extended Data Fig. 1a,b). Remarkably, H2Aub exhibited distinct distributions in oocytes and preimplantation embryos when compared with that in mouse ESCs (mESCs)24 and E6.5 epiblasts (Extended Data Fig. 1a). A hierarchical clustering analysis based on global H2Aub also revealed that oocytes and zygotes belonged to different clusters from two-cell and later developmental stages (Extended Data Fig. 1c). Furthermore, H2Aub domains in oocytes and preimplantation embryos were much broader and occupied ~40% of genomic regions, whereas the canonical form of H2Aub in E6.5 epiblasts only marked <5% of the genome (Extended Data Fig. 1d).
Fig. 1 |. H2AK119ub1 (H2Aub) in mouse oocytes and early embryos is highly dynamic.
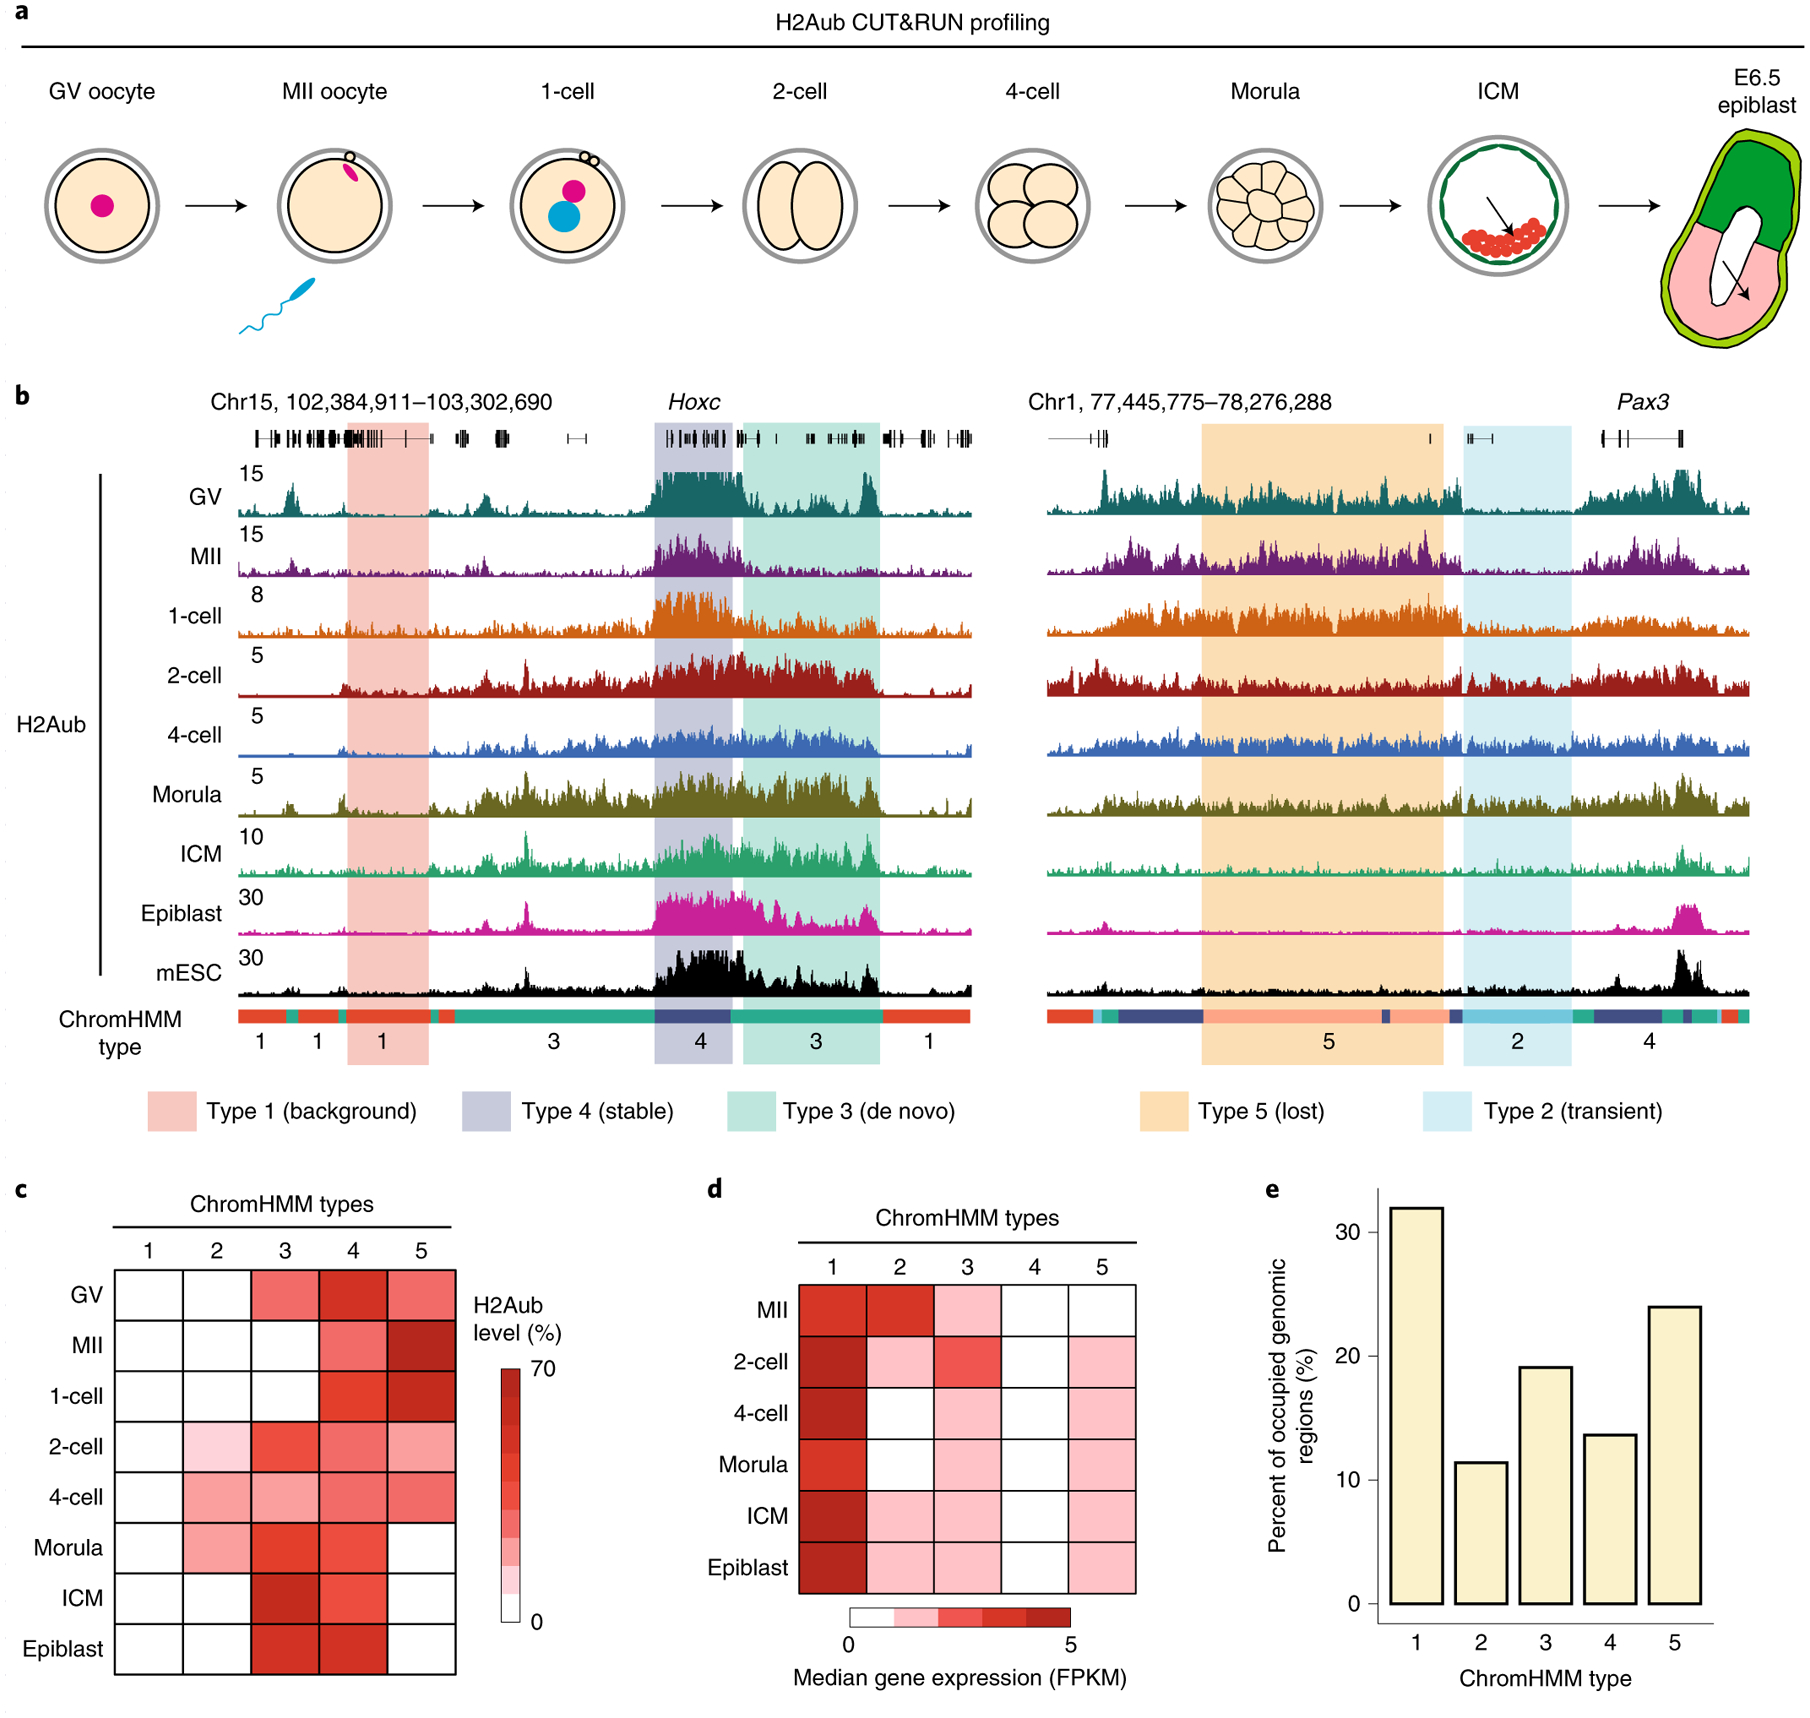
a, Schematic presentation of the developmental stages at which samples were collected for CUT&RUN analyses. Zygotes, two-cell embryos (2-cell), four-cell embryos (4-cell), morulae and ICM from blastocysts were collected at 12, 30, 48, 72 and 120 h after in vitro fertilization (IVF), respectively. Abbreviation, 1-cell, one-cell embryos. b, Genome browser view of the H2Aub profile in mouse oocytes and early embryos. Genomic regions were classified into five types based on H2Aub dynamics using the ChromHMM method25. H2Aub ChIP-seq data from mESCs were obtained from ref.24. Chr, chromosome. c, Heatmap illustrating H2Aub dynamics of each ChromHMM type in oocytes and early embryos. The intensity of the red color in each cell indicates the percentage of H2Aub signal belonging to the given type at each stage. d, Heatmap showing the expression dynamics of genes within each ChromHMM type in oocytes and early embryos. The intensity of the red color in each cell indicates the median fragments per kb per million reads (FPKM). RNA-seq data were obtained from ref.47. e, Bar graph showing the percentage of genomic regions occupied by each ChromHMM type.
We next used the ChromHMM method25 to classify genomic regions into different types based on H2Aub dynamics during early development. By testing different numbers of types (k = 3–20) (Methods), we found that k = 5 was the smallest grouping number capable of capturing the main categories of H2Aub dynamics (Fig. 1b,c). Specifically, type 4 ‘stable’ represented regions with relatively stable H2Aub across different stages, whereas the regions classified as type 3 ‘de novo’ underwent de novo H2Aub establishment following fertilization. To further validate the ChromHMM classification, H2Aub CUT&RUN reads that contributed to each ChromHMM type were quantified at different stages (Extended Data Fig. 1e). As expected, few reads mapped to type 1 ‘background’ regions, whereas the type 5 ‘lost’ loci showed decreased percentage of reads along development (Extended Data Fig. 1e). Consistent with the known function of H2Aub in transcriptional gene silencing26,27, gene expression levels within each ChromHMM type were generally anti-correlated with the H2Aub level (Fig. 1d). Given that a substantial (~50%) portion of genomic regions (that is, types 2, 3 and 5) exhibited gain and/or loss of H2Aub during early development (Fig. 1c,e), the H2Aub landscape in mouse oocytes and preimplantation embryos is highly dynamic and different from that in mESCs and post-implantation embryos.
Global erasure of sperm H2Aub upon fertilization.
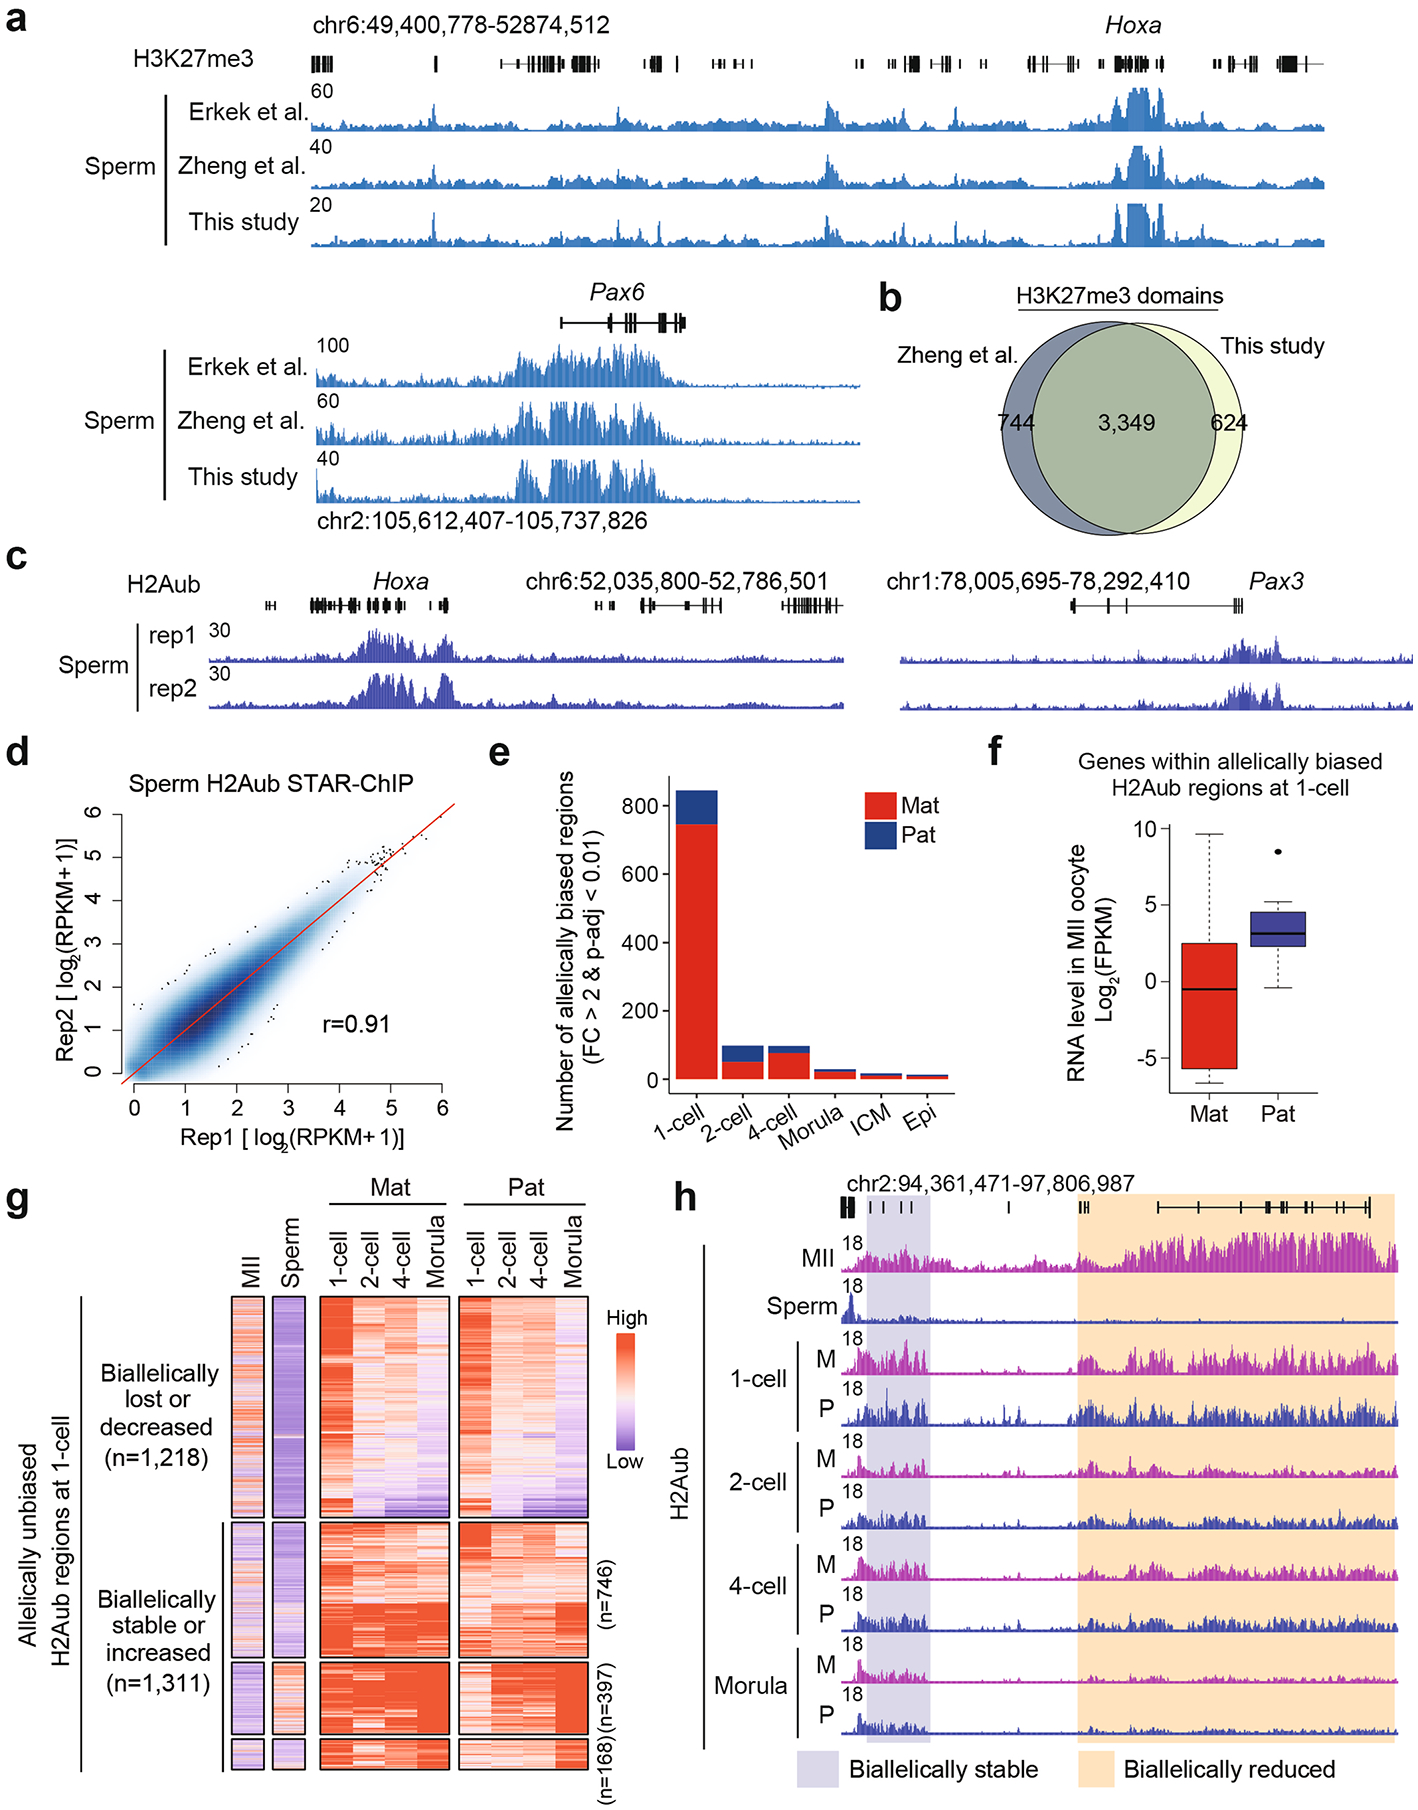
We next asked how H2Aub is reprogrammed and/or inherited from each parental genome during fertilization. Sperm H2Aub and H3K27me3 were profiled using a previously validated chromatin immunoprecipitation followed by deep sequencing (ChIP-seq) method for analyzing highly compacted sperm chromatin, termed STAR (small-scale TELP-assisted rapid)18 (Supplementary Table 1). H3K27me3 STAR ChIP-seq data were highly correlated with publicly available data, thus validating our sperm ChIP-seq protocol (Extended Data Fig. 2a,b). The two replicates of sperm H2Aub ChIP-seq data were highly reproducible and were pooled for downstream analyses (Extended Data Fig. 2c,d).
Taking advantage of the fact that the embryos were generated by crossing two distantly related strains, B6/129 or B6/DBA (mother) and PWK (father) (Supplementary Table 1), allelic H2Aub signals in zygotes were distinguished by SNPs and compared with H2Aub enrichment (covered by SNPs) in gametes. Notably, the majority of the H2Aub domains on the maternal genome at the one-cell stage overlapped with the SNP-overlapping MII oocyte domains, suggesting that H2Aub can be inherited from oocytes to zygotes during fertilization (Fig. 2a,b). By contrast, fewer H2Aub domains overlapped between the paternal genome and sperm cells (Fig. 2a,b). In sum, these data suggest that H2Aub in sperm is largely erased after fertilization and the paternal genome in zygotes then acquires H2Aub with a distribution pattern different from that in sperm.
Fig. 2 |. Loss of parental H2Aub asymmetric distribution during preimplantation development.
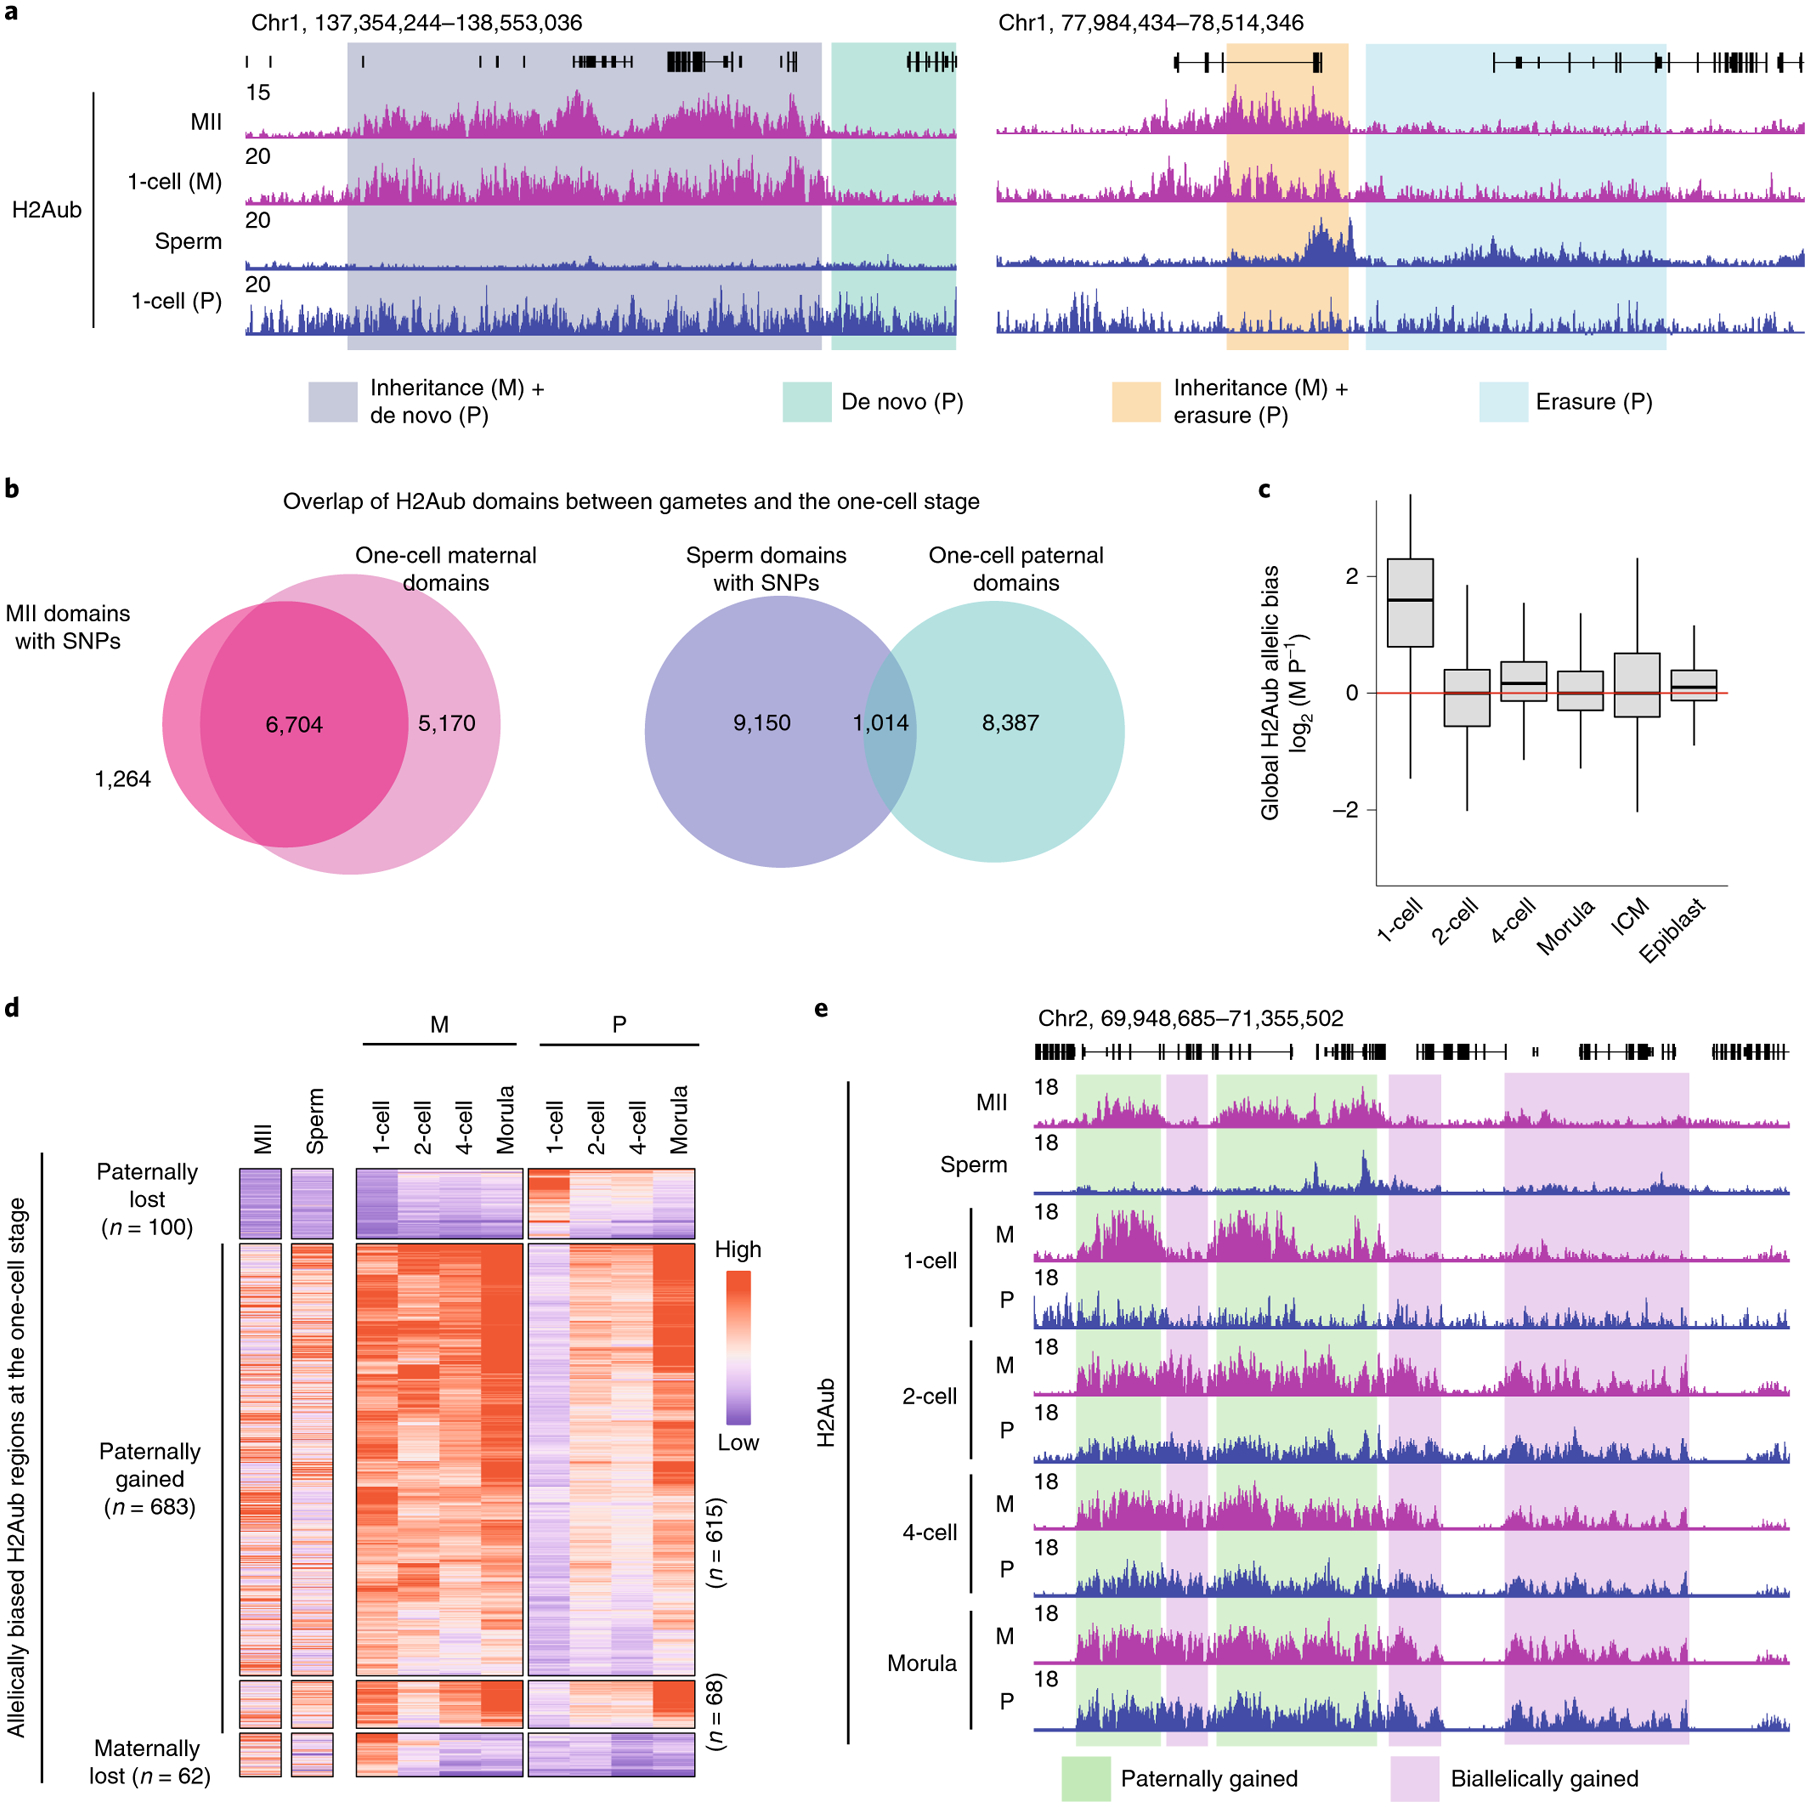
a, Genome browser view of H2Aub enrichment in the MII oocyte, sperm and zygotes. M, maternal allele; P, paternal allele. b, Venn diagrams showing the overlap of H2Aub domains between gametes and embryos. c, Box plot showing the global H2Aub allelic bias at different developmental stages. The H2Aub allele-specific signal was calculated as reads per kb per million reads (RPKM) in 5-kb bins (n = 320,203). The middle lines in the boxes represent medians. Box hinges indicate the 25th and 75th percentiles, whiskers indicate the hinge ± 1.5 × interquartile range, and dots represent outliers. d, Heatmaps showing allelic dynamics of the H2Aub regions with allelic bias at the one-cell stage during preimplantation development. The number of regions for each category is shown. Note that a group of regions (n = 68) show transient reduction of H2Aub on the maternal allele at the two-cell stage and then regain it at later stages. e, Genome browser view showing allelic dynamics of the H2Aub regions with allelic bias at the one-cell stage during preimplantation development. In this example, maternally biased H2Aub at the one-cell stage became equalized by gaining H2Aub signal on the paternal allele at the two-cell stage.
Equalization of allelic H2Aub distribution in early embryos.
We next focused on how H2Aub is allelically regulated during preimplantation development. In line with inheritance of H2Aub from the oocyte and global erasure of sperm H2Aub during fertilization, genome-wide H2Aub distribution was biased toward maternal allele in one-cell embryos (Fig. 2c). Strikingly, maternally biased H2Aub distribution was largely equalized in two-cell embryos (Fig. 2c). Consistently, 745 and 100 H2Aub regions were identified to be maternally and paternally biased in one-cell embryos, respectively, whereas less than 100 allelically biased H2Aub regions were found at any other analyzed stage (Extended Data Fig. 2e and Supplementary Table 2). In addition, genes within maternally biased H2Aub regions identified at the one-cell stage showed lower expression levels in MII oocytes compared with those within paternally biased regions (Extended Data Fig. 2f), further supporting the inheritance of H2Aub from MII oocytes.
We next investigated how the allelic H2Aub bias becomes equalized. The majority (n = 683, 91%) of maternally biased H2Aub regions at the one-cell stage lost allelic bias during development by gaining signal on the paternal allele (Fig. 2d,e). Interestingly, genomic regions can gain H2Aub signal on both alleles by either domain spreading on the maternal allele or de novo establishment on the paternal allele (‘biallelically gained’ in Fig. 2e). In addition, allelically unbiased H2Aub regions at the one-cell stage either undergo dynamic changes (n = 1,783) or remain stable (n = 746) in early development without showing allelic preference (Extended Data Fig. 2g,h). It is worth noting that equalization of the asymmetric H2Aub distribution in oocytes and sperm may initiate even at the one-cell stage by acquiring H2Aub on the paternal genome (Extended Data Fig. 2g,h). Collectively, these data demonstrate that, although global H2Aub distribution is initially biased toward maternal allele in zygotes, the bias is quickly lost in two-cell embryos and becomes equalized by the morula stage largely by gaining signal on the paternal allele.
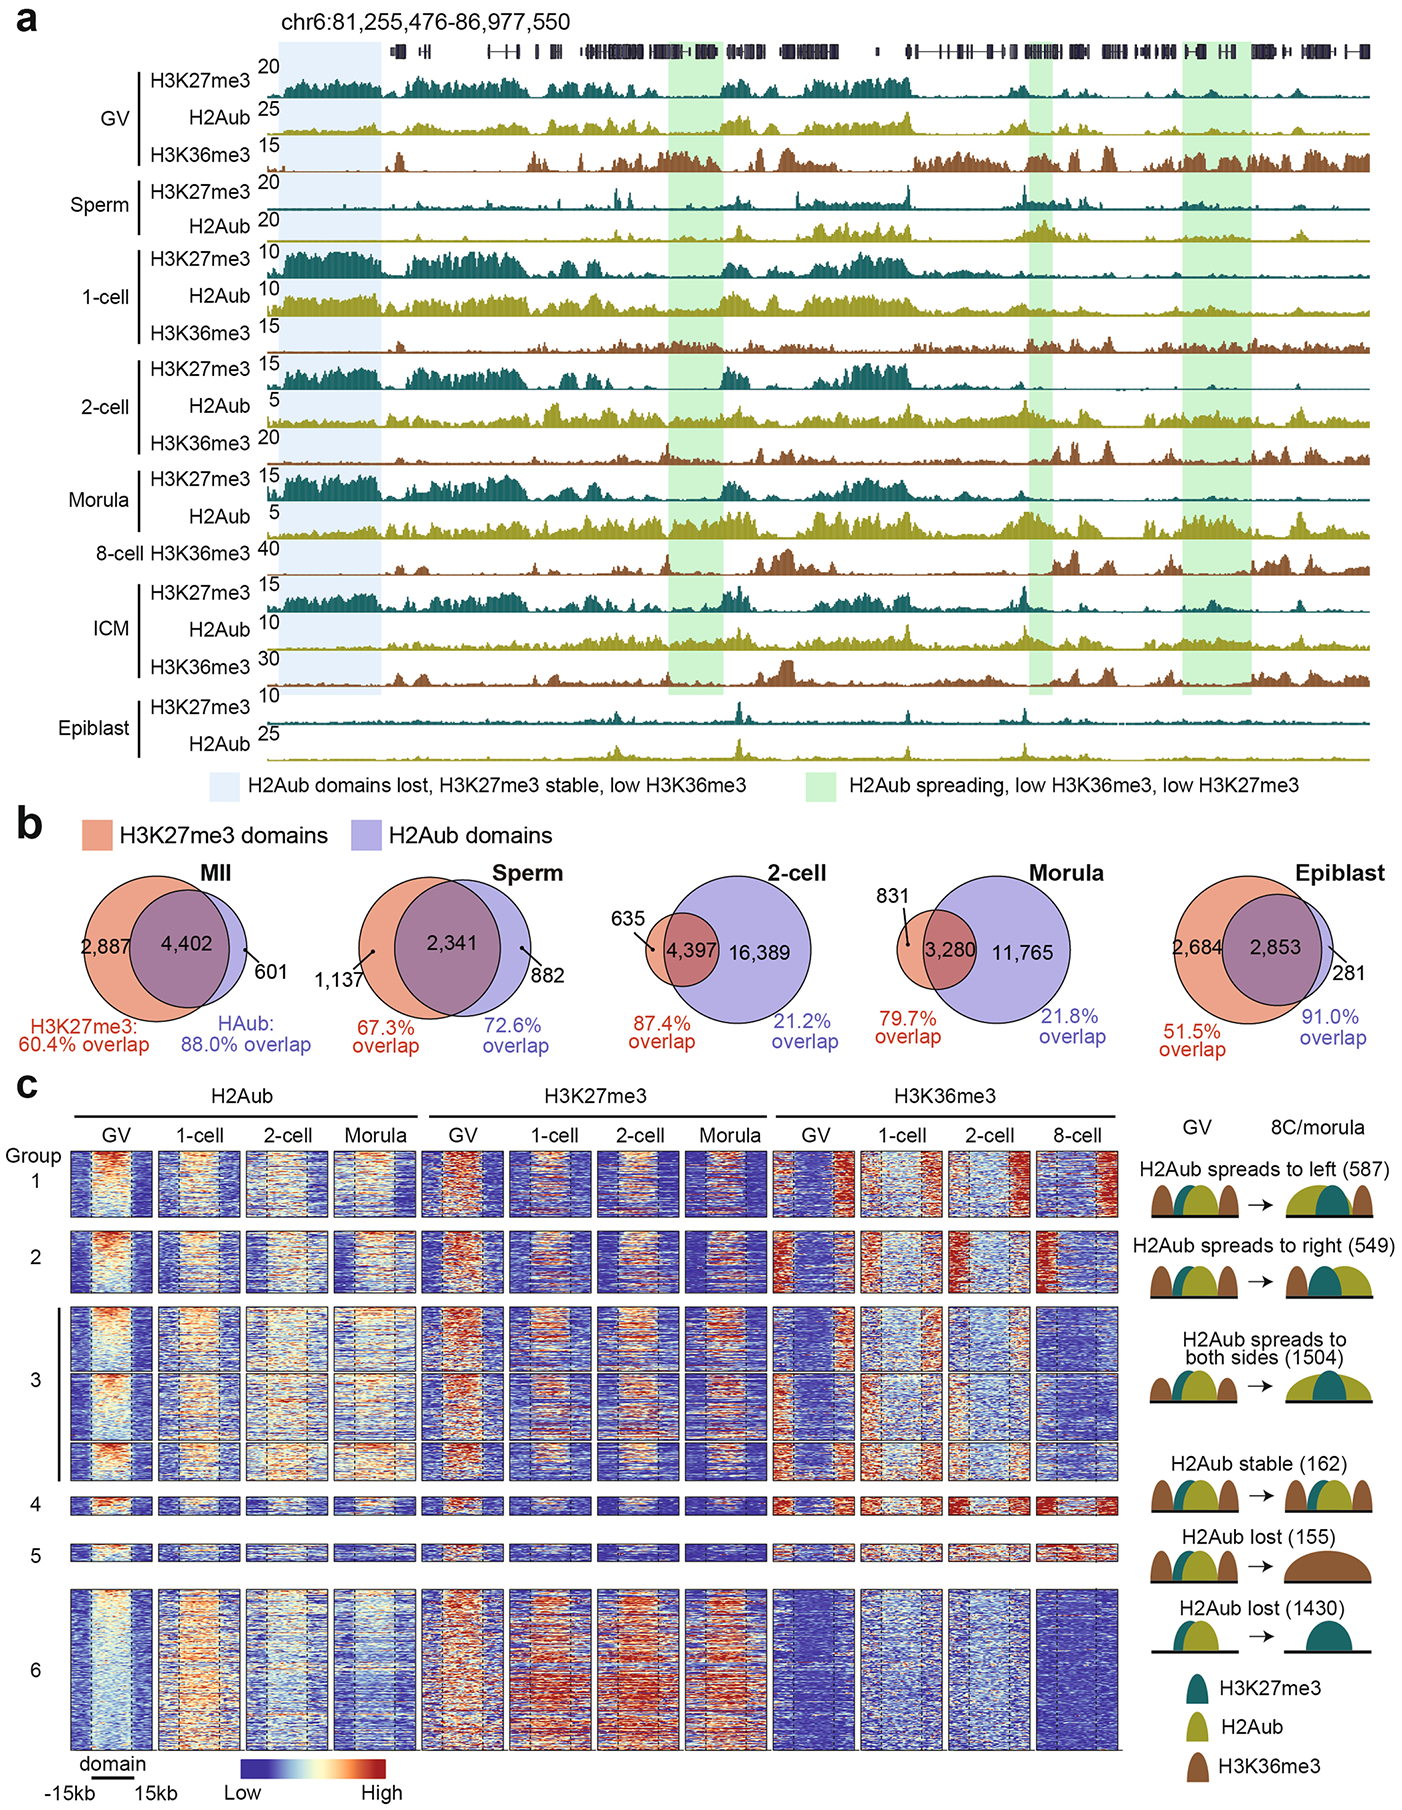
Borders of H2Aub, but not those of H3K27me3, coincide with H3K36me3.
Given that H3K27me3 and H2Aub are two hallmarks of Polycomb domains6, we next sought to compare their distributions in gametes and early embryos. Unexpectedly, although H2Aub largely overlapped with H3K27me3 in both oocytes and sperm, it exhibited drastically distinct distributions from the two-cell stage to the blastocyst stage (Extended Data Fig. 3a). Interestingly, H2Aub and H3K27me3 colocalized again in the canonical form after implantation (Extended Data Fig. 3a). To further validate this observation, H2Aub and H3K27me3 domains were identified at different stages, and their overlap was analyzed. Whereas the majority (>72.6%) of H2Aub domains overlapped with H3K27me3 in gametes, the overlap dropped to ~21% at two-cell and morula stages and regained overlap to 91% in the epiblast (Extended Data Fig. 3b). Therefore, these data demonstrate distinct reprogramming dynamics between H2Aub and H3K27me3 after fertilization and that the majority of H2Aub domains do not enrich for H3K27me3 during preimplantation development.
As H3K27me3 and H2Aub and the active histone marker H3K36me3 are mutually exclusive in ESCs28–30, we next explored their relationship in oocytes and preimplantation embryos. In oocytes, both H3K27me3 and H2Aub were anti-correlated with H3K36me3 (Extended Data Fig. 3a). However, the domain boundaries of H2Aub, but not those of H3K27me3, largely coincided with H3K36me3 in preimplantation embryos, especially at eight-cell and morula stages (Extended Data Fig. 3a). To further validate this observation, we analyzed H2Aub domain dynamics using GV oocytes as a reference and found that more than half of these domains spread toward either or both directions after fertilization. Interestingly, H2Aub spreading correlated with loss of H3K36me3; however, H3K27me3 GV domain boundaries remained largely unchanged during preimplantation development (Extended Data Fig. 3a,c, groups 1–3). It should be noted that a group of H2Aub domains in GV oocytes had reduced levels after fertilization, with H3K27me3 largely retained and with low levels of H3K36me3 (Extended Data Fig. 3a,c, group 6), suggesting that additional mechanisms beside H3K36me3 may counteract H2Aub. Collectively, H3K36me3 is anti-correlated with H3K27me3 and H2Aub in both oocytes and early embryos, and the domain boundaries of H2Aub, but not those of H3K27me3, largely coincide with H3K36me3 in preimplantation embryos.
H2Aub, but not H3K27me3, is retained at developmental genes.
We next compared H3K27me3 and H2Aub dynamics at specific genomic features, including the developmental gene promoters at which both histone modifications are typically enriched in mESCs6. We defined genes with both RING1B and SUZ12 binding at promoter regions in mESCs as PcG targets, similar to a previous study24. The majority of them (n = 4,832, 76.8%, group 1) showed H3K27me3 depletion after fertilization and were not fully re-establishment until the epiblast stage (Fig. 3a,b). We also noted that a subset of PcG targets (n = 1,457, 23.2%, group 2) retained H3K27me3 throughout preimplantation development (Fig. 3a,b). The promoter CpG density of these two PcG target groups did not exhibit significant differences (Fig. 3a). Interestingly, H2Aub signal was largely retained at the promoters of both PcG target groups and spread to the entire gene bodies after fertilization (Fig. 3b,c). Consistent with domain-based analyses (Extended Data Fig. 3c), anti-correlation between H2Aub or H3K27me3 and H3K36me3 or transcriptional activity was also evident at the gene level. Specifically, genes that were active at all stages showed high levels of H3K36me3 and low levels of both H2Aub and H3K27me3 (Fig. 3a). In sum, these data demonstrate that H2Aub, but not H3K27me3, is retained at developmental gene promoters in murine preimplantation embryos.
Fig. 3 |. Distinct dynamics of H2Aub and H3K27me3 during preimplantation development.
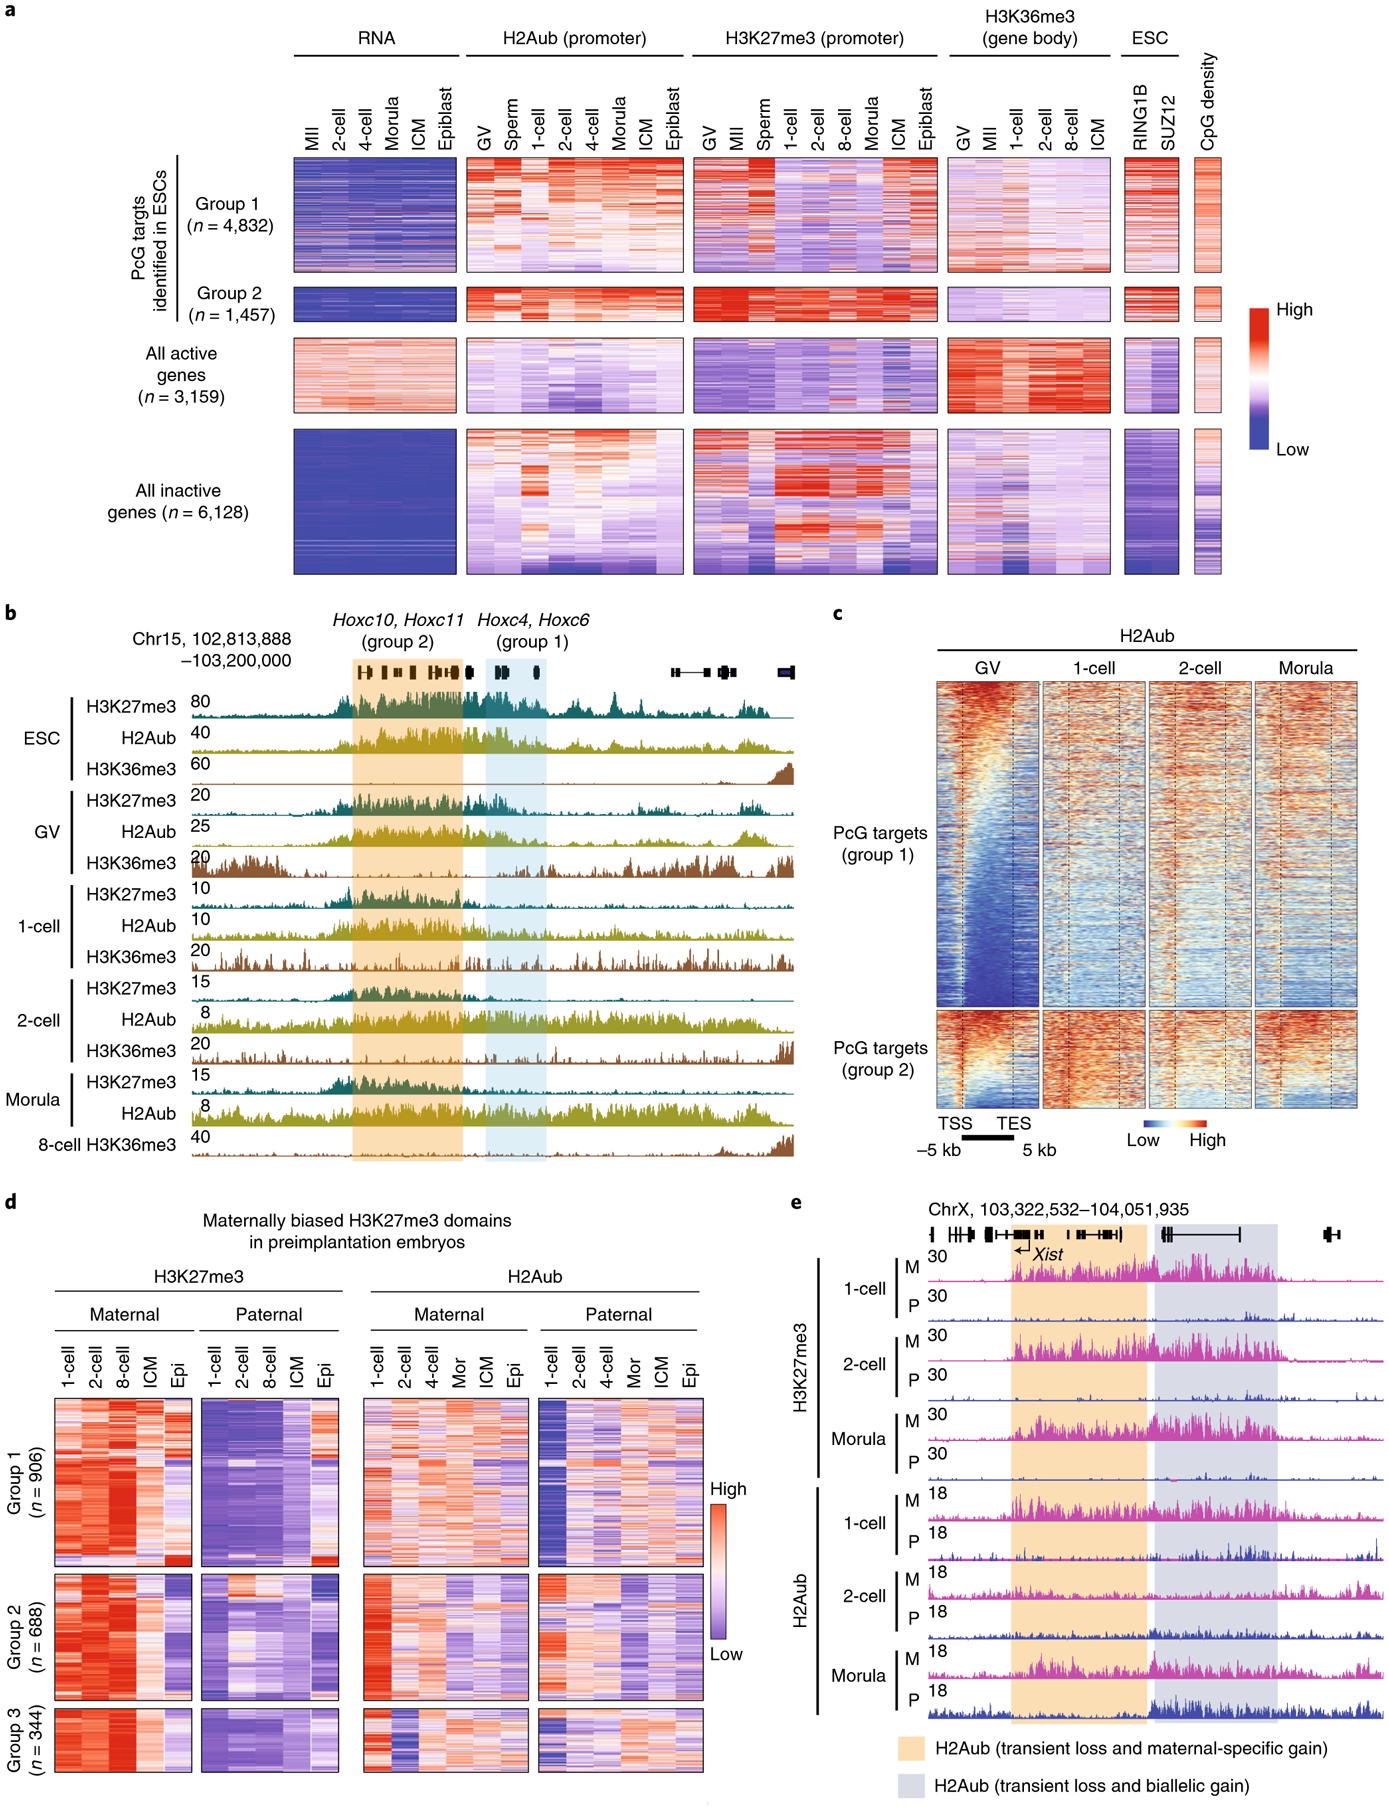
a, Heatmap showing enrichment of H3K27me3, H2Aub and H3K36me3 (ref.48) at PcG targets, genes that are active or repressed at all stages. RNA levels at each stage47, RING1B and SUZ12 ChIP-seq signals24 and promoter CpG density are also shown. H3K27me3 ChIP-seq data for gametes and early embryos are from ref.22, with the exception of GV and morula CUT&RUN data, which were generated by this study and ref.33, respectively. Abbreviation, 8-cell, eight-cell embryos. b, Genome browser views of H3K27me3, H2Aub and H3K36me3 at the Hoxc locus. H3K36me3 ESC ChIP-seq data are from ref.49. c, Heatmaps illustrating H2Aub distribution at PcG targets at different stages. Note that H2Aub spreads to cover entire gene bodies during preimplantation development. TSS, transcription start site; TES, transcription end site. d, Heatmap showing the allelic dynamics of H3K27me3 and H2Aub at maternally biased H3K27me3 domains in early development as defined in ref.31. The numbers of maternally biased H3K27me3 domains for each category are shown. Epi, epiblast; mor, morula. e, Genome browser view of allelic H3K27me3 and H2Aub dynamics of the Xist locus at the indicated embryonic stages. M, maternal; P, paternal.
Transient loss of allelic H2Aub at H3K27me3 imprinting loci.
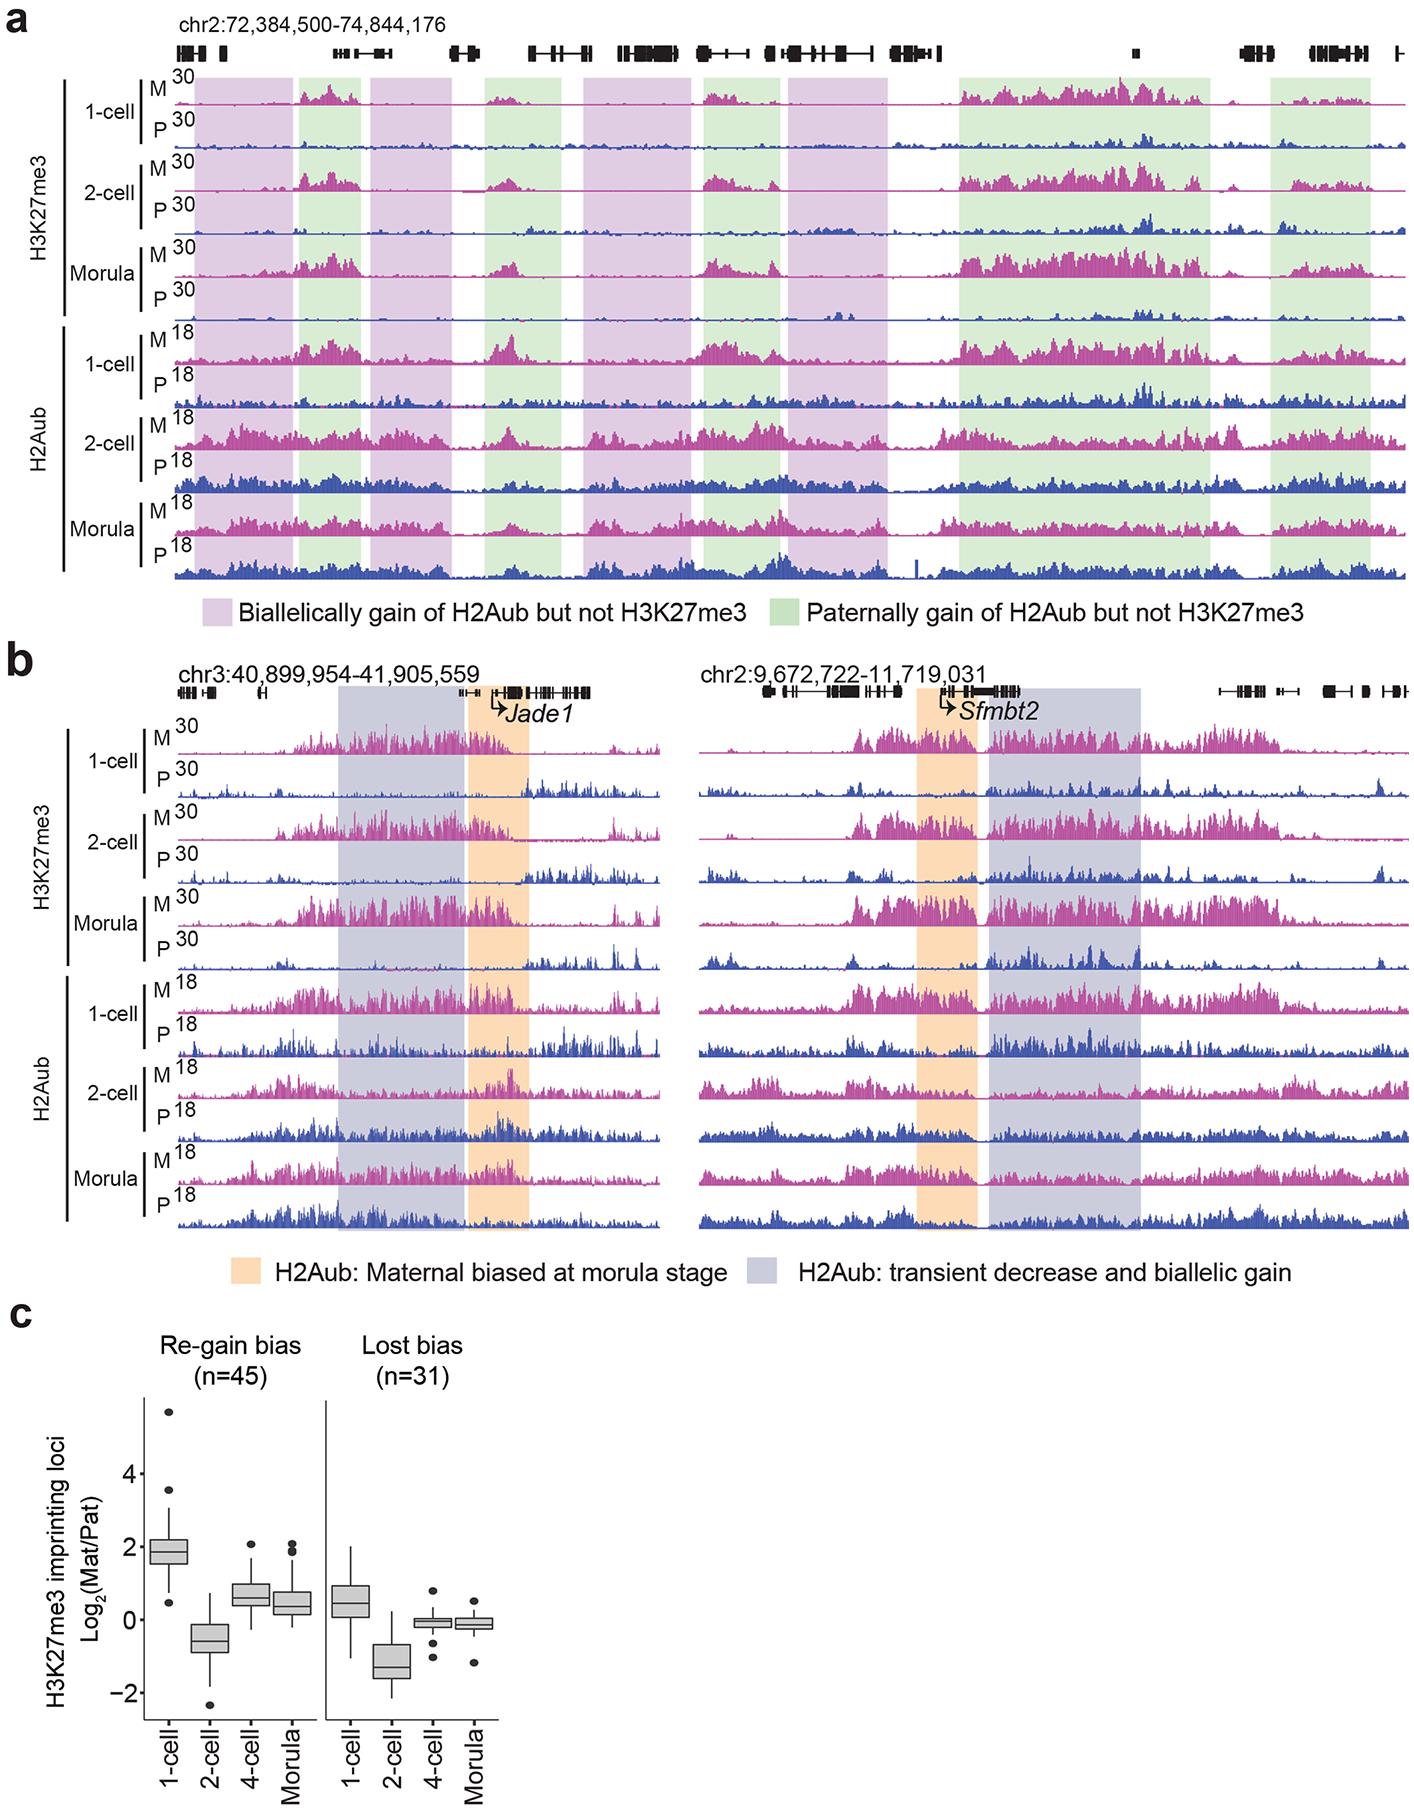
The unexpected differences in H2Aub and H3K27me3 reprogramming dynamics prompted us to investigate these two histone modifications in an allele-specific manner. Similar to a previous report22, maternal H3K27me3 domains31 persisted up to the ICM stage but were mostly lost in the E6.5 epiblast (Fig. 3d, left and Supplementary Table 3). By contrast, H2Aub did not show maternally biased distribution at most of these domains during preimplantation development (Fig. 3d, right). For example, H2Aub at 46.7% of the maternal H3K27me3 domains (cluster 1) showed maternal bias at the one-cell stage, but this bias was equalized at later stages by gaining H2Aub on the paternal allele (Fig. 3d and Extended Data Fig. 4a). In addition, 35.5% of the domains (cluster 2) were enriched with H2Aub on both alleles at the one-cell stage, and the signals then decreased biallelically during development (Fig. 3d). Interestingly, a group of H2Aub domains (17.8%, cluster 3) exhibited transient loss at the two-cell stage and then were regained on the maternal allele at the four-cell stage (Fig. 3d). Collectively, these data indicate that reprogramming of H2Aub and H3K27me3 exhibits different dynamics in an allele-specific manner following fertilization.
As one major role of the maternal H3K27me3 domains is to mediate germline DNA methylation-independent imprinting21, we next investigated how H2Aub reprogramming takes place at these imprinted loci. We first focused on Xist, a master regulator of X chromosome inactivation that is only expressed from the paternal allele and causes paternal X chromosome inactivation in preimplantation embryos32. Maternal H2Aub and H3K27me3 highly overlapped at the Xist locus in zygotes; however, allelic H2Aub was erased at the two-cell stage and then was regained during later development (Fig. 3e). Notably, only a portion of the domain re-established maternally biased H2Aub, while the rest of the domain was enriched for H2Aub at the morula stage (Fig. 3e). In addition, of the 76 putative H3K27me3 imprinting loci20, 45 (59.2%), including Jade1 and Sfmbt2, showed allelic H2Aub reprogramming similar to that of Xist (Extended Data Fig. 4b,c and Supplementary Table 4). On the other hand, the other 31 (40.8%) genes only showed maternally biased H2Aub at the one-cell stage but not at other stages (Extended Data Fig. 4c). Given that maternal H3K27me3 domains are maintained throughout preimplantation development, it is likely that the allelic H2Aub re-established at the imprinted loci after the two-cell stage depends on maternal H3K27me3. Collectively, these data suggest that the maternally biased H2Aub at some noncanonical imprinting loci undergoes transient erasure and then allelic re-establishment in early embryos.
Maternal PRC2 affects H2Aub at H3K27me3 imprinting loci.
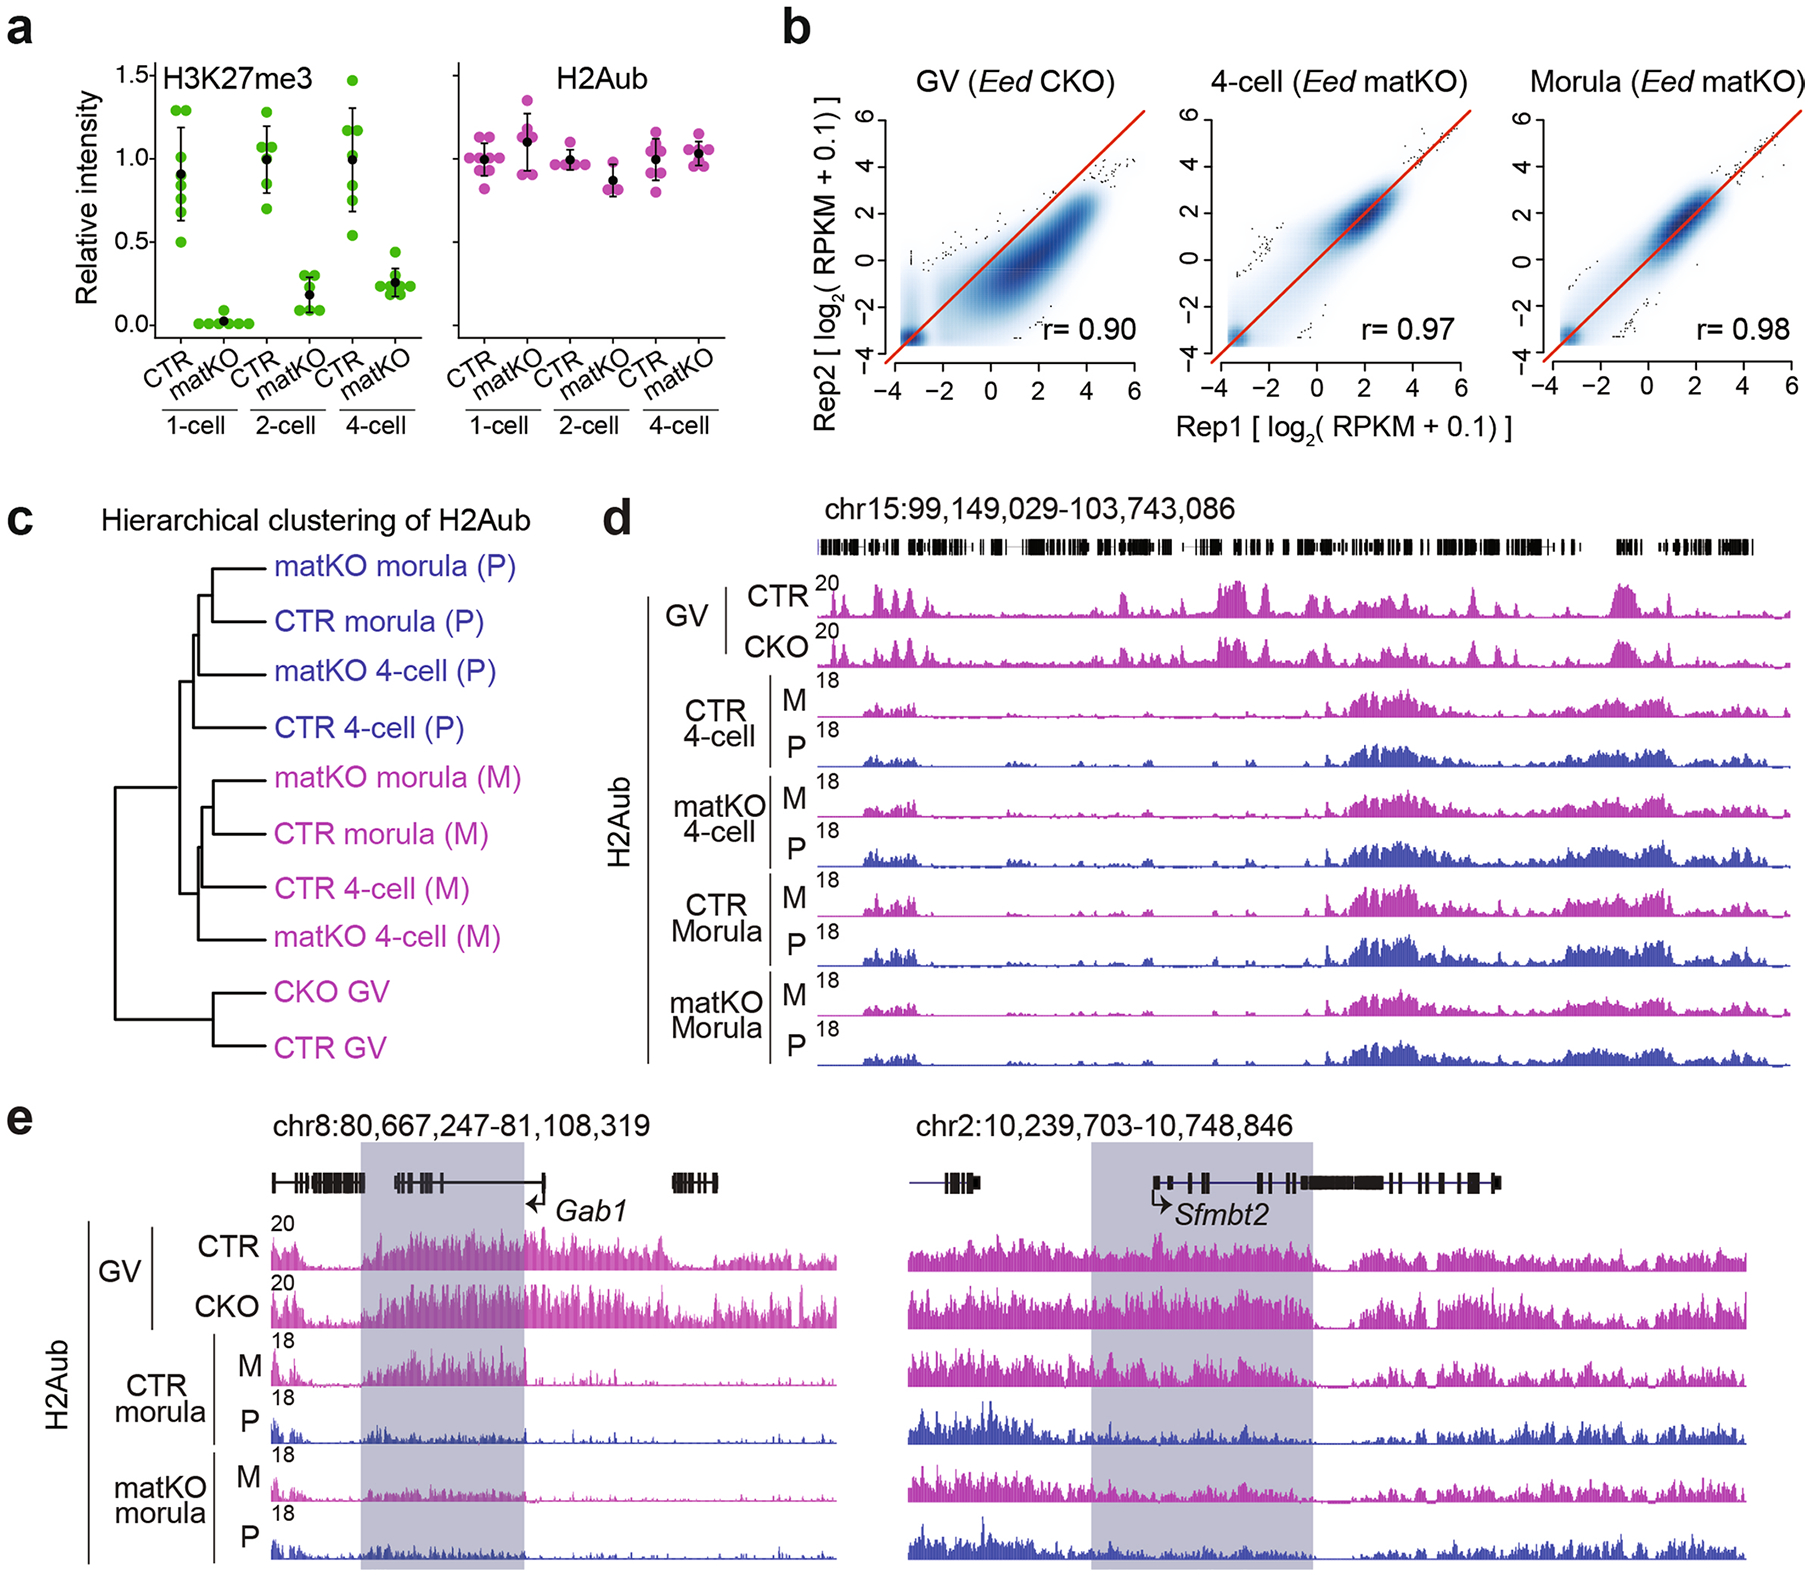
Having established the distinct dynamics of H2Aub and H3K27me3 in early embryos, we next sought to address their relationship. To this end, we used the Eed-maternal knockout (matKO) mouse model33 (Fig. 4a) to prevent H3K27me3 establishment during early oogenesis, so that no or only very low levels of H3K27me3 were detectable in early embryos (Fig. 4b and Extended Data Fig. 5a, left). Immunostaining revealed that H3K27me3 loss did not affect global H2Aub (Fig. 4b and Extended Data Fig. 5a, right). To confirm this observation, H2Aub CUT&RUN analyses were performed in Eed-conditional knockout (CKO) GV oocytes and -matKO four-cell and morula embryos (Supplementary Table 1 and Extended Data Fig. 5b). Consistent with the immunostaining results, CUT&RUN analyses also showed that H2Aub was largely unaffected in Eed-CKO oocytes and -matKO embryos (Extended Data Fig. 5c,d). Further analysis of each 5-kb bin across the genome of CKO oocytes and the maternal alleles of matKO embryos revealed that less than 2% of 5-kb bins showed altered H2Aub in CKO or matKO samples (Fig. 4c and Supplementary Table 5). Thus, H3K27me3 is largely dispensable for global H2Aub in oocytes and preimplantation embryos.
Fig. 4 |. Loss of maternal Eed has a limited effect on global H2Aub except for maternal H3K27me3-dependent imprinted genes.
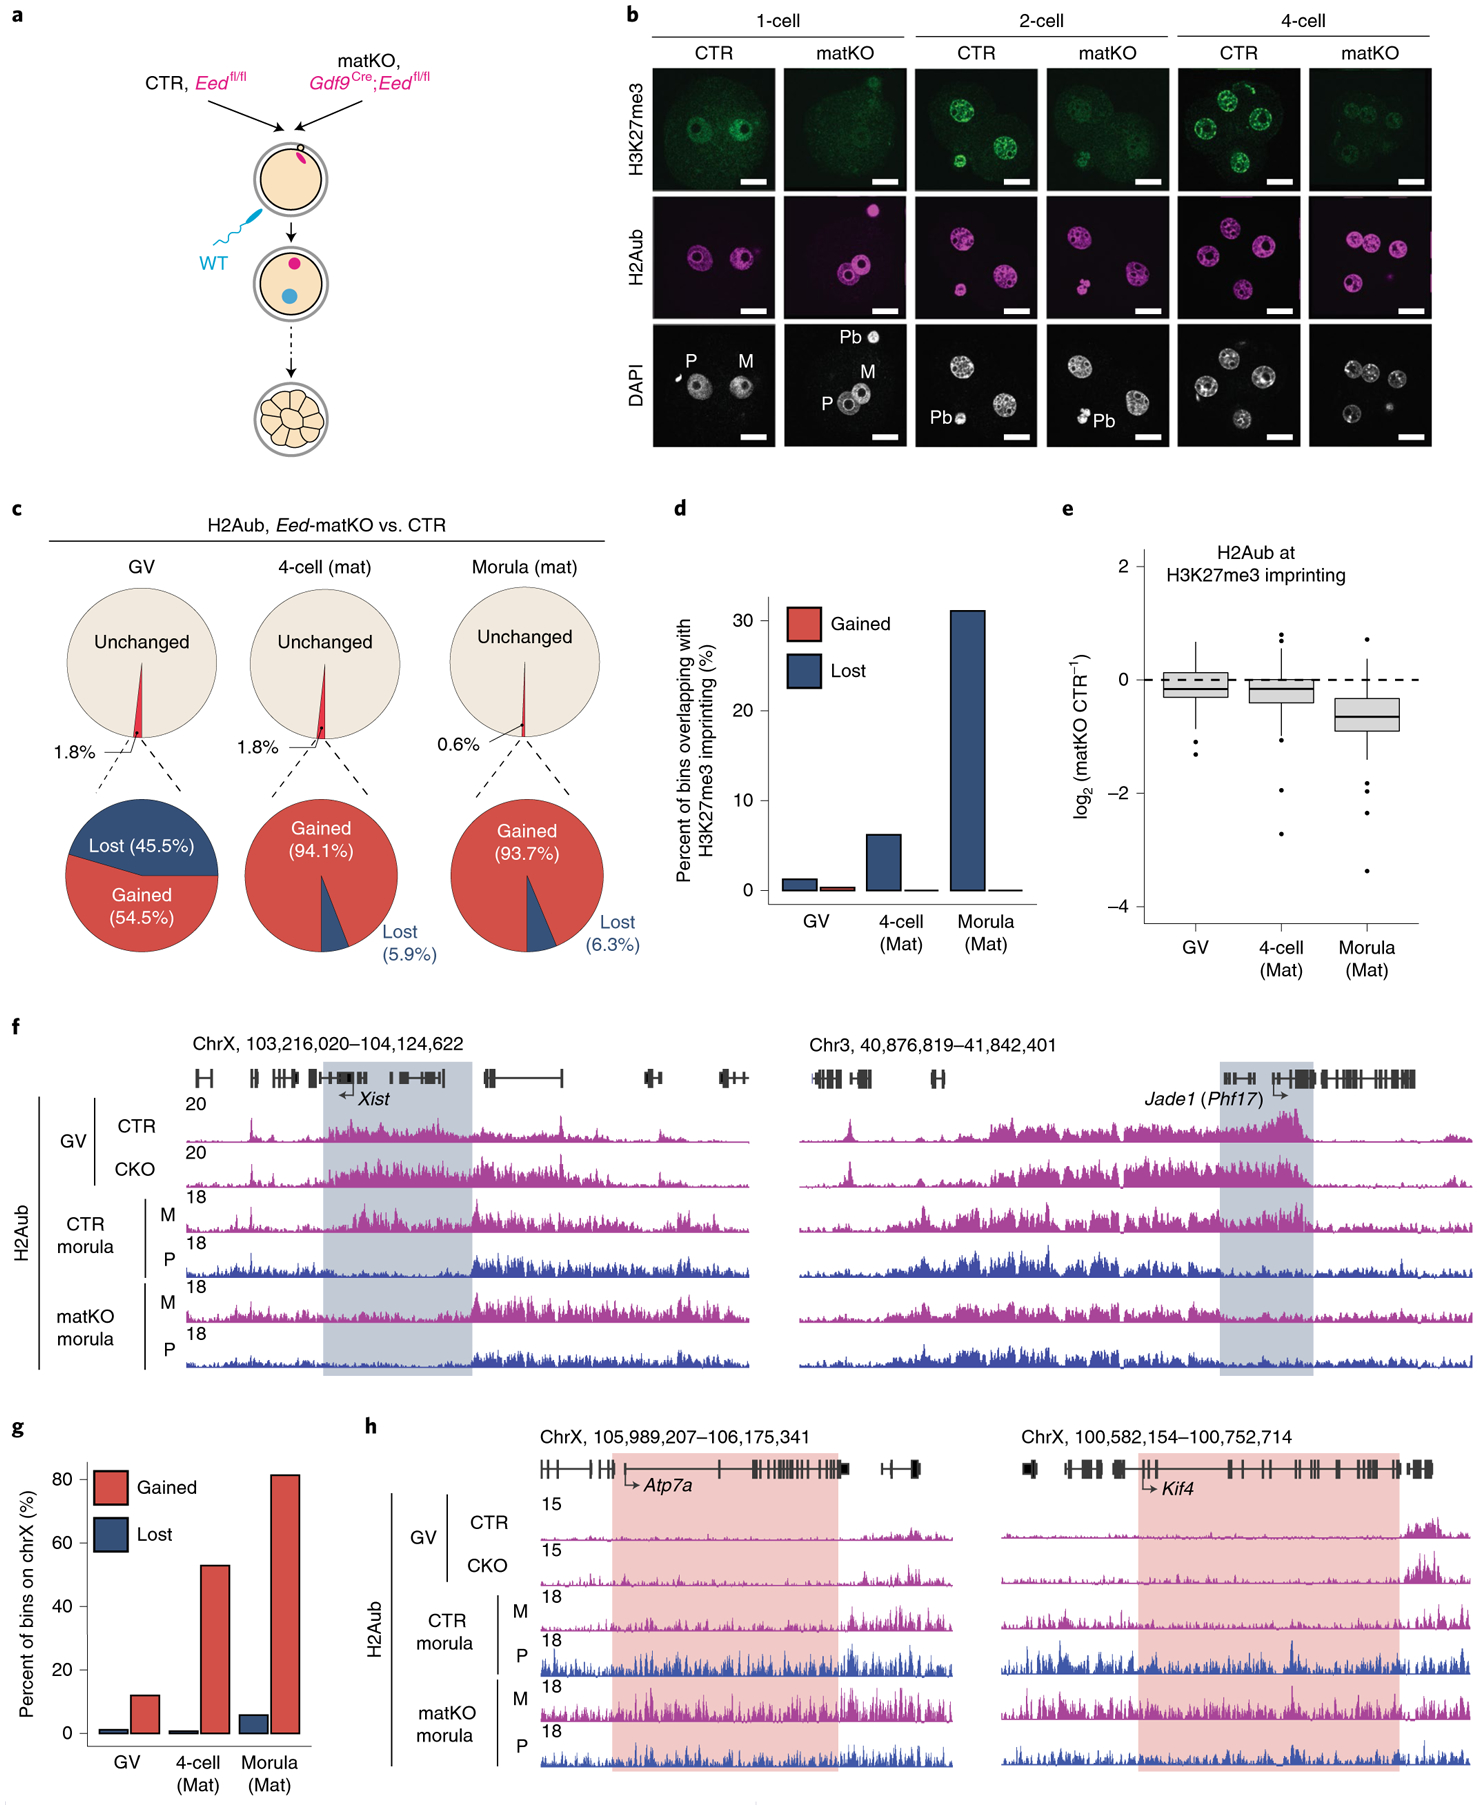
a, Schematics for assessing the effect of Eed depletion on H2Aub enrichment. CTR, control. b, Representative images of preimplantation embryos immunostained with an anti-H3K27me3 and an anti-H2Aub antibody. The total numbers of embryos analyzed were nine (control) and seven (matKO) for one-cell embryos, six (control) and six (matKO) for two-cell embryos and seven (control) and eight (matKO) for four-cell embryos. Quantifications are shown in Extended Data Fig. 5a. DAPI, 4,6-diamidino-2-phenylindole; M, maternal pronucleus; P, paternal pronucleus; Pb, polar body. Scale bar, 20 μm. c, Pie charts showing the percentage of H2Aub bins (5-kb) affected by conditional Eed knockout in GV oocytes and matKO in four-cell and morula embryos. The numbers of H2Aub bins affected (fold change (FC) > 2 and counts per million (CPM) > 1) at GV, four-cell and morula stages were 9,565, 9,314 and 3,312, respectively. For four-cell and morula stages, only H2Aub enrichment on the maternal allele was analyzed. Mat, maternal. d, Percentage of the gained and lost H2Aub bins overlapping with the 76 putative maternal H3K27me3-dependent imprinted loci at the indicated developmental stages. The list of maternal H3K27me3-dependent imprinted loci was obtained from ref.20. e, Box plot showing H2Aub signal changes at gene bodies of the putative H3K27me3 imprinting loci (n = 76) at the indicated developmental stages. The middle lines in the boxes represent medians. Box hinges indicate the 25th and 75th percentiles, whiskers indicate the hinge ± 1.5 × interquartile range, and dots represent outliers. f, Genome browser view showing H2Aub enrichment at Xist and Jade1 (also known as Phf17) loci in control and Eed-CKO GV oocytes and -matKO morula embryos. M, maternal; P, paternal. g, Bar plot showing the percentage of gained and lost H2Aub bins located on the X chromosome. h, Genome browser view of H2Aub enrichment at two X-linked genes that undergo X inactivation in preimplantation embryos32. Note the increased H2Aub signal on the maternal allele at the morula stage.
Given that maternal EED depletion is known to cause loss of noncanonical imprinting33,34, we next investigated whether allelic H2Aub at the imprinted loci was affected in this mouse model. Notably, the bins showing decreased H2Aub signal in Eed-matKO embryos were markedly enriched for the noncanonical imprinting loci (Fig. 4d). Indeed, the majority of the H3K27me3 imprinting loci (for example, Jade1, Gab1 and Sfmbt2)20 and Xist showed reduced H2Aub on the maternal allele in Eed-matKO morulae (Fig. 4e,f, Extended Data Fig. 5e and Supplementary Table 6). Interestingly, loss of H3K27me3 did not affect H2Aub in GV oocytes but only abolished allelic H2Aub re-establishment in early embryos (Fig. 4f and Extended Data Fig. 5e). It is likely that maternal H3K27me3 loss caused transcriptional de-repression on the maternal allele, which in turn prevented maternal H2Aub re-establishment at the imprinted loci. Furthermore, the bins with increased H2Aub signal were enriched on the X chromosome (Fig. 4g), and X-linked genes such as Atp7a and Kilf4 had increased H2Aub levels on the maternal allele in Eed-matKO embryos (Fig. 4h). As previous studies showed that Xist recruits vPRC1.3 and vPRC1.5 to deposit H2Aub at X-linked genes35, enrichment of H2Aub on the X chromosome could be a result of Xist de-repression due to loss of maternal H3K27me3 in Eed-matKO cells. Collectively, our data indicate that, while maternal H3K27me3 is dispensable for global H2Aub, it is required for allelic H2Aub re-establishment at some of the noncanonical imprinting loci in preimplantation embryos.
H2Aub depletion has minimal immediate effects on H3K27me3.
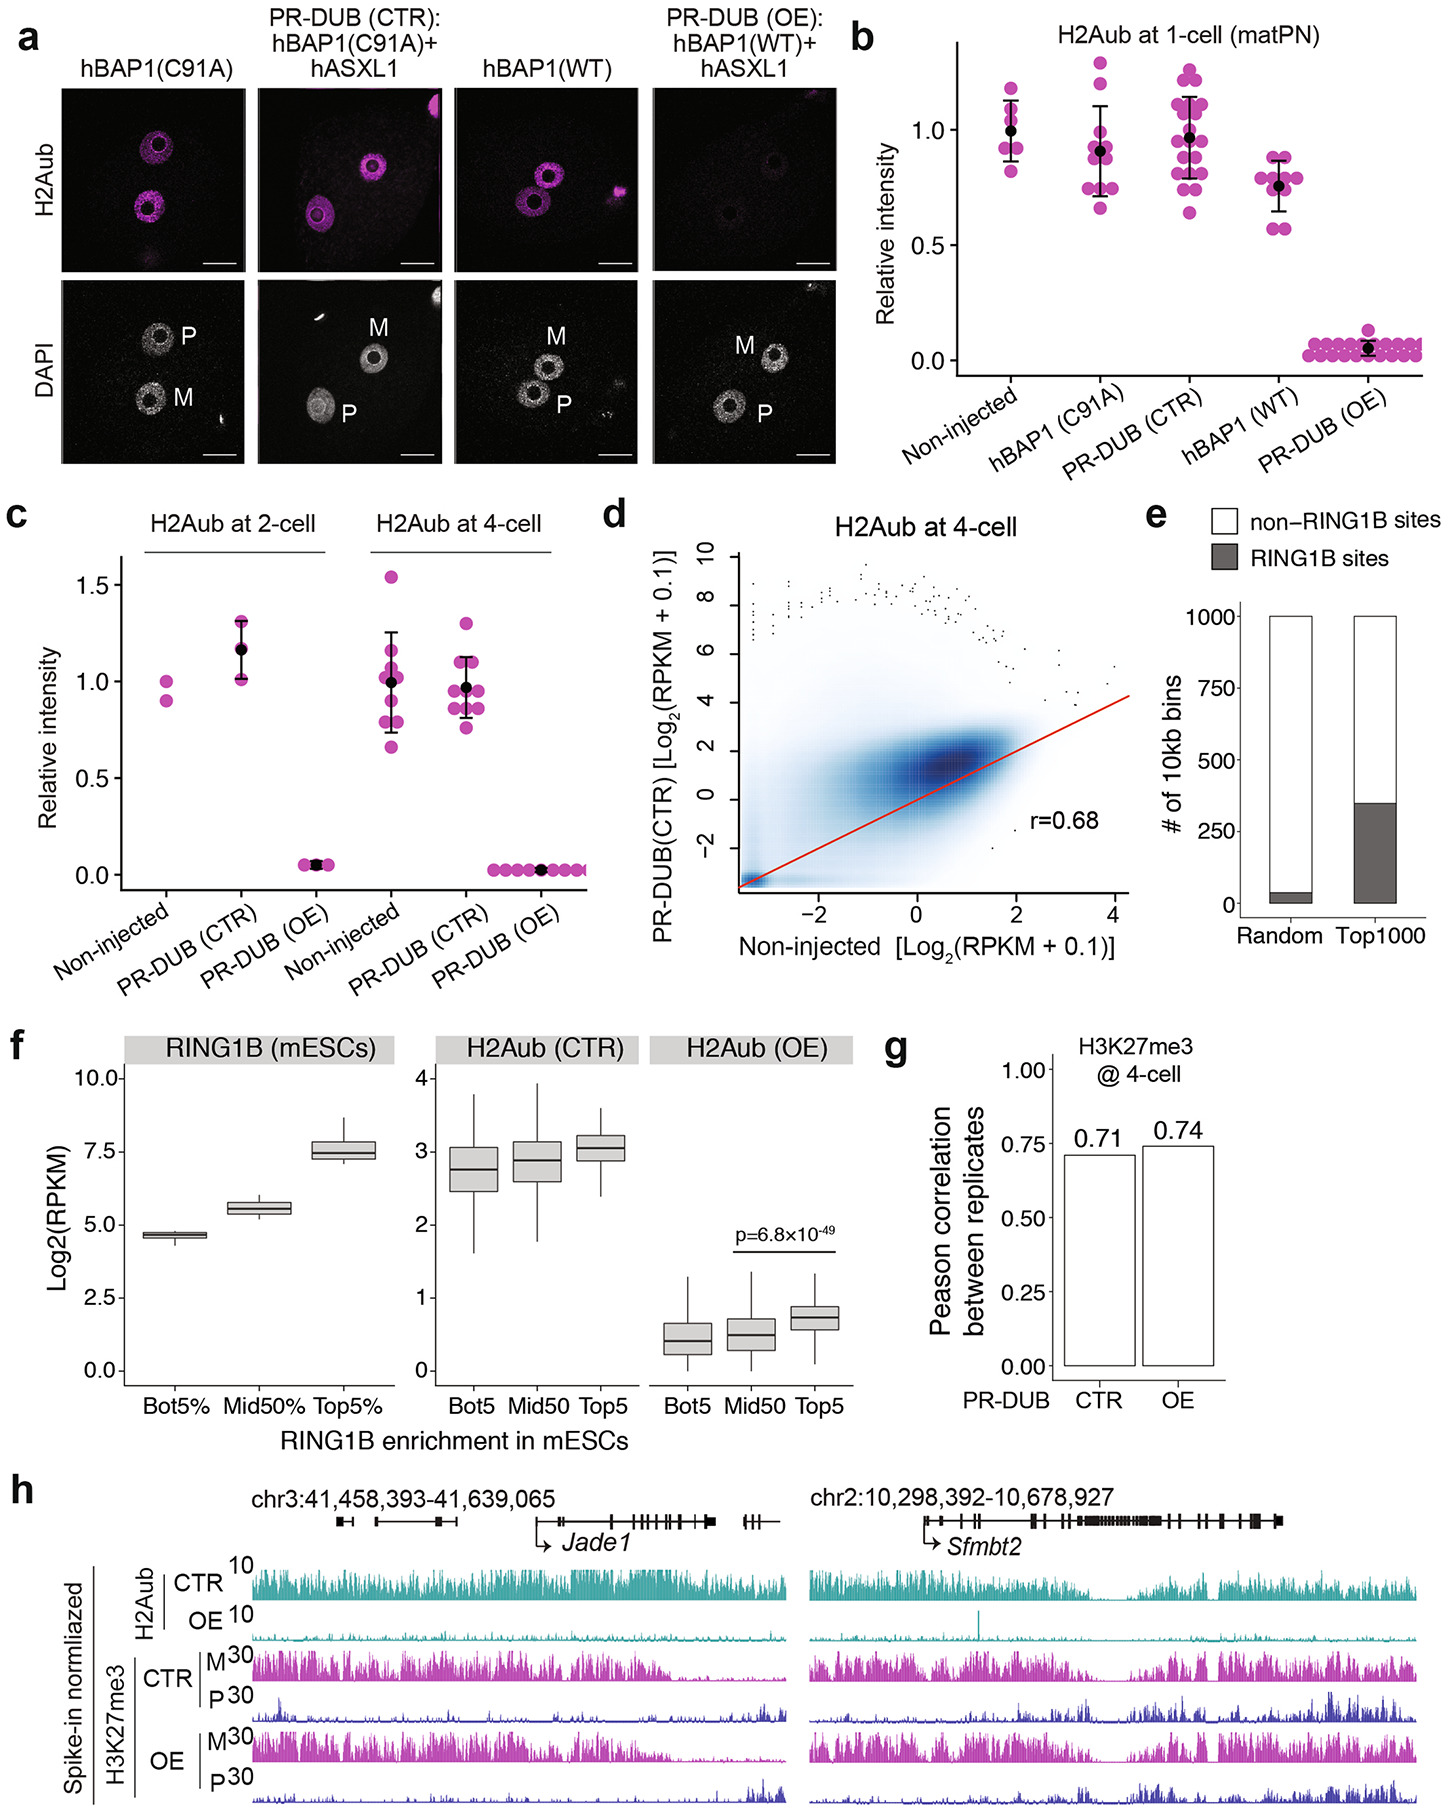
We next investigated whether loss of H2Aub affects H3K27me3 reprogramming in early embryos. Severe oogenesis defects caused by Ring1a and Ring1b double CKO36 prevent the use of this model for studying H2Aub in early embryos. Thus, we attempted to acutely deplete H2Aub by overexpressing the Polycomb repressive deubiquitinase (PR-DUB) complex in zygotes (Fig. 5a). PR-DUB, consisting of a catalytic subunit, BRCA1-associated protein (BAP)1, and an essential cofactor, ASXL1, was shown to specifically erase ubiquitin on H2A37,38. Consistent with an in vitro study39, overexpression of both human (h)BAP1 and hASXL1 (PR-DUB (overexpression)), but not hBAP1 alone, depleted H2Aub signal after ~5 h of micro-injection (Extended Data Fig. 6a,b). As a control (PR-DUB (control)), co-injection of hBAP1 (encoding the catalytic mutant C91A) and hASXL1 had no effect on H2Aub (Extended Data Fig. 6a,b). Notably, the effect of exogenous PR-DUB lasted at least to the four-cell stage, as global H2Aub remained at a very low level at this stage (Fig. 5b and Extended Data Fig. 6c).
Fig. 5 |. Acute depletion of H2Aub in zygotes has minimal immediate effects on H3K27me3.
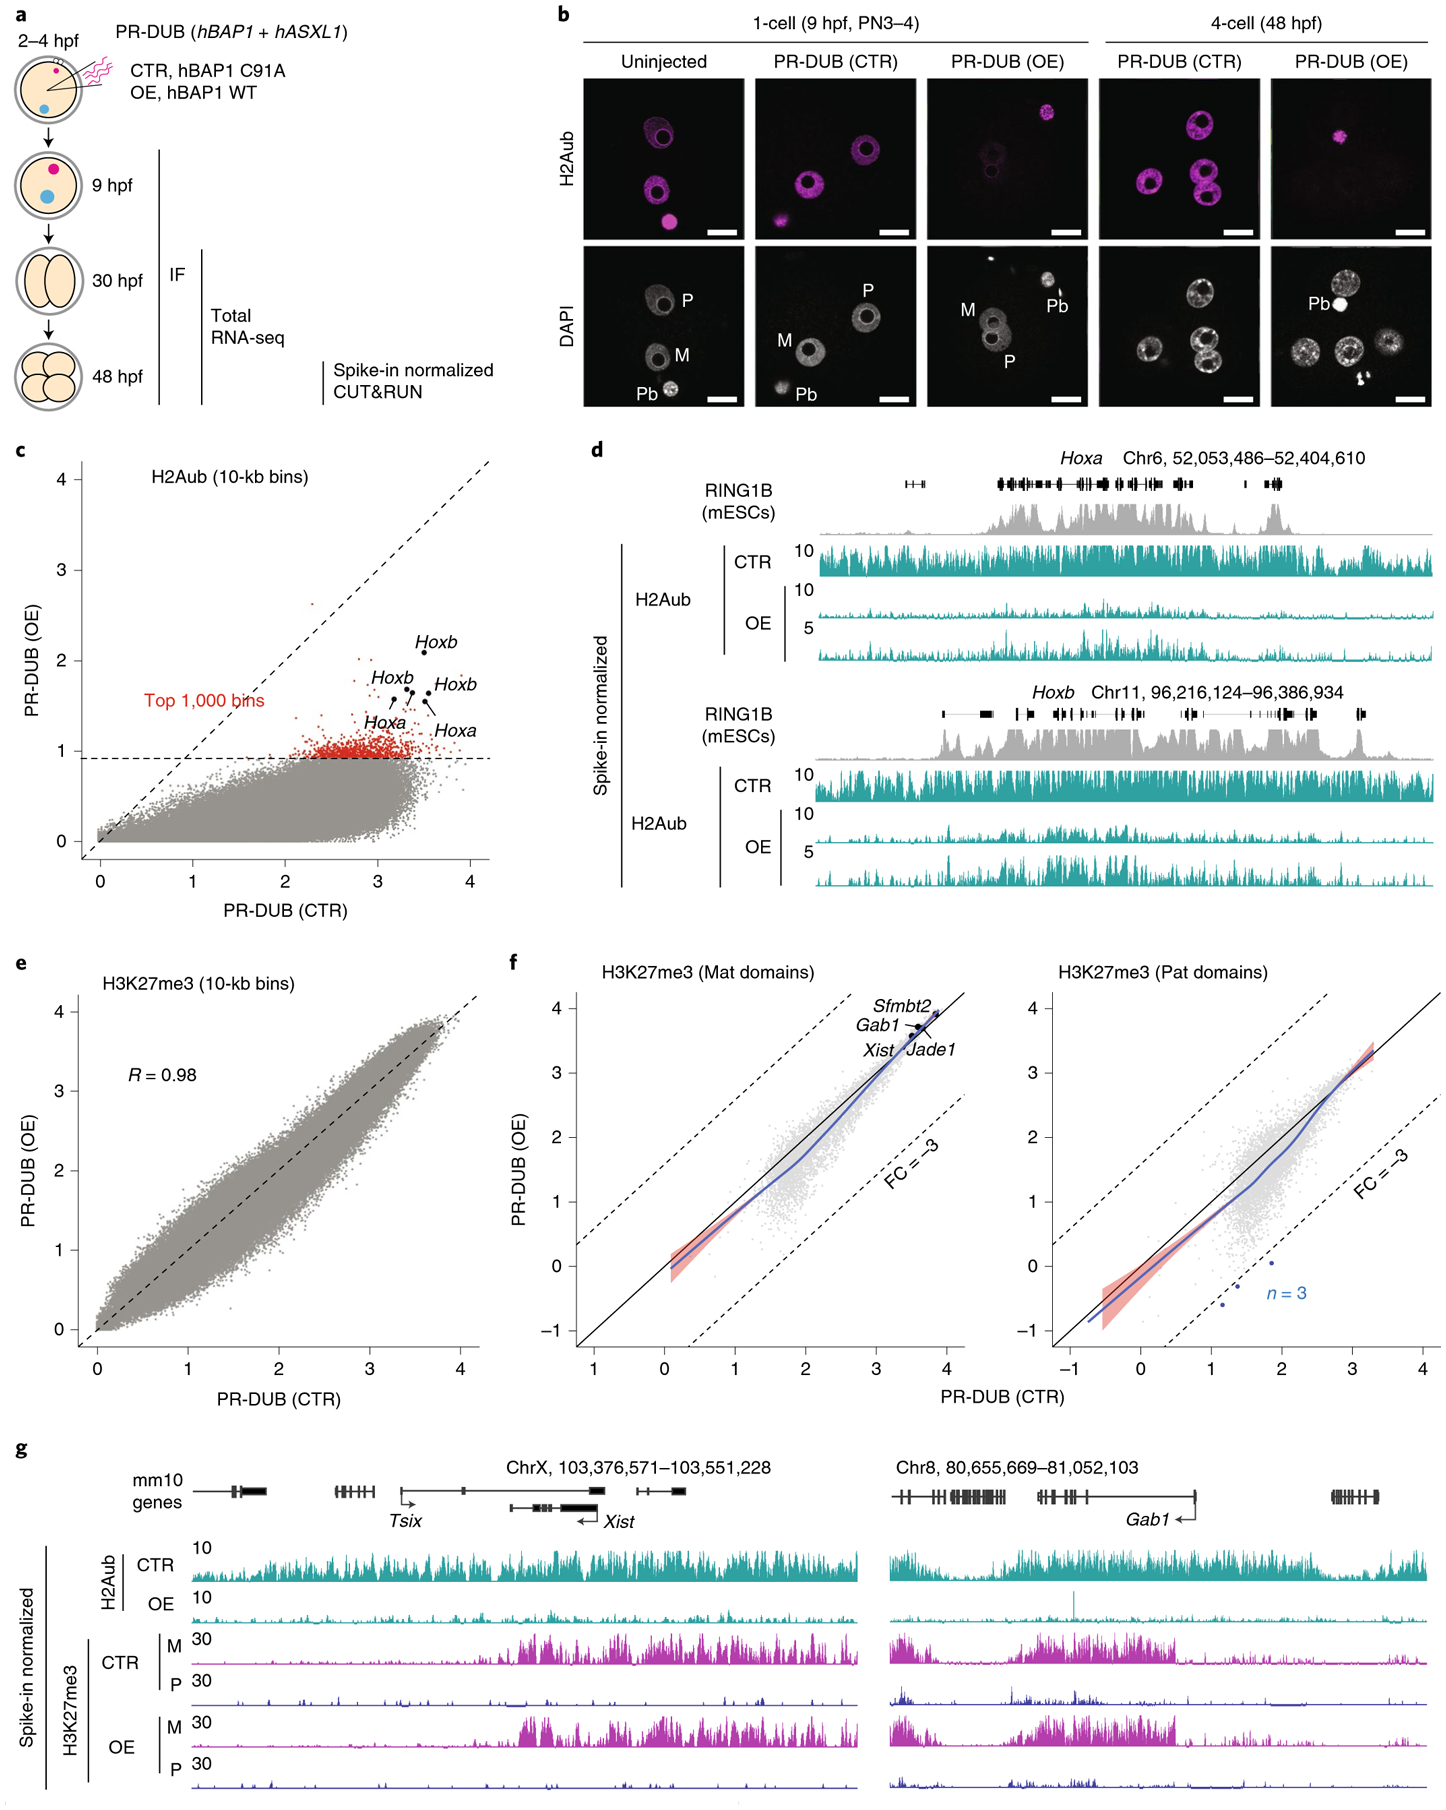
a, Schematic for assessing the effect of H2Aub depletion on H3K27me3 enrichment. PR-DUB consists of a catalytic subunit, BAP1, and an essential cofactor, ASXL1. For the control, mRNA encoding the catalytic mutant BAP1 (C91A) was co-injected with that for ASXL1 (1–479). For H2Aub depletion, WT BAP1 and ASXL1 (1–479) were overexpressed by zygotic micro-injection. hpf, hours post-IVF; IF, immunofluorescence; OE, overexpression. b, Representative images of preimplantation embryos immunostained with an anti-H2Aub antibody. Total numbers of embryos analyzed were six (uninjected, one-cell embryos), 20 (PR-DUB (control), one-cell), 22 (PR-DUB (overexpression), one-cell embryos), ten (PR-DUB (control), four-cell embryos) and nine (PR-DUB (overexpression), four-cell embryos). Quantifications are shown in Extended Data Fig. 6b,c. M, maternal pronucleus; P, paternal pronucleus. Scale bar, 20 μm. c, Scatterplot showing H2Aub levels (log2 (RPKM)) over 10-kb genomic bins in PR-DUB overexpression versus control four-cell embryos. Red dots indicate the 1,000 bins that had the highest H2Aub signals in the overexpression group. d, Genome browser views showing spike-in normalized H2Aub tracks. The RING1B ESC ChIP-seq track24 is also shown. Note that two H2Aub tracks for the overexpression group were shown with different y-axis scales. e, Scatterplot showing H3K27me3 levels (log2 (RPKM)) over 10-kb bins in PR-DUB overexpression versus control embryos. The Pearson correlation coefficient is indicated. f, Scatterplot comparing H3K27me3 signals on the maternal or paternal allele between four-cell embryos injected with mRNA encoding PR-DUB (control) and PR-DUB (overexpression). Dots represent H3K27me3 domains identified on the maternal (n = 5,047) or paternal (n = 5,415) allele. Blue dots represent domains showing reduced H3K27me3 signal (FC > 3) in embryos injected with mRNA encoding PR-DUB (overexpression). Pat, paternal. g, Genome browser view showing that removal of H2Aub (PR-DUB overexpression) does not alter maternally biased H3K27me3 enrichment at Xist and Gab1 loci in four-cell embryos. M, maternal; P, paternal.
To further confirm H2Aub depletion by PR-DUB overexpression, spike-in DNA-normalized H2Aub CUT&RUN analyses were performed using four-cell embryos injected with mRNA encoding PR-DUB mutant (control) and wild-type (WT; overexpression) (Supplementary Table 1). The slightly higher overall H2Aub CUT&RUN signal in embryos injected with mRNA encoding the PR-DUB mutant (control) relative to the uninjected group could be due to a potential dominant negative effect and/or embryo manipulation (Extended Data Fig. 6d), thus PR-DUB (overexpression) was only compared with PR-DUB (control) in downstream analyses. H2Aub was globally depleted in PR-DUB-overexpressing embryos, with some PcG targets such as Hoxa and Hoxb retaining a very low level of H2Aub (Fig. 5c,d). To determine whether PcG targets may resist deubiquitylation by PR-DUB, we overlapped the top 1,000 bins (Fig. 5c) with the RING1B-binding sites identified in mESCs24 and observed an approximately tenfold enrichment of RING1B sites in the 1,000 bins compared with randomly selected regions (Extended Data Fig. 6e). Consistently, strong RING1B-binding sites exhibited higher H2Aub signals compared to the weaker sites in the PR-DUB-overexpressing embryos (Extended Data Fig. 6f). Nonetheless, both strong and weak RING1B sites showed significantly lower H2Aub levels in the overexpression group compared to those in the control group (Extended Data Fig. 6f). Thus, these data indicate that genome-wide H2Aub can be efficiently depleted by PR-DUB overexpression, although strong PRC1-binding sites can still retain a very low level of H2Aub.
To examine how H2Aub removal might affect H3K27me3 in early embryos, we performed H3K27me3 CUT&RUN analyses in four-cell embryos injected with mRNA encoding PR-DUB (control and overexpression) (Supplementary Table 1 and Extended Data Fig. 6g). In contrast to global depletion of H2Aub, genome-wide H3K27me3 was largely unaffected by PR-DUB overexpression (Fig. 5e). When the H3K27me3 distribution was analyzed in an allele-specific manner, only a few H3K27me3 domains showed changes (FC > 3) in the overexpression embryos (Fig. 5f), and no genomic features were recognized for the few domains with reduced H3K27me3 levels. Importantly, maternal H3K27me3 domains that mediate noncanonical imprinting were largely maintained upon acute H2Aub depletion (Fig. 5f,g and Extended Data Fig. 6h), suggesting that acute H2Aub depletion does not cause loss of H3K27me3 imprinting, at least by the four-cell stage. It is possible that the ‘write and read’ mechanism of H3K27me3 (ref.5), together with the very low level of remaining H2Aub, accounted for the largely unaffected H3K27me3 maintenance upon acute H2Aub removal. Indeed, it was shown that acute H2Aub depletion does not cause immediate H3K27me3 reduction in mESCs40. Collectively, these findings support the idea that acute H2Aub depletion does not cause immediate decreases in H3K27me3 in early mouse embryos.
H2Aub prevents premature activation of PcG targets during ZGA.
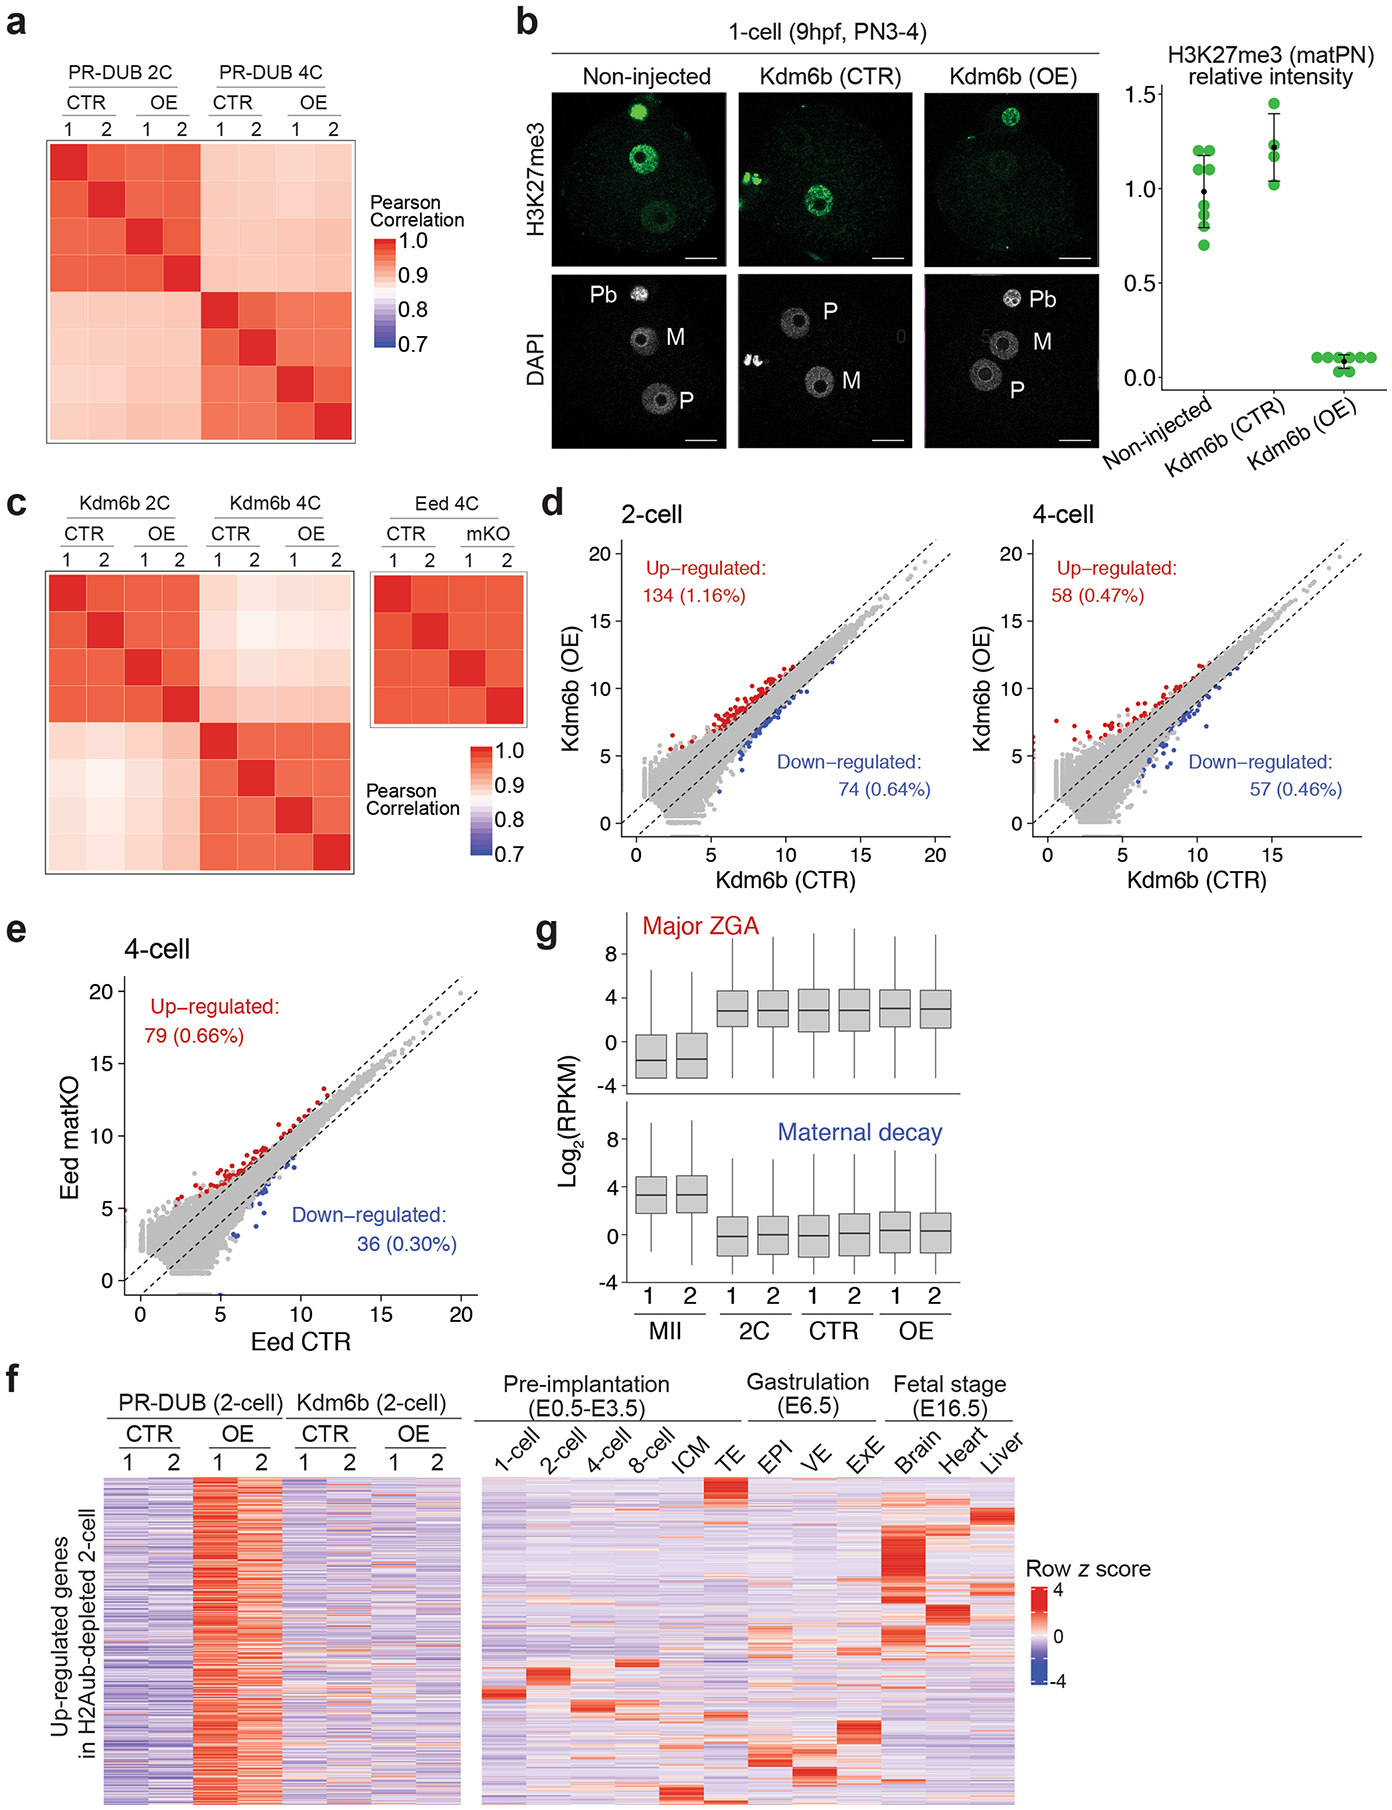
We next investigated how H2Aub contributes to preimplantation development. We found that acute H2Aub depletion caused most embryos to arrest at the four-cell stage (Fig. 6a). To determine the molecular basis of developmental arrest caused by H2Aub depletion, total RNA sequencing (RNA-seq) was performed on two-cell and four-cell embryos injected with mRNA encoding PR-DUB (control or overexpression) (Extended Data Fig. 7a and Supplementary Table 1). For comparison, the effects of H3K27me3 removal by Kdm6b overexpression and Eed matKO were also analyzed (Extended Data Fig. 7b,c and Supplementary Table 1).
Fig. 6 |. Acute depletion of H2Aub causes premature activation of developmental genes during ZGA and leads to early embryonic arrest.
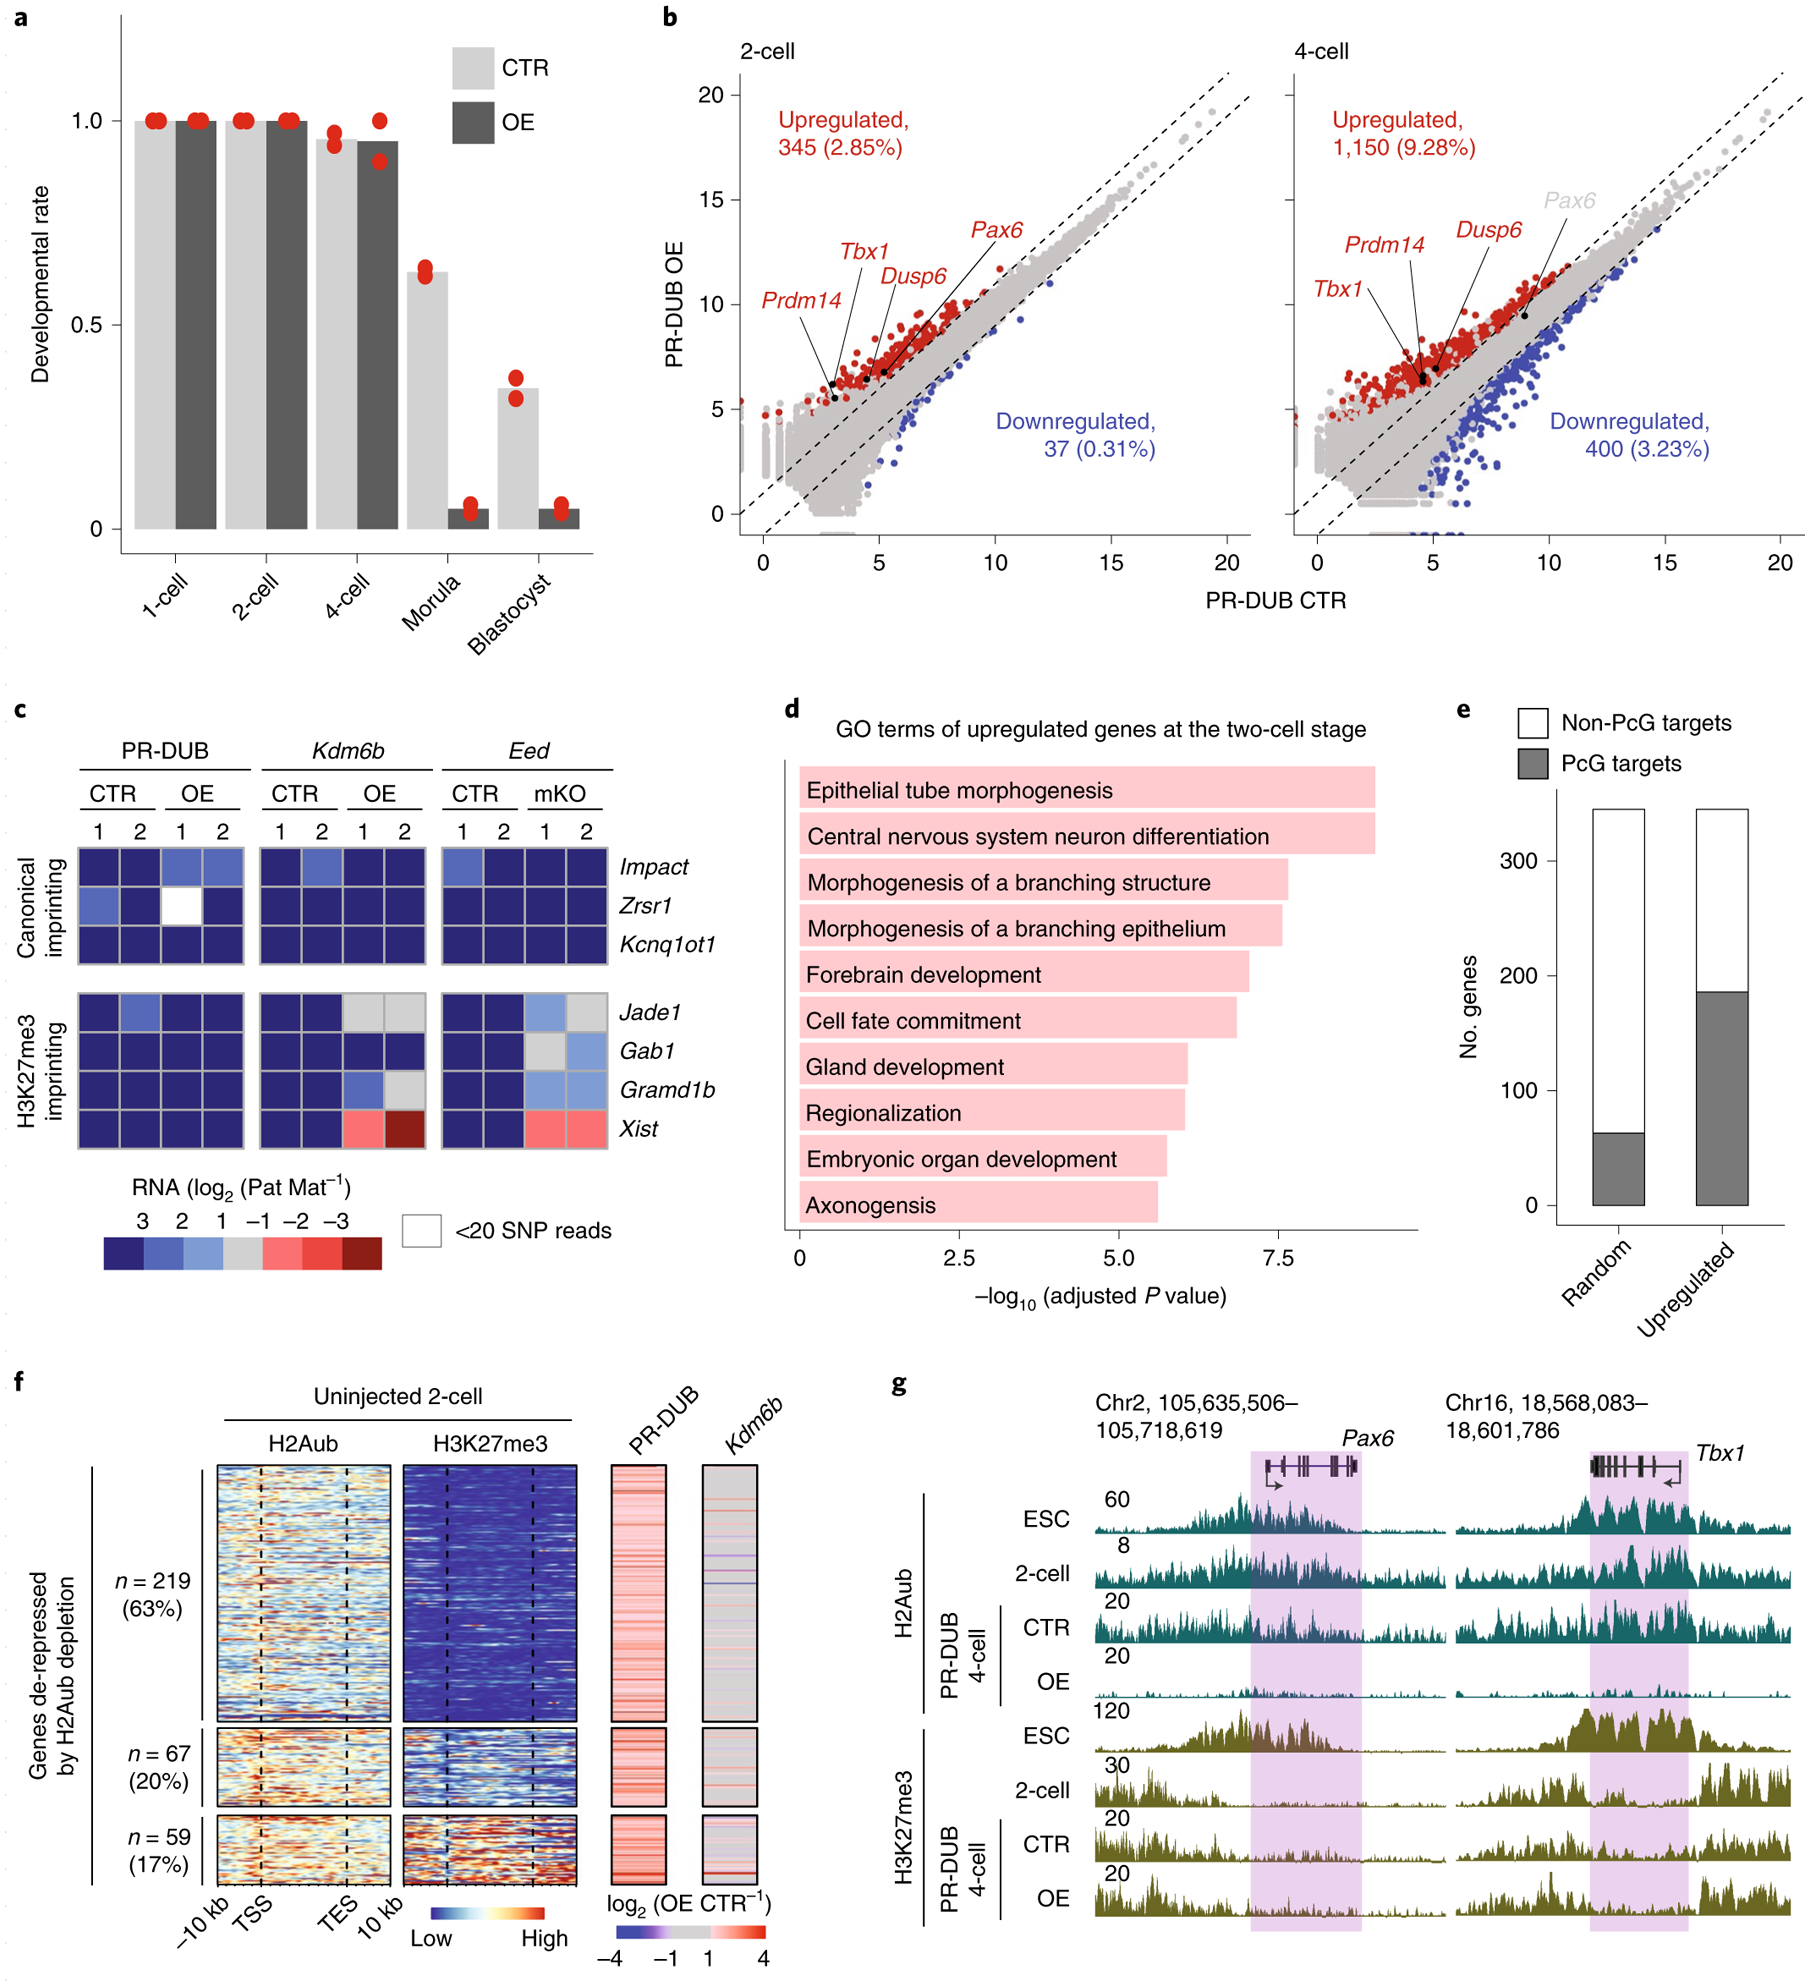
a, Bar graph showing the ratio of embryos reaching the two-cell (~30 hpf), four-cell (~48 hpf), morula (~72 hpf) and blastocyst (~120 hpf) stages. Experiments were performed twice (denoted as dots), and totals of 74 and 72 embryos were analyzed for the PR-DUB (control) and (overexpression) groups, respectively. b, Scatterplot comparing gene expression levels of two-cell and four-cell embryos expressing PR-DUB (control and overexpression). Differential gene expression criteria are FC > 2, P value < 0.05 and FPKM > 1. c, Heatmap showing allelic gene expression bias of canonical and noncanonical imprinted genes at the four-cell stage. Genes with >20 allelic reads in both replicates of all three control groups are shown. d, Gene ontology terms enriched for the upregulated genes in PR-DUB-overexpressing two-cell embryos. e, Stacked bar plot showing the number of genes that belong to PcG targets for the upregulated genes in PR-DUB-overexpressing two-cell embryos versus randomly selected genes. f, Heatmap showing the enrichment of H2Aub and H3K27me3 and gene expression changes at the upregulated genes in PR-DUB-overexpressing two-cell embryos. g, Genome browser view of H2Aub and H3K27me3 enrichment at Pax6 and Tbx1 in mESCs, two-cell embryos and four-cell embryos expressing PR-DUB (control and overexpression). mESC ChIP-seq data for H2Aub and H3K27me3 were obtained from ref.24.
Consistent with the known function of H2Aub in transcriptional silencing, more genes were upregulated than were downregulated in H2Aub-depleted embryos (Fig. 6b and Supplementary Table 7). Indeed, we observed ~9:1 and ~3:1 ratios between the number of upregulated and downregulated genes in PR-DUB-overexpressing two-cell and four-cell embryos, respectively (Fig. 6b). Notably, fewer differentially expressed genes were identified in KDM6B-overexpressing two-cell and four-cell embryos and Eed-matKO four-cell embryos (Extended Data Fig. 7d,e), which is consistent with the fact that both KDM6B overexpression and Eed matKO do not affect preimplantation development19,33,41. In addition, noncanonical imprinting was affected by Kdm6b overexpression and Eed matKO but not by PR-DUB overexpression (Fig. 6c), which is consistent with the fact that acute H2Aub depletion did not disrupt maternal H3K27me3 domains in four-cell embryos (Fig. 5f,g). We noted that Gab1 lost imprinted expression in Eed-matKO but not in Kdm6b-overexpressing four-cell embryos (Fig. 6c). It is possible that H3K27me3 at Gab1 may be more resistant to Kdm6b overexpression. As expected, none of the treatments affected canonical imprinting (Fig. 6c).
We next focused on analyzing two-cell embryos, as major ZGA takes places at this stage and the de-repressed genes are more likely to be direct targets of H2Aub. Interestingly, the de-repressed genes in PR-DUB-overexpressing two-cell embryos were enriched for gene ontology terms that do not belong to ZGA, such as ‘epithelial tube morphogenesis’ and ‘brain development’ (Fig. 6d). Consistently, the genes de-repressed at the two-cell stage upon H2Aub depletion were expressed at high levels in late embryonic tissues such as the E16.5 brain (Extended Data Fig. 7f). By contrast, the same set of genes remained mostly repressed upon H3K27me3 depletion (Extended Data Fig. 7f). In addition, ~50% of the de-repressed genes belonged to PcG targets, which is an enrichment of approximately three-fold compared to randomly selected genes (Fig. 6e). Given that major ZGA and maternal RNA decay were largely unaffected in PR-DUB-overexpressing two-cell embryos (Extended Data Fig. 7g), premature activation of developmental genes is likely the cause of the developmental arrest.
To determine the extent to which these transcriptional changes were a direct result of H2Aub depletion, H2Aub enrichment at the de-repressed gene loci was analyzed in uninjected two-cell embryos. Remarkably, most de-repressed gene loci were enriched for H2Aub, suggesting that de-repression was due to loss of H2Aub (Fig. 6f,g). Importantly, the majority of the genes (83%) were only enriched for H2Aub but with no or low levels of H3K27me3, which may explain why transcriptional silencing of these genes depended on H2Aub but not on H3K27me3 (Fig. 6f,g and Extended Data Fig. 7f). In addition, H2Aub may play a predominant role in transcriptional silencing of the genes (17%) enriched for both H2Aub and H3K27me3, as only depletion of H2Aub, but not that of H3K27me3, resulted in their de-repression (Fig. 6f,g). Collectively, these results demonstrate that H2Aub, but not H3K27me3, safeguards preimplantation development by preventing premature activation of developmental genes during ZGA.
Discussion
How chromatin modifications, including Polycomb domains, are reprogrammed during early mammalian development still remains largely underexplored. Here we report the unexpected differential reprogramming dynamics and functions of H3K27me3 and H2Aub in preimplantation mouse embryos. This observation is strikingly different from those in other systems, including gametes, mESCs, epiblasts and epidermal progenitors42, where these two histone modifications are highly colocalized. Specifically, H3K27me3 maintains thousands of maternally biased domains throughout preimplantation development, whereas allelic-biased H2Aub distribution is largely equalized at the two-cell stage (Fig. 7a). Mechanisms underlying the decoupled H3K27me3 and H2Aub reprogramming in early mouse development warrant future investigations. It is possible that dynamic expression of PRC1/2 subunits, H2A deubiquitinase and H3K27me3 demethylases together contribute to H2Aub and H3K27me3 distribution in preimplantation embryos.
Fig. 7 |. Models of the allelic dynamics of H2Aub and H3K27me3.
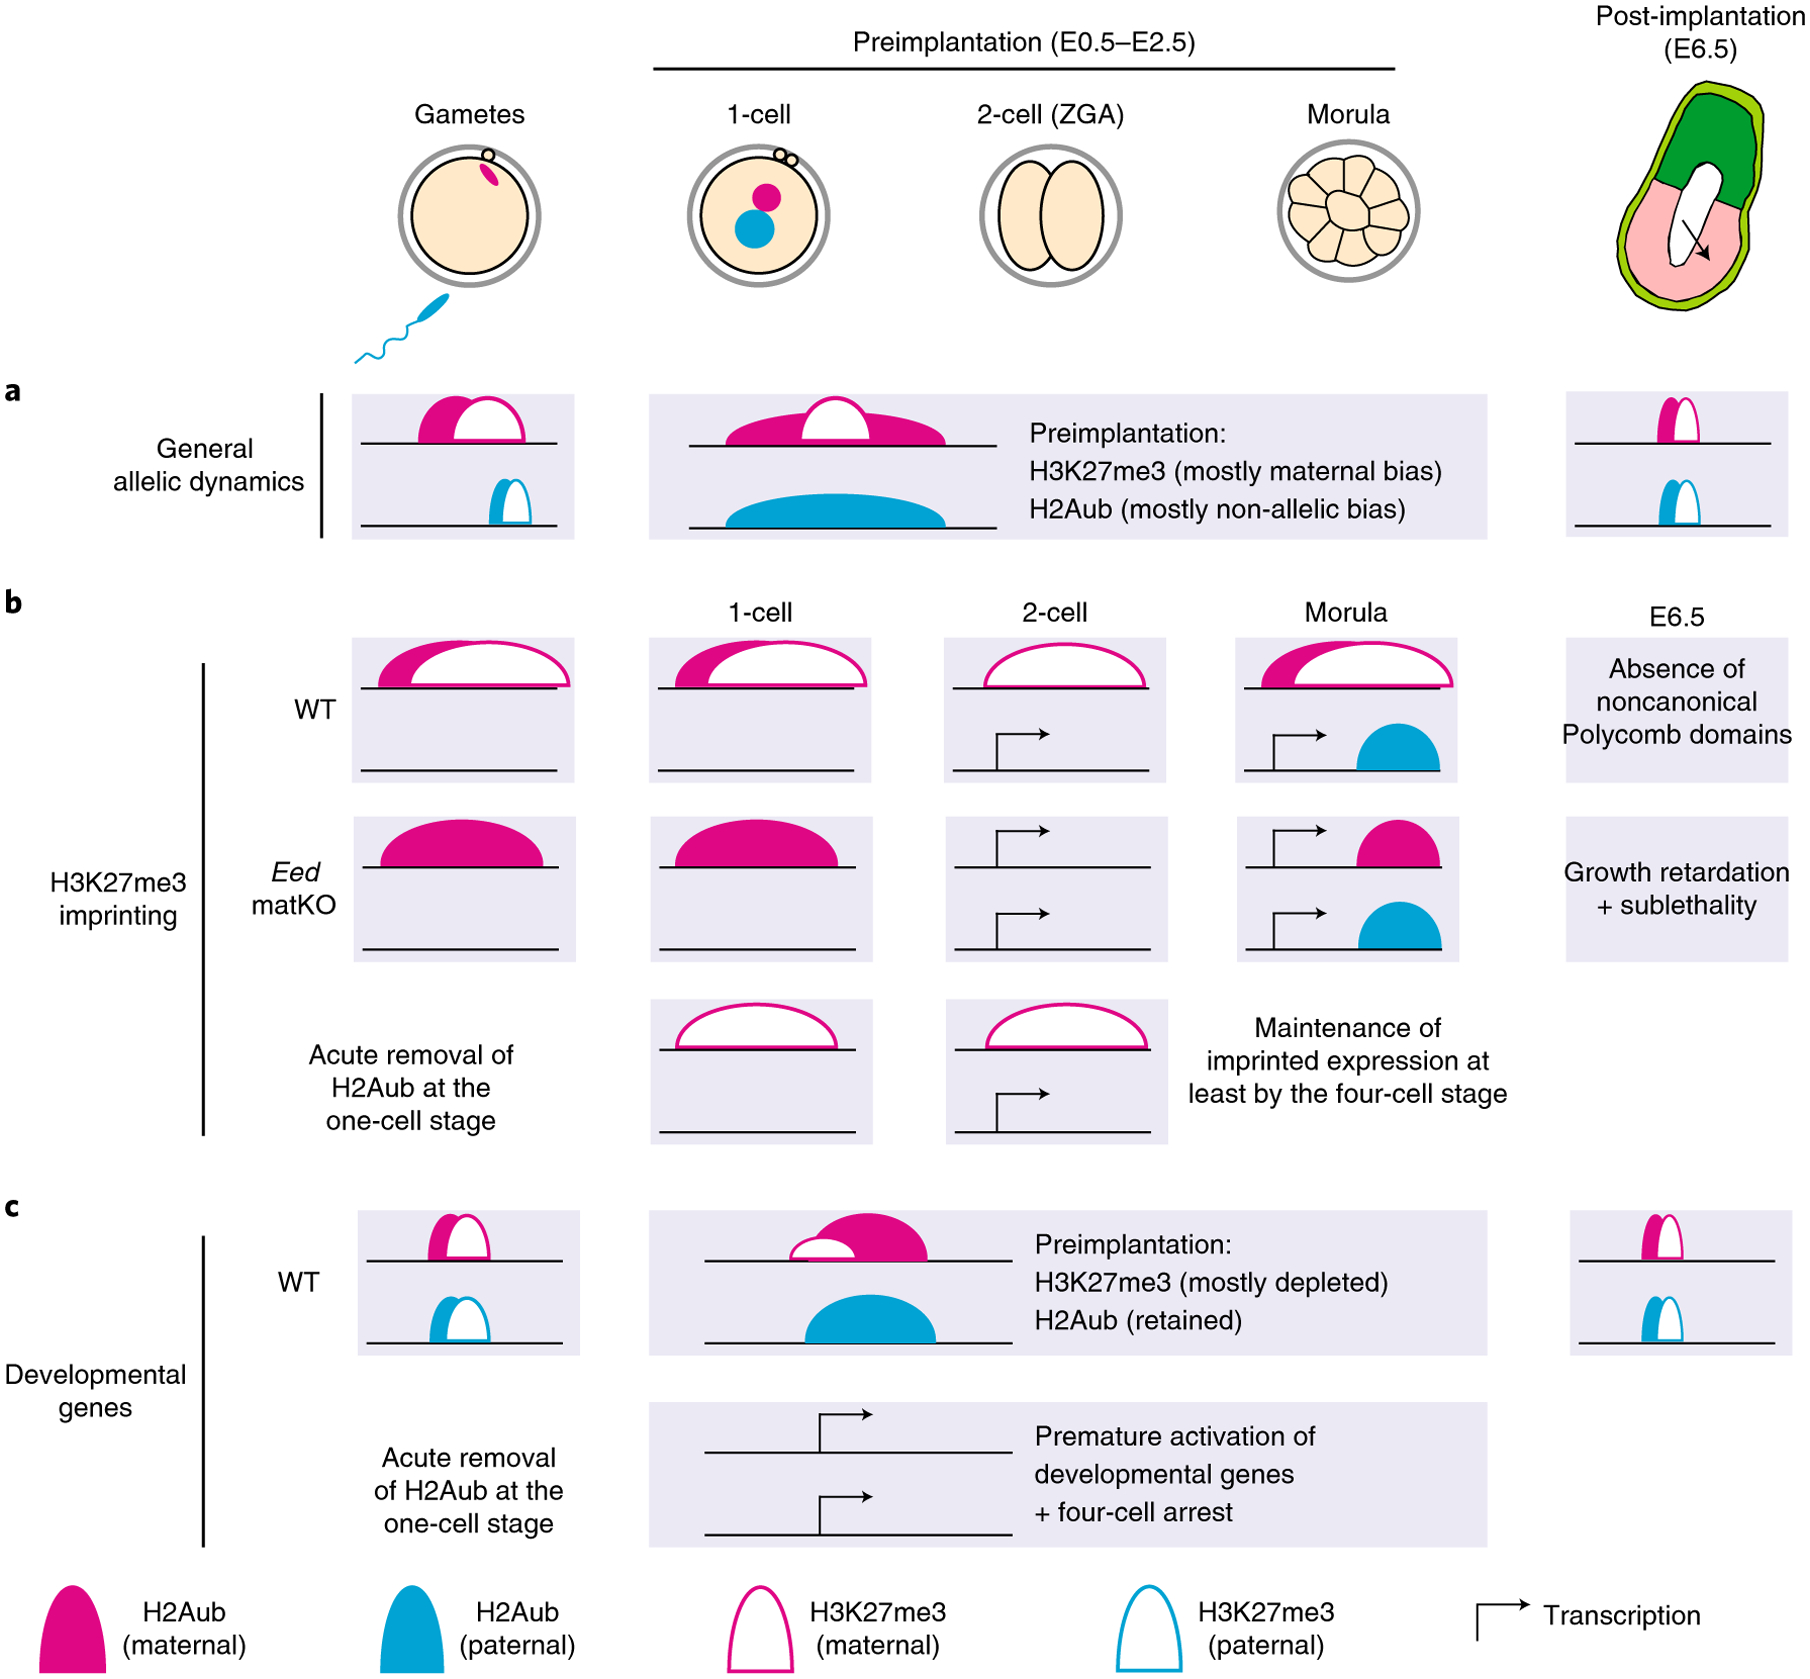
a–c, The models illustrate H2Aub and H3K27me3 dynamics from gametes to post-implantation and how the distinct dynamics may explain their different roles in H3K27me3 imprinting, developmental gene silencing and early mouse development. Further details are provided in the Discussion.
One major finding of this study is the different dynamics of H3K27me3 and H2Aub at H3K27me3 imprinting loci. Specifically, while the maternal H3K27me3 domains are maintained throughout preimplantation development, H2Aub at these loci undergoes transient loss at the two-cell stage and is then re-established allelically at later stages (Fig. 7b). The transient loss of the allele specificity of H2Aub at the two-cell stage suggests a nonessential role of H2Aub in H3K27me3 imprinting maintenance. Indeed, acute removal of H2Aub in zygotes does not have a significant effect on oocyte-derived H3K27me3 domains and imprinted expression of the associated genes. Although we cannot exclude the possibility that loss of H2Aub may cause H3K27me3 reduction at stages later than the four-cell stage, premature activation of developmental genes and embryonic arrest prevented us from testing this hypothesis. By contrast, maternal H3K27me3 is essential for allelic H2Aub at noncanonical imprinting loci, including Xist, as maternal Eed knockout abolishes allelic H2Aub re-establishment, likely through an indirect mechanism in early embryos. It should be noted that Eed is not required for H2Aub deposition during oogenesis, which is in line with a previous study, which demonstrated that loss of PRC2 has a limited effect on the oocyte transcriptome and cohesin-independent Polycomb-associated compartmental domains43. We note that the PR-DUB overexpression approach used in this study does not address the role of H2Aub in H3K27me3 imprinting establishment, which takes place during early stages of oogenesis33. It is possible that PRC1 might be required for H3K27me3 imprinting establishment during oogenesis, which can be tested by using PRC1-null oocytes.
Despite the essential role of H3K27me3 in noncanonical imprinting, it is largely dispensable for transcriptional silencing of developmental genes in preimplantation embryos. This could be explained by the retainment of H2Aub at developmental genes from fertilization to implantation, when H3K27me3 is largely absent at these loci (Fig. 7c). Indeed, the majority of the de-repressed genes caused by acute H2Aub depletion do not have or have very low levels of H3K27me3 in WT two-cell embryos, suggesting that silencing of these genes is mainly carried out by H2Aub, rather than by H3K27me3. This finding may also explain why Eed-matKO and maternal–zygotic knockout embryos can develop to the blastocyst stage33,41,44. It should be noted that Eed-matKO embryos show developmental defects only after implantation, and loss of H3K27me3 imprinting likely contributes to these defects33.
The finding that acute H2Aub removal causes premature activation of developmental genes is reminiscent of a recent report showing that H3K27me3 prevents precocious activation of developmental regulators during ZGA in Drosophila45. These observations suggest that the role of PcG proteins in safeguarding ZGA may be evolutionarily conserved, except that PRC1 and PRC2, respectively, perform this role in mice and flies. We speculate that, in humans, H2Aub, but not H3K27me3, has a similar role, as H3K27me3 undergoes global depletion at the eight-cell stage when ZGA takes place46. Although proper activation of ZGA genes is critical for preimplantation development, our finding indicates that H2Aub-mediated transcriptional silencing of certain developmental regulators at ZGA is equally important for preimplantation development.
Online content
Any methods, additional references, Nature Research reporting summaries, source data, extended data, supplementary information, acknowledgements, peer review information; details of author contributions and competing interests; and statements of data and code availability are available at https://doi.org/10.1038/s41588-021-00821-2.
Methods
All animal experiments were performed in accordance with the guidelines of the Institutional Animal Care and Use Committee at Harvard Medical School.
Collection of mouse oocytes and embryos.
Oocytes were collected from B6D2F1/J (BDF1; Jackson stock 100006), Eed control (Eedfl/fl) or CKO (Gdf9Cre;Eedfl/fl) 7- to 12-week-old female mice33. Collection of GV and MII oocytes was described previously33,50. For MII oocytes, the first polar bodies were removed by gently pipetting oocytes in Acidic Tyrode’s solution with a narrow-bore glass pipette. Preimplantation embryos were generated by IVF with sperm from the WT PWK/PhJ strain (PWK, Jackson stock 003715). The IVF procedure was described previously51. The time when sperm were added to COCs was considered as 0 hpf. Zygotes and two-cell, four-cell and morula embryos were collected at 12, 30, 48 and 72 hpf, respectively. For zygotes and two-cell and four-cell embryos, polar bodies were also removed as previously described52.
ICMs were isolated as previously described with slight modifications20. Briefly, blastocysts at 120 hpf were treated with Acidic Tyrode’s solution (Millipore) to remove the zona pellucida. Embryos were then incubated in KSOM (Millipore) containing anti-mouse serum antibody (Sigma-Aldrich, 1:5 dilution) at 37 °C for 30 min. After being washed with KSOM, embryos were transferred into KSOM containing guinea pig complement (Millipore, 1:5 dilution) and incubated at 37 °C for 20 min. After incubation, lysed trophectoderm cells were removed by pipetting with a glass pipette with an inner diameter of 40–50 μm. The remaining ICMs were washed with 0.2% BSA–PBS for CUT&RUN library preparation.
To collect E6.5 epiblasts, BDF1 female mice (7–12 weeks old) were co-caged with PWK male (9- to 12-week-old) mice, and the day of vaginal plug was counted as E0.5. Dissection of epiblasts from E6.5 embryos was performed as described previously53.
Plasmid construction, mRNA preparation and injection.
hBAP1-coding regions and the ASXL1 N-terminal sequence (1–479) were amplified from Addgene plasmids 81024 and 74262, respectively38. DNA encoding the BAP1 C91A catalytic mutant was amplified from Addgene plasmid 81025. The amplicons were inserted between the Flag tag and poly(A) of the pcDNA3.1-Flag-poly(A)83 plasmid54. The plasmids encoding WT and H1390A KDM6B were previously described20. To prepare mRNA, the plasmid was linearized with a restriction enzyme and then served as a template for in vitro transcription using the mMESSAGE T7 Ultra kit (Life Technologies). Synthesized mRNA was purified by LiCl precipitation, and its concentration was determined using a NanoDrop spectrophotometer.
IVF experiments using BDF1 MII oocytes and PWK sperm were the same as in previous sections. At 2 hpf, fertilized zygotes were transferred into M2 medium (Sigma-Aldrich), and mRNA was injected into the cytoplasm of zygotes (~2–4 hpf) using a Piezo impact-driven micromanipulator (Primer Tech). Following injection, embryos were cultured in HTF (Millipore) medium for an additional 4 h before being transferred to KSOM. mRNA concentrations for PR-DUB were 0.4 μg μl−1 for BAP1 (mutant or WT) and 0.4 μg μl−1 for ASXL1, and those for mutant and WT Kdm6b were 1.5 μg μl−1.
Whole-mount immunostaining.
Immunostaining, fluorescence detection and quantification were described previously33. Primary antibodies were mouse anti-H3K27me3 (1:500, Active Motif, 61017) and rabbit anti-H2Aub (1:2,000, Cell Signaling, 8240). Secondary antibodies were Alexa Fluor 488 donkey anti-mouse IgG (1:200) or Alexa Fluor 568 donkey anti-rabbit IgG (1:200) (Life Technologies).
CUT&RUN, STAR ChIP-seq and RNA-seq library preparation and sequencing.
CUT&RUN library preparation was described previously34. A rabbit anti-H3K27me3 antibody (1:100, Diagenode, C15410069) and a rabbit anti-H2Aub antibody (1:100, Cell Signaling, 8240) were used. CUT&RUN libraries were sequenced on the HiSeq 2500 system (Illumina) with paired-ended 100-bp reads or the NextSeq 550 system (Illumina) with paired-ended 76-bp reads.
ChIP-seq of mouse sperm H3K27me3 and H2Aub was performed as described previously with some modifications18,55. Briefly, ~2 million mouse spermatozoa (PWK) collected by the swim-up method were treated with 50 mM dithiothreitol (Sigma-Aldrich) for 2 h at room temperature and quenched by adding N-ethylmaleimide (Sigma-Aldrich) and incubating for an additional 30 min. Pelleted sperm cells were resuspended in 100 μl complete buffer with detergent (15 mM Tris-HCl (pH 7.5), 60 mM KCl, 5 mM MgCl2, 0.1 mM EGTA, 0.3 M sucrose, 0.5 mM dithiothreitol, 0.5% NP-40 and 1% sodium deoxycholate) and lysed on ice for 10 min. The same volume of MNase buffer (85 mM Tris-HCl (pH 7.5), 3 mM MgCl2, 2 mM CaCl2, 0.3 M sucrose) containing 10 U MNase (Sigma-Aldrich) was added, and the solution was incubated at 37 °C for 5 min. MNase treatment was stopped by adding 2 μl of 0.5 M EDTA (Thermo Fisher). For STAR ChIP-seq, 200 μl ice-cold 2× RIPA buffer (1% Triton, 280 mM NaCl, 0.1% SDS, 0.2% DOC, 5 mM EGTA and 1× proteinase inhibitor) was supplemented. After spinning at maximum speed at 4 °C for 10 min, the supernatant was transferred to a new tube and supplemented with 176 μl RIPA buffer (10 mM Tris-HCl (pH 8.0), 140 mM NaCl, 1% Triton, 0.1% SDS, 0.1% DOC, 1 mM EDTA, 1× proteinase inhibitor). Samples were incubated with a rabbit anti-H2Aub antibody (1:200, Cell Signaling, 8240) or a rabbit anti-H3K27me3 antibody (1:200, Diagenode, C15410069) overnight with rotation at 4 °C. The following day, samples were incubated with 100 μg Protein A Dynabeads (Life Technologies) for 2 h with rotation at 4 °C. The beads were then washed five times with 150 μl RIPA buffer and once with LiCl buffer (250 mM LiCl, 10 mM Tris-HCl (pH 8.0), 1 mM EDTA, 0.5% NP-40, 0.5% DOC). To elute DNA, the beads were resuspended in 200 μl TE buffer with 2.5 μl 10% SDS (Sigma-Aldrich) and 2.5 μl mg ml−1 Protease K (Thermo Fisher) and incubated in a shaker at 55 °C for 90 min. The supernatant was collected in a new tube, and DNA was extracted by a phenol–chloroform method followed by ethanol precipitation. Sequencing libraries were prepared using the NEBNext Ultra II DNA library preparation kit for Illumina (New England Biolabs) according to the manufacturer’s instructions. Sperm ChIP-seq libraries were sequenced on the NextSeq 550 system (Illumina) with paired-ended 76-bp reads.
The SMARTer-Seq Stranded kit (Takara) was used for RNA-seq library preparation following the manufacturer’s instructions. Briefly, random primers were used for reverse transcription, and the amplified cDNA was then subjected to ribosomal RNA depletion. Prepared RNA-seq libraries were sequenced on the NextSeq 550 system (Illumina) with paired-ended 76-bp reads.
CUT&RUN, STAR ChIP-seq and RNA-seq data processing.
Low-quality reads and adaptor sequences of the CUT&RUN and STAR ChIP-seq data were trimmed using Trimgalore (version 0.4.5) with the parameter ‘–paired’. The trimmed reads were then aligned to the mm10 genome using Bowtie 2 (version 2.3.4.3)56 with parameters ‘–no-unal–no-mixed–no-discordant -I 10 -X 700’ (for STAR ChIP-seq, ‘-I 0’). To minimize mapping bias toward the reference genome (B6) for the F1 hybrid data, SNPs between PWK and B6/129 or B6/DBA were masked as ‘N’, depending on the maternal genetic background. Unmapped and low-quality reads were removed using sambamba (version 0.5.9)57 with parameters ‘-f bam -F ‘mapping_quality ≥ 20 and not (unmapped or mate_is_unmapped)’’. Only uniquely mapped reads were kept for downstream analyses. PCR duplicates were removed using the ‘MarkDuplicates’ command in Picard tools (version 2.8.0) (https://broadinstitute.github.io/picard/). SNPsplit (version 0.3.2)58 was used to determine the parental origin of CUT&RUN–STAR ChIP-seq read pairs. Bigwig files were generated using the ‘bamCoverage’ command from deepTools (version 3.0.2)59 with parameters ‘–binSize 25–extendReads 150–normalizeUsing RPKM–outFileFormat bigwig–scaleFactor 1’. Reproducibility was assessed by calculating the Pearson correlation coefficient of RPKM in 5-kb bins between replicates. Biological replicates were pooled using the ‘merge’ command in sambamba (version 0.5.9)57. CUT&RUN and STAR ChIP-seq reads within mm10 blacklist regions (https://github.com/Boyle-Lab/Blacklist/tree/master/lists) were not included for subsequent analyses.
For non-calibrated CUT&RUN, y-axis scales vary between different developmental stages, which could be due to the drastic H2Aub distribution differences or potential batch effects. For genome browser views, we manually adjusted the scales based on the global data range. For calibrated CUT&RUN, scale factors were calculated using spike-in DNA as previously described23 after considering input embryo and cell numbers. To achieve more accurate normalization, averaged scaling factors calculated based on Escherichia coli carry-over DNA from pA-MNase60 and exogenous yeast spike-in DNA were used for downstream analyses.
For RNA-seq data processing, raw data were first adaptor- and quality-trimmed using Trimgalore (version 0.6.5) with parameters ‘–nextseq 20 -j 6–clip_R2 5–paired’. The trimmed reads were then mapped to rRNA and tRNA using HISAT2 (version 2.1.0)61 with parameters ‘–rna-strandness RF–un-conc-gz unmapped. hisat2.gz’. The reads that were not mapped to rRNA or tRNA were then aligned to the mm10 SNP-masked genome using HISAT2 with parameters ‘–rna-strandness RF–sp 1000,1000–no-mixed–no-discordant’. Known splicing sites were also supplied to improve mapping efficiency. Only uniquely aligned reads (tag NH = 1) were used for subsequent analyses. Gene FPKM values were quantified using StringTie (version 1.3.3b)62 with parameters ‘–rf -v -b ballgown -e’. Reproducibility was assessed by calculating the Pearson correlation coefficient of gene FPKM values between replicates. TEtranscripts (version 2.1.4)63 was used to generate read counts for each gene, and DESeq (version 1.36.0)64 was used for differential gene expression analyses with cutoffs FPKM > 1, FC > 2 and P value < 0.05. SNPsplit (version 0.3.2)58 was used to determine the parental origin of the RNA-seq read pairs. Gene ontology analysis for differentially expressed genes was performed using the ‘enrichGO’ function of the clusterProfiler R and Bioconductor package65 with parameters ‘pAdjustMethod = ‘BH’, ont = ‘BP’, qvalueCutoff = 0.01)’.
H2Aub dynamics analyses using ChromHMM.
The ChromHMM method (version 1.20)25 was used to classify genomic regions based on H2Aub dynamics in early mouse development. Specifically, H2Aub alignment files for all developmental stages were first binarized using the ‘BinarizeBam’ command with a bin size of 5 kb (option ‘-b 5000’) and a signal-to-background fold enrichment greater than two (option ‘-f 2’). Binarized signals were converted to bigwigs for manual inspection of the accuracy of binarization. We found that setting the fold enrichment cutoff to three was more reliable for E6.5 epiblasts, potentially due to the fact that H2Aub patterns in epiblasts are drastically different from those in other stages (Fig. 1b and Extended Data Fig. 1a). For the MII stage, ChromHMM generated a relatively sparse binary signal, therefore we replaced its results with the binary signal generated by our custom domain caller. The segmentation model was then trained using the ‘LearnModel’ command with 5-kb bins and a maximum of 300 iterations (options ‘-b 5000 -r 300’). Finally, genomic regions were classified into five ChromHMM types based on the ‘CompareModel’ outputs and visual inspection of genome browser tracks. Genes were assigned to each ChromHMM type based on whether the ChromHMM type overlapped with most of the promoter regions, which were defined as ‘TSS ± 2 kb’. The median FPKM values of genes belonging to the ChromHMM types were calculated for each developmental stage.
H2Aub and H3K27me3 domain boundary analyses.
A hidden Markov model (HMM)-based in-house domain caller was used to determine the broad domain boundaries of H3K27me3 and H2Aub. Specifically, for each 5-kb bin Xt, the HMM model predicts a state St ∈ (0, 1), indicating whether the bin Xt is inside a domain (denoted as 1) or not (denoted as 0). The state St of a bin Xt depends on the adjacent bin Xt−1. The model has three main parameters, θ = (π, P, b), which were estimated using the bigwig signals from chromosome 1 to chromosome 4 and then used to predict states of the bins on other chromosomes. The initial distribution π of the states was estimated by running a k-means clustering (k = 2) on the training chromosomes and then calculating the percentage of genomic regions classified as each state. The transition probability P = P(St|St−1) was initially set as 0.9 for transition to the same state and 0.1 for transition to the other state, and then it was estimated using the EM algorithm implemented in the mhsmm R package (version 0.4.16)66. The probability that Xt belongs to state St was defined as a Gaussian distribution, , in which the initial μs and were set based on the k-means clustering and then estimated using the EM algorithm implemented in the mhsmm package. Bins defined as type 1 ‘background’ by ChromHMM were also set to the background state ‘0’. Consecutive bins with the state ‘1’ were merged as H2Aub or H3K27me3 domains.
Analyses of allelically biased H2Aub regions.
To identify allelically biased H2Aub regions at each developmental stage, each 5-kb bin across the genome was subjected to a binomial exact test with the null hypothesis that both alleles were equally enriched. Bins with at least ten reads showing FC > 3 and Benjamini–Hochberg-adjusted P values (P adjusted) < 0.01 were considered allelically biased. Adjacent bins and bins within a 25-kb distance showing the same type of allelic biases were merged, and a cutoff of FC > 2 for the merged bins was used to identify allelically biased regions. Bins located in the background regions identified for each stage using the custom domain caller were excluded for this analysis. Note that sex chromosomes were excluded from this analysis.
To compare allelic dynamics of H2Aub regions during development, the csaw R package (version 1.20)67 was used to correct systematic biases or batch variations between different developmental stages. Specifically, the ‘CountReadsPerBin’ function from deepTools (version 3.0.2)59 was used to count reads in 5-kb bins across the genome. The csaw package was then used to estimate scaling factors based on genomic background signal and calculate normalized H2Aub signal for each developmental stage. Allelic signal was normalized using the same scaling factors determined by the non-allelic datasets. For heatmap illustrations, k-means clustering was used to classify regions into groups with different dynamic patterns.
Hierarchical clustering analyses.
As clustering analyses involved samples representing different developmental stages and/or using different techniques (for example, CUT&RUN and ChIP-seq) by different laboratories, a few steps were included to minimize potential systematic noises. H2Aub and H3K27me3 data were first binarized using the ‘BinarizeBam’ command from ChromHMM with parameters ‘-b 5000 -f 1’. Principal component analyses were then applied to the binarized data using the R ‘prcomp’ function with parameters ‘scale = FALSE, center = FALSE, retx = TRUE’. Finally, hierarchical clustering was performed on the principal component analysis coordinates using the command ‘hclust’ with the parameter ‘method = ‘ward.D2’’.
H2Aub analyses at maternal H3K27me3 domains and PcG targets.
Coordinates (mm9) of maternally biased H3K27me3 domains were obtained from a previous study31 and then converted to mm10 coordinates using the ‘liftOver’ function from the rtracklayer R package (version 1.46.0)68. Only H3K27me3 domains showing consistent maternal bias between different datasets22,33 were included.
PcG targets were defined as the genes with both RING1B and SUZ12 binding at promoter regions (TSS ± 2 kb) in mESCs, a criterion similar to that previously described24. Hierarchical clustering was then used to split the identified PcG targets (n = 6,289) into two groups based on their H3K27me3 dynamics. For heatmap visualization, the csaw R package (version 1.20)67 was used to normalize H3K27me3 or H2Aub signal as described in the previous section, and k-means clustering was used to classify regions into groups of different dynamics. To limit the effect of noisy signal, we divided the signal in each promoter into 100 bins, smoothed the signal and then calculated the mean enrichment of the target ChIP-seq or CUT&RUN signal. All active and inactive genes were defined based on remapped RNA-seq data from ref.47. Genes with FPKM > 5 or <1 at all preimplantation stages were defined as all active or inactive genes, respectively.
H2Aub CUT&RUN analyses in Eed mutants.
Scaling factors for H2Aub CUT&RUN data between control and Eed-CKO and -matKO samples were estimated using the csaw R package (version 1.20)67 as described in previous sections. Allelic H2Aub signals were normalized using the same scaling factors as determined by the non-allelic datasets. Cutoffs of FC > 2 and CPM > 1 were used to define bins with differential enrichment of H2Aub. Bins were considered to overlap with noncanonical imprinting loci if they were located in the promoter regions (TSS ± 2 kb) and gene bodies. The list of noncanonically imprinted loci in preimplantation embryos was obtained from ref.20.
H2Aub and H3K27me3 CUT&RUN analyses in embryos injected with mRNA encoding PR-DUB.
H3K27me3 data from embryos injected with mRNA encoding PR-DUB were normalized using spike-in DNA as described above. H3K27me3 domains on maternal and paternal alleles at the four-cell stage were identified using the custom domain caller, and domains with FC > 3 and CPM > 1 were considered as differentially enriched with H3K27me3.
Genomic interval manipulation.
The GenomicRanges package (version 1.38.0)69 was used to overlap and merge different genomic coordinates. The rtracklayer package (version 1.46.0)68 was used to process genomic tracks in both BED and bigwig formats. The SummarizedExperiment package (version 1.16.1)70 was used to organize different genomic ranges of metadata.
Visualization and statistical analysis.
All statistical analyses were performed using R programming language. The ‘cor’ function was used to calculated Pearson correlation coefficients. The ‘binom.test’ function was used to perform exact binomial tests, and ‘p.adjust’ was used to correct P values for multiple testing. The ggplot2 package (version 3.3.1) (ISBN 978-3-319-24277-4) was used to generate most of the plots. All heatmaps were generated using the ComplexHeatmap package (version 2.2.0)71, except for Figs. 3c and 6f and Extended Data Fig. 3c, which were generated using the EnrichedHeatmap package (version 1.16.0)72. All genomic browser tracks were viewed using the UCSC Genome Browser73.
Public datasets used in this study.
All public ChIP-seq, CUT&RUN and RNA-seq data were processed in a manner similar to that for our own datasets. RNA-seq data used for gene expression analyses at each ChromHMM type were obtained from ref.47. H2Aub, H3K27me3, RING1B and SUZ12 mESC ChIP-seq data were from ref.24. H3K36me3 ESC ChIP-seq data were from ref.49. H3K36me3 ChIP-seq data from early embryos were from ref.48. H3K27me3 ChIP-seq data used for domain-based analyses were from ref.17. Other H3K27me3 ChIP-seq and CUT&RUN data from early embryos were from refs.22,33. RNA-seq data from zygotic, two-cell, four-cell, eight-cell and ICM stages used in Extended Data Fig. 7 were from ref.74. RNA-seq data from the trophectoderm were from ref.17. RNA-seq data from E6.5 embryos were from ref.20, and E16.5 fetal data were from ref.75.
Reporting Summary.
Further information on research design is available in the Nature Research Reporting Summary linked to this article.
Data availability
All sequencing data were deposited in the Gene Expression Omnibus under accession number GSE153531.
Code availability
The custom HMM-based domain caller can be accessed at GitHub (https://github.com/sirusb/HMMDomainCaller).
Extended Data
Extended Data Fig. 1 |. H2Aub dynamics in oocytes and early embryos.
a, Genome browser view of H2Aub profiles in oocytes and early embryos. The H2Aub ChIP-seq data of mESC were obtained from24. b, Bar plots showing the reproducibility of the biological replicates of H2Aub CUT&RUN datasets. The H2Aub enrichment was calculated as reads per kilobase per million reads (RPKM) by 5-kb bin. The Pearson correlation co-efficient are also shown. c, Heatmap with hierarchical clustering showing the correlation of global H2Aub enrichment between oocytes and early embryos. d, Bar plot showing the percentage of genomic regions occupied by H2Aub domains (regions with H2ub signal determined using ChromHMM) at different developmental stages. e, Bar plot showing the percentage of H2Aub CUT&RUN reads that are mapped to each ChromHMM type at different developmental stages.
Extended Data Fig. 2 |. Allelic dynamics of H2Aub in preimplantation development.
a, Genome browser views comparing our sperm H3K27me3 STAR ChIP-seq data with publicly available datasets22,55 b, Venn diagram showing that most H3K27me3 domains identified are common between Zheng et al., and our data. c, Genome browser view showing sperm H2Aub STAR ChIP-seq. d, Scatter plot showing the reproducibility of the biological replicates of H2Aub sperm ChIP-seq datasets. The H2Aub enrichment was calculated as reads per kilobase per million reads (RPKM) by 5-kb bin. The Pearson correlation co-efficient is also shown. e, Bar plot showing the number of allelically biased H2Aub regions at different developmental stages. Maternally (Mat) and paternally (Pat) biased H2Aub regions were identified by merging adjacent allelically biased 5kb bins meeting cutoff: fold change (FC) > 2 and adjusted p-value (p-adj) < 0.01. P values were calculated using a binomial exact test of the null hypothesis that both alleles are equally enriched and adjusted using Benjamin & Hochberg method. f, Box plot showing the expression levels of genes within allelically biased H2Aub regions at 1-cell stage. The number of genes within maternally or paternally biased H2Aub domains at 1-cell were 1113 and 15, respectively. The middle lines in the boxes represent medians. Box hinges indicate the twenty-fifth and seventy-fifth percentiles, the whiskers indicate the hinge ± 1.5 × interquartile range, and the dots represent outliers. RNA-seq data were obtained from47. Mat: maternal allele; Pat: paternal allele. g, Heatmaps showing allelic dynamics of the H2Aub regions that are not allelically biased at 1-cell during preimplantation development. The number of regions for each category are indicated. h, Genome browser view of allelic dynamics of the H2Aub regions that are not allelically biased at 1-cell during preimplantation development.
Extended Data Fig. 3 |. Distinct non-allelic dynamics of H3K27me3 and H2Aub in preimplantation embryos.
a, Genome browser view of H3K27me3, H2Aub and H3K36me348 dynamics in oocytes and preimplantation embryos. b, Venn diagrams showing overlaps of H3K27me3 and H2Aub domains at different developmental stages. The H3K27me3 ChIP-seq data in panels A and B were from17,22. c, Heatmap showing enrichment of H3K27me3, H2Aub, and H3K36me3 at H2Aub domains identified in GV oocytes. The GV H2Aub domains were classified into six groups based on dynamics of these histone modifications during development.
Extended Data Fig. 4 |. Distinct allelic dynamics of H3K27me3 and H2Aub in preimplantation embryos.
a, Genome browser view of allelic H3K27me3 and H2Aub dynamics at the indicated embryonic stages. Note that maternally biased H2Aub at 1-cell becomes equalized at 2-cell stage by gaining H2Aub on the paternal allele. However, H3K27me3 maintains maternally biased from 1-cell to morula stage. The H3K27me3 ChIP-seq/CUT&RUN data were from22,33. M: maternal; P: paternal. b, Genome browser view of allelic H3K27me3 and H2Aub at Jade1 (also known as Phf17) and Sfmbt2 locus. Note that maternal-biased H2Aub is lost at the imprinted loci in 2-cell embryos then regain during later development. In contrast, maternal biased H3K27me3 is maintained from 1-cell to morula stage. c, Box plots showing allelic bias of H2Aub at gene bodies of the 76 putative maternal H3K27me3-dependent imprinted genes. The left panel represents genes showing transient loss and regain of H2Aub allelic bias in early development, whereas the right panel shows genes that loss of H2Aub allelic bias after 2-cell stage. The middle lines in the boxes represent medians. Box hinges indicate the twenty-fifth and seventy-fifth percentiles, the whiskers indicate the hinge ± 1.5 × interquartile range, and the dots show outliers. Mat: maternal; Pat: paternal.
Extended Data Fig. 5 |. Loss of maternal Eed has limited effect on global H2Aub except the maternal H3K27me3-dependent imprinted loci.
a, Relative intensity of the H3K27me3 and H2Aub signal in 1-cell, 2-cell, and 4-cell embryos. For 1-cell embryos, only signals on the maternal pronuclei were measured. The average signal intensity of CTR embryos was set as 1.0. The total number of embryos analyzed were 9 (CTR) and 7 (matKO) for 1-cell embryos, 6 (CTR) and 6 (matKO) for 2-cell embryos, and 7 (CTR) and 8 (matKO) for 4-cell embryos, respectively. Center dot and error bars indicate mean and standard deviation, respectively. matKO: maternal knockout. b, Scatter plots showing the reproducibility between biological replicates of H2Aub CUT&RUN datasets. The H2Aub enrichment was calculated as RPKM in 5-kb bins. The Pearson correlation co-efficient are also shown. CKO: conditional knockout. c, Hierarchical clustering of maternal (M) and paternal (P) alleles of preimplantation embryo and GV oocytes based on their global H2Aub enrichment. d, Genome browser view showing comparable enrichment of H2Aub between CTR and CKO in GV oocytes and between CTR and matKO in preimplantation embryos. e, Genome browser view showing H2Aub enrichment at Gab1 and Sfmbt2 loci in CTR and Eed CKO GV oocytes and matKO morula embryos.
Extended Data Fig. 6 |. Quality control of acute H2Aub depletion and CUT&RUN datasets.
a, Representative zygotes immunostaining images. M: maternal pronucleus; P: paternal pronucleus; h: human; CTR: control; OE: over-expression; PR-DUB: Polycomb repressive deubiquitinase; WT: wild type. scale bar: 20 μm. The quantifications are in panel B) Relative H2Aub signal intensity of zygotes. Only signal on the maternal pronuclei (matPN) was measured. The number of embryos analyzed were 6 for non-injected, 11 for hBAP1 (C91A), 20 for CTR, 10 for hBAP1 (WT), and 22 for OE, respectively. c, Relative H2Aub signal intensity of 2-cell and 4-cell embryos. The number of embryos analyzed were 2 for non-injected 2-cell, 3 for CTR 2-cell, 3 for OE 2-cell, 9 for non-injected 4-cell, 10 for CTR 4-cell, and 9 for OE 4-cell, respectively. For Panel B-C), center dot and error bars indicate mean and standard deviation, respectively. d, Scatter plot comparing H2Aub enrichment between non-injected and CTR 4-cell embryos. Pearson correlation co-efficient is shown. e, Stacked bar plot showing the overlap between the top 1000 bins and RING1B-binding sites identified in mESCs24. f, Box plots showing RING1B signals in mESCs and the H2Aub levels in CTR and OE embryos at rank ordered RING1B-binding sites (n = 8833). The bottom 5 (Bot5%, n = 442), top 5 (Top5%, n = 442), and middle 50 percentile (Mid50%, n = 4416) RING1B sites are indicated. The middle lines in the boxes represent medians. Box hinges indicate the twenty-fifth and seventy-fifth percentiles, the whiskers indicate the hinge ± 1.5 × interquartile range. P-value was calculated by Wilcoxon test (two-sided). g, Bar plots showing reproducibility of the biological replicates of H3K27me3 CUT&RUN datasets. The Pearson correlation co-efficient are shown. h, Genome browser view of H2Aub and H3K27me3 enrichment at the Jade1 and Sfmbt2 loci in 4-cell embryos.
Extended Data Fig. 7 |. The transcriptional effects of H2Aub and H3K27me3 depletion in early embryos.
a, Heatmap showing the correlation between replicates of PR-DUB RNA-seq samples. b, Left panel shows representative immunostaining images of zygotes. M: maternal pronucleus; P: paternal pronucleus; Pb: polar body. scale bar: 20 μm. Right panel shows quantification of the H3K27me3 signal intensity. Only signal on the maternal pronuclei (matPN) was measured. The number of embryos analyzed were 8 for non-injected, 4 for KDM6b (CTR), and 8 for KDM6b (OE), respectively. Center dot and error bars indicate mean and standard deviation, respectively. C) Heatmap showing the correlation between replicates of Kdm6b and Eed RNA-seq samples. d, Scatter plot comparing gene expression levels of KDM6B (CTR) and (OE) 2-cell and 4-cell embryos. fold change (FC) >2, P-value < 0.05, FPKM > 1. e, Scatter plot comparing gene expression levels of Eed (CTR) and (matKO) 2-cell embryos. fold change (FC) >2, P-value < 0.05, FPKM > 1. f, Left panel, heatmaps of the genes up-regulated by H2Aub removal in 2-cell embryos; Right panel, heatmaps showing expression dynamics of the genes on the left panel at different developmental stages. RNA-seq data in right panel were from17,20,74,75. G) Box plots comparing the expression levels of ZGA and maternal decay genes. The middle lines in the boxes represent medians. Box hinges indicate the twenty-fifth and seventy-fifth percentiles, the whiskers indicate the hinge ± 1.5 × interquartile range. The ZGA (n = 3090) and maternal decay (n = 2343) genes were identified by comparing 2-cell and MII oocytes total RNA-seq data (Supplementary Table 1). Genes up- and down- regulated in 2-cell versus MII oocyte were defined as ZGA and maternal decay genes, respectively. fold change > 5, p-value < 0.05, and RPKM > 1.
Supplementary Material
Acknowledgements
We thank C. Zhang and W. Zhang for critical reading of the manuscript. This project was supported by the NIH (R01HD092465) and the HHMI. Y.Z. is an Investigator of the Howard Hughes Medical Institute.
Footnotes
Competing interests
The authors declare no competing interests.
Extended data is available for this paper at https://doi.org/10.1038/s41588-021-00821-2.
Supplementary information The online version contains supplementary material available at https://doi.org/10.1038/s41588-021-00821-2.
References
- 1.de Napoles M et al. Polycomb group proteins Ring1A/B link ubiquitylation of histone H2A to heritable gene silencing and X inactivation. Dev. Cell 7, 663–676 (2004). [DOI] [PubMed] [Google Scholar]
- 2.Wang H et al. Role of histone H2A ubiquitination in Polycomb silencing. Nature 431, 873–878 (2004). [DOI] [PubMed] [Google Scholar]
- 3.Gao Z et al. PCGF homologs, CBX proteins, and RYBP define functionally distinct PRC1 family complexes. Mol. Cell 45, 344–356 (2012). [DOI] [PMC free article] [PubMed] [Google Scholar]
- 4.Tavares L et al. RYBP–PRC1 complexes mediate H2A ubiquitylation at Polycomb target sites independently of PRC2 and H3K27me3. Cell 148, 664–678 (2012). [DOI] [PMC free article] [PubMed] [Google Scholar]
- 5.Yu JR, Lee CH, Oksuz O, Stafford JM & Reinberg D PRC2 is high maintenance. Genes Dev. 33, 903–935 (2019). [DOI] [PMC free article] [PubMed] [Google Scholar]
- 6.Blackledge NP, Rose NR & Klose RJ Targeting Polycomb systems to regulate gene expression: modifications to a complex story. Nat. Rev. Mol. Cell Biol 16, 643–649 (2015). [DOI] [PMC free article] [PubMed] [Google Scholar]
- 7.Cao R et al. Role of histone H3 lysine 27 methylation in Polycomb-group silencing. Science 298, 1039–1043 (2002). [DOI] [PubMed] [Google Scholar]
- 8.Min J, Zhang Y & Xu RM Structural basis for specific binding of Polycomb chromodomain to histone H3 methylated at Lys 27. Genes Dev. 17, 1823–1828 (2003). [DOI] [PMC free article] [PubMed] [Google Scholar]
- 9.Wang L et al. Hierarchical recruitment of Polycomb group silencing complexes. Mol. Cell 14, 637–646 (2004). [DOI] [PubMed] [Google Scholar]
- 10.Blackledge NP et al. Variant PRC1 complex-dependent H2A ubiquitylation drives PRC2 recruitment and Polycomb domain formation. Cell 157, 1445–1459 (2014). [DOI] [PMC free article] [PubMed] [Google Scholar]
- 11.Cooper S et al. Targeting Polycomb to pericentric heterochromatin in embryonic stem cells reveals a role for H2AK119u1 in PRC2 recruitment. Cell Rep. 7, 1456–1470 (2014). [DOI] [PMC free article] [PubMed] [Google Scholar]
- 12.Cooper S et al. Jarid2 binds mono-ubiquitylated H2A lysine 119 to mediate crosstalk between Polycomb complexes PRC1 and PRC2. Nat. Commun 7, 13661 (2016). [DOI] [PMC free article] [PubMed] [Google Scholar]
- 13.Kalb R et al. Histone H2A monoubiquitination promotes histone H3 methylation in Polycomb repression. Nat. Struct. Mol. Biol 21, 569–571 (2014). [DOI] [PubMed] [Google Scholar]
- 14.Laugesen A, Hojfeldt JW & Helin K Molecular mechanisms directing PRC2 recruitment and H3K27 methylation. Mol. Cell 74, 8–18 (2019). [DOI] [PMC free article] [PubMed] [Google Scholar]
- 15.Cohen I, Bar C & Ezhkova E Activity of PRC1 and histone H2AK119 monoubiquitination: revising popular misconceptions. Bioessays 42, e1900192 (2020). [DOI] [PMC free article] [PubMed] [Google Scholar]
- 16.Dahl JA et al. Broad histone H3K4me3 domains in mouse oocytes modulate maternal-to-zygotic transition. Nature 537, 548–552 (2016). [DOI] [PMC free article] [PubMed] [Google Scholar]
- 17.Liu X et al. Distinct features of H3K4me3 and H3K27me3 chromatin domains in pre-implantation embryos. Nature 537, 558–562 (2016). [DOI] [PubMed] [Google Scholar]
- 18.Zhang B et al. Allelic reprogramming of the histone modification H3K4me3 in early mammalian development. Nature 537, 553–557 (2016). [DOI] [PubMed] [Google Scholar]
- 19.Inoue A, Jiang L, Lu F & Zhang Y Genomic imprinting of Xist by maternal H3K27me3. Genes Dev. 31, 1927–1932 (2017). [DOI] [PMC free article] [PubMed] [Google Scholar]
- 20.Inoue A, Jiang L, Lu F, Suzuki T & Zhang Y Maternal H3K27me3 controls DNA methylation-independent imprinting. Nature 547, 419–424 (2017). [DOI] [PMC free article] [PubMed] [Google Scholar]
- 21.Chen Z & Zhang Y Maternal H3K27me3-dependent autosomal and X chromosome imprinting. Nat. Rev. Genet 22, 555–571 (2020). [DOI] [PMC free article] [PubMed] [Google Scholar]
- 22.Zheng H et al. Resetting epigenetic memory by reprogramming of histone modifications in mammals. Mol. Cell 63, 1066–1079 (2016). [DOI] [PubMed] [Google Scholar]
- 23.Skene PJ & Henikoff S An efficient targeted nuclease strategy for high-resolution mapping of DNA binding sites. eLife 6, e21856 (2017). [DOI] [PMC free article] [PubMed] [Google Scholar]
- 24.Fursova NA et al. Synergy between variant PRC1 complexes defines Polycomb-mediated gene repression. Mol. Cell 74, 1020–1036 (2019). [DOI] [PMC free article] [PubMed] [Google Scholar]
- 25.Ernst J & Kellis M ChromHMM: automating chromatin-state discovery and characterization. Nat. Methods 9, 215–216 (2012). [DOI] [PMC free article] [PubMed] [Google Scholar]
- 26.Blackledge NP et al. PRC1 catalytic activity is central to Polycomb system function. Mol. Cell 77, 857–874 (2020). [DOI] [PMC free article] [PubMed] [Google Scholar]
- 27.Tamburri S et al. Histone H2AK119 mono-ubiquitination is essential for Polycomb-mediated transcriptional repression. Mol. Cell 77, 840–856 (2020). [DOI] [PMC free article] [PubMed] [Google Scholar]
- 28.Schmitges FW et al. Histone methylation by PRC2 is inhibited by active chromatin marks. Mol. Cell 42, 330–341 (2011). [DOI] [PubMed] [Google Scholar]
- 29.Yuan W et al. H3K36 methylation antagonizes PRC2-mediated H3K27 methylation. J. Biol. Chem 286, 7983–7989 (2011). [DOI] [PMC free article] [PubMed] [Google Scholar]
- 30.Yuan G et al. Histone H2A ubiquitination inhibits the enzymatic activity of H3 lysine 36 methyltransferases. J. Biol. Chem 288, 30832–30842 (2013). [DOI] [PMC free article] [PubMed] [Google Scholar]
- 31.Matoba S et al. Loss of H3K27me3 imprinting in somatic cell nuclear transfer embryos disrupts post-implantation development. Cell Stem Cell 23, 343–354 (2018). [DOI] [PMC free article] [PubMed] [Google Scholar]
- 32.Borensztein M et al. Xist-dependent imprinted X inactivation and the early developmental consequences of its failure. Nat. Struct. Mol. Biol 24, 226–233 (2017). [DOI] [PMC free article] [PubMed] [Google Scholar]
- 33.Inoue A, Chen Z, Yin Q & Zhang Y Maternal Eed knockout causes loss of H3K27me3 imprinting and random X inactivation in the extraembryonic cells. Genes Dev. 32, 1525–1536 (2018). [DOI] [PMC free article] [PubMed] [Google Scholar]
- 34.Chen Z, Yin Q, Inoue A, Zhang C & Zhang Y Allelic H3K27me3 to allelic DNA methylation switch maintains noncanonical imprinting in extraembryonic cells. Sci. Adv 5, eaay7246 (2019). [DOI] [PMC free article] [PubMed] [Google Scholar]
- 35.Almeida M et al. PCGF3/5-PRC1 initiates Polycomb recruitment in X chromosome inactivation. Science 356, 1081–1084 (2017). [DOI] [PMC free article] [PubMed] [Google Scholar]
- 36.Posfai E et al. Polycomb function during oogenesis is required for mouse embryonic development. Genes Dev. 26, 920–932 (2012). [DOI] [PMC free article] [PubMed] [Google Scholar]
- 37.Scheuermann JC et al. Histone H2A deubiquitinase activity of the Polycomb repressive complex PR-DUB. Nature 465, 243–247 (2010). [DOI] [PMC free article] [PubMed] [Google Scholar]
- 38.Balasubramani A et al. Cancer-associated ASXL1 mutations may act as gain-of-function mutations of the ASXL1–BAP1 complex. Nat. Commun 6, 7307 (2015). [DOI] [PMC free article] [PubMed] [Google Scholar]
- 39.Sahtoe DD, van Dijk WJ, Ekkebus R, Ovaa H & Sixma TK BAP1/ASXL1 recruitment and activation for H2A deubiquitination. Nat. Commun 7, 10292 (2016). [DOI] [PMC free article] [PubMed] [Google Scholar]
- 40.Dobrinić P, Szczurek A & Klose R PRC1 drives Polycomb-mediated gene repression by controlling transcription initiation and burst frequency. Preprint at bioRxiv 10.1101/2020.10.09.333294 (2020). [DOI] [PMC free article] [PubMed] [Google Scholar]
- 41.Harris C et al. Conversion of random X-inactivation to imprinted X-inactivation by maternal PRC2. eLife 8, e44258 (2019). [DOI] [PMC free article] [PubMed] [Google Scholar]
- 42.Cohen I et al. PRC1 fine-tunes gene repression and activation to safeguard skin development and stem cell specification. Cell Stem Cell 22, 726–739 (2018). [DOI] [PMC free article] [PubMed] [Google Scholar]
- 43.Du Z et al. Polycomb group proteins regulate chromatin architecture in mouse oocytes and early embryos. Mol. Cell 77, 825–839 (2019). [DOI] [PubMed] [Google Scholar]
- 44.Prokopuk L et al. Loss of maternal EED results in postnatal overgrowth. Clin. Epigenetics 10, 95 (2018). [DOI] [PMC free article] [PubMed] [Google Scholar]
- 45.Zenk F et al. Germ line-inherited H3K27me3 restricts enhancer function during maternal-to-zygotic transition. Science 357, 212–216 (2017). [DOI] [PubMed] [Google Scholar]
- 46.Xia W et al. Resetting histone modifications during human parental-to-zygotic transition. Science 365, 353–360 (2019). [DOI] [PubMed] [Google Scholar]
- 47.Wang C et al. Reprogramming of H3K9me3-dependent heterochromatin during mammalian embryo development. Nat. Cell Biol 20, 620–631 (2018). [DOI] [PubMed] [Google Scholar]
- 48.Xu Q et al. SETD2 regulates the maternal epigenome, genomic imprinting and embryonic development. Nat. Genet 51, 844–856 (2019). [DOI] [PubMed] [Google Scholar]
- 49.Weinberg DN et al. The histone mark H3K36me2 recruits DNMT3A and shapes the intergenic DNA methylation landscape. Nature 573, 281–286 (2019). [DOI] [PMC free article] [PubMed] [Google Scholar]
- 50.Zhang C et al. The chromatin remodeler Snf2h is essential for oocyte meiotic cell cycle progression. Genes Dev. 34, 166–178 (2020). [DOI] [PMC free article] [PubMed] [Google Scholar]
- 51.Chen Z & Zhang Y Loss of DUX causes minor defects in zygotic genome activation and is compatible with mouse development. Nat. Genet 51, 947–951 (2019). [DOI] [PMC free article] [PubMed] [Google Scholar]
- 52.Lu F et al. Establishing chromatin regulatory landscape during mouse preimplantation development. Cell 165, 1375–1388 (2016). [DOI] [PMC free article] [PubMed] [Google Scholar]
- 53.Sugimoto M et al. A simple and robust method for establishing homogeneous mouse epiblast stem cell lines by Wnt inhibition. Stem Cell Rep. 4, 744–757 (2015). [DOI] [PMC free article] [PubMed] [Google Scholar]
- 54.Inoue A & Zhang Y Nucleosome assembly is required for nuclear pore complex assembly in mouse zygotes. Nat. Struct. Mol. Biol 21, 609–616 (2014). [DOI] [PMC free article] [PubMed] [Google Scholar]
- 55.Erkek S et al. Molecular determinants of nucleosome retention at CpG-rich sequences in mouse spermatozoa. Nat. Struct. Mol. Biol 20, 868–875 (2013). [DOI] [PubMed] [Google Scholar]
- 56.Langmead B, Trapnell C, Pop M & Salzberg SL Ultrafast and memory-efficient alignment of short DNA sequences to the human genome. Genome Biol. 10, R25 (2009). [DOI] [PMC free article] [PubMed] [Google Scholar]
- 57.Tarasov A, Vilella AJ, Cuppen E, Nijman IJ & Prins P Sambamba: fast processing of NGS alignment formats. Bioinformatics 31, 2032–2034 (2015). [DOI] [PMC free article] [PubMed] [Google Scholar]
- 58.Krueger F & Andrews SR SNPsplit: allele-specific splitting of alignments between genomes with known SNP genotypes. F1000Res 5, 1479 (2016). [DOI] [PMC free article] [PubMed] [Google Scholar]
- 59.Ramirez F, Dundar F, Diehl S, Gruning BA & Manke T deepTools: a flexible platform for exploring deep-sequencing data. Nucleic Acids Res. 42, W187–W191 (2014). [DOI] [PMC free article] [PubMed] [Google Scholar]
- 60.Meers MP, Bryson TD, Henikoff JG & Henikoff S Improved CUT&RUN chromatin profiling tools. eLife 8, e46314 (2019). [DOI] [PMC free article] [PubMed] [Google Scholar]
- 61.Kim D, Langmead B & Salzberg SL HISAT: a fast spliced aligner with low memory requirements. Nat. Methods 12, 357–360 (2015). [DOI] [PMC free article] [PubMed] [Google Scholar]
- 62.Pertea M et al. StringTie enables improved reconstruction of a transcriptome from RNA-seq reads. Nat. Biotechnol 33, 290–295 (2015). [DOI] [PMC free article] [PubMed] [Google Scholar]
- 63.Jin Y, Tam OH, Paniagua E & Hammell M TEtranscripts: a package for including transposable elements in differential expression analysis of RNA-seq datasets. Bioinformatics 31, 3593–3599 (2015). [DOI] [PMC free article] [PubMed] [Google Scholar]
- 64.Anders S & Huber W Differential expression analysis for sequence count data. Genome Biol. 11, R106 (2010). [DOI] [PMC free article] [PubMed] [Google Scholar]
- 65.Yu G, Wang LG, Han Y & He QY clusterProfiler: an R package for comparing biological themes among gene clusters. OMICS 16, 284–287 (2012). [DOI] [PMC free article] [PubMed] [Google Scholar]
- 66.Connell J & Højsgaard S Hidden semi Markov models for multiple observation sequences: the mhsmm package for R. J. Stat. Softw 39, 1–22 (2011). [Google Scholar]
- 67.Lun AT & Smyth GK csaw: a Bioconductor package for differential binding analysis of ChIP-seq data using sliding windows. Nucleic Acids Res. 44, e45 (2016). [DOI] [PMC free article] [PubMed] [Google Scholar]
- 68.Lawrence M, Gentleman R & Carey V rtracklayer: an R package for interfacing with genome browsers. Bioinformatics 25, 1841–1842 (2009). [DOI] [PMC free article] [PubMed] [Google Scholar]
- 69.Lawrence M et al. Software for computing and annotating genomic ranges. PLoS Comput. Biol 9, e1003118 (2013). [DOI] [PMC free article] [PubMed] [Google Scholar]
- 70.Huber W et al. Orchestrating high-throughput genomic analysis with Bioconductor. Nat. Methods 12, 115–121 (2015). [DOI] [PMC free article] [PubMed] [Google Scholar]
- 71.Gu Z, Eils R & Schlesner M Complex heatmaps reveal patterns and correlations in multidimensional genomic data. Bioinformatics 32, 2847–2849 (2016). [DOI] [PubMed] [Google Scholar]
- 72.Gu Z, Eils R, Schlesner M & Ishaque N EnrichedHeatmap: an R/Bioconductor package for comprehensive visualization of genomic signal associations. BMC Genomics 19, 234 (2018). [DOI] [PMC free article] [PubMed] [Google Scholar]
- 73.Kent WJ et al. The human genome browser at UCSC. Genome Res. 12, 996–1006 (2002). [DOI] [PMC free article] [PubMed] [Google Scholar]
- 74.Wu J et al. The landscape of accessible chromatin in mammalian preimplantation embryos. Nature 534, 652–657 (2016). [DOI] [PubMed] [Google Scholar]
- 75.Andergassen D et al. Mapping the mouse Allelome reveals tissue-specific regulation of allelic expression. eLife 6, e25125 (2017). [DOI] [PMC free article] [PubMed] [Google Scholar]
Associated Data
This section collects any data citations, data availability statements, or supplementary materials included in this article.
Supplementary Materials
Data Availability Statement
All sequencing data were deposited in the Gene Expression Omnibus under accession number GSE153531.