

Abstract
Accurate sequence characterization is essential for the development of therapeutic antibodies by the pharmaceutical industry. Presented here is a methodology to obtain comprehensive sequence analysis of a monoclonal antibody. An enzyme reactor of immobilized Aspergillopepsin I, a highly stable nonspecific protease, was used to cleave reduced antibody subunits into a peptide profile ranging from 1 to 20 kDa. Utilizing the Thermo Orbitrap Fusion’s unique instrument architecture combined with state-of-the-art instrument control software allowed for dynamic instrument methods that optimally characterize eluting peptides based on their size and charge density. Using a data-dependent instrument method, both collisional dissociation and electron transfer dissociation were used to fragment the appropriate charge state of analyte peptides. The instrument layout also allowed for scans to be taken in parallel using both the ion trap and Orbitrap concurrently, thus allowing larger peptides to be analyzed in high resolution using the Orbitrap while simultaneously analyzing tryptic-like peptides using the ion trap. We harnessed these capabilities to develop a custom method to optimally fragment the eluting peptides based on their mass and charge density. Using this approach, we obtained 100% sequence coverage of the total antibody in a single chromatographic analysis, enabling unambiguous sequence assignment of all residues.
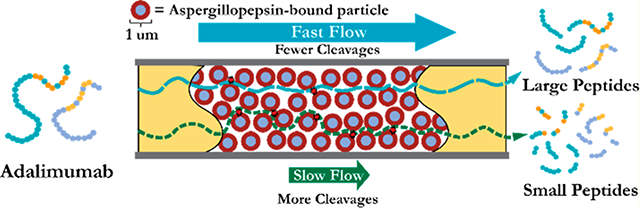
Graphical Abstract
Monoclonal antibodies (mAbs) are on the rise as a therapeutic drug.1 In the year 2017 alone, ten antibodies were approved by the FDA as a Novel Drug.2 These mAbs represent a treatment for a wide variety of targets, such as autoimmune diseases to cancers.3–5 The advent of this therapeutic modality has driven the need to fully characterize mAbs.6–12 However, mAbs prove much more challenging to characterize than small-molecule drugs.
Monoclonal antibodies are large protein structures composed of two sets of identical light chains and heavy chains each weighing ~25 and ~50 kDa, respectively, to give a total molecular weight of ~150 kDa intact (Figure 1).13 These chains are interconnected by a network of disulfide bonds both inter- and intrachain to preserve the tertiary structure of the molecule.13 Functionally, antibodies can be segmented into two major regions. The fragment antigen binding region, or Fab, acts to bind to the target epitope with a high affinity.13 Each antibody chain’s Fab subunit contains three complementarity determining regions (CDRs) which are the primary determinants of the antibody’s affinity to the target.13 The CDRs exhibit a high degree of sequence diversity relative to other regions of the protein and are pharmaceutically relevant as modifications to this region can dramatically impact antibody binding affinity and therefore clinical efficacy.13–16
Figure 1.

Structure of an IgG monoclonal antibody.
The fragment crystallizable region (Fc) of the antibody serves the function of binding various Fcγ receptors to stimulate immune cell killing.17 Additionally, Fc pentamerization of IgG antibodies has been implicated in complement activation.18 Similarly to the CDRs, modifications to this region of the antibody have been shown to decrease the antibody’s affinity to these receptors, inhibiting the activation of the effector functions.19 The loss or modification of Fc glycan trees has been shown to both inhibit Fc receptor activation as well as significantly impact circulating antibody half-life.20,21 As such, characterization of potential modifications to these portions of the antibody is also of significant interest.
Mass spectrometry has proven to be a powerful tool for determining the primary structure of proteins. The conventional approach is to digest the protein with a specific protease, typically trypsin, to generate a mixture of peptides that are further separated by reversed-phase liquid chromatography.22–26 Once analyzed, the peptide pieces are stitched back together to give the primary structure. However, single protease digestions are often limited by incomplete sequence mapping by observed peptides, lack of overlapping peptides, and prolonged sample preparations.27 Additional digestions with different specific proteases are necessary to unambiguously determine the primary structure of the antibody and, as a result, require multiple instrument analyses.28–30
An increasingly prevalent alternative in the mass spectrometry field is analyzing proteins with no enzymatic digestion.31–36 This method is extremely beneficial for determining the molecular weight of a given species with minimal sample handling.37,38 When fragmenting an intact protein, however, determination of the complete primary structure is extremely difficult.39,40 As protein size increases, the number of potential fragment ions and their corresponding isotopes increases. Consequently, each individual fragment ion represents a much smaller proportion of the ions generated during fragmentation, decreasing signal-to-noise and making assignment of all ions significantly more difficult. Further, as the charge state being fragmented increases, the number of ions undergoing fragmentation in a given scan decreases because the ion trap target is determined by the total number of charges rather than individual molecules.41 Given these limitations, digesting a sample into larger, more manageable peptides presents an attractive alternative for unambiguously characterizing the sequence of particularly large proteins like antibodies.
Previous efforts have led to the development of an immobilized Aspergillopepsin I enzyme reactor for antibody sequence analysis.42 This nonspecific protease has several unique capabilities for enzyme digestion; particularly, it is functional in 8 M urea and acidic solutions for roughly 1 h. Resulting digestions are highly reproducible despite the protease’s nonspecific cleavage specificity. Digestions within the reactor produce a diverse array of peptide sizes; the peptide size distribution is further tunable based on the flow rate through the reactor. The generation of these digests is achievable after mere seconds within the reactor to create a sample ready for LC-MS analysis in under 3 h, allowing for a rapid sample preparation protocol. Further, the resulting peptide mixture also creates overlapping peptide coverage throughout the antibody, eliminating the need for digestion with additional enzymes. In our previously implemented methodology,42 instrumental limitations in performing on-the-fly analysis of larger peptides required the use of 3 LC-MS analyses to optimally fragment a limited subset of peptides, generating significant but incomplete fragment ion assignment. As a result, while the presence of amino acids could be mapped back to peptides, their order could not be definitively assigned because of missing fragment ions. Further, the use of multiple LC-MS analyses restricted the benefit to analysis time from only requiring a single digestion.
Reported here are improvements to this methodology both in terms of sample preparation and mass spectrometric analysis. Modifications to the enzyme reactor have improved the efficiency with which large peptide fragments are generated. Coupling this improved peptide digestion efficiency to the mass spectrometric advancements of the Thermo Orbitrap Fusion Tribrid mass spectrometer allows for both more rapid and comprehensive sample analysis compared to previous iterations of this technology.43 This improved platform is capable of rapid sample preparation and analysis followed by unambiguous sequence mapping of a mAb within a single analysis.
EXPERIMENTAL PROCEDURES
Reagents.
Aspergillopepsin I, equine apomyoglobin, tris(2-carboxyethyl)phosphine hydrochloride (TCEP), N-(2-aminoethyl)maleimide trifluoroacetate salt (NAEM), and sodium cyanoborohydride were purchased from Sigma-Aldrich. Twenty μm aldeyhye beads were purchased from POROS. One μm aldehyde/sulfate latex beads were purchased from Invitrogen. IdeS (FabRICATOR) was purchased from Genovis.
Sample Preparation.
Detailed experimental protocols are discussed in the Supporting Information. Briefly, apomyoglobin samples were reconstituted in digestion buffer (8 M urea in 50 mM ammonium acetate buffer pH 3.9) at a concentration of 0.2 μg/μL prior to digestion on the enzyme reactor. For antibody preparation, 100 μg of adalimumab was first digested using the enzyme IdeS. This enzyme specifically cleaves below the interheavy chain disulfide bonds to yield F(ab’)2 and Fc/2 fragments of ~100 and ~25 kDa, respectively.44 The disulfides were subsequently reduced with TCEP and cysteines were then alkylated using NAEM, both in 8 M urea. The combination of IdeS digestion and reduction separates the F(ab’)2 into separate light chains and heavy chain Fd’s, also ~25 kDa in size, such that all digestion products are roughly equal in size. Further, NAEM alkylation adds extra basic moieties to the molecule through the addition of an amino group, improving the charge density of the proteins. Finally, the sample was diluted to reach a final concentration of 0.2 μg/uL in what is primarily digestion buffer.
Enzyme Reactor Assembly.
Surface conjugation of 20 μm beads was performed as previously described.42 A new scaffold was also evaluated in order to improve the performance of the reactor. Rather than using the POROS beads previously reported, the new scaffold makes use of 1 μm aldehyde/sulfate particles. Unlike the POROS beads, these are both significantly smaller in size and nonporous. The sulfate functionality likely has little effect on the procedure as it primarily serves to prevent the beads from clumping to one another, and the general surface properties are very similar as both sets of particles are polystyrene based. Conjugation of nonporous 1 μm beads follows a very similar protocol with a few minor modification. Next ~10 μg of beads was conjugated in a given lot, increased from 7 μg in the previous preparation. Consequently, the concentration of sodium cyanoborohydride was increased to 1.5 μg/μL in order to compensate for the additional bead mass. Washing the beads also utilized centrifugation rather than the spin columns reported previously as these particles were small enough that they could pass through the filter.
Enzyme Reactor Digestion.
In order to evaluate the improved digestion performance when using 1 μm nonporous beads, a ~ 0.7 s digestion was performed on 20 μm beads for comparison. Several digestions were then performed on the 1 μm beads to find analogous digestion conditions. Stated simply, once apomyoglobin samples were reconstituted in digestion buffer, they were immediately passed through either a 2 cm packed bed of the 20 μm particles or a 2 mm bed of the 1 μm particles. The major difference in bed length is the result of significantly increased back pressure resulting from the large decrease in particle size. However, the digestion times may be reasonably compared by comparing the calculated residence time of the protein within the reactor chamber. Digestion times were calculated similarly to our previous report with modifications discussed in Supporting Information 1b.
Following the evaluation of the new platform, an originator sample of adalimumab at 0.2 μg/μL in digestion buffer was digested using the 1 μm bead reactor with a digestion time of ~0.9 s in order to perform sequence characterization. The sample was subsequently subjected to LC-MS analysis without further processing.
Chromatography and Mass Spectrometry.
Apomyoglobin digestions used to evaluate the new enzyme reactor platform were analyzed on an Agilent Technologies (Palo Alto, CA) 1100 Series binary HPLC system coupled to a Thermo Scientific LTQ Orbitrap hybrid mass spectrometer (San Jose, CA) using 0.3% formic acid as solvent A and 72% ACN, 18% IPA, 10% water, 0.3% formic acid as solvent B. Approximately 1 picomole of each digest was pressure-loaded onto a 360 μm × 150 μm fused silica preparatory column packed with 10 cm of 3 μm diameter, 1000 Å PLRP-s packing material (Polymer Laboratories). Solvent A was passed through the column for 30 min, and it was subsequently connected to a 360 μm × 75 μm fused silica analytical column with an integrated nanoelectrospray tip. The analytical column was packed to 10 cm with the same packing material as the preparatory column. Peptides were then gradient eluted with a gradient of 0–25–55–100% solvent B in 0–5–35–40 min at a flow rate of ~100 nL/min. Peptides were identified with a top 3 data-dependent method performing 20 ms electron transfer dissociation (ETD) and analyzing fragment ions at 60 000 resolution.
For antibody characterization, the HPLC system was coupled to a Thermo ScientificOrbitrap Fusion tribrid mass spectrometer. Approximately 600 femtomoles of the antibody digest were pressure-loaded onto a 360 μm × 75 μm fused silica analytical column packed with 10 cm of 3 μm diameter, 1000 Å PLRP-s packing material. The column included an integrated nanonelectrospary emitter tip 5 cm from the end of the packing material to leave room to attach the heater. Prior to analysis, the column was rinsed with solvent A for about approximately 1 h for desalting. Peptides were then eluted using the gradient 0–25–50–100% solvent B in 0–5–80–85 min while heated to 50 °C with a Phoenix S&T 15 cm pencil column heater and flowing at ~100 nL/min.
In conjunction with the advanced instrument manipulation enabled by the method builder software (version 2.1565.2) available on the Thermo Fusion, data dependent acquisition of eluting peptides was performed. In short, a tiered decision tree was developed to optimize fragmentation of various species based on size (Figure 2). Following a 60 000 resolution Orbitrap MS1 scan, ions were fragmented using the top speed function over three seconds. MS2 prioritization and analysis parameters were both determined dynamically based on the charge state and m/z of the various precursors. Peptides were fragmented based on their m/z and charge state while using both electron transfer dissociation (ETD) and collisional activation based on optimal charge densities. Additional instrument parameters can be found in the Supporting Information 1c.
Figure 2.

Schematic representation of the decision tree method used for antibody sequence analysis in this study.
Highest priority precursors were required to either appear at charge states ≥10 and between 500 and 925 m/z or charge states ≥8 and between 1100 and 1500 m/z for ETD and higher-energy collisional dissociation (HCD), respectively. Both scan types were performed at 120 000 resolution at targets of 1e6 with one additional microscan. ETD fragmentation was performed with the instrument calibrated charge-state dependent ETD times and calibrated reagent target while HCD fragmentation was performed with stepped collision energy at 22–25–28% normalized collision energy (NCE). Second priority were medium-sized precursors between charge states 5–9 and between m/z 300–925 for ETD or between charge states 4–7 for HCD. These were analyzed at 60 000 resolution at an AGC target of 4e5. Fragmentation conditions were the same as the first category.
Small, tryptic-like peptides were analyzed at lowest priority; however, analysis was conducted in the ion-trap to facilitate better instrument multiplexing with the other fragmentation conditions. These peptides consisted of charge states 3–5 for ETD and 2–4 for ion trap collisionally activated dissociation (CAD). Both fragmentation types were analyzed at normal scan speed in the linear ion trap using an AGC target of 2e4. ETD fragmentation similarly used charge-dependent ETD times, and CAD fragmentation used 30% NCE for 10 ms. All ETD fragmentation events used in this method made use of the high-capacity ETD injection scheme to fragment more total ions in a given scan and improve fragment ion signal-to-noise. Additionally, each analysis category, both size prioritization and fragmentation type, made use of a different dynamic exclusion list to optimize the number of precursors that were subjected to both fragmentation types.
Data Analysis.
For peptide assignments of each digest, the resulting data file was searched against a database including only the protein being sequenced using Byonic version 2.16.16 (Protein Metrics). While the apomyoglobin data files were assigned with the standalone Byonic program, the adalimumab data file was searched in Proteome Discover version 2.2.0.386 (Thermo Scientific) using the Byonic search node. As standard searches in Byonic cannot contain both mixed analyzer times and mixed data sets, the Orbitrap and ion trap scans were separated into two different searches. Both searches used a 1% FDR to filter identified peptides. Detailed search parameters are presented in the Supporting Information.
Following automated assignment, a subset of peptides identified in the adalimumab data set were selected for further manual inspection. This subset was selected based on both their score output from the Byonic search as well as their notated sequence coverage within the Byonic viewer. To annotate spectra, all MS2 spectra taken under each respective peak were averaged in Qual Browser 4.0.27.10 and peaks within the averaged spectrum were then assigned manually.
RESULTS AND DISCUSSION
Improved Reactor Performance from Smaller Particle Size.
Our previously reported iteration of the Aspergillopepsin I enzyme reactor42 was sufficient to provide a proof-of-concept design. However, the reactor was prone to generating a heterogeneous size profile which can be mitigated by modifying the scaffold used to immobilize the enzyme. The original iteration used 20 μm porous spheres, but transitioning to smaller, 1 μm solid microspheres offers two major performance improvements. First, the smaller particle size reduced Eddy diffusion (or multipath diffusion), similarly to the effect in chromatography.45 This reduces the variance in path length of peptides passing through the column, narrowing the distribution of individual peptides’ residence time in the reactor.46,47 Second, the lack of pores eliminates pore diffusion from influencing the reactor kinetics, improving both the observed kinetics, and the consistency of the number of cleavages present in each molecule.48–50 By eliminating the variability in time spent inside the porous matrix rather than the bulk solution, the propensity is reduced for some peptides to undergo a greater number of cleavages than average. One side effect of this transition is the need to modify the bed length. The previous iteration of our enzyme reactor works effectively with 1–2 cm packed beds for short (~0.9 s) digestion times, but the increased backpressure associated with moving to a smaller bead size necessitates transitioning to shorter packed beds, in this case ~2 mm, to maintain necessary flow rates. Fortunately, by adjusting the residence time through the column, the same degree of precursor consumption can be maintained on these dramatically shorter beds.
In order to demonstrate the improvement, equine apomyoglobin was digested by the enzyme reactor using 20 μm beds for ~0.7 s. For comparison, several different digestion times were performed on the 1 μm beds to evaluate which digestion time consumes the most similar amount of starting material. A ~0.5 s digestion with the 1 μm bed shows the closest agreement in terms of intact protein consumption compared to the ~0.7 s digestion. A comparison of the chromatograms for these digestions is shown in Figure 3. Note the corresponding increase in large peptides and decrease in smaller peptides in the 1 μm digestion. To illustrate the improvement in first generation fragments, the ratios of relative abundances of several abundant peptides from the 1 and 20 μm digestions are shown in Figure 4. Significantly, despite very similar intact protein abundances, the 1 μm reactor shows a marked increase in the generation of large, single-cleavage peptides and a decrease in peptides which contain multiple cleavages relative to the 20 μm digestion. This clearly illustrates the ability of the new particles to improve the generation of large peptides at these shorter digestion times.
Figure 3.

Total ion chromatograms of apomyoglobin digestions ~0.5 s digestion on 1 μm beads (top) and on ~0.7 s digestion on 20 μm beads (bottom).
Figure 4.

Comparison of peptide abundances between 20 and 1 μm digestions. The peptides are plotted as the abundance in the 1 μm digestion relative to the abundance in the 20 μm digestion with the intact noted as dotted line. Large peptide increase in abundance while smaller peptides decrease.
Complete Sequence Analysis of a Monoclonal Antibody.
Previous work using this enzyme reactor achieved respectable sequence coverage of murine IgG1 using three separate HPLC/MS experiments to obtain fragmentation data of 39 peptides spanning the length of the antibody.42 This was necessary as older iterations of instrument control software lacked the capability to efficiently select the ideal charge-state candidates for both CAD and ETD. For a typical data-dependent MS/MS experiment selecting the most abundant peaks for fragmentation, the wide variety of charge states for larger peptides can lead to the selection of suboptimal charge states for either of these two techniques as well as oversampling of abundant species, missing the lower level peptides in the sample.
As such, the methodology used a first experiment to screen the digestion time for the most abundance peptides, a second experiment to obtain ETD MS/MS data for the 39 targeted peptides, and a third experiment to obtain CAD MS/MS data for the same peptides.42 However, by leveraging the powerful instrument control software available of the Thermo Orbitrap Fusion, these three experiments may be condensed into a single data-dependent experiment. The instrument control software allows the construction of decision trees in order to build more elaborate methods and to more easily file precursors into different categories for analysis. This capability allows on-the-fly selection of analysis parameters (e.g., analyzer type and ion target) in order to minimize the cycle time losses based on precursor size. Moreover, the innovative tribrid instrument design enables efficient multiplexing between mass analyzers such that small, tryptic-like peptides can be analyzed in the ion trap in parallel with high resolution analysis of much larger peptides.
To illustrate the utility of this technology, an enzyme reactor digestion of adalimumab was performed on the newest iteration of the enzyme reactor and analyzed by a tiered decision tree on a Thermo Orbitrap Fusion. A ~0.9 s digestion was selected because it generated a wide variety of peptide sizes and superior precursor consumption than the previously illustrated ~0.5 s digestion while still preserving the generation of large peptides. The total ion chromatogram for this digestion following LC separation is illustrated in Figure 5. Using the method builder provided with the Thermo Fusion Orbitrap, a data dependent method was created to determine how an eluting peptide was fragmented. ETD was exclusively performed on peptides with mass-to-charge ratios of less than 925 in order to maximize instrument time, as precursors with charge densities much lower than that will generally fragment poorly by ETD.51–54 Searching this data set with Byonic revealed that over 700 unique peptides were identified in the analysis at a 1% false discovery rate.
Figure 5.

Total ion chromatogram of ~0.9 s digestion of adalimumab on 1 μm enzyme reactor.
From the total pool of identified peptides, a subset which spanned the full length of the protein was selected for manual annotation as show in Figure 6. These peptides were selected on the basis of their confidence within Byonic, their reported sequence coverage in the Byonic viewer, and their general overlap over the length of the protein. One key advantage of this approach is that due to the plethora of available peptide fragments identified due to the nonspecificity of the enzyme, multiple peptide series may be selected which cover the span of the antibody. Further, if a given peptide does not effectively generate fragment ions over a portion of the sequence, often an overlapping peptide will be also be generated which effectively forms diagnostic fragment ions for that portion of the sequence. In total, 10 light chain peptides, 14 heavy chain Fd’ peptides, and 16 heavy chain Fc/2 peptides were selected for manual inspection. In terms of number of identified peptides, these 40 peptides represent merely ~5.5% of the identified peptide pool.
Figure 6.

Map of peptides used to generate fragment ion maps for the adalimumab light chain (top), heavy chain Fd’ (middle), and heavy chain Fc/2 (bottom).
The superimposed sequence coverage of these peptides is illustrated in Figure 7. Diagnostic fragments ions for nearly all bond cleavages are present in at least one peptide. The only bond not covered by a fragment ion is the K151-D152 bond on the heavy chain Fd’. This bond appears to be a highly preferred cleavage for Aspergillopepsin I, leading to all peptides in that region either possessing that cleavage or being incredibly low abundance. Fortunately, the observation of these peptides enables the unambiguous assignment of this bond by confirming the mass of the region, while the peptides possessing that enzymatic cleavage can be used to confirm that the lysine is present on the peptides n-terminal to the cleavage site and the aspartic acid is present on peptides c-terminal to the cleavage site.
Figure 7.

Composite fragment ion coverage maps from pooling identified cleavages from the sets of peptides for the light chain (top), heavy chain Fd’ (middle), and heavy chain Fc/2 (bottom). ETD fragment ions (c/z) are denoted in red while collisional fragment ions (b/y) are denoted in blue.
Notably, neither ETD nor HCD proved sufficient (within this subset) to generate complete sequence mapping alone. However, their high complementarity enables unambiguous sequence assignment of all residues within the molecule. Both this complementarity and the benefit of multiple peptide series is illustrated in supplemental Figure S2. This illustrates an expanded breakdown by peptide of the cleavages reported in Figure 7. Using the stock MS/MS tools available on the Fusion, very few peptides (particularly larger peptides) are capable of providing unequivocal assignment of their respective sequence, but their aggregated fragment assignments enable complete validation of the sequence. Even this limited subset can comprehensively map the protein sequence, and further sequence redundancies in the remaining ~94.5% of the data set likely further increase sequence assignment confidence; diagnostic fragments from multiple different peptides afford more confidence for a given amino acid than in a peptide.
Identification of the glycan tree on the Fc region of the mAb was carried out by including a glycan search in Byonic for six potential glycan trees: G0, G0F, G1, G1F, G2, and G2F.55 The predominant identification in the search appears to be G0F, while G1F is still clearly detected within the sample. Complete sequence mapping of the Fc was performed on peptides containing the G0F glycan. Likely due to lower abundance, the G1F peptides, while providing extensive enough fragmentation to confidently identify the peptide, do not achieve unambiguous sequence assignment. Nevertheless, they can be verified to be present within the sample. Sequence characterization of the glycated peptides occurs almost entirely through the use of ETD and localized the glycan site to N301, as depicted in Figure 7. Fragmentation of the glycated peptides by HCD predominantly results in glycan tree loss and provides comparatively few sequence informative fragment ions. As such, ETD is a necessity for this kind of characterization strategy if one aims to characterize an antibody without deglycosylating the sample.
The C-terminal lysine clipping of the heavy chain Fc is a modification commonly present in antibodies.56 Using this method, two peptides were identified and fragmented: S179-K211 and S179-G210 (Figure 8). Since both peptides were present in the analysis, lysine clipping is plausibly present within the antibody. One potential concern, however, is that, due to the nonspecificity of Aspergillopepsin I, it remains possible in principle that these peptides are the result of a nonspecific cleavage at that site rather than genuine truncation of the antibody. While high abundance suggests that this possibility is unlikely, one cannot unmistakably assign truncations like lysine clipping without further intact mass determination. Nonetheless, the presence of this modification in our analysis is likely given corroborating data of the undigested subunit (Figure S3).
Figure 8.

Two peptides illustrating the lysine clipped (top) and unclipped (bottom) peptides identified in the run. Panel A illustrates the extracted chromatograms for the species, illustrating that the unclipped variant is present at ~20% abundance relative to the clipped variant. Panel B illustrates the fragmentation of the species, clearly identifying them as the clipped versions of the same peptide.
Despite this shortcoming, kinetically controlled digestion with a nonspecific protease offers some clear advantages that are worth considering. The sample preparation to MS analysis is quick, straightforward, and flexible for a variety of protein samples. The extent of digestion is easily tunable through flow rate manipulation to order to generate a peptide profile favorable for a given analytical goal. In a single chromatographic analysis, multiple overlapping peptide series can unambiguously identify the amino acid sequence. While these results illustrate the ability to extensively characterize an antibody’s sequence, one goal moving forward is to extend this platform to much larger proteins. Further mass spectrometric advancements are likely to further improve the performance of this methodology, particularly on even larger peptides. For instance, integration of ion–ion proton transfer for charge reduction to our data-dependent method will likely improve the sequence information obtained from the largest peptides present in the analysis, enhancing both the depth of analysis and the ability to colocalize different portions of a protein of interest. Given these advantages, kinetically controlled digestion is an attractive methodology for large protein characterization where both intact protein fragmentation and more traditional enzymatic digestions struggle.
Supplementary Material
ACKNOWLEDGMENTS
Thank you to Protein Metrics for generously providing the Byonic search algorithm which was used in this work. Also, thank you to Stephanie Miller Lehman for thought provoking discussion on this project. Support for this work was provided by NIH Grant GM37537 to D.F.H. J.D.H. was funded in part by an ARCS MWC Scholar Award.
Footnotes
The authors declare no competing financial interest.
ASSOCIATED CONTENT
Supporting Information
The Supporting Information is available free of charge on the ACS Publications website at DOI: 10.1021/acs.analchem.9b02666.
Additional information as noted including expanded experimental procedures, table of precursors used for mAb peptide analysis, a figure to illustrate reactor digestion reproducibility, a secondary way to view the generated mAb data, and the intact molecular weight analysis of the Fc/2 subunit (PDF)
REFERENCES
- (1).Ecker DM; Jones SD; Levine HL MAbs 2015, 7 (1), 9–14. [DOI] [PMC free article] [PubMed] [Google Scholar]
- (2).Kaplon H; Reichert JM MAbs 2018, 10 (2), 183–203. [DOI] [PMC free article] [PubMed] [Google Scholar]
- (3).Lagassé HAD; Alexaki A; Simhadri VL; Katagiri NH;́ Jankowski W; Sauna ZE; Kimchi-Sarfaty C F1000Research 2017, 6, 113. [DOI] [PMC free article] [PubMed] [Google Scholar]
- (4).Scott AM; Wolchok JD; Old L J. Nat. Rev. Cancer 2012, 12 (4), 278. [DOI] [PubMed] [Google Scholar]
- (5).Chan AC; Carter PJ Nat. Rev. Immunol 2010, 10 (5), 301. [DOI] [PubMed] [Google Scholar]
- (6).Fekete S; Gassner A-L; Rudaz S; Schappler J; Guillarme D TrAC, Trends Anal. Chem 2013, 42 (74), 83. [Google Scholar]
- (7).Lew C; Gallegos-Perez J-L; Fonslow B; Lies M; Guttman A. J. Chromatogr. Sci 2015, 53 (3), 443–449. [DOI] [PubMed] [Google Scholar]
- (8).Fekete S; Guillarme D; Sandra P; Sandra K Anal. Chem. 2016, 88 (1), 480–507. [DOI] [PubMed] [Google Scholar]
- (9).He L; Anderson LC; Barnidge DR; Murray DL; Hendrickson CL; Marshall AG J. Am. Soc. Mass Spectrom 2017, 28 (5), 827–838. [DOI] [PubMed] [Google Scholar]
- (10).Jooß K; Hühner J; Kiessig S; Moritz B; Neusüß C Anal. Bioanal. Chem 2017, 409 (26), 6057–6067. [DOI] [PubMed] [Google Scholar]
- (11).Goyon A; Excoffier M; Janin-Bussat M-C; Bobaly B; Fekete S; Guillarme D; Beck A J. Chromatogr. B: Anal. Technol. Biomed. Life Sci. 2017, 1065 (119), 128. [DOI] [PubMed] [Google Scholar]
- (12).Ding W; Qiu D; Bolgar MS; Miller SA Anal. Chem 2018, 90 (3), 1560–1565. [DOI] [PubMed] [Google Scholar]
- (13).Janeway C; Travers P; Walport M; Schlomchik MJ Immunobiology, the Immune System in Health and Disease (Garland, NY). 2001. [Google Scholar]
- (14).Haberger M; Bomans K; Diepold K; Hook M; Gassner J; Schlothauer T; Zwick A; Spick C; Kepert JF; Hienz B Assessment of Chemical Modifications of Sites in the CDRs of Recombinant Antibodies: Susceptibility vs. Functionality of Critical Quality Attributes. In MAbs; Taylor & Francis: London, 2014; Vol. 6, pp 327–339. [DOI] [PMC free article] [PubMed] [Google Scholar]
- (15).Herold EM; John C; Weber B; Kremser S; Eras J; Berner C; Deubler S; Zacharias M; Buchner, J. Sci. Rep 2017, 7 (1), 12276. [DOI] [PMC free article] [PubMed] [Google Scholar]
- (16).Igawa T; Tsunoda H; Kuramochi T; Sampei Z; Ishii S; Hattori K Engineering the Variable Region of Therapeutic IgG Antibodies. In MAbs; Taylor & Francis: London, 2011; Vol. 3, pp 243–252. [DOI] [PMC free article] [PubMed] [Google Scholar]
- (17).Nimmerjahn F; Ravetch JV Nat. Rev. Immunol 2008, 8 (1), 34. [DOI] [PubMed] [Google Scholar]
- (18).Zhang J; Tanha J; Hirama T; Khieu NH; To R; Tong-Sevinc H; Stone E; Brisson J-R; MacKenzie CR J. Mol. Biol 2004, 335 (1), 49–56. [DOI] [PubMed] [Google Scholar]
- (19).Geuijen KPM; Oppers-Tiemissen C; Egging DF; Simons PJ; Boon L; Schasfoort R; Eppink MHM FEBS Open Bio 2017, 7 (10), 1557–1574. [DOI] [PMC free article] [PubMed] [Google Scholar]
- (20).Li T; DiLillo DJ; Bournazos S; Giddens JP; Ravetch JV; Wang L-X Proc. Natl. Acad. Sci. U. S. A. 2017, 114 (13), 3485–3490. [DOI] [PMC free article] [PubMed] [Google Scholar]
- (21).Goetze AM; Liu YD; Zhang Z; Shah B; Lee E; Bondarenko PV; Flynn GC Glycobiology 2011, 21 (7), 949–959. [DOI] [PubMed] [Google Scholar]
- (22).Zhang Y; Fonslow BR; Shan B; Baek M-C; Yates JR III Chem. Rev 2013, 113 (4), 2343–2394. [DOI] [PMC free article] [PubMed] [Google Scholar]
- (23).Gillet LC; Leitner A; Aebersold R Annu. Rev. Anal. Chem 2016, 9, 449. [DOI] [PubMed] [Google Scholar]
- (24).Lesur A; Varesio E; Hopfgartner GJ Chromatogr. A 2010, 1217 (1), 57–64. [DOI] [PubMed] [Google Scholar]
- (25).Xie H; Chakraborty A; Ahn J; Yu YQ; Dakshinamoorthy DP; Gilar M; Chen W; Skilton SJ; Mazzeo JR Rapid Comparison of a Candidate Biosimilar to an Innovator Monoclonal Antibody with Advanced Liquid Chromatography and Mass Spectrometry Technologies. In MAbs; Taylor & Francis: London, 2010; Vol. 2, pp 379–394. [DOI] [PMC free article] [PubMed] [Google Scholar]
- (26).Li H; Ortiz R; Tran L; Hall M; Spahr C; Walker K; Laudemann J; Miller S; Salimi-Moosavi H; Lee JW Anal. Chem 2012, 84 (3), 1267–1273. [DOI] [PubMed] [Google Scholar]
- (27).Tsiatsiani L; Heck AJR FEBS J 2015, 282 (14), 2612–2626. [DOI] [PubMed] [Google Scholar]
- (28).Sen KI; Tang WH; Nayak S; Kil YJ; Bern M; Ozoglu B; Ueberheide B; Davis D; Becker C J. Am. Soc. Mass Spectrom 2017, 28 (5), 803–810. [DOI] [PMC free article] [PubMed] [Google Scholar]
- (29).Choudhary G; Wu S-L; Shieh P; Hancock WS J. Proteome Res 2003, 2 (1), 59–67. [DOI] [PubMed] [Google Scholar]
- (30).Swaney DL; Wenger CD; Coon JJ J. Proteome Res 2010, 9 (3), 1323–1329. [DOI] [PMC free article] [PubMed] [Google Scholar]
- (31).Cui W; Rohrs HW; Gross ML Analyst 2011, 136 (19), 3854–3864. [DOI] [PMC free article] [PubMed] [Google Scholar]
- (32).Reid GE; McLuckey SA J. Mass Spectrom 2002, 37 (7), 663–675. [DOI] [PubMed] [Google Scholar]
- (33).Earley L; Anderson LC; Bai DL; Mullen C; Syka JEP; English AM; Dunyach J-J; Stafford GC Jr; Shabanowitz J; Hunt DF Anal. Chem 2013, 85 (17), 8385–8390. [DOI] [PMC free article] [PubMed] [Google Scholar]
- (34).Anderson LC; Karch KR; Ugrin SA; Coradin M; English AM; Sidoli S; Shabanowitz J; Garcia BA; Hunt DF Mol. Cell. Proteomics 2016, 15, 975. [DOI] [PMC free article] [PubMed] [Google Scholar]
- (35).Siuti N; Kelleher NL Nat. Methods 2007, 4 (10), 817. [DOI] [PMC free article] [PubMed] [Google Scholar]
- (36).Weisbrod CR; Kaiser NK; Syka JEP; Early L; Mullen C; Dunyach J-J; English AM; Anderson LC; Blakney GT; Shabanowitz J J. Am. Soc. Mass Spectrom 2017, 28 (9), 1787–1795. [DOI] [PMC free article] [PubMed] [Google Scholar]
- (37).Catherman AD; Skinner OS; Kelleher NL Biochem. Biophys. Res. Commun 2014, 445 (4), 683–693. [DOI] [PMC free article] [PubMed] [Google Scholar]
- (38).Toby TK; Fornelli L; Kelleher NL Annu. Rev. Anal. Chem 2016, 9, 499–519. [DOI] [PMC free article] [PubMed] [Google Scholar]
- (39).Garcia BA J. Am. Soc. Mass Spectrom 2010, 21 (2), 193–202. [DOI] [PubMed] [Google Scholar]
- (40).Aebersold R; Mann M Nature 2016, 537 (7620), 347. [DOI] [PubMed] [Google Scholar]
- (41).Schwartz JC; Senko MW; Syka JEP J. Am. Soc. Mass Spectrom 2002, 13 (6), 659–669. [DOI] [PubMed] [Google Scholar]
- (42).Zhang L; English AM; Bai DL; Ugrin SA; Shabanowitz J; Ross MM; Hunt DF; Wang W-H Mol. Cell. Proteomics 2016, 15 (4), 1479–1488. [DOI] [PMC free article] [PubMed] [Google Scholar]
- (43).Senko MW; Remes PM; Canterbury JD; Mathur R; Song Q; Eliuk SM; Mullen C; Earley L; Hardman M; Blethrow JD Anal. Chem 2013, 85 (24), 11710–11714. [DOI] [PubMed] [Google Scholar]
- (44).Henninot A; Terrier A; Charton J; Urbain R; Fontayne A; Deprez B; Beghyn T Anal. Biochem 2015, 491, 52. [DOI] [PubMed] [Google Scholar]
- (45).Gritti F; Farkas T; Heng J; Guiochon G J. Chromatogr. A 2011, 1218 (45), 8209–8221. [DOI] [PubMed] [Google Scholar]
- (46).Van den Berg JHM; Deelder RS; Egberrink HGM Anal. Chim. Acta 1980, 114, 91. [Google Scholar]
- (47).Nondek L; Brinkman UAT; Frei RW Anal. Chem 1983, 55 (9), 1466–1470. [Google Scholar]
- (48).Bartholomew CH; Farrauto RJ Fundamentals of Industrial Catalytic Processes; John Wiley & Sons: New York, 2011. [Google Scholar]
- (49).Bacskay I; Sepsey A; Felinger A J. Chromatogr. A 2014, 1339, 110. [DOI] [PubMed] [Google Scholar]
- (50).Liese A; Hilterhaus L Chem. Soc. Rev 2013, 42 (15), 6236–6249. [DOI] [PubMed] [Google Scholar]
- (51).Zubarev RA Curr. Opin. Biotechnol 2004, 15 (1), 12–16. [DOI] [PubMed] [Google Scholar]
- (52).Good DM; Wirtala M; McAlister GC; Coon JJ Mol. Cell. Proteomics 2007, 6 (11), 1942–1951. [DOI] [PubMed] [Google Scholar]
- (53).Liu J; McLuckey SA Int. J. Mass Spectrom 2012, 330, 174. [DOI] [PMC free article] [PubMed] [Google Scholar]
- (54).Brodbelt JS Anal. Chem 2016, 88 (1), 30–51. [DOI] [PMC free article] [PubMed] [Google Scholar]
- (55).Hamm M; Wang Y; Rustandi RR Pharmaceuticals 2013, 6 (3), 393–406. [DOI] [PMC free article] [PubMed] [Google Scholar]
- (56).Dick LW Jr; Qiu D; Mahon D; Adamo M; Cheng K Biotechnol. Bioeng 2008, 100 (6), 1132–1143. [DOI] [PubMed] [Google Scholar]
Associated Data
This section collects any data citations, data availability statements, or supplementary materials included in this article.