

Abstract
Background
Reducing saturated fat reduces serum cholesterol, but effects on other intermediate outcomes may be less clear. Additionally, it is unclear whether the energy from saturated fats eliminated from the diet are more helpfully replaced by polyunsaturated fats, monounsaturated fats, carbohydrate or protein.
Objectives
To assess the effect of reducing saturated fat intake and replacing it with carbohydrate (CHO), polyunsaturated (PUFA), monounsaturated fat (MUFA) and/or protein on mortality and cardiovascular morbidity, using all available randomised clinical trials.
Search methods
We updated our searches of the Cochrane Central Register of Controlled Trials (CENTRAL), MEDLINE (Ovid) and Embase (Ovid) on 15 October 2019, and searched Clinicaltrials.gov and WHO International Clinical Trials Registry Platform (ICTRP) on 17 October 2019.
Selection criteria
Included trials fulfilled the following criteria: 1) randomised; 2) intention to reduce saturated fat intake OR intention to alter dietary fats and achieving a reduction in saturated fat; 3) compared with higher saturated fat intake or usual diet; 4) not multifactorial; 5) in adult humans with or without cardiovascular disease (but not acutely ill, pregnant or breastfeeding); 6) intervention duration at least 24 months; 7) mortality or cardiovascular morbidity data available.
Data collection and analysis
Two review authors independently assessed inclusion, extracted study data and assessed risk of bias. We performed random‐effects meta‐analyses, meta‐regression, subgrouping, sensitivity analyses, funnel plots and GRADE assessment.
Main results
We included 15 randomised controlled trials (RCTs) (16 comparisons, 56,675 participants), that used a variety of interventions from providing all food to advice on reducing saturated fat. The included long‐term trials suggested that reducing dietary saturated fat reduced the risk of combined cardiovascular events by 17% (risk ratio (RR) 0.83; 95% confidence interval (CI) 0.70 to 0.98, 12 trials, 53,758 participants of whom 8% had a cardiovascular event, I² = 67%, GRADE moderate‐quality evidence). Meta‐regression suggested that greater reductions in saturated fat (reflected in greater reductions in serum cholesterol) resulted in greater reductions in risk of CVD events, explaining most heterogeneity between trials. The number needed to treat for an additional beneficial outcome (NNTB) was 56 in primary prevention trials, so 56 people need to reduce their saturated fat intake for ~four years for one person to avoid experiencing a CVD event. In secondary prevention trials, the NNTB was 53. Subgrouping did not suggest significant differences between replacement of saturated fat calories with polyunsaturated fat or carbohydrate, and data on replacement with monounsaturated fat and protein was very limited.
We found little or no effect of reducing saturated fat on all‐cause mortality (RR 0.96; 95% CI 0.90 to 1.03; 11 trials, 55,858 participants) or cardiovascular mortality (RR 0.95; 95% CI 0.80 to 1.12, 10 trials, 53,421 participants), both with GRADE moderate‐quality evidence.
There was little or no effect of reducing saturated fats on non‐fatal myocardial infarction (RR 0.97, 95% CI 0.87 to 1.07) or CHD mortality (RR 0.97, 95% CI 0.82 to 1.16, both low‐quality evidence), but effects on total (fatal or non‐fatal) myocardial infarction, stroke and CHD events (fatal or non‐fatal) were all unclear as the evidence was of very low quality. There was little or no effect on cancer mortality, cancer diagnoses, diabetes diagnosis, HDL cholesterol, serum triglycerides or blood pressure, and small reductions in weight, serum total cholesterol, LDL cholesterol and BMI. There was no evidence of harmful effects of reducing saturated fat intakes.
Authors' conclusions
The findings of this updated review suggest that reducing saturated fat intake for at least two years causes a potentially important reduction in combined cardiovascular events. Replacing the energy from saturated fat with polyunsaturated fat or carbohydrate appear to be useful strategies, while effects of replacement with monounsaturated fat are unclear. The reduction in combined cardiovascular events resulting from reducing saturated fat did not alter by study duration, sex or baseline level of cardiovascular risk, but greater reduction in saturated fat caused greater reductions in cardiovascular events.
Plain language summary
Effect of cutting down on the saturated fat we eat on our risk of heart disease
Review question
We wanted to find out the effects on health of cutting down on saturated fat in our food (replacing animal fats and hard vegetable fats with plant oils, unsaturated spreads or starchy foods).
Background
Health guidance suggests that reducing the amount of saturated fat we eat, by cutting down on animal fats, is good for our health. We wanted to combine all available evidence to see whether following this advice leads to a reduced risk of dying or getting cardiovascular disease (heart disease or stroke).
Study characteristics
We assessed the effect of cutting down the amount of saturated fat we eat for at least two years on health outcomes including dying, heart disease and stroke. We only looked at studies of adults (18 years or older). They included men and women with and without cardiovascular disease. We did not include studies of acutely ill people or pregnant or breastfeeding women.
Key results
We found 15 studies with over 56,000 participants. The evidence is current to October 2019. The review found that cutting down on saturated fat led to a 17% reduction in the risk of cardiovascular disease (including heart disease and strokes), but had little effect on the risk of dying. The review found that health benefits arose from replacing saturated fats with polyunsaturated fat or starchy foods. The greater the decrease in saturated fat, and the more serum total cholesterol is reduced, the greater the protection from cardiovascular events. People who are currently healthy appear to benefit as much as those at increased risk of heart disease or stroke (people with high blood pressure, high serum cholesterol or diabetes, for example), and people who have already had heart disease or stroke. There was no difference in effect between men and women.
This means that, if 56 people without cardiovascular disease, or 53 people who already have cardiovascular disease, reduce their saturated fat for around 4 years, then one person will avoid a cardiovascular event (heart attack or stroke) they would otherwise have experienced.
Quality of the evidence
There is a large body of evidence assessing effects of reducing saturated fat for at least two years. These studies provide moderate‐quality evidence that reducing saturated fat reduces our risk of cardiovascular disease.
Summary of findings
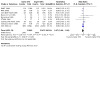
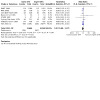
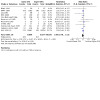
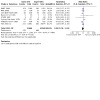
Summary of findings 1. Effect of reducing saturated fat compared to usual saturated fat on CVD risk in adults (note: for the full set of GRADE tables see additional tables 24 to 28).
| Low saturated fat compared with usual saturated fat for CVD risk | ||||||
|
Patient or population: people at any baseline risk of CVD Intervention: lower saturated fat intake Comparison: higher saturated fat intake Settings: Any, including community‐dwelling and institutions. Included RCTs were conducted in North America, Europe and Australia/New Zealand, no studies were carried out in industrialising or developing countries. | ||||||
| Outcomes | Relative effect (95% CI) | Anticipated absolute effects (95% CI) | No of Participants (studies) | Quality of the evidence (GRADE) | Comments | |
| Risk with higher SFA intake | Risk with lower SFA intake | |||||
|
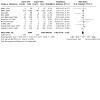
All‐cause mortality follow‐up mean duration 56 months1 |
RR 0.96 (0.90 to 1.03) | 62 per 1000 | 60 per 1000 (56 to 64) |
55,858 (12) | ⊕⊕⊕⊝ Moderate2,3,4,5,6 | Critical importance. Reducing saturated fat intake probably makes little or no difference to all‐cause mortality. |
|
Cardiovascular mortality follow‐up mean duration 53 months1 |
RR 0.94 (0.78 to 1.13) | 19 per 1000 | 18 per 1000 (15 to 22) | 53,421 (11) | ⊕⊕⊕⊝ Moderate2,3,4,6,7 | Critical importance. Reducing saturated fat intake probably makes little or no difference to cardiovascular mortality. |
|
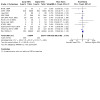
Combined cardiovascular events follow‐up mean duration 52 months1 |
RR 0.83 (0.70 to 0.98) | 85 per 1000 | 70 per 1000 (59 to 83) |
53,758 (13) | ⊕⊕⊕⊝ Moderate4,8,9,10,11 | Critical importance. Reducing saturated fat intake probably reduces cardiovascular events (to a greater extent with greater cholesterol reduction). |
|
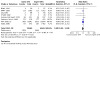
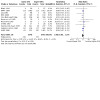
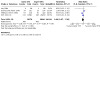
Myocardial infarctions follow‐up mean duration 55 months |
RR 0.90 (0.80 to 1.01) | 32 per 1000 | 29 per 1000 (25 to 32) |
53,167 (11) | ⊕⊝⊝⊝ VeryLow 3,4,5,11,12 | Critical importance. The effect of reducing saturated fat intake on risk of myocardial infarction is unclear as the evidence is of very low quality. |
|
Non‐fatal MI follow‐up mean duration 55 months1 |
RR 0.97 (0.87 to 1.07) | 26 per 1000 | 25 per 1000 (23 to 28) |
52,834 (8) | ⊕⊕⊝⊝ Low3,4,5,6,13 | Critical importance. Reducing saturated fat may have little or no effect on risk of non‐fatal myocardial infarction. |
|
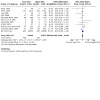
Stroke follow‐up mean duration 59 months1 |
RR 0.92 (0.68 to 1.25) | 22 per 1000 | 20 per 1000 (15 to 27) |
50,952 (7) | ⊕⊝⊝⊝ VeryLow 3,4,6,13,14 | Critical importance. The effect of reducing saturated fat on the risk of stroke is unclear as the evidence was of very low quality. |
|
CHD mortality follow‐up mean duration 65 months1 |
RR 0.97 (0.82 to 1.16) | 16 per 1000 | 16 per 1000 (13 to 19) |
53,159 (9) | ⊕⊕⊝⊝ Low2,3,4,6,14 | Critical importance. Reducing saturated fat intake may have little or no effect on CHD mortality. |
|
CHD events follow‐up mean duration 59 months1 |
RR 0.83 (0.68 to 1.01) | 42 per 1000 | 35 per 1000 (29 to 43) |
53,199 (11) | ⊕⊝⊝⊝ Verylow 4,5,6,12,15 | Critical importance. The effect of reducing saturated fat on risk of CHD events is unclear as the evidence is of very low quality. |
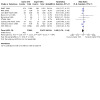
| *The risk in the intervention group (and its 95% confidence interval) is based on the assumed risk in the comparison group and the relative effect of the intervention (and its 95% CI). CI: Confidence interval; RR: Risk Ratio; CHD: coronary heart disease. | ||||||
| GRADE Working Group grades of evidence High quality: Further research is very unlikely to change our confidence in the estimate of effect. Moderate quality: Further research is likely to have an important impact on our confidence in the estimate of effect and may change the estimate. Low quality: Further research is very likely to have an important impact on our confidence in the estimate of effect and is likely to change the estimate. Very low quality: We are very uncertain about the estimate. | ||||||
1Minimum study duration was 24 months.
2Risk of bias. Limiting trials to those at low summary risk of bias also suggested little or no effect. Not downgraded.
3Inconsistency. We found no important heterogeneity; I² ≤ 30%. Not downgraded.
4Indirectness. These RCTs directly assessed the effect of lower vs higher saturated fat intake on health outcomes of interest. Participants included men and women with and without CVD at baseline (also some participants with CVD risk factors like diabetes, or at risk of cancers). However, no trials included participants from developing countries. Not downgraded.
5Imprecision. The 95% CI includes both no effect and a benefit. Downgraded once.
6Publication bias. The funnel plot, and comparison of fixed‐ and random‐effects meta‐analyses did not suggest major small‐study (publication) bias. Not downgraded.
7Imprecision. The 95% CI includes both harm and benefit. Downgraded once.
8Risk of bias. Limiting trials to those at low summary risk of bias suggested a smaller and non‐statistically significant effect (RR 0.96, 95% CI 0.76 to 1.20) suggesting little or no effect on risk of CVD events. Downgraded once (along with publication bias).
9Inconsistency. Although heterogeneity was high, I² = 65%, this was mostly explained by the degree of cholesterol‐lowering (a dose effect). Not downgraded.
10Imprecision. The 95% CI includes only benefit or minimal effect. Not downgraded.
11Publication bias. The funnel plot did not suggest publication bias, but comparison of fixed‐ and random‐effects meta‐analyses suggested possible small‐study (publication) bias. Downgraded once (along with risk of bias, downgraded once in total).
12Risk of bias. Limiting trials to those at low summary risk of bias moved the RR slightly towards 1.0, suggesting little or no effect on total MI. Downgraded once.
13Risk of bias. Limiting trials to those at low summary risk of bias moved the RR slightly away from 1.0, suggesting that reducing SFA reduces the risk of non‐fatal MI. This was also seen in several other sensitivity analyses. Downgraded once.
14Imprecision. The 95% CI includes both important benefits and important harms. Downgraded twice.
15Inconsistency. Heterogeneity was high, I² = 65%. Downgraded once.
Background
In 1949, Ryle and Russell in Oxford documented a dramatic increase in coronary heart disease (CHD), and the Registrar General’s Statistical Tables of 1920 to 1955 showed that there had been a 70‐fold increase in coronary deaths during this 35‐year period (Oliver 2000; Ryle 1949). This sudden surge in coronary heart disease sparked research into its causes. A case‐control study published in 1953 of 200 post‐myocardial infarction patients and age‐matched controls established that those with disease had higher plasma cholesterol levels (Oliver 1953).
Meanwhile in 1949 in the USA, Gofman had separated lipids into lipoprotein classes through ultra centrifugation, describing the LDL as ‘atherosclerogenic’ (Gofman 1949). The following year Keys 1950 proposed that the concentration of plasma cholesterol was proportional to dietary saturated fatty acids (SFA) intake. This relationship was confirmed in work by Hegsted (Hegsted 1965; Hegsted 2000), who published an equation explaining the relationship in 1965 and subsequently in 2000. The equation suggests that dietary saturated fat increases serum cholesterol and so increases cardiovascular (CV) risk, while polyunsaturated fats (PUFA) reduce both. This has since been further refined:
Δ serum cholesterol (in mg/dL) = 2.16 * Δ dietary saturated fat intake (as percentage of energy) – 1.65 * Δ dietary PUFA intake (as percentage of energy, %E) + 6.77 * Δ dietary cholesterol intake (in units of 100 mg/day) – 0.53
The Seven Countries Study compared CHD mortality in 12,000 men aged 40 to 59 in seven countries, and found positive correlations between CHD mortality and total fat intake in 1970, then in 1986 between CHD mortality and saturated fat intake (Keys 1986; Thorogood 1996). A migrant study of Japanese men living in different cultures confirmed in 1974 that men in California had the diet richest in saturated fat and cholesterol, and the highest CHD rates, those in Hawaii had intermediate saturated fat and CHD rates, and those in Japan had a diet lowest in saturated fat and cholesterol, and the least CHD (Kagan 1974; Robertson 1977). However, systematic reviews of the observational data have not confirmed these early studies. Skeaff 2009 included 28 USA and European cohorts (including 6600 CHD deaths among 280,000 participants) investigating the effects of total, saturated, monounsaturated, trans and omega‐3 fats on CHD deaths and events. They found no clear relationship between total, saturated or monounsaturated fat (MUFA) intake and coronary heart disease events or deaths. There was evidence that trans fats increased both coronary heart disease events and deaths, and that total PUFAs and omega‐3 fats decreased them. Intervention studies are needed to clarify cause and effect, to ensure that confounding is not hiding true relationships, or suggesting relationships where they do not exist. Trials also directly address the issue of whether altering dietary saturated fat in adults is helpful in reducing the risk of CVD in the general population and in those at high risk. Intervention trials are crucial in forming the basis of evidence‐based practice in this area.
Most intervention studies have assessed effects of dietary interventions on risk factors for heart disease, and separate work ties the effect of altering these risk factors to changes in disease incidence and mortality. Systematic reviews in this area follow the same pattern. There are systematic reviews of the effect of dietary fat advice on serum lipid levels (Brunner 1997; Clarke 1997; Denke 1995; Kodama 2009; Malhotra 2014; Mensink 1992; Mensink 2003; Rees 2013; Weggemans 2001; Yu‐Poth 1999), suggesting that dietary changes cause changes in serum lipids. There are also systematic reviews on the effect of lipid level alterations on CV morbidity and mortality (Briel 2009; De Caterina 2010; Law 1994; Robinson 2009; Rubins 1995; Walsh 1995), suggesting that changes in lipids do affect CVD risk. Other risk factors dealt with in a similar way are blood pressure (Bucher 1996; Law 1991; Shah 2007), body weight or fatness (Astrup 2000; Hession 2009; SIGN 1996), angiographic measurements (Marchioli 1994), antioxidant intake (Ness 1997), metabolic profile (Kodama 2009) and alcohol intake (Rimm 1996). A problem with this two‐level approach is that any single dietary alteration may have effects over a wide range of risk factors for CVD. An example of this is the choice of substitution of saturated fats by carbohydrate, PUFAs, MUFAs or protein in the diet. This choice may alter lipid profile, and may also affect blood pressure, body weight, oxidative state, rate of cholesterol efflux from fibroblasts, insulin resistance, post‐prandial triacylglycerol response, blood clotting factors, and platelet aggregation. There may also be further risk factors of which we are not yet aware. Evidence of beneficial effect on one risk factor does not rule out an opposite effect on another unstudied risk factor, and therefore an overall null (or harmful) effect of intervention. While understanding the effects of dietary advice on intermediate risk factors helps to ensure diets are truly altered by advice, and illuminates mechanisms, the best way of combining the effects on all of these risk factors is to not study risk factors, but to study the effects of dietary change on important outcomes, on CV morbidity and mortality, and on total mortality.
Substantial randomised controlled trial data on the effects of dietary fat on mortality and morbidity do exist and have been previously reviewed (Abdelhamid 2020; Abdelhamid 2018; Abdelhamid 2019; Brainard 2020; Brown 2019; Deane 2019; Hanson 2020; Hooper 2018; Hooper 2019; Hooper 2012). A recent very large trial, the Women's Health Initiative, that included over 2000 women with, and over 48,000 women without, CVD at baseline for over eight years (WHI 2006)) has raised many questions about both the effects of fat on health and on how we best conduct research to understand the relationship (Astrup 2011; Michels 2009; Prentice 2007; Stein 2006; Yngve 2006). We incorporated these findings into an update of a Cochrane review on dietary fat and CVD risk with a search in 2010 (Hooper 2012), finding reductions in cardiovascular events in studies that modified dietary fat, and in studies of at least two years' duration, but not in studies of fat reduction or studies with less than two years' follow‐up.
Why it is important to do this review
Public health dietary advice on prevention of cardiovascular disease (CVD) has changed over time, with a focus on fat modification during the 1960s and fat reduction during the 1990s following the introduction of USA and UK dietary guidance on fat reduction, limiting saturated fat intake to 10% of energy (Harcombe 2015). In 2006, recommendations by the American Heart Association suggested that, among other dietary measures, Americans should "limit intake of saturated fat to 7% of energy, trans fat to 1% of energy, and cholesterol to 300 mg/day by choosing lean meats and vegetable alternatives, fat‐free (skim) or low‐fat (1% fat) dairy products and minimise intake of partially hydrogenated fats" (Lichtenstein 2006). Current American Heart Association guidelines suggest that Americans should "Aim for a dietary pattern that achieves 5% to 6% of calories from saturated fat" and "Reduce percent of calories from saturated fat" (both graded as strong evidence on the basis of effects on serum lipids ‐ trials with cardiovascular outcomes are not referenced or discussed, Eckel 2013). European guidance on the treatment of dyslipidaemia is similarly based on dietary effects on lipids, recommending reduction in saturated fats (ESC/EAS 2011) and referencing Mensink 2003, while the Joint British Societies' guidance on preventing CVD recommends a healthy diet including low saturated fat intake (Mach 2019), referencing a variety of evidence including several recent systematic reviews. This is reflected in UK Scientific Advisory Committee on Nutrition recommendations that "dietary reference value for saturated fats remains unchanged: the [population] average contribution of saturated fatty acids to [total] dietary energy be reduced to no more than about 10%", and that "saturated fats are substituted with unsaturated fats. More evidence is available supporting substitution with PUFA than substitution with MUFA" (SACN 2019).
Recent UK National Institute for Health and Care Excellence(NICE) guidance suggests that for people at high risk of or with CVD that they "eat a diet in which total fat intake is 30% or less of total energy intake, saturated fats are 7% or less of total energy intake, intake of dietary cholesterol is less than 300 mg/day and where possible saturated fats are replaced by monounsaturated and polyunsaturated fats". This statement was based on long‐term randomised controlled trials reporting hard outcomes, and NICE separately assessed effects of high polyunsaturated diets, including four of the trials included in this review (NICE 2014).
We were interested in assessing the direct evidence from trials of the effects of reducing saturated fats, and considering what macronutrients the saturated fats were replaced by, updating Hooper 2015a. This update also supports a request from the World Health Organization Nutrition Guidance Expert Advisory Group (WHO NUGAG) to more accurately assess effects of reducing saturated fats on all‐cause mortality, CV morbidity and other health outcomes, and to consider the differential effects on health outcomes of replacement of the energy from saturated fat by other fats, carbohydrates or protein.
Objectives
To assess the effect of reducing saturated fat intake and replacing it with carbohydrate (CHO), polyunsaturated (PUFA) or monounsaturated fat (MUFA) and/or protein on mortality and cardiovascular morbidity, using all available randomised clinical trials.
Additional World Health Organization Nutrition Guidance Expert Advisory Group (WHO NUGAG) specific questions included:
In adults, what is the effect in the population of reduced percentage of energy (%E) intake from saturated fatty acids (SFA) relative to higher intake for reduction in risk of noncommunicable diseases (NCDs)?
What is the effect on coronary heart disease mortality and coronary heart disease events?
What is the effect in the population of replacing SFA with polyunsaturated fats (PUFAs), monounsaturated fats (MUFAs), carbohydrates (CHO) (refined versus unrefined), protein or trans fatty acids (TFAs) relative to no replacement for reduction in risk of NCDs?
What is the effect in the population of consuming < 10%E as SFA relative to > 10%E as SFA for reduction in risk of NCDs?
What is the effect in the population of a reduction in %E from SFA from 10% in gradual increments relative to higher intake for reduction in risk of NCDs?
Methods
Criteria for considering studies for this review
Types of studies
Randomised controlled trials only. We accepted randomisation of individuals, or of larger groups (clusters) where there were at least six of these groups randomised. We excluded studies where allocation was not truly randomised (e.g. divisions based on days of the week or first letter of the family name), or where allocation was not stated as randomised, and no further information was available from the authors.
Types of participants
We included studies of adults (18 years or older, no upper age limit) at any risk of cardiovascular disease, with or without existing cardiovascular disease, using or not using lipid‐lowering medication. Participants could be of either gender, but we excluded those who were acutely ill, pregnant or lactating.
Types of interventions
We included randomised controlled trials stating an intention to reduce saturated fat (SFA) intake (by suggesting appropriate nutrient‐based or food‐based aims) OR which provided a general dietary aim, such as improving heart health or reducing total fat, that also achieved a statistically significant saturated fat reduction (P < 0.05) during the trial in the intervention arm compared with the control arm. The intervention had to be dietary advice, supplementation of fats, oils or modified or low‐fat foods, or a provided diet, compared to higher saturated fat intake which could be usual diet, higher saturated fat, placebo or a control diet. Intended duration of the dietary intervention was at least two years (24 months or 104 weeks).
We excluded multiple risk factor interventions other than diet or supplementation (unless effects of diet or supplementation could be separated, as in a factorial design, so that the additional intervention was consistent or randomised between the intervention or control groups) and studies that aimed for weight loss in one arm but not the other. Atkins‐type diets aiming to increase protein and fat intake were excluded, as were studies where fat was reduced by means of a fat‐substitute (like Olestra). Enteral and parenteral feeds were excluded, as were formula weight reducing diets.
Examples: studies that reduced saturated fats and encouraged physical activity in one arm and compared with encouraging physical activity in the control were included; studies that reducedsaturated fats and encouraged physical activity in one arm and compared with no intervention in the control were excluded; studies that reduced saturated fats and encouraged fruit and vegetables in one arm and compared with no intervention in the control were included.
Types of outcome measures
Primary outcomes
All‐cause mortality (deaths from any cause)
Cardiovascular (CVD) mortality (deaths from myocardial infarction, stroke, and/or sudden death)
Combined CVD events. These included data available on number of people experiencing any of the following: cardiovascular death, cardiovascular morbidity (non‐fatal myocardial infarction, angina, stroke, heart failure, peripheral vascular events, atrial fibrillation) and unplanned cardiovascular interventions (coronary artery bypass surgery or angioplasty).
To meet our inclusion criteria, trials had to report either deaths or CVD events. These could be reported as serious adverse events (SAEs) or via communication with authors.
Secondary outcomes
-
Additional health events; the outcomes CHD mortality and CHD events were added at the request of the WHO NUGAG group, and were not present in the original overarching systematic review. For each of these, we assessed number of participants experiencing any of these:
Myocardial infarction, total (fatal and non‐fatal)
Myocaridal infarction, non‐fatal
Stroke
CHD mortality, which includes death from myocardial infarction or sudden CVD death
CHD events, which include any of the following: fatal or non‐fatal myocardial infarction, angina or sudden CVD death
type II diabetes incidence
-
Blood measures including serum blood lipids
total cholesterol (TC, mmol/L)
low‐density lipoprotein (LDL) cholesterol, mmol/L
high‐density lipoprotein (HDL) cholesterol, mmol/L
triglyceride (TG), mmol/L
TG/HDL ratio
LDL/HDL ratio
total/HDL ratio
lipoprotein (a) (Lp(a)), mmol/L
insulin sensitivity including glucose tolerance (homeostatic model assessment (HOMA), intravenous glucose tolerance test (IV‐GTT), clamp, glycosylated haemoglobin (HbA1C))
-
Other outcomes including adverse effects reported by study authors
cancer diagnoses
cancer deaths
body weight, kg
body mass index (BMI, kg/m2)
systolic blood pressure (sBP, mmHg)
diastolic blood pressure (dBP, mmHg)
quality of life (any measure)
As all trials collect data on deaths and cardiovascular events (as serious adverse events if not as planned outcome measures), we only included trials where we knew that at least one primary outcome occurred, by communication with authors if necessary. Where we knew that at least one primary outcome occurred, we included the study even where we were unable to use that data in meta‐analysis. We excluded studies where we knew that no primary outcome events occurred (for a study to be excluded in this way the paper needed to be very explicit about the lack of all outcomes or we received confirmation from the authors) and this was noted as the reason for exclusion. Lack of a single primary outcome only occurs in very small studies or in young cohorts, so omitting these studies will make no difference to effect sizes and very little difference to absolute effect sizes (NNTs etc). All other trials were considered unclear and where we could not gain clarification on events from authors, they were classified as “awaiting assessment”.
For composite outcomes (like CVD events), we worked to collect data on the number of participants in each arm who experienced any type of CVD event, and did not double‐count people (so that a person experiencing a stroke and two heart attacks during a trial was counted as one person experiencing CVD events, not as three CVD events).
We extracted event and continuous outcome data for the latest time point available within the trial, and always at least 24 months from inception. We collected change data (with a measure of variance) for continuous outcomes where these were available, and end data where change data were not provided in usable format.
Search methods for identification of studies
Electronic searches
The updated searches were run on 15 October 2019 on the following databases:
CENTRAL (Issue 10 of 12, 2019, Cochrane Library)
MEDLINE (Epub Ahead of Print, In‐Process & Other Non‐Indexed Citations, MEDLINE Daily and MEDLINE, Ovid, 1946 to October 14, 2019)
Embase (Ovid, 1980 to 2019 week 41).
For this update, we introduced searches of two trials registers on 17 October 2019; Clinicaltrials.gov (www.clinicaltrials.gov) and WHO International Clinical Trials Registry Platform (ICTRP) (apps.who.int/trialsearch/). The searches are described in Appendix 1. The RCT filter for MEDLINE was the Cochrane sensitivity and precision‐maximising RCT filter (Lefebvre 2011), and for Embase, terms as recommended in the Cochrane Handbook were applied (Lefebvre 2011).
As we were updating another Cochrane review relating to dietary fat (Hooper 2015b) at the same time, results of the searches for both reviews were combined and de‐duplicated before assessment of titles and abstracts.
The search to 2014 is described in Hooper 2015a, and previous searches in Hooper 2012. .
Searching other resources
We searched for recent publications of the included studies, to ensure the best possible data set for each study.
Data collection and analysis
Selection of studies
Search results were loaded into Covidence software. All authors independently assessed titles and abstracts from the search, differences were resolved by discussion and, when the findings were not clear cut, the full text was collected for assessment. We only rejected articles on initial screen if the author could determine from the title and abstract that the article was not a report of a randomised controlled trial; the trial did not address a low or modified fat diet; the trial was exclusively in children less than 18 years old, pregnant women or the critically ill; the trial was of less than 24 months duration; or the intervention was multifactorial. When we could not reject a title/abstract with certainty, we obtained the full text of the article for further evaluation.
Data extraction and management
We used a data extraction form designed for earlier versions of this review. We extracted data concerning participants, interventions and outcomes, trial quality characteristics (Chalmers 1990), data on potential effect modifiers including participants' baseline risk of cardiovascular disease, trial duration, intensity of intervention (dietary advice, diet provided, dietary advice plus supplementation, supplementation alone), medications used (particularly lipid‐lowering medication) and smoking status, numbers of events and total participant years in trial. Where provided, we collected data on risk factors for cardiovascular disease including blood pressure, lipids and weight.
We defined baseline risk of cardiovascular disease as follows: high risk are participants with existing vascular disease including a history of myocardial infarction, stroke, peripheral vascular disease, angina, heart failure or previous coronary artery bypass grafting or angioplasty; moderate risk are participants with a familial risk, dyslipidaemia, diabetes mellitus, hypertension, chronic renal failure; low risk are other participants or mixed‐population groups. Those at low or moderate risk combined are primary prevention trials.
Data were extracted independently in duplicate by AA, FOJ and/or LH, alongside assessment of risk of bias.
Assessment of risk of bias in included studies
We carried out 'Risk of bias' assessment independently in duplicate as part of data extraction. We assessed trial risk of bias using the Cochrane tool for assessment of risk of bias (Higgins 2011). For included RCTs, we also assessed whether each study:
was free of systematic differences in care,
aimed to reduce SFA intake,
achieved SFA reduction, or
achieved total serum cholesterol reduction.
We used the category 'other bias' to note any further issues of methodological concern. Funding was not formally a part of our assessment of bias in RCTs as it is not a core part of the Cochrane 'Risk of bias' tool, but was reported in the Characteristics of included studies.
Two authors (LH, NM) independently extracted validity data from studies identified by the previous search, and resolved differences by discussion.
Poorly concealed allocation is associated with a 40% greater effect size (Schulz 1995), so randomisation and allocation concealment are core issues for all trials. Lack of blinding is associated with bias, though smaller levels of bias than lack of allocation concealment (Savovic 2012), especially in studies with objectively measured outcomes (Wood 2008).
For this review, we introduced the concept of summary risk of bias for whole trials. We considered dietary advice or all‐food‐provided type trials to be at low summary risk of bias where we judged randomisation, allocation concealment, and blinding of outcome assessors to be adequate. Summary risk of bias was considered moderate to high in all other included trials.
Measures of treatment effect
The effect measures of choice were risk ratios (RR) for dichotomous data and mean difference (MD) for continuous data.
Unit of analysis issues
We did not include any cluster‐randomised trials in this review, as no relevant studies included at least six clusters.
Where there was more than one relevant intervention arm but only one control arm, we either pooled the relevant intervention arms to create a single pairwise comparison (where the intervention arms were equivalently appropriate for this review) as described in the Cochrane Handbook (Higgins 2011), or we excluded intervention arms that were not appropriate for this review, or less appropriate than another arm. When two arms were appropriate for different subgroups (Rose corn oil 1965; Rose olive 1965), then we used the control group once with each intervention arm, and divided the number of events in the control group, and the number of participants in the control group, evenly between the two study comparisons.
In the previous version of this review, data for WHI 2006 were presented separately for those without baseline CVD, and with baseline CVD, for most outcomes. This has been altered in this version of the review, so that both sets of data are presented as a single trial except when subgrouping by CVD risk. This has the effect of representing this study in the same way others are represented (which is appropriate), and slightly reducing the weight of the WHI 2006 study in random‐effects meta‐analysis, altering the numbers in the analysis.
When assessing event data, we aimed to assess number of participants experiencing an event (rather than numbers of events), to avoid counting more than one outcome event for any one individual within any one comparison. Where we were unclear (for example, where a paper reported numbers of myocardial infarcts but not by arm), we asked authors for further information.
Dealing with missing data
Where trials satisfied the inclusion criteria of our review but did not report mortality and morbidity, or not by study arm, we tried to contact study authors. This allowed inclusion of studies that would otherwise have had to be excluded. We excluded studies which were otherwise relevant but where we could not establish the presence or absence of primary outcomes, despite multiple attempts at author contact.
It was often unclear whether data on primary or secondary outcome events may still have been missing, and so we did not impute data for this review.
Where included studies used methods to infer missing data (such as carrying the latest measurement forward), then we used these data in analyses. Where this was not done, we used the data as presented.
Assessment of heterogeneity
We examined heterogeneity using the I² test, and considered it important where greater than 50% (Higgins 2003; Higgins 2011). Where we identified important clinical or unexplained statistical heterogeneity, we did not pool but instead summarised the studies in a narrative format. We used the assessment of heterogeneity in our GRADE assessments, so that the quality of evidence was downgraded where heterogeneity was important, and not explained by subgrouping or meta‐regression.
Assessment of reporting biases
We used funnel plots to examine the possibility of small study bias, including publication bias (Egger 1997), for the primary outcomes of total mortality and combined cardiovascular events. For this update, we also compared findings of fixed‐ and random‐effects meta‐analysis since the two methods weight small trials differently, and different effect sizes suggest potential small study bias (Page 2019).
Data synthesis
We carried out data synthesis in the absence of clinical heterogeneity. We used numbers of events in each study arm, and total number of participants randomised, where extracted, and Mantel‐Haenszel random‐effects meta‐analysis carried out in Review Manager 5 software, to assess risk ratios. We extracted event and continuous outcome data for the latest time point available within the trial, and always at least 24 months from inception.
We excluded trials where we knew that there were no events in either group. Where trials ran one control group and more than one included intervention group, we used data from the intervention group providing the comparison that best assessed the effect of altering dietary fat. Where the intervention groups appeared equal in this respect, we merged the intervention groups (simply added for dichotomous data, and using the techniques described in Higgins 2011 for continuous data). We had planned that if we identified trials randomised by cluster we would reduce the participant numbers to an "effective sample size" (as described by Hauck 1991); however, we found none that were both included and had cardiovascular events or deaths.
To assess the WHO NUGAG question on the effect of consuming < 10%E as SFA relative to > 10%E as SFA on the risk of noncommunicable diseases (NCDs) in the population, we combined studies with a control group saturated fat intake of > 10%E and an intervention group saturated fat intake of < 10%E. To assess the effect of a reduction in %E from SFA from 10% in gradual increments relative to higher intake, we repeated this with saturated fat cut‐offs between 7%E and 13%E.
Subgroup analysis and investigation of heterogeneity
Prespecified analyses included:
Effects of SFA reduction compared with usual or standard diet on all (primary and secondary) outcomes and potential adverse effects. This main analysis addressed the main objective of the review and the first WHO specific question.
Prespecified subgroups for all outcomes included:
energy substitution ‐ we intended to subgroup studies according to the main energy replacement for SFA ‐ PUFA, MUFA, CHO (refined or unrefined), protein, trans fats, a mixture of these, or unclear. However, when we presented these data to the WHO NUGAG group, they suggested that this subgrouping be altered. They suggested that we use all studies where SFA was reduced and any of PUFA, MUFA, CHO or protein were statistically significantly increased (P < 0.05) in the intervention compared to the control group to assess the effects of replacement by each, regardless of whether or not it constituted the main replacement for SFA. This meant that some studies appeared in more than one subgroup. As there were almost no data in the studies on trans fats, or on refined and unrefined carbohydrates, we did not include a trans group or distinguish by carbohydrate type. This subgrouping addresses the main objective of the review, and the third WHO specific question.
Further subgroups, run for primary and CVD health‐related secondary outcomes only, included:
Prespecified:
Baseline SFA intake, represented by control group SFA intake (up to 12%E from SFA, > 12 to 15%E, > 15 to 18%E, > 18%E from SFA, or unclear)
Sex (men, women and mixed populations)
Baseline CVD risk (low‐risk or general populations, moderate‐risk populations which were defined by risk factors for CVD such as hypertension or diabetes, high‐risk populations with existing CVD at baseline)
Duration in study (mean duration in trial up to 24 months, > 24 to 48 months, > 48 months, and unclear). Duration was a prespecified subgroup that we used in earlier versions of this review to separate studies with duration of less than two years from those of at least two years. As we have excluded shorter studies from this review, and have access to longer studies, we have explored duration over longer time spans. As some long studies had a high proportion of participants whose time in trial was censored, and we wanted to express mean experience of the trial, we used mean duration of participants in the study, rather than the formal study duration for this subgrouping, so that some two‐year intervention trials, because they had some deaths or dropouts, had a mean duration in trial of 21 or 22 months.
WHO NUGAG added subgroups:
Degree of SFA reduction, represented by the difference between SFA intake in the intervention and control groups during the study (up to 4%E from SFA reduction achieved, > 4 to 8% reduction achieved, > 8% reduction achieved, unclear). We prespecified that we intended to explore the degree of SFA reduction in meta‐regression, but its addition as a subgroup was post hoc, and requested by the WHO NUGAG group.
Serum total cholesterol reduction achieved (reduced by a mean of at least 0.2 mmol/L, reduced by less than 0.2 mmol/L or unclear). We prespecified that we intended to explore the degree of serum total cholesterol reduction in meta‐regression.
Ethnic group. Insufficient information was presented to make this feasible. Hence, we report ethnicity information in the Characteristics of included studies.
We explored the effects of different levels of SFA, PUFAs, MUFAs and total dietary fats, and CHO achieved in trials (all as difference between the intervention and control groups, as %E, and for SFA as a percentage of SFA in the intervention compared with control), baseline SFA intake (as %E), change in total cholesterol (difference between intervention and control groups, in mmol/L), sex, study duration in months, and baseline CVD risk using meta‐regression on total cardiovascular events. We performed random‐effects meta‐regression (Berkley 1995) using the STATA command metareg (Sharp 1998; Sterne 2001; Sterne 2009).
To explore the WHO NUGAG specific question about the effect of the population consuming < 10%E as SFA relative to > 10%E SFA, we assessed effects of all studies where the mean assessed intervention SFA intake was < 10%E and the mean control SFA intake was > 10%E. We explored the effect of reduction of %E from SFA in gradual increments by using cut‐offs of 7%E (where all studies with a mean intervention SFA intake < 7%E and mean control SFA intake > 7%E were pooled), 8%, 9%, 10%, 11%, 12% and 13%. We omitted studies where SFA intakes were not reported from these analyses. For each primary outcome, we plotted the pooled risk ratio of that outcome against the cut‐off, %E from SFA.
Referee‐added subgroups:
In response to the suggestion of a referee of this systematic review, and to better understand the effect of use of statins since the 1990s, we subgrouped studies by decade of publication.
Sensitivity analysis
We carried out sensitivity analyses for primary outcomes assessing the effect of:
Excluding studies which did not state an aim to reduce SFA
Excluding studies which did not report SFA intake during the trial, or did not find a statistically significant reduction in SFA in the intervention compared to the control
Excluding studies where total cholesterol (TC) was not reduced (statistically significant reduction of TC, or of LDL where TC was not reported (considered reduced where P < 0.05), or where reduction was not at least 0.2 mmol/L in intervention compared to control where variance was not reported)
Excluding the largest study (WHI 2006)
Analysis run with Mantel‐Haenszel fixed‐effect model
Analysis run with Peto fixed‐effect model
For this update we also introduced sensitivity analysis excluding trials not at low summary risk of bias. We used results of these analysis to inform GRADE assessment of risk of bias.
GRADE
All primary outcomes, and secondary additional health events, were represented in the 'Summary of findings' table, and underwent GRADE assessment. The GRADE Working Group has developed a common, sensible and transparent approach to grading quality of evidence and strength of recommendations (www.gradeworkinggroup.org/; GRADE 2004). The evidence within this systematic review was first assessed using the GRADE system by the review authors and then discussed and modified by the WHO NUGAG group.
Outcome data were interpreted as follows:
Is there an effect? (options were ‘increased risk’, ‘decreased risk’, or ‘little or no effect’). Our main outcome measure was RR so we decided on existence of an effect using RR. RR > 8% (RR < 0.92 or > 1.08) for the highest quality evidence suggested increased or decreased risk (otherwise little or no effect). The presence or not of an effect was decided on the RR for the main analysis and sensitivity analyses, the highest quality evidence (the main analysis, the sensitivity analyses of trials at low summary risk of bias and at low risk of compliance problems).
For continuous outcomes, reducing SFA was considered to have little or no effect unless effect sizes represented at least 5% change from baseline (or 2% in the case of cumulative outcomes such as adiposity).
Quality of evidence was assessed using GRADE assessment (GRADE 2004) for key outcomes. We used the five GRADE considerations (risk of bias, consistency of effect, imprecision, indirectness and publication bias) to assess the quality of the body of evidence as it related to the studies that contributed data to the meta‐analyses for the prespecified outcomes. We used methods and recommendations described in Section 8.5 and Chapter 12 of the Cochrane Handbook for Systematic Reviews of Interventions (Higgins 2011), plus GRADEpro GDT software (GRADEpro 2015). We justified all decisions to downgrade the quality of studies using footnotes and made comments to aid reader's understanding of the review.
Where there was a suggested effect, the size of effect was assessed using the number needed to treat for an additional beneficial outcome (NNTB), number needed to treat for an additional harmful outcome (NNTH) or absolute risk reduction (ARR).
Results
Description of studies
Results of the search
Figure 1 displays the flow diagram for inclusion of studies. We assessed the 7991 titles and abstracts from the updated electronic search, as well as assessing the 8930 titles and abstracts from the search for our sister review (Hooper 2015b), which de‐duplicated to 15,314 titles and abstracts. Of these, 530 were considered potentially relevant to one or both reviews, so were collected as full text. Ten publications were considered relevant for this systematic review, and these were grouped into:
1.
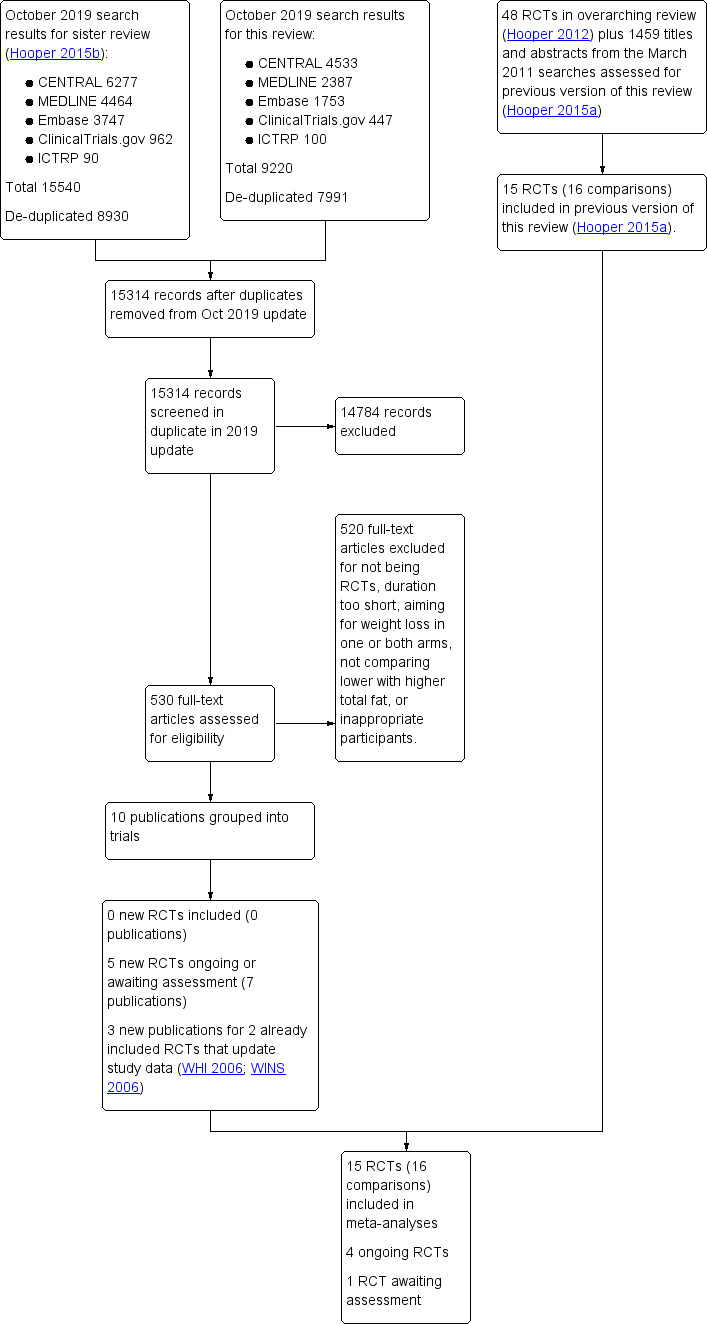
Study flow diagram for this systematic review (update searches run October 2019).
three new publications for two already included trials (WHI 2006; WINS 2006),
two publications for one study awaiting assessment (not enough details to confirm inclusion, ICFAMED), and
five publications for four ongoing trials (ENAbLE due unclear; NCT02481466 due 2020; NCT02938832 due 2023; NEW Soul Study due 2022).
There were no new included trials, but there were new data for WHI 2006 and WINS 2006, as well as the ongoing studies and the study awaiting assessment. This resulted in an updated review including 15 RCTs (16 comparisons as the Rose trial has two comparisons, Rose corn oil 1965 and Rose olive 1965).
Included studies
We included 15 randomised controlled trials (RCTs) randomising 56,675 participants in the review (Included studies), and describe them in Characteristics of included studies. The interventions are compared in Table 2.
1. Comparison of study interventions for included RCTs.
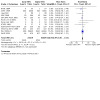
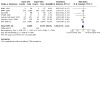
| Reference | Population | CVD risk category | Is intervention delivered to Individual or group? | intervention given by? | Face‐to‐face or other? | Number of visits | Is intervention advice only or other intervention? |
| Black 1994 | People with non‐melanoma skin cancer | Low | Unclear | Dietitian | Face‐to‐face | 8 x weekly classes then monthly follow‐up sessions | Advice (behaviour techniques learning) |
| DART 1989 | Men recovering from a MI | High | Individual | Dietitian | Face‐to‐face | 9 | Advice (diet advice, recipes and encouragement) |
| Houtsmuller 1979 | Adults with newly‐diagnosed diabetes | Moderate | Unclear | Dietitian | Unclear | Unclear | Advice? |
| Ley 2004 | People with impaired glucose intolerance or high normal blood glucose | Moderate | Small group | Unclear | Face‐to‐face | Monthly meetings | Advice (education, personal goal‐setting, self‐monitoring) |
| Moy 2001 | Middle‐aged siblings of people with early CHD, with at least 1 CVD risk factor | Moderate | Individual | Trained nurse | Face‐to‐face | 6 ‐ 8 weekly for 2 years | Advice (individualised counselling sessions) |
| MRC 1968 | Free‐living men who have survived a 1st MI | High | Individual | Dietitian | Face‐to‐face | Unclear | Advice and supplement (soy oil) |
| Oslo Diet‐Heart 1966 | Men with previous MI | High | Individual | Dietitian | Face‐to‐face and other | Unclear | Advice and supplement (food) |
| Oxford Retinopathy 1978 | Newly‐diagnosed non‐insulin‐dependent diabetics | Moderate | Individual | Diabetes dietitian | Face‐to‐face | After 1 month then at 3‐month intervals | Advice |
| Rose corn oil 1965 | Men (?) with angina or following MI | High | Unclear | Unclear | Unclear | Follow‐up clinic monthly, then every 2 months | Advice and supplement (oil) |
| Rose olive 1965 | Men (?) with angina or following MI | High | Unclear | Unclear | Unclear | Follow‐up clinic monthly, then every 2 months | Advice and supplement (oil) |
| Simon 1997 | Women with a high risk of breast cancer | Low | Individual followed by individual or group | Dietitian | Face‐to‐face | Bi‐weekly over 3 months followed by monthly | Advice (individualised eating plan and counselling sessions) |
| STARS 1992 | Men with angina referred for angiography | High | Individual | Dietitian | Face‐to‐face | Clinic visits at 3‐month intervals | Advice |
| Sydney Diet‐Heart 1978 | Men with angina referred for angiography | High | Individual | Unclear | Face‐to‐face | 3 times in 1st year and twice annually thereafter | Advice |
| Veterans Admin 1969 | Men living at the Veterans Administration Center | Low | Individual | Unclear (whole diet provided) | N/A | N/A | Diet provided |
| WHI 2006 | Postmenopausal women aged 50 ‐ 79 with or without CVD at baseline | Low and High | Group | Nutritionists | Face‐to‐face | 18 sessions/1st yr and quarterly maintenance sessions after | Advice |
| WINS 2006 | Women with localised resected breast cancer | Low | Individual followed by group | Dietitian | Face‐to‐face | 8 bi‐weekly sessions, then 3‐monthly contact and optional monthly sessions | Advice |
MI: myocardial infarction N/A: not applicable
The main study papers ranged in publication date from 1965 to 2006, but with supplementary publications included up to 2019. The RCTs were conducted in North America (six), Europe (seven), and Australia/New Zealand (two); no studies were carried out in industrialising or developing countries. Six RCTs included only people at high risk of cardiovascular disease, four at moderate risk, and four at low risk (three with raised cancer risk or cancer diagnosis, one with no specific health risks), while one trial included participants at low and high CVD risk (WHI 2006, Table 2; this trial made assessments in each of these groups). Seven studies included only men, three only women, and five both men and women. However, as the largest trial (WHI 2006) was in women only, women are the largest group represented. Trial duration ranged from two to more than eight years, with a mean duration of 4.7 years.
The form of interventions varied (Table 2). Interventions were of advice to alter intake in 15 of the 16 intervention arms, and additional supplements such as oil or other foods were provided in three trials (four arms: MRC 1968; Oslo Diet‐Heart 1966; Rose corn oil 1965; Rose olive 1965), while all food was provided in a residential facility in one RCT (Veterans Admin 1969). Of the 15 arms with an advice element, most interventions were delivered face‐to‐face, but this was unclear in three arms (Houtsmuller 1979; Rose corn oil 1965; Rose olive 1965). Advice was provided individually in nine intervention arms (followed by later group sessions in two arms), in groups only in two trials (Ley 2004; WHI 2006), and was unclear in three RCTs (Black 1994; Houtsmuller 1979; Rose corn oil 1965; Rose olive 1965). Advice was provided by a dietitian in nine arms, a nutritionist in one, a trained nurse in one and was unclear in four. Frequency of study visits for advice and follow‐up varied between three times in the first year and twice annually thereafter up to 18 sessions in the first year and quarterly maintenance visits thereafter.
Of the 15 included studies (16 intervention arms), 11 RCTs (12 comparisons) provided data on all‐cause mortality (including 55,858 participants and 3518 deaths), 10 RCTs (11 comparisons) on CV mortality (53,421 participants and 1096 cardiovascular deaths), and 11 RCTs (12 comparisons) on combined cardiovascular CVD events (53,300 participants, of whom 4476 participants experienced at least one CVD event) (Table 3). In two included studies, it was clear that events had occurred, but it was not clear in which arm(s) the events had occurred (Oxford Retinopathy 1978; Simon 1997), so that we could not include the data in the meta‐analyses. Secondary health events and other secondary outcomes were reported in varying number of studies (between 1 and 15 studies reported on any single outcome, see Table 3 and Table 4).
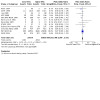
2. Number of participants and number of outcomes for dichotomous variables (by intervention arm).
| Participants | All‐cause mortality | CV mortality | CVD events | MI | Non‐fatal MI | Stroke | CHD mortality | CHD events | Diabetes Diagnoses | |
| Black 1994 | 133 | 133 | 133 | 133 | 0 | 0 | 0 | 0 | 0 | 0 |
| DART 1989 | 2033 | 2033 | 2033 | 2033 | 2033 | 2033 | 0 | 2033 | 2033 | 0 |
| Houtsmuller 1979 | 102 | 0 | 0 | 102 | 102 | 0 | 0 | 102 | 102 | 0 |
| Ley 2004 | 176 | 176 | 176 | 176 | 176 | 0 | 176 | 0 | 176 | 0 |
| Moy 2001 | 267 | 0 | 0 | 235 | 235 | 235 | 235 | 0 | 267 | 0 |
| MRC 1968 | 393 | 393 | 393 | 393 | 393 | 393 | 393 | 393 | 393 | 0 |
| Oslo Diet‐Heart 1966 | 412 | 412 | 412 | 412 | 412 | 412 | 412 | 412 | 412 | 0 |
| Oxford Retinopathy 1978 | 249 (data not provided by arm) | 0 | 0 | 0 | 0 | 0 | 0 | 0 | 0 | 0 |
| Rose corn oil 1965 | 41 | 41 | 41 | 41 | 41 | 41 | 0 | 41 | 41 | 0 |
| Rose olive 1965 | 39 | 39 | 39 | 39 | 39 | 39 | 0 | 39 | 39 | 0 |
| Simon 1997 | 194 (data not provided by arm) | 0 | 0 | 0 | 0 | 0 | 0 | 0 | 0 | 0 |
| STARS 1992 | 60 | 55 | 55 | 55 | 55 | 0 | 55 | 0 | 55 | 0 |
| Sydney Diet‐Heart 1978 | 458 | 458 | 458 | 458 | 0 | 0 | 0 | 458 | 0 | 0 |
| Veterans Admin 1969 | 846 | 846 | 846 | 846 | 846 | 846 | 846 | 846 | 846 | 0 |
| WHI 2006 | 48,835 | 48,835 | 48,835 | 48,835 | 48,835 | 48,835 | 48,835 | 48,835 | 48,835 | 48,835 |
| WINS 2006 | 2437 | 2437 | 0 | 0 | 0 | 0 | 0 | 0 | 0 | 0 |
| Total Participants | 56,675 | 55,858 | 53,421 | 53,758 | 53,167 | 52,834 | 50,952 | 53,159 | 53,199 | 48,835 |
| Percent of participants for this outcome | 100% | 99% | 94% | 95% | 94% | 93% | 90% | 94% | 94% | 86% |
These numbers are the numbers of participants in each study who were available for assessment of outcomes within meta‐analysis (not necessarily the number of participants randomised within the trial).
CHD: coronary heart disease CV: cardiovascular CVD: cardiovascular disease
3. Number of participants and number of participants with data for continuous outcomes (by intervention arm).
| Participants | Total cholesterol | LDL cholesterol | HDL cholesterol | Triglycerides | TG/HDL ratio | Total cholesterol/HDL ratio | LDL/HDL ratio | LP (a) | Insulin sensitivity | |
| Black 1994 | 133 | 0 | 0 | 0 | 0 | 0 | 0 | 0 | 0 | 0 |
| DART 1989 | 2033 | 1855 | 0 | 1855 | 0 | 0 | 0 | 0 | 0 | 0 |
| Houtsmuller 1979 | 102 | 96 | 0 | 0 | 96 | 0 | 0 | 0 | 0 | 96 |
| Ley 2004 | 176 | 103 | 103 | 103 | 103 | 0 | 103 | 0 | 0 | 103 |
| Moy 2001 | 267 | 0 | 235 | 235 | 235 | 0 | 0 | 0 | 0 | 0 |
| MRC 1968 | 393 | 177 | 0 | 0 | 0 | 0 | 0 | 0 | 0 | 0 |
| Oslo Diet‐Heart 1966 | 412 | 329 | 0 | 0 | 0 | 0 | 0 | 0 | 0 | 0 |
| Oxford Retinopathy 1978 | 249 | 58 | 0 | 0 | 0 | 0 | 0 | 0 | 0 | 0 |
| Rose corn oil 1965 | 41 | 22 | 0 | 0 | 0 | 0 | 0 | 0 | 0 | 0 |
| Rose olive 1965 | 39 | 24 | 0 | 0 | 0 | 0 | 0 | 0 | 0 | 0 |
| Simon 1997 | 194 | 72 | 71 | 72 | 71 | 0 | 0 | 0 | 0 | 0 |
| STARS 1992 | 60 | 50 | 50 | 50 | 50 | 0 | 50 | 50 | 50 | 50 |
| Sydney Diet‐Heart 1978 | 458 | 458 | 0 | 0 | 458 | 0 | 0 | 0 | 0 | 0 |
| Veterans Admin 1969 | 846 | 843 | 0 | 0 | 0 | 0 | 0 | 0 | 0 | 0 |
| WHI 2006 | 48,835 | 2832 | 2832 | 2832 | 2832 | 0 | 2832 | 0 | 2832 | 2832 |
| WINS 2006 | 2437 | 196 | 0 | 0 | 0 | 0 | 0 | 0 | 0 | 0 |
| Total Participants | 56,675 | 7115 | 3291 | 5147 | 3845 | 0 | 2985 | 50 | 2882 | 3081 |
| Percent of participants for this outcome | 100% | 13% | 6% | 9% | 7% | 0% | 5% | 0.1% | 5% | 5% |
These numbers are the numbers of participants in each study who were available for assessment of outcomes within meta‐analysis (not necessarily the number of participants randomised within the trial).
HDL: high density lipoprotein LDL: low density lipoprotein Lp(a): lipoprotein (a) TG: triglyceride
Excluded studies
We excluded 520 full‐text publications at this update, having assessed the full texts in duplicate. We describe the reasons for some of these exclusions in Characteristics of excluded studies tables. We excluded 29 studies where data on events were not reported in publications and contact with authors confirmed that there had been no deaths or cardiovascular events, where contact with authors confirmed that data were not available, or where we could not establish contact with authors.
Risk of bias in included studies
We display 'Risk of bias' assessments in the individual included study arms in Figure 2.
2.
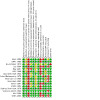
Methodological quality summary: review authors' judgements about each methodological quality item for each included study. Please note that while Rose 1965 (Rose corn oil 1965; Rose olive 1965) appears twice in this summary, it is a single trial. Rose 1965 was a 3‐arm trial and we have used the two intervention arms separately in the review.
Allocation
All the included trials were randomised controlled trials, and some detail of the randomisation process was provided for all studies, so all were considered at low risk of bias. We excluded those with detected pseudo‐random allocation (for example where participants are randomised according to birth date or alphabetically from their name). We judged allocation concealment to be well done in eight RCTs (eight comparisons, Ley 2004; Oslo Diet‐Heart 1966; Oxford Retinopathy 1978; STARS 1992; Sydney Diet‐Heart 1978; Veterans Admin 1969; WHI 2006; WINS 2006), and unclear in the remainder.
Blinding
Blinding of participants is not easy in dietary studies, as the participants usually have to follow instructions to attain the specific dietary goals. However, it is feasible in some circumstances, including when food is provided via an institutional setting, or meals provided at a central setting and remaining meals packed to take away. It can also be achieved through use of a trial shop, where very specific food‐based dietary advice is provided for all participants, or where the same dietary advice is provided to both groups but a different supplement (e.g. dietary advice to reduce fats, then provision of different oils or fats) is provided. Where participants are not blinded, it is difficult to ensure that study staff, healthcare providers and outcome assessors are blinded. The single RCT that appears to have had adequate participant and study personnel blinding was Veterans Admin 1969, and we judged blinding of participants to be inadequate in the remaining studies.
Blinding of outcome assessment was assessed separately for mortality and CVD outcomes. Blinding is not relevant in assessing all‐cause mortality, so all trials were considered at low risk of bias for detection bias for this outcome. For CVD outcomes, nine trials were at low risk of detection bias, one was at high risk and the remainder were unclear.
Incomplete outcome data
Assessing whether incomplete outcome data had been addressed was difficult, as the primary outcomes for this review (mortality and cardiovascular events) were often reported as dropouts and exclusions from the original studies, rather than as the primary outcomes of these trials. When mortality or cardiovascular events or both were noted in any one study, it is still feasible that some participants left that study feeling unwell or because the diet was inconvenient, so were simply lost to follow‐up from the perspective of the study, and later died or experienced a cardiovascular event. However, six of the studies checked medical records or death registers to ensure that such events were all collected (Black 1994, DART 1989; Oslo Diet‐Heart 1966; Sydney Diet‐Heart 1978; Veterans Admin 1969; WINS 2006). Within one study, there was extensive tracking of medical records, with assessment of health status by blinded trained adjudicators (WHI 2006), so few major events were likely to have been missed. In the other eight studies, it is not possible to know whether additional deaths or cardiovascular events occurred, that were not counted or ascertained within this review.
Selective reporting
Assessment of selective reporting is difficult when the outcome of interest was simply considered a cause of dropouts in most included studies. We tried to contact all of the trialists to ask about deaths and outcome events, but it is possible that some trialists did not reply as they felt that their data did not reflect the expected or hoped‐for pattern of events. All of the included studies have either reported that the participants did not experience any of our primary outcomes, have published their outcome data, or have provided the data they did possess. For this reason, we have graded all the included studies as at low risk of selective reporting.
Other potential sources of bias
Systematic differences in care. We assessed the studies for risk of bias in relation to systematic differences in care. The three RCTs (four comparisons) that appeared at low risk of systematic differences in care between the study arms included Rose corn oil 1965; Rose olive 1965; Oxford Retinopathy 1978; Veterans Admin 1969, while 11 RCTs clearly did have differences in care, such as differential time provided for those on the intervention to learn a new diet, and/or differential medical follow‐up, and one was unclear (Houtsmuller 1979).
Aim to reduce saturated fat. As several studies did not provide clear aims for their interventions (other than to alter specific dietary components, for example), we assessed whether the study stated an aim to reduce saturated fat. Ten RCTs (11 comparisons) clearly aimed to reduce saturated fat in their intervention arms, either directly or indirectly, for example, by stating food goals (DART 1989; Houtsmuller 1979; Moy 2001; MRC 1968; Oslo Diet‐Heart 1966; Rose corn oil 1965; Rose olive 1965; STARS 1992; Sydney Diet‐Heart 1978; Veterans Admin 1969; WHI 2006), while the remaining five did not (although they did achieve SFA reduction).
Successful saturated fat reduction. Eleven RCTs (11 comparisons) assessed SFA intake during the study period and showed that SFA intake in the intervention arm was statistically significantly lower than that in the control arm (Black 1994; DART 1989; Ley 2004; Moy 2001; Oxford Retinopathy 1978; Simon 1997; STARS 1992; Sydney Diet‐Heart 1978; Veterans Admin 1969; WHI 2006; WINS 2006). The remaining studies did not report SFA intake, so we rated them as unclear.
Successful cholesterol reduction. We would expect saturated fat reduction to be reflected in total or LDL cholesterol reductions, which may be more accurate assessments than self‐reported saturated fat intake. Nine RCTs (10 comparisons) provided information on serum total or LDL cholesterol levels in the intervention and control arms during the study, and found a reduction in the intervention arm compared to the control (P < 0.05, or where variances were not provided showed a reduction of at least 0.2 mmol/L in the mean intervention measure compared with control). The studies that successfully reduced serum total cholesterol in lower saturated fat arms compared with higher saturated fat arms were DART 1989; Houtsmuller 1979; Simon 1997; STARS 1992; Sydney Diet‐Heart 1978; WHI 2006, while Moy 2001 did not report total cholesterol (TC) but showed statistically significant reductions in LDL, and two studies (MRC 1968; Oslo Diet‐Heart 1966) did not report variances but did reduce mean TC in the intervention arm compared with control by at least 0.2 mm0l/L. One study (Black 1994) did not report lipid levels during the study, while five others did report lipid levels but did not suggest clear differences between lower and higher saturated fat arms (Ley 2004; Oxford Retinopathy 1978; Rose corn oil 1965; Rose olive 1965; Veterans Admin 1969; WINS 2006).
Dietary changes other than saturated fat. Some trials were partially confounded by aiming to make dietary changes other than those directly related to dietary fat intakes; for example, some studies encouraged intervention participants to make changes to their fat intake as well as changes to fruit and vegetable or fibre or salt intakes. In these studies, any effect on outcomes could be a result of other dietary changes, not of changes in saturated fat intake. The 11 studies (12 comparisons) that appeared free of such differences included Black 1994; DART 1989; Houtsmuller 1979; Ley 2004; MRC 1968; Oxford Retinopathy 1978; Rose corn oil 1965; Rose olive 1965; Simon 1997; Sydney Diet‐Heart 1978; Veterans Admin 1969; WINS 2006. This factor was not considered alongside others in the formal risk of bias assessment (Figure 2) so is described here. We did not identify any further methodological issues.
Summary risk of bias. We considered dietary advice or all‐food‐provided type trials to be at low summary risk of bias where we judged randomisation, allocation concealment, and blinding of outcome assessors to be adequate. For CVD outcomes, five trials were assessed as at low summary risk of bias: Ley 2004; Sydney Diet‐Heart 1978; Veterans Admin 1969; WHI 2006; WINS 2006. For all‐cause mortality (and lipid outcomes) where blinding of outcome assessors is not important, a further three trials were also at low summary risk of bias, eight in total: Ley 2004; Oslo Diet‐Heart 1966; Oxford Retinopathy 1978; STARS 1992; Sydney Diet‐Heart 1978; Veterans Admin 1969; WHI 2006; WINS 2006.
Effects of interventions
See: Table 1
Primary outcomes
All‐cause mortality
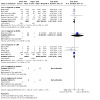
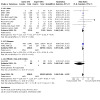
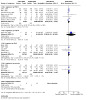
GRADE assessment suggests that reducing saturated fat intake probably makes little or no difference to all‐cause mortality (moderate‐quality evidence, downgraded once for imprecision).
There was little or no effect of lower saturated fat compared to higher saturated fat intake on mortality (risk ratio (RR) 0.96, 95% confidence interval (CI) 0.90 to 1.03, I² = 2%, 55,858 participants, 3518 deaths, 11 RCTs, Peffect = 0.42, Analysis 1.1). This lack of effect was confirmed in sensitivity analyses including only trials at low summary risk of bias (Analysis 1.2), that aimed to reduce saturated fat (Analysis 1.3), that significantly reduced saturated fat intake (Analysis 1.4), that achieved a reduction in total or LDL cholesterol (Analysis 1.5), excluding the largest trial (WHI 2006, Analysis 1.6), or analysing using Mantel‐Haenszel or Peto fixed‐effect analysis (Analysis 1.7; Analysis 1.8).
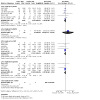
1.1. Analysis.
Comparison 1: SFA reduction vs usual diet ‐ primary outcomes, Outcome 1: ALL‐CAUSE MORTALITY
1.2. Analysis.
Comparison 1: SFA reduction vs usual diet ‐ primary outcomes, Outcome 2: All‐cause mortality, SA low summary risk of bias
1.3. Analysis.
Comparison 1: SFA reduction vs usual diet ‐ primary outcomes, Outcome 3: All‐cause mortality, SA aim to reduce SFA
1.4. Analysis.
Comparison 1: SFA reduction vs usual diet ‐ primary outcomes, Outcome 4: All‐cause mortality, SA statistically significant SFA reduction
1.5. Analysis.
Comparison 1: SFA reduction vs usual diet ‐ primary outcomes, Outcome 5: All‐cause mortality, SA TC reduction
1.6. Analysis.
Comparison 1: SFA reduction vs usual diet ‐ primary outcomes, Outcome 6: All‐cause mortality, SA excluding WHI
1.7. Analysis.
Comparison 1: SFA reduction vs usual diet ‐ primary outcomes, Outcome 7: All‐cause mortality, SA Mantel‐Haenszel fixed‐effect
1.8. Analysis.
Comparison 1: SFA reduction vs usual diet ‐ primary outcomes, Outcome 8: All‐cause mortality, SA Peto fixed‐effect
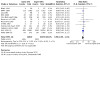
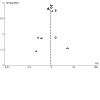
Small study bias was assessed using a funnel plot and comparing the results of fixed‐ and random‐effects meta‐analysis. The funnel plot did not suggest any small study bias (Figure 3), and the results of fixed‐ and random‐effects meta‐analyses were very similar, suggesting that small study bias was not an issue.
3.
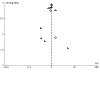
Funnel plot of comparison: fat modification or reduction vs usual diet ‐ total mortality.
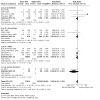
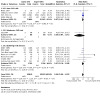
There was little or no effect, regardless of what nutrients were used to replace the saturated fat removed, including replacement with PUFA, MUFA, CHO and/or protein (Analysis 1.9). Effects did not differ by main substitution (Analysis 1.10), study duration (Analysis 1.11), baseline saturated fat intake (Analysis 1.12), degree of difference in saturated fat between arms (Analysis 1.13), participant sex (Analysis 1.14), by baseline CVD risk (Analysis 1.15), by degree of cholesterol reduction (Analysis 1.16) or by decade of publication (Analysis 1.17, Chi² test for differences between subgroups all P > 0.05).
1.9. Analysis.
Comparison 1: SFA reduction vs usual diet ‐ primary outcomes, Outcome 9: All‐cause mortality, subgroup by any substitution
1.10. Analysis.
Comparison 1: SFA reduction vs usual diet ‐ primary outcomes, Outcome 10: All‐cause mortality, subgroup by main substitution
1.11. Analysis.
Comparison 1: SFA reduction vs usual diet ‐ primary outcomes, Outcome 11: All‐cause mortality, subgroup by duration
1.12. Analysis.
Comparison 1: SFA reduction vs usual diet ‐ primary outcomes, Outcome 12: All‐cause mortality, subgroup by baseline SFA
1.13. Analysis.
Comparison 1: SFA reduction vs usual diet ‐ primary outcomes, Outcome 13: All‐cause mortality, subgroup by SFA change
1.14. Analysis.
Comparison 1: SFA reduction vs usual diet ‐ primary outcomes, Outcome 14: All‐cause mortality, subgroup by sex
1.15. Analysis.
Comparison 1: SFA reduction vs usual diet ‐ primary outcomes, Outcome 15: All‐cause mortality, subgroup by CVD risk
1.16. Analysis.
Comparison 1: SFA reduction vs usual diet ‐ primary outcomes, Outcome 16: All‐cause mortality, subgroup by TC reduction
1.17. Analysis.
Comparison 1: SFA reduction vs usual diet ‐ primary outcomes, Outcome 17: All‐cause mortality, subgroup decade of publication
Cardiovascular mortality
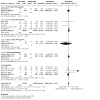
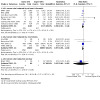
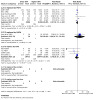
GRADE assessment suggests that reducing saturated fat intake probably makes little or no difference to cardiovascular mortality (moderate‐quality evidence, downgraded once for imprecision).
There was little or no effect of SFA reduction on cardiovascular mortality (RR 0.95, 95% CI 0.80 to 1.12, I² = 30%, 10 RCTs, 53,421 participants, 1096 cardiovascular deaths, Analysis 1.18). This lack of effect was confirmed in sensitivity analyses limiting to trials at low summary risk of bias (Analysis 1.19), explicitly aiming to reduce saturated fat (Analysis 1.20), achieving statistically significant saturated fat reduction (Analysis 1.21), achieving cholesterol reduction (Analysis 1.22), or running fixed‐effect analysis (Analysis 1.24; Analysis 1.25). However, excluding the largest single trial (WHI 2006) suggested that reducing saturated fat intake reduced the risk of CVD mortality (Analysis 1.23).
1.18. Analysis.
Comparison 1: SFA reduction vs usual diet ‐ primary outcomes, Outcome 18: CARDIOVASCULAR MORTALITY
1.19. Analysis.
Comparison 1: SFA reduction vs usual diet ‐ primary outcomes, Outcome 19: CVD mortality, SA low summary risk of bias
1.20. Analysis.
Comparison 1: SFA reduction vs usual diet ‐ primary outcomes, Outcome 20: CVD mortality, SA aim to reduce SFA
1.21. Analysis.
Comparison 1: SFA reduction vs usual diet ‐ primary outcomes, Outcome 21: CVD mortality, SA statistically significant SFA reduction
1.22. Analysis.
Comparison 1: SFA reduction vs usual diet ‐ primary outcomes, Outcome 22: CVD mortality, SA TC reduction
1.24. Analysis.
Comparison 1: SFA reduction vs usual diet ‐ primary outcomes, Outcome 24: CVD mortality, SA Mantel‐Haenszel fixed‐effect
1.25. Analysis.
Comparison 1: SFA reduction vs usual diet ‐ primary outcomes, Outcome 25: CVD mortality, SA Peto fixed‐effect
1.23. Analysis.
Comparison 1: SFA reduction vs usual diet ‐ primary outcomes, Outcome 23: CVD mortality, SA excluding WHI
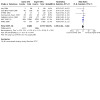
The funnel plot did not suggest small study bias (Figure 4), and the similarity in effect sizes between fixed‐ and random‐effects analysis suggests that small study bias is not important here.
4.
Funnel plot of comparison: fat modification or reduction vs usual diet ‐ cardiovascular mortality
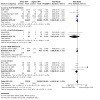
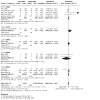
Subgrouping did not suggest important effects of reduced SFA on cardiovascular mortality, regardless of what was substituted for SFA (Analysis 1.26). When subgrouping by main substitution (Analysis 1.27), duration (Analysis 1.28), baseline SFA intake (Analysis 1.29), by difference in SFA (Analysis 1.30), participant sex (Analysis 1.31), baseline CVD risk (Analysis 1.32), or degree of cholesterol reduction (Analysis 1.33), there were no statistically significant differences between subgroups. There was a marginally significant difference between subgroups when ordered by decade of publication, but no clear pattern of effect, so we assumed the effect was probably spurious (Analysis 1.34). Additionally, effects did not appear to relate to statin use, as there was a reduction in risk of CVD mortality in studies published in the 1960s and a marginal increase in risk in the one trial published during the 1970s (although the 95% confidence interval did include 1.0), both well before statins were in common use (the 4S trial which first showed that use of statins reduced mortality was published in 1994, 4S 1994).
1.26. Analysis.
Comparison 1: SFA reduction vs usual diet ‐ primary outcomes, Outcome 26: CVD mortality, subgroup by any substitution
1.27. Analysis.
Comparison 1: SFA reduction vs usual diet ‐ primary outcomes, Outcome 27: CVD mortality, subgroup by main substitution
1.28. Analysis.
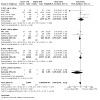
Comparison 1: SFA reduction vs usual diet ‐ primary outcomes, Outcome 28: CVD mortality, subgroup by duration
1.29. Analysis.
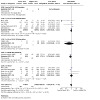
Comparison 1: SFA reduction vs usual diet ‐ primary outcomes, Outcome 29: CVD mortality, subgroup by baseline SFA
1.30. Analysis.
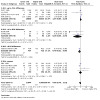
Comparison 1: SFA reduction vs usual diet ‐ primary outcomes, Outcome 30: CVD mortality, subgroup by SFA change
1.31. Analysis.
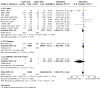
Comparison 1: SFA reduction vs usual diet ‐ primary outcomes, Outcome 31: CVD mortality, subgroup by sex
1.32. Analysis.
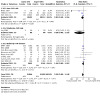
Comparison 1: SFA reduction vs usual diet ‐ primary outcomes, Outcome 32: CVD mortality, subgroup by CVD risk
1.33. Analysis.
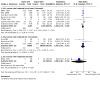
Comparison 1: SFA reduction vs usual diet ‐ primary outcomes, Outcome 33: CVD mortality, subgroup by TC reduction
1.34. Analysis.
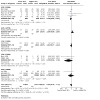
Comparison 1: SFA reduction vs usual diet ‐ primary outcomes, Outcome 34: CVD mortality, subgroup decade of publication
Cardiovascular events
GRADE assessment suggests that reducing SFA intake probably reduces cardiovascular events, to a greater extent with greater cholesterol reduction (moderate‐quality evidence, downgraded once for risk of bias and publication bias combined).
There was a 17% reduction in cardiovascular events in people who had reduced SFA compared with those on higher SFA (RR 0.83, 95% CI 0.70 to 0.98, I² = 67%, 12 RCTs, 53,758 participants, 4538 people with cardiovascular events, Peffect = 0.03, Analysis 1.35). This protective effect was confirmed in sensitivity analyses including only trials that aimed to reduce saturated fat (Analysis 1.37), that significantly reduced saturated fat intake (Analysis 1.38), that achieved a reduction in total or LDL cholesterol (Analysis 1.39), or excluding the largest trial (WHI 2006, Analysis 1.40). Analysing including only trials at low summary risk of bias, or using Mantel‐Haenszel or Peto fixed‐effect analysis suggested more marginal protection(Analysis 1.36; Analysis 1.41; Analysis 1.42).
1.35. Analysis.
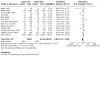
Comparison 1: SFA reduction vs usual diet ‐ primary outcomes, Outcome 35: COMBINED CARDIOVASCULAR EVENTS
1.37. Analysis.
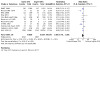
Comparison 1: SFA reduction vs usual diet ‐ primary outcomes, Outcome 37: CVD events, SA aim to reduce SFA
1.38. Analysis.
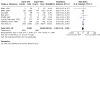
Comparison 1: SFA reduction vs usual diet ‐ primary outcomes, Outcome 38: CVD events, SA statistically significant SFA reduction
1.39. Analysis.
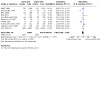
Comparison 1: SFA reduction vs usual diet ‐ primary outcomes, Outcome 39: CVD events, SA TC reduction
1.40. Analysis.
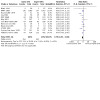
Comparison 1: SFA reduction vs usual diet ‐ primary outcomes, Outcome 40: CVD events, SA excluding WHI
1.36. Analysis.
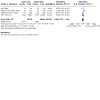
Comparison 1: SFA reduction vs usual diet ‐ primary outcomes, Outcome 36: CVD events, SA low summary risk of bias
1.41. Analysis.
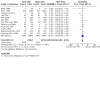
Comparison 1: SFA reduction vs usual diet ‐ primary outcomes, Outcome 41: CVD events, SA Mantel‐Haenszel fixed‐effect
1.42. Analysis.
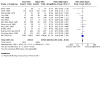
Comparison 1: SFA reduction vs usual diet ‐ primary outcomes, Outcome 42: CVD events, SA Peto fixed‐effect
A funnel plot did not suggest severe small‐study bias (Figure 5), but fixed‐effect analyses suggested slightly smaller effects (Analysis 1.41; Analysis 1.42), suggesting that smaller studies with more cardiovascular events in the intervention groups may be missing. Adding any such studies back would tend to moderate the protective effect of reducing SFA.
5.
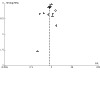
Funnel plot of comparison: fat modification or reduction vs usual diet ‐ combined cardiovascular events.
Sensitivity analysis omitting trials which included dietary interventions in addition to changes to dietary fat (for example, changes to fruit and vegetable or fibre intake) we excluded three trials (Oslo Diet‐Heart 1966; STARS 1992; WHI 2006). This analysis also suggested that reducing saturated fat (rather than other dietary changes) reduced risk of cardiovascular events: RR 0.86 (95% CI 0.67 to 1.09, Analysis 1.43).
1.43. Analysis.
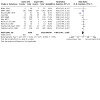
Comparison 1: SFA reduction vs usual diet ‐ primary outcomes, Outcome 43: CVD events, SA excluding trials with additional interventions
When we subgrouped according to replacement for SFA, the PUFA replacement group suggested a 21% reduction in cardiovascular events, a 16% reduction in studies replacing SFA with carbohydrate, and little or no effect of other replacements, but without statistically significant effects between subgroups (Analysis 1.44). Similarly, there were no statistically significant differences between subgroups by main replacement (Analysis 1.45), by study duration (Analysis 1.46), in men or women (Analysis 1.49) or by baseline CVD risk (Analysis 1.50). When subgrouping, there was a suggestion of greater effects when baseline SFA was higher (Analysis 1.47), with greater reduction of SFA (Analysis 1.48), and with greater cholesterol reduction (Analysis 1.51). There were different effects by decade of publication, but no suggestion of a trend or a change following wider introduction of statins in the mid‐1990s (Analysis 1.52).
1.44. Analysis.
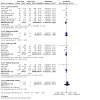
Comparison 1: SFA reduction vs usual diet ‐ primary outcomes, Outcome 44: CVD events, subgroup by any substitution
1.45. Analysis.
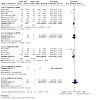
Comparison 1: SFA reduction vs usual diet ‐ primary outcomes, Outcome 45: CVD events, subgroup by main substitution
1.46. Analysis.
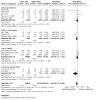
Comparison 1: SFA reduction vs usual diet ‐ primary outcomes, Outcome 46: CVD events, subgroup by duration
1.49. Analysis.
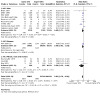
Comparison 1: SFA reduction vs usual diet ‐ primary outcomes, Outcome 49: CVD events, subgroup by sex
1.50. Analysis.
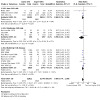
Comparison 1: SFA reduction vs usual diet ‐ primary outcomes, Outcome 50: CVD events, subgroup by CVD risk
1.47. Analysis.
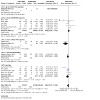
Comparison 1: SFA reduction vs usual diet ‐ primary outcomes, Outcome 47: CVD events, subgroup by baseline SFA
1.48. Analysis.
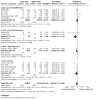
Comparison 1: SFA reduction vs usual diet ‐ primary outcomes, Outcome 48: CVD events, subgroup by SFA change
1.51. Analysis.
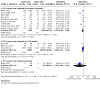
Comparison 1: SFA reduction vs usual diet ‐ primary outcomes, Outcome 51: CVD events, subgroup by TC reduction
1.52. Analysis.
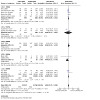
Comparison 1: SFA reduction vs usual diet ‐ primary outcomes, Outcome 52: CVD events, subgroup decade of publication
We further explored the effects of dietary fats on cardiovascular events, by using meta‐regression of the difference between the control and intervention of total fat intake, SFA intake, MUFA intake, PUFA intake, CHO intake (all by percentage of energy (%E)), serum total cholesterol (in mmol/L) achieved in trials, as well as baseline SFA intake, sex, study duration in months, and CVD risk of participants at baseline (Table 5). As we included only 13 studies for this outcome, we ran meta‐regressions exploring single explanatory factors at once, and as data were limited, with many studies not reporting dietary intake data, these analyses were limited in power to assess outcomes. The data suggested that greater reductions in total serum cholesterol levels reduced CVD events more. Greater baseline SFA intake and greater reduction in SFA were also associated with greater improvement in CVD events with SFA reduction, and increases in PUFA and MUFA intakes were slightly protective of CVD events, but none of these relationships were statistically significant. Overall, the relationship with serum total cholesterol was clearest (P = 0.04, accounting for 99% of between‐study variation). Sex, study duration and baseline cardiovascular risk did not appear to influence effect size. Apparent heterogeneity was accounted for by a dose‐effect; where SFA reduction resulted in greater serum cholesterol reduction, the reduction in CVD events was greater.
4. Meta‐regression of effects of SFA reduction on cardiovascular events.
| Regression factor | No. of studies | Constant | Coefficient (95% CI) | P value | Proportion of between study variation explained |
| Change in SFA as %E | 8 | 0.01 | 0.05 (‐0.03 to 0.13) | 0.16 | 89% |
| Change in SFA as % of control | 8 | 0.26 | 0.01 (‐0.01 to 0.03) | 0.14 | 89% |
| Baseline SFA as %E | 8 | 0.68 | ‐0.06 (‐0.15 to 0.04) | 0.19 | 81% |
| Change in TC, mmol/L | 12 | 0.03 | 0.69 (0.05 to 1.33) | 0.04 | 99% |
| Change in PUFA as %E | 5 | ‐0.01 | ‐0.02 (‐0.08 to 0.03) | 0.25 | 100% |
| Change in MUFA as %E | 5 | ‐0.26 | ‐0.03 (‐0.14 to 0.09) | 0.50 | ‐87% |
| Change in CHO as %E | 7 | ‐0.11 | ‐0.00 (‐0.05 to 0.05) | 0.92 | ‐273% |
| Change in total fat intake as %E | 9 | ‐0.17 | ‐0.01 (‐0.03 to 0.01) | 0.28 | 100% |
| Gender* | 13 | ‐0.17 | ‐0.14 (‐0.63 to 0.35) | 0.55 | ‐13% |
| Study duration | 13 | ‐0.47 | 0.00 (‐0.01 to 0.02) | 0.76 | ‐24.8% |
| CVD risk at baseline** | 13 | ‐0.44 | 0.03 (‐0.48 to 0.55) | 0.89 | ‐39% |
*Gender was coded as follows: 0 = women, 1 = mixed, 2 = men **CVD risk at baseline was coded as follows: 1 = Low CVD risk, 2 = Moderate CVD risk, 3 = existing CVD CHO: carbohydrate CI: confidence interval CVD: cardiovascular disease E: energy MUFA: monounsaturated fatty acid PUFA: polyunsaturated fatty fat SFA: saturated fatty acid TC: total cholesterol
This 17% reduction in risk of CVD events translated into a number needed to treat for an additional beneficial outcome (NNTB) of 56 in primary prevention trials, so that 56 people need to reduce their saturated fat intake over around four years for one person to avoid experiencing a CVD event. In secondary prevention trials, the NNTB was 53.
Secondary outcomes ‐ health events
Myocardial Infarction (fatal and non‐fatal)
GRADE assessment suggested that the effect of reducing saturated fat intake on risk of myocardial infarction is unclear as the evidence was of very low‐quality (downgraded once each for risk of bias, imprecision and publication bias).
There was a small protective effect of SFA reduction on myocardial infarction (fatal and non‐fatal, RR 0.90, 95% CI 0.80 to 1.01, I² = 10%, 10 RCTs (11 comparisons) including 53,167 participants, 1714 people experiencing MI, Analysis 2.1). This protective effect was slightly modified in sensitivity analyses, and confirmed in analyses limited to trials that aimed to reduce saturated fat (Analysis 2.3), that achieved a reduction in total or LDL cholesterol (Analysis 2.5), and excluding the largest trial (WHI 2006, Analysis 2.6). Sensitivity analyses including only trials at low summary risk of bias (RR 0.93, 95% CI 0.81 to 1.08, Analysis 2.2), that significantly reduced saturated fat intake (Analysis 2.4), analysed using Mantel‐Haenszel or Peto fixed‐effect analysis (Analysis 2.7; Analysis 2.8) suggested little or no effect, though risk ratios were still all < 1.0.
2.1. Analysis.
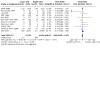
Comparison 2: SFA reduction vs usual diet ‐ secondary health events, Outcome 1: MYOCARDIAL INFARCTION
2.3. Analysis.
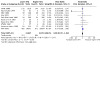
Comparison 2: SFA reduction vs usual diet ‐ secondary health events, Outcome 3: MI, SA aim to reduce SFA
2.5. Analysis.
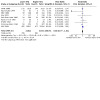
Comparison 2: SFA reduction vs usual diet ‐ secondary health events, Outcome 5: MI, SA by TC reduction
2.6. Analysis.
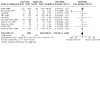
Comparison 2: SFA reduction vs usual diet ‐ secondary health events, Outcome 6: MI, SA excluding WHI
2.2. Analysis.
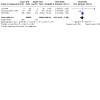
Comparison 2: SFA reduction vs usual diet ‐ secondary health events, Outcome 2: MI, SA by low summary risk of bias
2.4. Analysis.
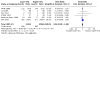
Comparison 2: SFA reduction vs usual diet ‐ secondary health events, Outcome 4: MI, SA statistically significant SFA reduction
2.7. Analysis.
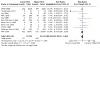
Comparison 2: SFA reduction vs usual diet ‐ secondary health events, Outcome 7: MI, SA Mantel‐Haenszel fixed‐effect
2.8. Analysis.
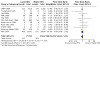
Comparison 2: SFA reduction vs usual diet ‐ secondary health events, Outcome 8: MI, SA Peto fixed‐effect
The funnel plot was difficult to interpret, but did not raise major concerns about small‐study bias (not shown). While effects of random‐ and fixed‐effect meta‐analysis were only slightly different, they fell each side of the line suggesting an effect (Analysis 2.7; Analysis 2.8). There may be a small amount of small study bias.
The protective effect of replacing SFA with PUFA appeared to explain the reduction in MI (Analysis 2.9), but there were no statistically significant differences between subgroups by replacement (Analysis 2.10), duration (Analysis 2.11), baseline SFA intake (Analysis 2.12), change in SFA intake (Analysis 2.13), participant sex (Analysis 2.14), baseline CVD risk (Analysis 2.15), cholesterol reduction (Analysis 2.16) or decade of publication (Analysis 2.17).
2.9. Analysis.
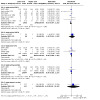
Comparison 2: SFA reduction vs usual diet ‐ secondary health events, Outcome 9: MI, subgroup by any substitution
2.10. Analysis.
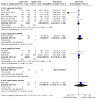
Comparison 2: SFA reduction vs usual diet ‐ secondary health events, Outcome 10: MI, subgroup by main substitution
2.11. Analysis.
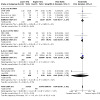
Comparison 2: SFA reduction vs usual diet ‐ secondary health events, Outcome 11: MI, subgroup by duration
2.12. Analysis.
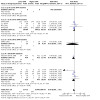
Comparison 2: SFA reduction vs usual diet ‐ secondary health events, Outcome 12: MI, subgroup by baseline SFA
2.13. Analysis.
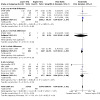
Comparison 2: SFA reduction vs usual diet ‐ secondary health events, Outcome 13: MI, subgroup by SFA change
2.14. Analysis.
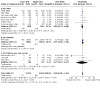
Comparison 2: SFA reduction vs usual diet ‐ secondary health events, Outcome 14: MI, subgroup by sex
2.15. Analysis.
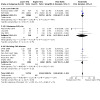
Comparison 2: SFA reduction vs usual diet ‐ secondary health events, Outcome 15: MI, subgroup by CVD risk
2.16. Analysis.
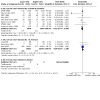
Comparison 2: SFA reduction vs usual diet ‐ secondary health events, Outcome 16: MI, subgroup by TC reduction
2.17. Analysis.
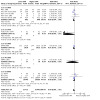
Comparison 2: SFA reduction vs usual diet ‐ secondary health events, Outcome 17: MI, subgroup decade of publication
Myocardial Infarction (non‐fatal only)
GRADE assessment suggests that reducing saturated fat may have little or no effect on risk of non‐fatal myocardial infarction (low‐quality evidence, downgraded once each for risk of bias and imprecision).
There was no clear effect of SFA reduction compared to usual diet on non‐fatal myocardial infarction (RR 0.97, 95% CI 0.87 to 1.07, I² = 0%, 7 RCTs, 52,834 participants, 1385 people with at least one non‐fatal MI, Analysis 2.18). This lack of effect was not altered in sensitivity analyses retaining only those that aimed to reduce SFA (Analysis 2.20), those showing a reduction in serum cholesterol (Analysis 2.22), or fixed‐effect analysis (Analysis 2.24; Analysis 2.25). However, sensitivity analyses retaining only trials at low summary risk of bias (RR 0.89, 95% CI 0.58 to 1.35, Analysis 2.19), those showing a significant reduction in SFA (Analysis 2.21), and omitting the largest trial (WHI 2006, Analysis 2.23) all suggested a reduction in non‐fatal MI with reduced SFA.
2.18. Analysis.

Comparison 2: SFA reduction vs usual diet ‐ secondary health events, Outcome 18: NON‐FATAL MYOCARDIAL INFARCTION
2.20. Analysis.
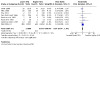
Comparison 2: SFA reduction vs usual diet ‐ secondary health events, Outcome 20: Non‐fatal MI, SA aim to reduce SFA
2.22. Analysis.
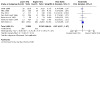
Comparison 2: SFA reduction vs usual diet ‐ secondary health events, Outcome 22: Non‐fatal MI, SA by TC reduction
2.24. Analysis.
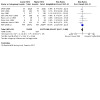
Comparison 2: SFA reduction vs usual diet ‐ secondary health events, Outcome 24: Non‐fatal MI, SA Mantel‐Haenszel fixed‐effect
2.25. Analysis.
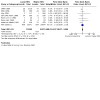
Comparison 2: SFA reduction vs usual diet ‐ secondary health events, Outcome 25: Non‐fatal MI, SA Peto fixed‐effect
2.19. Analysis.
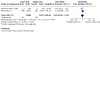
Comparison 2: SFA reduction vs usual diet ‐ secondary health events, Outcome 19: Non‐fatal MI, SA by low summary risk of bias
2.21. Analysis.
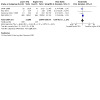
Comparison 2: SFA reduction vs usual diet ‐ secondary health events, Outcome 21: Non‐fatal MI, SA statistically significant SFA reduction
2.23. Analysis.
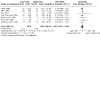
Comparison 2: SFA reduction vs usual diet ‐ secondary health events, Outcome 23: Non‐fatal MI, SA excluding WHI
The funnel plot did not raise major concerns about small‐study bias (not shown), and effects of fixed‐ and random‐effects analyses were very similar, reinforcing the lack of small study bias.
Subgrouping by any replacement for SFA suggested reductions in non‐fatal MI when replaced by PUFA, but not other replacements (Analysis 2.26). Subgrouping by main substitution (Analysis 2.27), duration (Analysis 2.28), baseline SFA intake (Analysis 2.29), degree of SFA reduction (Analysis 2.30), sex (Analysis 2.31), baseline CVD risk (Analysis 2.32), degree of cholesterol reduction (Analysis 2.33) and decade of publication (Analysis 2.34) did not suggest significant differences between subgroups.
2.26. Analysis.
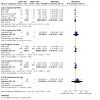
Comparison 2: SFA reduction vs usual diet ‐ secondary health events, Outcome 26: Non‐fatal MI, subgroup by any substitution
2.27. Analysis.
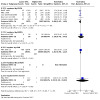
Comparison 2: SFA reduction vs usual diet ‐ secondary health events, Outcome 27: Non‐fatal MI, subgroup by main substitution
2.28. Analysis.
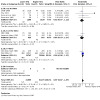
Comparison 2: SFA reduction vs usual diet ‐ secondary health events, Outcome 28: Non‐fatal MI, subgroup by duration
2.29. Analysis.
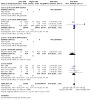
Comparison 2: SFA reduction vs usual diet ‐ secondary health events, Outcome 29: Non‐fatal MI, subgroup by baseline SFA
2.30. Analysis.
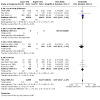
Comparison 2: SFA reduction vs usual diet ‐ secondary health events, Outcome 30: Non‐fatal MI, subgroup by SFA change
2.31. Analysis.
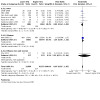
Comparison 2: SFA reduction vs usual diet ‐ secondary health events, Outcome 31: Non‐fatal MI, subgroup by sex
2.32. Analysis.
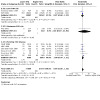
Comparison 2: SFA reduction vs usual diet ‐ secondary health events, Outcome 32: Non‐fatal MI, subgroup by CVD risk
2.33. Analysis.
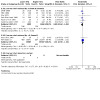
Comparison 2: SFA reduction vs usual diet ‐ secondary health events, Outcome 33: Non‐fatal MI, subgroup by TC reduction
2.34. Analysis.
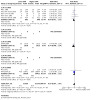
Comparison 2: SFA reduction vs usual diet ‐ secondary health events, Outcome 34: Non‐fatal MI, subgroup decade of publication
Stroke (any type, fatal or non‐fatal)
GRADE assessment suggests that the effect of reducing SFA intake on stroke is unclear as the evidence is of very low‐quality (downgraded twice for imprecision and once for risk of bias).
As data on stroke were sparse, it was not possible to tease out differential effects on ischaemic or haemorrhagic strokes, or whether a stroke was fatal. For this analysis, we combined all stroke data from any study. There was little or no effect of SFA reduction compared to usual diet on stroke of any type with any outcome (RR 0.92, 95% CI 0.68 to 1.25, I² = 9%, 7 RCTs, 50,952 participants, 1118 people with stroke, Analysis 2.35). This lack of effect was not altered in sensitivity analyses retaining only those that aimed to reduce SFA (Analysis 2.37), those showing a reduction in serum cholesterol (Analysis 2.39), or fixed‐effect analysis (Analysis 2.41; Analysis 2.42). However, for sensitivity analyses retaining only trials at low summary risk of bias (RR 0.76, 95% CI 0.42 to 1.38, Analysis 2.36), those showing a significant reduction in SFA (Analysis 2.38), and omitting the largest trial (WHI 2006, Analysis 2.40) the best estimate of effect always suggested a reduction in stroke with reduced SFA, though they were not statistically significant.
2.35. Analysis.
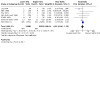
Comparison 2: SFA reduction vs usual diet ‐ secondary health events, Outcome 35: STROKE
2.37. Analysis.
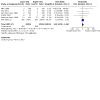
Comparison 2: SFA reduction vs usual diet ‐ secondary health events, Outcome 37: Stroke, SA aim to reduce SFA
2.39. Analysis.

Comparison 2: SFA reduction vs usual diet ‐ secondary health events, Outcome 39: Stroke, SA by TC reduction
2.41. Analysis.
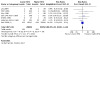
Comparison 2: SFA reduction vs usual diet ‐ secondary health events, Outcome 41: Stroke, SA Mantel‐Haenszel fixed‐effect
2.42. Analysis.
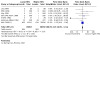
Comparison 2: SFA reduction vs usual diet ‐ secondary health events, Outcome 42: Stroke, SA Peto fixed‐effect
2.36. Analysis.
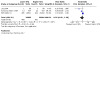
Comparison 2: SFA reduction vs usual diet ‐ secondary health events, Outcome 36: Stroke, SA by low summary risk of bias
2.38. Analysis.
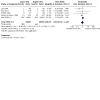
Comparison 2: SFA reduction vs usual diet ‐ secondary health events, Outcome 38: Stroke, SA statistically significant SFA reduction
2.40. Analysis.
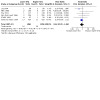
Comparison 2: SFA reduction vs usual diet ‐ secondary health events, Outcome 40: Stroke, SA excluding WHI
We did not create a funnel plot as the analysis only included data from seven RCTs, however RRs generated using fixed‐effect analyses were much closer to 1.0 than the random‐effects meta‐analysis (suggesting a small amount of publication bias), though both suggested little or no effect.
Subgrouping by any substitution for SFA suggested reduction in risk of stroke whether SFA was replaced by PUFA, CHO or protein (Analysis 2.43). Subgrouping did not suggest significant differences between subgroups by main substitution (Analysis 2.44), duration (Analysis 2.62), baseline SFA (Analysis 2.46), SFA change (Analysis 2.47), sex (Analysis 2.48), CVD risk (Analysis 2.49), cholesterol reduction (Analysis 2.50) or decade of publication (Analysis 2.51).
2.43. Analysis.
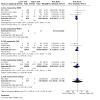
Comparison 2: SFA reduction vs usual diet ‐ secondary health events, Outcome 43: Stroke, subgroup by any substitution
2.44. Analysis.
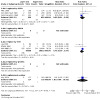
Comparison 2: SFA reduction vs usual diet ‐ secondary health events, Outcome 44: Stroke, subgroup by main substitution
2.62. Analysis.
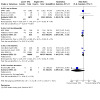
Comparison 2: SFA reduction vs usual diet ‐ secondary health events, Outcome 62: CHD mortality, subgroup by duration
2.46. Analysis.
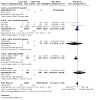
Comparison 2: SFA reduction vs usual diet ‐ secondary health events, Outcome 46: Stroke, subgroup by baseline SFA
2.47. Analysis.
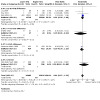
Comparison 2: SFA reduction vs usual diet ‐ secondary health events, Outcome 47: Stroke, subgroup by SFA change
2.48. Analysis.
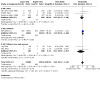
Comparison 2: SFA reduction vs usual diet ‐ secondary health events, Outcome 48: Stroke, subgroup by sex
2.49. Analysis.
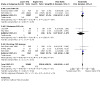
Comparison 2: SFA reduction vs usual diet ‐ secondary health events, Outcome 49: Stroke, subgroup by CVD risk
2.50. Analysis.
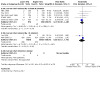
Comparison 2: SFA reduction vs usual diet ‐ secondary health events, Outcome 50: Stroke, subgroup by TC reduction
2.51. Analysis.
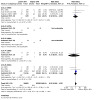
Comparison 2: SFA reduction vs usual diet ‐ secondary health events, Outcome 51: Stroke, subgroup decade of publication
Coronary heart disease (CHD) mortality
GRADE assessment suggests that reducing saturated fat intake may have little or no effect on CHD mortality (low‐quality evidence, downgraded twice for imprecision).
Eight RCTs (9 comparisons) suggest little or no effect of reducing saturated fat on risk of CHD mortality (RR 0.97, 95% CI 0.82 to 1.16, I² = 28%, 53,159 participants, 927 people died of coronary heart disease, Analysis 2.52), and this was not altered in any sensitivity analyses (Analysis 2.53; Analysis 2.54; Analysis 2.55; Analysis 2.56; Analysis 2.57; Analysis 2.58; Analysis 2.59).
2.52. Analysis.

Comparison 2: SFA reduction vs usual diet ‐ secondary health events, Outcome 52: CORONARY HEART DISEASE MORTALITY
2.53. Analysis.
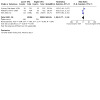
Comparison 2: SFA reduction vs usual diet ‐ secondary health events, Outcome 53: CHD mortality, SA by low summary risk of bias
2.54. Analysis.
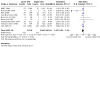
Comparison 2: SFA reduction vs usual diet ‐ secondary health events, Outcome 54: CHD mortality, SA aim to reduce SFA
2.55. Analysis.
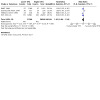
Comparison 2: SFA reduction vs usual diet ‐ secondary health events, Outcome 55: CHD mortality, SA statistically significant SFA reduction
2.56. Analysis.

Comparison 2: SFA reduction vs usual diet ‐ secondary health events, Outcome 56: CHD mortality, SA by TC reduction
2.57. Analysis.
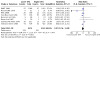
Comparison 2: SFA reduction vs usual diet ‐ secondary health events, Outcome 57: CHD mortality, SA excluding WHI
2.58. Analysis.
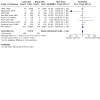
Comparison 2: SFA reduction vs usual diet ‐ secondary health events, Outcome 58: CHD mortality, SA Mantel‐Haenszel fixed‐effect
2.59. Analysis.
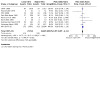
Comparison 2: SFA reduction vs usual diet ‐ secondary health events, Outcome 59: CHD mortality, SA Peto fixed‐effect
We did not create a funnel plot as the analysis only included data from seven RCTs, but the results of fixed‐ and random‐effects analyses were nearly identical, suggesting that small study bias is not an issue here.
There was no suggestion of an effect of reducing SFA on CHD mortality regardless of what replaced the SFA (Analysis 2.60). There were no statistically significant differences between subgrouping in any analysis (Analysis 2.61; Analysis 2.62; Analysis 2.63; Analysis 2.64; Analysis 2.65; Analysis 2.66; Analysis 2.67; Analysis 2.68).
2.60. Analysis.
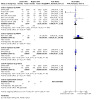
Comparison 2: SFA reduction vs usual diet ‐ secondary health events, Outcome 60: CHD mortality, subgroup by any substitution
2.61. Analysis.
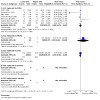
Comparison 2: SFA reduction vs usual diet ‐ secondary health events, Outcome 61: CHD mortality, subgroup by main substitution
2.63. Analysis.
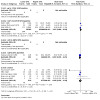
Comparison 2: SFA reduction vs usual diet ‐ secondary health events, Outcome 63: CHD mortality, subgroup by baseline SFA
2.64. Analysis.
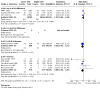
Comparison 2: SFA reduction vs usual diet ‐ secondary health events, Outcome 64: CHD mortality, subgroup by SFA change
2.65. Analysis.
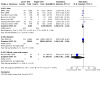
Comparison 2: SFA reduction vs usual diet ‐ secondary health events, Outcome 65: CHD mortality, subgroup by sex
2.66. Analysis.
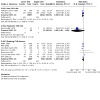
Comparison 2: SFA reduction vs usual diet ‐ secondary health events, Outcome 66: CHD mortality, subgroup by CVD risk
2.67. Analysis.
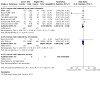
Comparison 2: SFA reduction vs usual diet ‐ secondary health events, Outcome 67: CHD mortality, subgroup by TC reduction
2.68. Analysis.
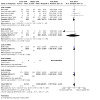
Comparison 2: SFA reduction vs usual diet ‐ secondary health events, Outcome 68: CHD mortality, subgroup decade of publication
Coronary heart disease events
GRADE assessment suggested that the effect of reducing saturated fat on CHD events is unclear as the evidence is of very low‐quality (downgraded once each for imprecision, risk of bias and inconsistency).
There was the suggestion of a 17% reduction in CHD events as a result of saturated fat reduction in the main analysis (RR 0.83, 95% CI 0.68 to 1.01, I² = 62%, 53,199 participants, 2261 people had at least one coronary heart disease event in 10 RCTs, Analysis 2.69). This did not differ in sensitivity analyses (Analysis 2.74; Analysis 2.72; Analysis 2.73; Analysis 2.71; Analysis 2.75; Analysis 2.76) except when limiting to trials at low summary risk of bias (RR 0.92, 95% CI 0.77 to 1.10, Analysis 2.70).
2.69. Analysis.
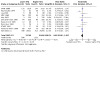
Comparison 2: SFA reduction vs usual diet ‐ secondary health events, Outcome 69: CORONARY HEART DISEASE EVENTS
2.74. Analysis.
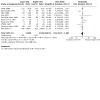
Comparison 2: SFA reduction vs usual diet ‐ secondary health events, Outcome 74: CHD events, SA aim to reduce SFA
2.72. Analysis.
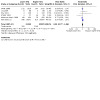
Comparison 2: SFA reduction vs usual diet ‐ secondary health events, Outcome 72: CHD events, SA statistically significant SFA reduction
2.73. Analysis.
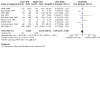
Comparison 2: SFA reduction vs usual diet ‐ secondary health events, Outcome 73: CHD events, SA by TC reduction
2.71. Analysis.
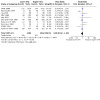
Comparison 2: SFA reduction vs usual diet ‐ secondary health events, Outcome 71: CHD events, SA excluding WHI
2.75. Analysis.
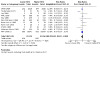
Comparison 2: SFA reduction vs usual diet ‐ secondary health events, Outcome 75: CHD events, SA Mantel‐Haenszel fixed‐effect
2.76. Analysis.
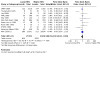
Comparison 2: SFA reduction vs usual diet ‐ secondary health events, Outcome 76: CHD events, SA Peto fixed‐effect
2.70. Analysis.
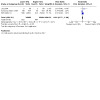
Comparison 2: SFA reduction vs usual diet ‐ secondary health events, Outcome 70: CHD events, SA by low summary risk of bias
The funnel plot did not appear unbalanced, and the results of fixed‐ and random‐effects analyses were different, though both suggested that reducing SFA resulted in lower risk of CHD.
Subgrouping by any replacement for SFA suggested that replacement by PUFA may lead to reduced risk of CHD events (Analysis 2.77). There were no statistically significant differences between any other subgroups (Analysis 2.78; Analysis 2.79; Analysis 2.80; Analysis 2.81; Analysis 2.82; Analysis 2.83; Analysis 2.84) except by decade of publication, though this did not suggest any sequence or step change (Analysis 2.85).
2.77. Analysis.
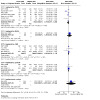
Comparison 2: SFA reduction vs usual diet ‐ secondary health events, Outcome 77: CHD events, subgroup by any substitution
2.78. Analysis.
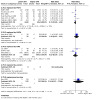
Comparison 2: SFA reduction vs usual diet ‐ secondary health events, Outcome 78: CHD events, subgroup by main substitution
2.79. Analysis.
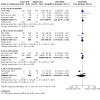
Comparison 2: SFA reduction vs usual diet ‐ secondary health events, Outcome 79: CHD events, subgroup by duration
2.80. Analysis.
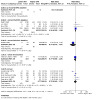
Comparison 2: SFA reduction vs usual diet ‐ secondary health events, Outcome 80: CHD events, subgroup by baseline SFA
2.81. Analysis.
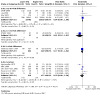
Comparison 2: SFA reduction vs usual diet ‐ secondary health events, Outcome 81: CHD events, subgroup by SFA change
2.82. Analysis.
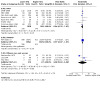
Comparison 2: SFA reduction vs usual diet ‐ secondary health events, Outcome 82: CHD events, subgroup by sex
2.83. Analysis.
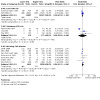
Comparison 2: SFA reduction vs usual diet ‐ secondary health events, Outcome 83: CHD events, subgroup by CVD risk
2.84. Analysis.
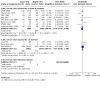
Comparison 2: SFA reduction vs usual diet ‐ secondary health events, Outcome 84: CHD events, subgroup by TC reduction
2.85. Analysis.
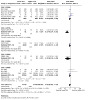
Comparison 2: SFA reduction vs usual diet ‐ secondary health events, Outcome 85: CHD events, subgroup decade of publication
Type 2 diabetes, new diagnoses
Only one RCT reported on diagnosis of diabetes (WHI 2006). There was little or no effect of reducing SFA intakes on diagnosis of diabetes in this study (RR 0.96, 95% CI 0.90 to 1.02, 48,835 participants, 3342 developed diabetes, Analysis 2.86). WHI 2006 was assessed at low summary risk of bias, aimed to reduce SFA, and demonstrated significant SFA and cholesterol reduction. With only one trial, we were not able to assess publication bias or carry out subgrouping.
2.86. Analysis.

Comparison 2: SFA reduction vs usual diet ‐ secondary health events, Outcome 86: DIABETES DIAGNOSES
Secondary outcomes ‐ blood levels
Serum blood lipids
Total cholesterol (TC): There was a reduction in TC in participants with reduced SFA compared to higher SFA (mean difference (MD) ‐0.24 mmol/L, 95% CI ‐0.36 to ‐0.13, I² = 60%, 13 RCTs, 7115 participants, Analysis 3.1). We did not conduct sensitivity analyses or most subgroupings on secondary outcomes, but there was no clear differential effect on TC depending on the replacement for SFA (PUFA, MUFA, CHO or a mixture, Analysis 3.2; Analysis 3.3). The funnel plot did not raise concerns about small‐study bias (not shown).
3.1. Analysis.
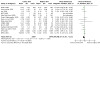
Comparison 3: SFA reduction vs usual diet ‐ secondary blood outcomes, Outcome 1: Total cholesterol, mmol/L
3.2. Analysis.
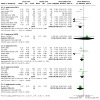
Comparison 3: SFA reduction vs usual diet ‐ secondary blood outcomes, Outcome 2: TC, mmol/L, subgroup by any replacement
3.3. Analysis.
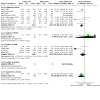
Comparison 3: SFA reduction vs usual diet ‐ secondary blood outcomes, Outcome 3: TC, mmol/L, subgroup by main replacement
Low‐density lipoprotein (LDL): There was a reduction in LDL in participants with reduced SFA compared to higher SFA (MD ‐0.19 mmol/L, 95% CI ‐0.33 to ‐0.05, I² = 37%, 5 RCTs, 3291 participants, Analysis 3.4). There was no clear differential effect on LDL depending on the replacement for SFA (PUFA, MUFA, CHO or a mixture, Analysis 3.5; Analysis 3.6). We could not interpret the funnel plot due to sparsity of studies (not shown).
3.4. Analysis.
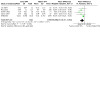
Comparison 3: SFA reduction vs usual diet ‐ secondary blood outcomes, Outcome 4: LDL cholesterol, mmol/L
3.5. Analysis.
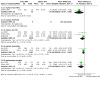
Comparison 3: SFA reduction vs usual diet ‐ secondary blood outcomes, Outcome 5: LDL, mmol/L, subgroup by any replacement
3.6. Analysis.
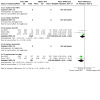
Comparison 3: SFA reduction vs usual diet ‐ secondary blood outcomes, Outcome 6: LDL, mmol/L, subgroup by main replacement
High‐density lipoprotein (HDL): There was little or no effect of reducing SFA intakes on HDL (MD ‐0.01 mmol/L, 95% CI ‐0.02 to 0.01, I² = 0%, 7 RCTs, 5147 participants, Analysis 3.7). There was no clear differential effect on HDL depending on the replacement for SFA (PUFA, MUFA, CHO or a mixture, Analysis 3.8; Analysis 3.9). We could not interpret the funnel plot due to sparsity of studies (not shown).
3.7. Analysis.
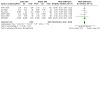
Comparison 3: SFA reduction vs usual diet ‐ secondary blood outcomes, Outcome 7: HDL cholesterol, mmol/L
3.8. Analysis.
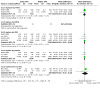
Comparison 3: SFA reduction vs usual diet ‐ secondary blood outcomes, Outcome 8: HDL, mmol/L, subgroup by any replacement
3.9. Analysis.
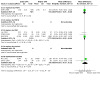
Comparison 3: SFA reduction vs usual diet ‐ secondary blood outcomes, Outcome 9: HDL, mmol/L, subgroup by main replacement
Triglycerides (TG): There was little or no effect of reducing SFA intakes on TG (MD ‐0.08 mmol/L, 95% CI ‐0.21 to 0.04, I² = 51%, 7 RCTs, 3845 participants, Analysis 3.10). There was no clear differential effect on TG depending on the replacement for SFA (PUFA, MUFA, CHO or a mixture, Analysis 3.11; Analysis 3.12). We could not interpret the funnel plot due to sparsity of studies (not shown).
3.10. Analysis.
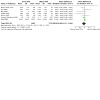
Comparison 3: SFA reduction vs usual diet ‐ secondary blood outcomes, Outcome 10: Triglycerides, mmol/L
3.11. Analysis.
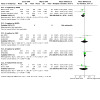
Comparison 3: SFA reduction vs usual diet ‐ secondary blood outcomes, Outcome 11: TG, mmol/L, subgroup by any replacement
3.12. Analysis.
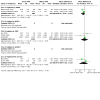
Comparison 3: SFA reduction vs usual diet ‐ secondary blood outcomes, Outcome 12: TG, mmol/L, subgroup by main replacement
TG/HDL ratio: We did not find any studies that reported TG/HDL ratio.
TC/HDL ratio: Only three RCTs reported on TC/HDL ratio. There was little or no effect of reducing SFA intakes on TC/HDL (MD ‐0.10, 95% CI ‐0.33 to 0.13, I² = 24%, 2985 participants, Analysis 3.13). There were no clear differential effects of replacement on TC/HDL (Analysis 3.14; Analysis 3.15). We could not interpret the funnel plot due to sparsity of studies (not shown).
3.13. Analysis.
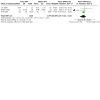
Comparison 3: SFA reduction vs usual diet ‐ secondary blood outcomes, Outcome 13: total cholesterol /HDL ratio
3.14. Analysis.
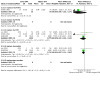
Comparison 3: SFA reduction vs usual diet ‐ secondary blood outcomes, Outcome 14: TC /HDL ratio, subgroup by any replacement
3.15. Analysis.
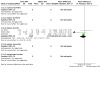
Comparison 3: SFA reduction vs usual diet ‐ secondary blood outcomes, Outcome 15: TC /HDL ratio, subgroup by main replacement
LDL/HDL ratio: Only one RCT reported on LDL/HDL ratio. There was no clear effect of reducing SFA intakes on LDL/HDL in this study (MD ‐0.36, 95% CI ‐0.92 to 0.20, 50 participants, Analysis 3.16). This study replaced SFA with CHO (mainly) and PUFA.
3.16. Analysis.
Comparison 3: SFA reduction vs usual diet ‐ secondary blood outcomes, Outcome 16: LDL /HDL ratio
Lipoprotein (a) (Lp(a)): Only two RCTs reported on lipoprotein (a), but these included 28,820 participants. There was little or no effect of reducing SFA intakes on Lp(a) (MD 0.00, 95% CI ‐0.00 to 0.00, I² = 0%, Analysis 3.17). There was no suggestion of differential effects of replacement on Lp(a) (Analysis 3.18; Analysis 3.19). We could not interpret the funnel plot due to sparsity of studies (not shown).
3.17. Analysis.
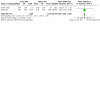
Comparison 3: SFA reduction vs usual diet ‐ secondary blood outcomes, Outcome 17: Lp(a), mmol/L
3.18. Analysis.
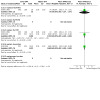
Comparison 3: SFA reduction vs usual diet ‐ secondary blood outcomes, Outcome 18: Lp(a), mmol/L, subgroup by any replacement
3.19. Analysis.
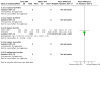
Comparison 3: SFA reduction vs usual diet ‐ secondary blood outcomes, Outcome 19: Lp(a), mmol/L, subgroup by main replacement
Homeostatic model assessment (HOMA): Only one RCT reported on the effects of reducing SFA on insulin resistance using HOMA. There was little or no effect of reducing SFA intakes compared to usual diet on HOMA in this study (MD ‐0.00, 95% CI ‐0.04 to 0.04, 2832 participants, Analysis 3.20).
3.20. Analysis.
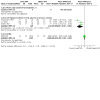
Comparison 3: SFA reduction vs usual diet ‐ secondary blood outcomes, Outcome 20: Insulin sensitivity
Glucose at two hours post‐glucose tolerance test (GTT): Only three RCTs reported on glucose two hours post‐GTT. There was a reduction in glucose after reducing SFA intakes compared to usual diet (MD ‐1.69 mmol/L, 95% CI ‐2.55 to ‐0.82, I² = 45%, 249 participants, Analysis 3.20). We could not interpret the funnel plot due to sparsity of studies (not shown).
HbA1c (glycosylated haemoglobin): HbA1c was not measured in any included RCT.
Secondary outcomes ‐ other outcomes and potential harms
There was little or no effect of reducing SFA intakes on cancer diagnoses of any type (RR 0.94, 95% CI 0.83 to 1.07, I² = 33%, 4 RCTs, 52,294 participants, 5476 cancer diagnoses, Analysis 4.1); cancer deaths (RR 1.00, 95% CI 0.61 to 1.64, I² = 49%, 5 RCTs, 52,283 participants, 2472 cancer deaths, Analysis 4.2); systolic blood pressure (MD ‐0.19 mmHg, 95% CI ‐1.36 to 0.97, I² = 0%, 5 RCTs, 3812 participants, Analysis 4.5); diastolic blood pressure (MD ‐0.36 mmHg, 95% CI ‐1.03 to 0.32, I² = 0%, 5 RCTs, 3812 participants, Analysis 4.6).
4.1. Analysis.
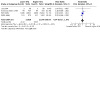
Comparison 4: SFA reduction vs usual diet ‐ secondary outcomes including potential adverse effects, Outcome 1: Cancer diagnoses
4.2. Analysis.
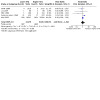
Comparison 4: SFA reduction vs usual diet ‐ secondary outcomes including potential adverse effects, Outcome 2: Cancer deaths
4.5. Analysis.
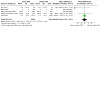
Comparison 4: SFA reduction vs usual diet ‐ secondary outcomes including potential adverse effects, Outcome 5: Systolic Blood Pressure, mmHg
4.6. Analysis.
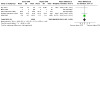
Comparison 4: SFA reduction vs usual diet ‐ secondary outcomes including potential adverse effects, Outcome 6: Diastolic Blood Pressure, mmHg
There was evidence that reducing SFA intake resulted in small reductions in body weight (MD ‐1.97 kg, 95% CI ‐3.67 to ‐0.27, I² = 72%, 6 RCTs, 4541 participants, Analysis 4.3), and body mass index (MD ‐0.50, 95% CI ‐0.82 to ‐0.19, I² = 55%, 6 RCTs, 5553 participants, Analysis 4.4).
4.3. Analysis.
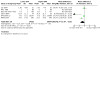
Comparison 4: SFA reduction vs usual diet ‐ secondary outcomes including potential adverse effects, Outcome 3: Weight, kg
4.4. Analysis.
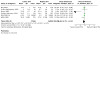
Comparison 4: SFA reduction vs usual diet ‐ secondary outcomes including potential adverse effects, Outcome 4: BMI, kg/m2
Only one RCT reported assessing quality of life. The Women's Health Initiative (WHI 2006) assessed quality of life at baseline using the SF‐36 tool). They found that being in the lower SFA arm resulted in a small improvement in Global Quality of Life at trial close‐out (on a scale of 0 worst to 10 best, MD 0.04, 95% CI 0.01 to 0.07, Analysis 4.7). This very small effect (less than 1% change) was statistically significant but unlikely to be relevant to individuals. However, it suggests no reduction in quality of life in those reducing their saturated fat.
4.7. Analysis.
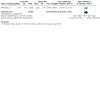
Comparison 4: SFA reduction vs usual diet ‐ secondary outcomes including potential adverse effects, Outcome 7: Quality of Life
Other results
To assess the effect in the population of consuming < 10%E as SFA relative to > 10%E as SFA for reduction in risk of noncommunicable diseases (NCDs), we combined studies with a control group saturated fat intake of > 10%E and an intervention group saturated fat intake of < 10%E for all‐cause mortality, cardiovascular and coronary heart disease mortality and events, myocardial infarctions, non‐fatal myocardial infarctions, and stroke. To assess the effect in the population of a reduction in %E from SFA from 10% in gradual increments relative to higher intake we repeated this with saturated fat cut‐offs between 7%E and 13%E. The data for these cut‐offs are shown in Table 6, and were plotted for a visual overview (Figure 6). The figure suggests reductions in cardiovascular outcomes in studies where saturated fat intake was greater than 10%E in control groups, and less than 10%E in intervention groups.
5. SFA cut‐off data.
| Cut‐ off | RR of all‐cause mortality | RR of CVD mortality | RR of CVD events | RR of MI | RR of non‐fatal MI | RR of stroke | RR of CHD mortality | RR of CHD events |
| 7%E | 0.89 (0.66 to 1.20) | 0.20 (0.01 to 4.15) | 0.20 (0.01 to 4.15) | N/A | N/A | N/A | N/A | N/A |
| 8%E | 0.89 (0.66 to 1.20) | 0.20 (0.01 to 4.15) | 0.20 (0.01 to 4.15) | N/A | N/A | N/A | N/A | N/A |
| 9%E | 0.96 (0.83 to 1.10) | 0.69 (0.51 to 0.94) | 0.79 (0.62 to 0.99) | 0.76 (0.55 to 1.05) | 0.62 (0.31 to 1.21) | 0.59 (0.30 to 1.15) | 0.82 (0.55 to 1.21) | 0.77 (0.56 to 1.04) |
| 10%E | 0.99 (0.90 to 1.09) | 0.95 (0.67 to 1.35) | 0.88 (0.66 to 1.18) | 0.93 (0.80 to 1.08) | 0.89 (0.58 to 1.35) | 0.87 (0.58 to 1.33) | 1.05 (0.77 to 1.43) | 0.82 (0.60 to 1.13) |
| 11%E | 0.99 (0.88 to 1.12) | 0.92 (0.65 to 1.31) | 0.86 (0.66 to 1.13) | 0.94 (0.84 to 1.06) | 0.89 (0.58 to 1.35) | 0.76 (0.45 to 1.30) | 1.02 (0.84 to 1.24) | 0.85 (0.63 to 1.15) |
| 12%E | 0.98 (0.91 to 1.07) | 0.95 (0.75 to 1.21) | 0.90 (0.74 to 1.08) | 0.94 (0.85 to 1.04) | 0.90 (0.72 to 1.14) | 0.93 (0.55 to 1.25) | 1.02 (0.84 to 1.24) | 0.90 (0.77 to 1.06) |
| 13%E | 1.02 (0.83 to 1.25) | 0.93 (0.63 to 1.38) | 0.87 (0.65 to 1.17) | 0.87 (0.73 to 1.04) | 0.72 (0.50 to 1.03) | 0.54 (0.29 to 1.00) | 1.06 (0.76 to 1.48) | 0.84 (0.63 to 1.12) |
CHD: coronary heart disease CVD: cardiovascular disease E: energy MI: myocardial infarction N/A: not applicable (no relevant studies) RR: risk ratio SFA: saturated fat, as percentage of energy
6.

Exploration of saturated fat cut‐offs
Additional WHO NUGAG specific questions:
In adults what is the effect in the population of reduced percentage of energy (%E) intake from saturated fatty acids (SFA) relative to higher intake for reduction in risk of noncommunicable diseases (NCDs)?
We found that reducing saturated fat for at least two years suggested no clear effects on all‐cause or cardiovascular mortality, but a 17% reduction in combined cardiovascular events. Heterogeneity in this result was partially explained by greater reductions in cardiovascular events in studies with greater serum total cholesterol reductions (implying greater reductions in SFA intake). Effects of reducing SFA on other cardiovascular and cancer outcomes were either very small or unclear (as the evidence was of very low quality), but it should be noted that risk ratios were all 1.0 or lower ‐ no harm was indicated. Effects on NCD risk factors were small but positive (serum total cholesterol, LDL cholesterol, systolic and diastolic blood pressure, weight and BMI) or neutral (HDL cholesterol and TGs).
What is the effect of reducing SFA on coronary heart disease mortality and coronary heart disease events?
We found little or no effect of reducing SFA on non‐fatal MI and CHD events, but the evidence on MI, stroke and CHD events was of very low quality. However, all risk ratios were less than 1.0.
What is the effect in the population of replacing SFA with PUFAs, MUFAs, CHO (refined versus unrefined), protein or trans fatty acids (TFAs) relative to no replacement for reduction in risk of NCDs?
We found greater reductions in cardiovascular events in studies that replaced saturated fats by PUFAs or CHO than in studies with replacement with MUFAs or protein, where there was little evidence of any effect.
What is the effect of replacing some saturated fat with PUFA on risk of CVD in adults?
There is moderate‐quality evidence that replacing saturated fat with PUFA probably reduces the risk of CVD events. Replacing SFA with PUFA also appears to reduce the risk of total MI, non‐fatal MI, stroke and CHD events, but has little or no effect on all‐cause mortality, CVD mortality and CHD mortality.
What is the effect of replacing some saturated fat with MUFA on risk of CVD in adults?
The evidence for effects of replacing SFA with MUFA was very limited, so assessment of health effects was not possible.
What is the effect of replacing some saturated fat with CHO on risk of CVD in adults?
While studies that replaced SFA with CHO reduced CVD events and stroke, effects on all‐cause mortality and other CVD outcomes suggested little or no effect.
What is the effect of replacing some saturated fat with protein on risk of CVD in adults?
There was no evidence suggesting that replacing SFA with protein reduced all‐cause mortality or any CVD outcomes, but the evidence was limited.
What is the effect in the population of consuming < 10%E as SFA relative to > 10%E as SFA for reduction in risk of NCDs?
Cut‐off data were difficult to interpret, and confidence intervals were wide, but they suggested greater reductions in cardiovascular events in studies where saturated fat intake was greater than 10%E in control groups, and less than 10%E in intervention groups (see Figure 6).
What is the effect in the population of a reduction in %E from SFA from 10% in gradual increments relative to higher intake for reduction in risk of NCDs?
The data from RCTs are too limited to be able to address this question.
Discussion
Summary of main results
This systematic review of long‐term randomised controlled trials of SFA reduction suggests that reducing saturated fat for at least two years probably has little or no effect on all‐cause or cardiovascular mortality, but probably caused a 17% (95% CI 2 to 30%, I2 = 67%, moderate‐quality evidence) reduction in people experiencing cardiovascular events. The heterogeneity in this relationship was explained by greater reduction in CVD events in trials with greater serum cholesterol lowering. This effect on cardiovascular events was retained in most sensitivity analyses, but not when limiting to studies at low summary risk of bias. Subgrouping suggested that there was a 21% (95% CI 0 to 38%) reduction in cardiovascular events in studies that replaced saturated fats by PUFAs, and a 16% (95% CI ‐6 to 33%) reduction in studies replacing with CHO, with little information on the effect of replacing with MUFAs or protein. The difference between subgroups was not statistically significant. We could not explore data on trans fats due to lack of data. Meta‐regression and subgrouping suggested that greater reductions in SFA intake, greater reductions in total serum cholesterol levels, higher baseline SFA intake and greater increases in PUFA and MUFA intakes reduced CVD events more, but the strongest factor was the degree of cholesterol lowering. This suggests that the cardiovascular effects of reducing saturated fat rely on changes in atherosclerosis via serum cholesterol. The degree of cholesterol lowering reflects greater reduction in SFA and greater increase in PUFA (Hegsted 2000).
There may be little or no effect of SFA reduction on non‐fatal MI or CHD mortality (both low‐quality evidence), and effects on fatal and non‐fatal MI, stroke and CHD events were unclear (as the evidence was of very low‐quality). However, risk ratios were less than 1.00 for all of these. While we found small reductions in body weight and body mass index with advice to reduce saturated fats, there was little or no effect on diabetes diagnoses, cancer diagnoses or cancer deaths, or on systolic or diastolic blood pressure.
Reducing saturated fat caused reductions in serum total and LDL cholesterol, which did not differ according to type of replacement. There was little or no effect of saturated fat reduction on serum HDL cholesterol or triglyceride. Data on lipid ratios, Lp(a) and HOMA were very limited and effects unclear, but SFA reduction appears to reduce glucose two hours after a glucose load.
Overall completeness and applicability of evidence
The review included adult participants at varying levels of risk of cardiovascular disease, men and women, with mean ages from 46 to 66 years at baseline, in free‐living and institutional settings, and across the past 50 years. All the studies were conducted in industrialised countries, and no data were available from developing or transitional countries. The effectiveness of SFA reduction has been well assessed, with trials of at least 24 months including more than 50,000 participants for all primary and secondary CVD outcomes. Three thousand five hundred and eighteen participants in the included trials died, 1096 died of a cardiovascular cause, and 4538 experienced at least one cardiovascular event.
The external validity of the review in industrialised countries, men and women, people with low, moderate and high risk of cardiovascular disease was high, but it is not clear how this evidence relates to diets in developing and transitional countries.
Quality of the evidence
All 15 trials (16 comparisons) included were randomised controlled trials, allocation concealment was judged well done in eight RCTs and blinding of outcome assessors adequate in nine trials assessing CVD outcomes (and all trials assessing all‐cause mortality). Blinding of participants is difficult and expensive in dietary fat trials, but was adequate in one trial. We judged incomplete outcome data not to be a problem in seven RCTs, and selective reporting was not a problem in any trial. Three trials were free of differences in care between the intervention and control arms, 10 RCTs stated an aim to reduce saturated fat, 11 showed evidence they had reduced SFA intake (all studies did one or the other), and nine studies showed clear reductions in total cholesterol. Five trials were at low summary risk of bias.
The lack of blinding of participants in most dietary trials is unlikely to alter outcome assessment when outcomes include death and cardiovascular events (although it could potentially affect assessment of worsening of angina, or increased dose of antianginals), but lack of blinding in participants may have led those in the control groups to alter their lifestyle and dietary practices (for example, feeling that they have not been helped to reduce their cardiovascular risk, they may act to reduce their own risk by altering other lifestyle behaviours such as smoking or exercise, leading to a potential lessening of the apparent effect of the dietary intervention). Systematic differences in care between arms may have led to intervention groups receiving additional support in areas like self efficacy and gaining support from new social circles, potentially beneficial to health regardless of dietary fat intake, or gaining additional healthcare professional time, possibly leading to earlier diagnosis and treatment of other risk factors such as raised blood pressure. Additional dietary messages such as those around fruit and vegetable intake, fibre, alcohol and sugars, present in many studies, may have been protective, or may have diluted the effect or attainability or both of the saturated fat goals.
The quality of evidence balances the uncertainty over allocation concealment, lack of blinding and presence of systematic differences in care and additional dietary differences between arms (Figure 2) with the scale and consistency of the evidence across studies and across decades, despite very different designs and design flaws. For this reason, there is moderate‐quality evidence that interventions that reduced dietary saturated fat intake reduced the risk of cardiovascular events.
Complex interventions
With complex interventions, such as dietary interventions, there are additional questions that need to be asked about included studies. Important issues to consider include defining the intervention, searching for and identifying all relevant studies, selecting studies for inclusion and data synthesis (Lenz 2007; Sheppherd 2009), as well as questions around whether the intended intervention was realised in study participants during the study.
For this review, we have worked to define the interventions clearly (see Characteristics of included studies), providing information on the type of intervention, stating the study aims and methods for each arm and the assessed total and saturated fat intakes attained within the study. However, while we have characterised the interventions, no two studies that reduced SFA had exactly the same dietary goals for the intervention groups. Methods of attaining the dietary goals varied from providing a whole diet over several years (in studies based in institutions) to providing advice on diet alongside supplementary foods such as margarines or oils, to providing dietary advice with or without supplementary support in the way of group sessions, cooking classes, shopping tours, feedback, self‐efficacy sessions and/or individual counselling. We aimed to use this variety to support generalisability for the effects of the interventions.
We aimed to identify all the relevant studies through use of a broad search strategy, which was time‐consuming. However, we believe that we have included most relevant trials. We also carefully defined acceptable interventions for each arm, to simplify decisions on inclusion, and the two independent assessors often agreed. We augmented data synthesis by subgrouping and meta‐regression, to help us understand the effects of individual elements of dietary fat changes.
A study that sets out to assess the effect of a 30% reduction in saturated fat intake may attain this level of reduction in some participants, exceed it in some and not achieve it at all in others. The actual mean change attained in the intervention group may be less dramatic than that aimed for, and the participants in the control group may also reduce their saturated fat intake by a small amount, narrowing the difference in saturated fat between the groups further and so reducing the scale of any outcome. This can be dealt with in the systematic review if we meta‐regress the difference in saturated fat intake between the intervention and control group with the scale of the outcome (assuming a linear dose response), still allowing us to understand the effect of altering saturated fat intake. However, it is difficult to measure actual saturated fat intake achieved. Some trials did not report it, either because they did not assess it, or did assess it but didn't report this relatively uninteresting outcome. Other trials did report the results of asking people what they were eating, using a food frequency questionnaire or several 24‐hour food recalls. However, there is good evidence to believe that asking people how they are eating may produce somewhat biased information (Kristal 2005; Schatzkin 2003), and this may be a greater problem where the participant has been recently urged to eat in a particular way, as in a dietary trial. Assessment of change in total cholesterol is a way to get over self‐reporting of dietary intake as reducing saturated fat reduces total and LDL cholesterol. This review suggests that the relationship between saturated fat reduction and CVD events is moderated by the degree of cholesterol lowering, which is exactly what would be expected of a true effect.
The interventions used in the studies included in this review were varied, with some participants given all their food over a long period of time in an institutional setting, while most participants were given advice on how to achieve dietary changes, with or without the support of supplements such as oils and foods (Table 2). Advice was provided by a variety of health professionals, and with different levels of intensity. The effect of this was that different degrees of saturated fat reduction were achieved in different studies. The level of compliance with interventions involving long‐term behaviour change, such as those used in these studies, can vary widely. This is likely to attenuate the pooled effect and bias it towards the null. Insofar as we were able to understand this issue, subgrouping and meta‐regression suggested that greater reductions in saturated fats were associated with greater reductions in the risk of cardiovascular disease events. This suggestion of a dose response strengthens our belief that there is a true effect of reducing saturated fat on CVD events.
Potential biases in the review process
In compiling the included studies, we worked hard to locate randomised studies that altered dietary SFA intake for at least 24 months, even when cardiovascular events were not reported in study publications, or where such events were reported incidentally as reasons for participant dropouts. We attempted to contact all authors of potentially includable studies to verify the presence or absence of our outcomes. In many studies, no outcomes relevant to this review occurred or were recorded, and the numbers of events occurring within single studies varied from none to over 2500 deaths, over 500 cardiovascular deaths, and over 3000 participants experiencing at least one cardiovascular event (all within WHI 2006, the largest single study with almost 50,000 female participants for many years).
The number of cardiovascular deaths across the review was relatively small (1096), so while we can be quite confident in reporting a reduction in participants experiencing cardiovascular events (4476 events) with SFA reduction, and a lack of effect on total mortality (3518 deaths) within the studies' time scales, the effect on cardiovascular mortality is less clear. The risk ratio of 0.94 (95% CI 0.78 to 1.13, Analysis 1.18) may translate into a small protective effect, but this is unclear.
The lack of effect on individual cardiovascular events is harder to explain; there were 1714 people experiencing MIs, 1118 strokes and 1385 non‐fatal MIs, 2472 cancer deaths, 3342 diabetes diagnoses and 5476 cancer diagnoses. Lack of clear effects on any of these outcomes is surprising, given the effects on total cardiovascular events, but may be due to the relatively short timescale of the included studies, compared to a usual lifespan during which risks of chronic illnesses develop over decades, and to relatively small reductions in saturated fat (and serum cholesterol) in some trials. Some of the events included within combined cardiovascular events, such as new or worsening angina or increased anti‐anginal treatment, could potentially be influenced by allocated study arm, and so might increase bias within unblinded trials (although they also add power to see potential effects). There are difficulties in finding data on the number of people experiencing composite end points such as cardiovascular events. This end point represents the number of people experiencing any of the following: cardiovascular death, cardiovascular morbidity (non‐fatal myocardial infarction, angina, stroke, heart failure, peripheral vascular events, atrial fibrillation) and unplanned cardiovascular interventions (coronary artery bypass surgery or angioplasty). Adding up the number of events is easy, but a single participant may have experienced a stroke, an MI and atrial fibrillation during a trial ‐ and we need to take care not to count this individual three times. So finding such composite end point data involves using the best published composite end point data and supplementing this with author contact where possible. We have underestimated such composite end points rather than overestimated them where exact data are not available. Added to this complex picture, it needs to be remembered that definitions and diagnoses of some end points have altered over time.
Where the funnel plots and comparison of fixed‐ and random‐effects meta‐analyses suggest small‐study bias, we have downgraded the quality of the evidence in GRADE, but effects of any such small study bias appear small.
Some trials were partially confounded by aiming to make dietary changes other than those directly related to dietary fat intakes; for example, some studies encouraged intervention participants to make changes to their fat intake as well as changes to fruit and vegetable, fibre or salt intakes. In these studies, any effect on outcomes could be a result of other dietary changes, not of changes in saturated fat intake. The 11 studies (12 comparisons) that appeared free of such differences included Black 1994; DART 1989; Houtsmuller 1979; Ley 2004; MRC 1968; Oxford Retinopathy 1978; Rose corn oil 1965; Rose olive 1965; Simon 1997; Sydney Diet‐Heart 1978; Veterans Admin 1969; WINS 2006. On the basis of reviewer comments, we assessed effects of reducing saturated fat intake on combined CVD events including only these trials free of additional interventions. Omitting trials with additional interventions (Oslo Diet‐Heart 1966; STARS 1992; WHI 2006) leaves nine studies (ten arms) randomising 4456 participants of whom 812 experienced a CVD event, suggesting a similar reduction in CVD events (RR 0.86, 95% CI 0.67 to 1.09, I2 = 59%, Analysis 1.43) to the main analysis (RR 0.83, 95% CI 0.70 to 0.98, I2 = 67%, > 53,000 participants randomised, Analysis 1.35). This suggests that effects on combined CVD events are not driven by interventions other than reductions in saturated fats and any energy replacements.
One surprising element of this review is the lack of new trials identified in the 2019 update, and small numbers of potential ongoing trials. This is likely to be because well‐powered trials on cardiovascular end points will need to be large and carried out over several years, so expensive. As the effects of saturated fats are felt to be established and understood, trialists and funders may feel that the money would be better invested in answering other questions. For most of the ongoing trials, information is limited and these trials may or may not be included when fully published. Perhaps the current evidence set is as definitive as we will achieve during the 'statin era'.
Agreements and disagreements with other studies or reviews
In this review, saturated fat reduction had little or no effect on all‐cause or cardiovascular mortality but did appear to reduce the risk of cardiovascular events by 17%, although effects on MI and stroke individually were less clear. This result was rather different from those of Siri‐Tarino 2010, who systematically reviewed cohort studies that assessed relationships between saturated fat and cardiovascular events. They included 21 studies and did not find associations between saturated fat intake and cardiovascular disease (RR 1.0, 95% CI 0.89 to 1.11). This meta‐analysis has been criticised (Katan 2010; Scarborough 2010; Stamler 2010), as results of half of the studies included in their meta‐analysis were adjusted for serum cholesterol concentrations, while there is an established relation between saturated fat intake and cholesterol level. The issue of what factors should be adjusted for, and what not adjusted for, in observational studies when dietary factors are very tightly correlated is a thorny one, and one of the reasons why trial data may be helpful. The studies included in the meta‐analysis also varied widely in the method used to assess intake, as half of the studies collected one‐day intake data. However, as with our review, they found little or no relationship between saturated fat intake and coronary heart disease (RR 1.07, 95% CI 0.96 to 1.19) though their data did suggest a (non‐statistically significant) reduction in stroke risk with higher saturated fat intake (RR 0.81, 95% CI 0.62 to 1.05, Siri‐Tarino 2010).
In this review, we found that replacing saturated fat with PUFAs (a modified‐fat diet) appeared more protective of cardiovascular events than replacement with carbohydrates (a low‐fat diet, Analysis 1.44; Analysis 1.45). This was similar to results within our closely allied systematic review assessing health effects of total fat reduction, where modified‐fat diets were protective and low‐fat diets were not (Hooper 2012). Meta‐regression did not suggest any relationship between either PUFAs or MUFAs and cardiovascular events in this review, although the analysis was underpowered. Alonso 2006 suggested a protective role for MUFA from olive oil, but not from meat sources (the main source of MUFA in the USA and Northern Europe). Our systematic review was not able to explore this issue as we included only one small study (underpowered to assess health outcomes on its own) that replaced SFA with MUFA, using an olive oil supplement (Rose olive 1965). A review by Mozaffarian 2010, which again included very similar studies to the last version of this review, with the Finnish Mental Hospital study and Women's Health Initiative data added, stated that their findings provided evidence that consuming PUFAs in place of saturated fat would reduce coronary heart disease. However, their evidence for this was limited, as they found that modifying fat reduced the risk of myocardial infarction or coronary heart disease death (combined) by 19% (similar to our result). As the mean increase in PUFAs in these studies was 9.9% of energy, they infer an effect of increasing PUFAs by 5% of energy of 10% reduction in risk of myocardial infarction or coronary heart disease death. They provided no suggestion or evidence of a relationship between degree of PUFAs increase and level of risk reduction. Another review carried out during updating of the Nordic Nutritional Recommendations (Schwab 2014) included observational as well as intervention studies, and concluded that there was convincing evidence that partial replacement of SFA with PUFA decreases risk of CVD while replacement with CHO is associated with increased CVD risk. The review included studies performed solely in white participants or with a clear white majority.
Within the meta‐regression, we hoped to combine studies that effectively altered saturated fat by different degrees, so that studies that reduced saturated fat very little and studies that reduced it a great deal would all offer data points for the meta‐regression against mortality and morbidity end points, and similarly for total fat, polyunsaturated, monounsaturated and trans fats. Unfortunately many of the included studies did not report data on assessed dietary intake during the trial, reducing the quantity of data available to understand the relationships. Another limitation in understanding effects of individual classes of fatty acids on mortality and morbidity (both in trials and in observational studies) was our ability to correctly assess participants' intake. We could overcome this by using biomarkers such as serum LDL cholesterol (differences between the LDL concentration in the intervention and control arms could be seen as a reasonable and independent approximation of saturated fat intake); however, as many studies were carried out in the 1960s to 1990s, few measured and reported LDL cholesterol. We used meta‐regression with serum total cholesterol (although this is a composite marker and so less related to saturated fat intake), but although this was available for more studies than LDL it was not available for all studies. Despite the limited data, there was a clear suggestion from meta‐regression that there was greater reduction of risk of cardiovascular events in studies with greater total serum cholesterol reduction, supporting the central role of serum lipids in the link between dietary saturated fats and cardiovascular events.
Participants' level of risk
As the rate of events is higher in high‐risk groups (by definition), it should require smaller sample sizes and shorter follow‐up to observe an effect of an intervention in a high‐risk group of participants (Davey Smith 1993). There have been suggestions that randomised controlled trials are unsuitable for assessing the effectiveness of interventions with very modest levels of effect in low‐risk populations, because of the huge numbers of person‐years of observation needed to gain sufficient statistical power to avoid Type II errors (Ebrahim 1997). However, with the publication of the Women's Health Initiative trial (WHI 2006) we now have data on more people experiencing cardiovascular events who were originally at low risk of cardiovascular disease than in people with moderate or high risk. The same is true for cardiovascular deaths and total mortality.
When end points such as total mortality are used, the situation becomes more difficult, as in low‐risk groups the proportion of deaths which are unrelated to cardiovascular disease (and perhaps unlikely to be influenced by dietary fat changes) rises, again diluting any differences in the numbers of deaths between intervention and control groups. It is more likely that changes in cardiovascular deaths will be seen than in total mortality. The trend is certainly in this direction, with the pooled risk ratio for total mortality 0.96 (95% CI 0.90 to 1.03, Analysis 1.1), and for cardiovascular mortality RR 0.94 (95% CI 0.78 to 1.13, Analysis 1.18). Our best estimate is that SFA reduction results in a reduction of 6% in deaths due to cardiovascular disease, and a reduction of 4% in total deaths, but these are small effects with wide confidence intervals.
The high‐risk participants all showed evidence of cardiovascular disease at baseline. Under current guidelines, most high‐risk participants with raised lipid levels should be on lipid‐lowering medication (Grundy 2019; NICE 2014; O'Gara 2014). This raises the question of whether there is any additional advantage of adherence to a reduced SFA diet in addition to statin therapy. Little evidence exists at present to answer this question. However, in all parts of the world where drug budgets are restricted and use of lipid‐lowering medication remains rationed even for those at high risk, the use of reduced SFA diets would appear to be a cost‐effective option leading to considerable reductions in cardiovascular events for populations (and so in health budgets) in only a few years.
Low‐risk participants are unlikely to be on lipid‐lowering medication under current guidelines. The suggestion of protection of low‐risk individuals from cardiovascular events with a reduction of roughly 17% of events in just a few years of intervention, as there is no evidence that effects in the low‐CVD‐risk group are different from effects in the higher‐risk groups, would appear to merit continued public health action. Recent guidelines recommend saturated fat reduction in general populations (SACN 2019).
A factor that may affect participant risk of cardiovascular disease, and also the effectiveness of reducing saturated fat intake, that has altered over time is the level of use of statins to control serum lipids in people at moderate and high risk of CVD. The 4S 1994 trial, which was the first trial to show that use of statins could reduce mortality in people with coronary heart disease, was published in 1994 and led to an explosion of the use of statins. For most health outcomes, we saw no clear effect of a decade of publication on risk, but for combined CVD events and CHD events, there were differences between subgroups. For combined CVD events, there were reductions in risk with reduced saturated fat intakes in the 1960s, 1970s and 1990s (both trials published early in the decade), but no clear effect of reducing saturated fat in the 1980s (one trial with 283 events) or 2000s (three large trials). It is possible (but not clear) that participants in the trials published in the 2000s were protected by higher levels of statin use (statins were allowed in participants in the largest trial, WHI 2006).
Authors' conclusions
Implications for practice.
Evidence supports the reduction of saturated fat to reduce risk of combined cardiovascular events in people with and without existing cardiovascular disease, in men and women, over at least two years and in industrialised countries. Little or no effect of saturated fat reduction was seen on all‐cause and cardiovascular mortality, at least on this timescale.
Practical ways to achieve reductions in dietary saturated fat include switching to lower fat dairy foods and cutting off meat fats, as well as reducing intake of foods high in saturated fats such as cakes, biscuits, pies and pastries, butter, ghee, lard, palm oil, sausages and cured meats, hard cheese, cream, ice cream, milkshakes and chocolate (for further details see NHS 2020).
Implications for research.
To complement this review of long‐term RCTs, we need reviews of metabolic studies to clarify the effects of specific replacements for saturated fat in the diet, and systematic reviews of cohort studies to clarify longer‐term effects of saturated fat reductions.
The financial implications (costs and savings) of appropriate advice and legislation to modify fat intake in those at various levels of cardiovascular risk should be assessed and reflected in health policy. Whilst interventions to alter dietary fat intake in individuals at high cardiovascular risk have been fairly successful, such health promotion initiatives in the general population have been less successful. Further work is needed to help high‐ and low‐risk individuals to make effective changes to reduce saturated fat and to maintain these changes over their lifetimes. Research into the effects of legislation to alter fat contents of foods, improved labelling, pricing initiatives and improved availability of healthier foods, linking food production and processing into the health agenda, may yield huge advances in this area.
It is not clear whether there is an additional benefit of reducing saturated fat in those at high risk of cardiovascular disease who are on lipid‐lowering medication. Further research to examine the need for maintenance of reduced saturated fat whilst on lipid‐lowering medication would be useful, but not as useful as understanding specific dietary fat replacements for saturated fat. However, we did not identify any relevant ongoing trials in our searches.
All future trials should be of at least 2 years duration (preferably longer), employ excellent methodology in terms of randomisation and allocation concealment, blinding of outcome assessors, high‐quality assessment of macronutrients and micronutrients during the trial in both arms, and equivalent attention and health professional time to participants in both arms.
Feedback
Jeffery Heileson and Chaz McIntosh, 28 May 2020
Summary
Dear Editors,
We recently read with interest the updated systematic review, “Reduction in saturated fat intake for cardiovascular disease”.1 After a careful review of the analysis, some notable flaws were identified that may be of interest to the Cochrane Heart Group and the authors:
1) As discussed elsewhere,2 the inclusion of the Oslo Diet‐Heart Study (ODHS) seems to violate one of the inclusion criteria (“not multifactorial”). Briefly, the ODHS experimental group (polyunsaturated [PUFA]) was counselled to increase fruits, vegetables, nuts, and fish, while avoiding sugar.3 Interestingly, the PUFA group was not only counselled, but supplemented with cod liver oil and sardines (5/d EPA+DHA and 610 IU vitamin D). Lastly, the PUFA group restricted trans‐fat (TFA) intake, while the control (saturated fat [SFA]) group consumed nearly 10% of total energy as TFA.
2) Similarly, the St Thomas Atherosclerosis Regression Study (STARS) was recently excluded from a Cochrane systematic review for being multifactorial.4 Also of note, the PUFA group ate about 15g/d less TFA and doubled their EPA+DHA intake compared to the SFA group.5 While Analysis 1.43 excluded trials with additional interventions for CVD events, this analysis was not replicated for all‐cause mortality (ACM), CVD mortality, CHD mortality, or CHD events.
3) Inclusion of the Houtsmuller trial may be questionable.6 A previous Cochrane systematic review notes that there were “concerns of fraud” in Houtsmuller’s later research and how the study was “extremely vague across all publications about its methods”.4 Moreover, the specific source of fat used in the control group – vaguely described as “saturated margarines” – is likely not animal sourced and may well be hydrogenated vegetable oil.7
4) During the early trials, SFA interventions also reduced TFA intake. Namely, the ODHS, LA Vets trial, and MRC, all reduced TFA intake by at least 2% of total energy in the PUFA groups. While not explicitly a component of the selection criteria, TFA intake should be taken into consideration as a major confounding variable.
5) The reduction in “combined cardiovascular events” was driven by softer endpoints more susceptible to bias. For instance, about 85% of the events in Houtsmuller et al were due to angina,6 71% of the events in STARS were “patients requiring increased anti‐anginal treatment” or “cardiac surgery”,8 and 42% of the events in MRC were “those not classified as major, which include 'acquired angina'”.9 Similarly, results from LA Vets were only significant after adding secondary soft endpoints. Given that virtually all dietary trials were not sufficiently blinded, inclusion of these softer endpoints may be inappropriate and introduce bias. Notably, Ramsden et al did not evaluate non‐fatal endpoints because of “several critical deficiencies in the collection and reporting of non‐fatal CHD events in these RCTs”.10
6) The exclusion of the Sydney Diet‐Heart Study (SDHS) for “combined cardiovascular events” is puzzling and should be elucidated further within the text. The SDHS did report cardiovascular mortality endpoints which appears to fit the definition of “combined cardiovascular events” as noted on page 7.1 Also, Cochrane’s omega‐6 PUFA review shows that the SDHA was included in that analysis for CVD events, CHD events, and strokes.4 Since the Sydney study is one of the few “low summary risk of bias” trials for CVD events,1 it would seem important to include it where possible.
7) The authors stated, “This clearly indicates that the cardiovascular effects of reducing saturated fat rely on changes in atherosclerosis via serum cholesterol.” Meta‐regression and subgroup analysis are observational; hence, this statement seems to go beyond the evidence provided. The degree of cholesterol reduction did not influence ACM, CVD mortality, or CHD mortality. The relationship between CVD and CHD events and total cholesterol could have been driven by the higher omega‐3 intake and lower TFA intake in the experimental groups as well as the intervention.
We’d like to thank the authors for their hard work and rigorous analysis. We hope that our comments contribute to the research process in a meaningful way and improve future analysis.
References
Hooper L, Martin N, Jimoh OF, Kirk C, Foster E, Abdelhamid AS. Reduction in saturated fat intake for cardiovascular disease. Cochrane Database of Systematic Reviews. 2020;(5). doi:10.1002/14651858.CD011737.pub2
Heileson JL. Dietary saturated fat and heart disease: a narrative review. Nutr Rev. 2020;78(6):474‐485. doi:10.1093/nutrit/nuz091
Leren P. The effect of plasma cholesterol lowering diet in male survivors of myocardial infarction: a controlled clinical trial. Acta Med Scand Suppl. 1966;466:1‐92.
Hooper L, Al‐Khudairy L, Abdelhamid AS, et al. Omega‐6 fats for the primary and secondary prevention of cardiovascular disease. Cochrane Database Syst Rev. 2018;11:CD011094. doi:10.1002/14651858.CD011094.pub4
Ramsden CE, Hibbeln JR, Majchrzak SF, Davis JM. n‐6 Fatty acid‐specific and mixed polyunsaturate dietary interventions have different effects on CHD risk: a meta‐analysis of randomised controlled trials. British Journal of Nutrition. 2010;104(11):1586‐1600. doi:10.1017/S0007114510004010
Houtsmuller AJ, Zahn KJ, Henkes HE. Unsaturated fats and progression of diabetic retinopathy. Doc Ophthalmol. 1979;48(2):363‐371. doi:10.1007/BF00141465
Hamley S. The effect of replacing saturated fat with mostly n‐6 polyunsaturated fat on coronary heart disease: a meta‐analysis of randomised controlled trials. Nutr J. 2017;16(1):30. doi:10.1186/s12937‐017‐0254‐5
Watts GF, Lewis B, Lewis ES, et al. Effects on coronary artery disease of lipid‐lowering diet, or diet plus cholestyramine, in the St Thomas’ Atherosclerosis Regression Study (STARS). The Lancet. 1992;339(8793):563‐569. doi:10.1016/0140‐6736(92)90863‐X
Controlled trial of soya‐bean oil in myocardial infarction: Report of a research committee to the medical research council. Lancet. 1968;292(7570):693‐700. doi:10.1016/S0140‐6736(68)90746‐0
Ramsden CE, Zamora D, Majchrzak‐Hong S, et al. Re‐evaluation of the traditional diet‐heart hypothesis: analysis of recovered data from Minnesota Coronary Experiment (1968‐73). BMJ. 2016;353. doi:10.1136/bmj.i1246
Reply
Thank you for your thoughts. We did not include studies that were multifactorial in terms of smoking, exercise, drugs etc, but did allow concurrent dietary changes. We ran a sensitivity analysis assessing effects on CVD events in trials where additional dietary interventions were not included. “Sensitivity analysis omitting trials which included dietary interventions in addition to changes to dietary fat (for example, changes to fruit and vegetable or fibre intake) we excluded three trials (Oslo Diet‐Heart 1966; STARS 1992; WHI 2006). This analysis also suggested that reducing saturated fat (rather than other dietary changes) reduced risk of cardiovascular events: RR 0.86 (95% CI 0.67 to 1.09, Analysis 1.43).”
We aimed to gather trans fatty acid data from all included studies and to include changes to trans fats, alongside changes to MUFA, PUFA etc in the meta‐regression. This was not possible for trans fats due to the lack of data within included studies. Without the data we can only speculate as to changes in trans fats.
The Sydney Diet‐Heart Study should appear in the “combined cardiovascular events” analysis, and we have updated the analysis to include the Sydney Diet‐Heart Study CVD deaths within the CVD events analysis. This alters the “bottom line” for the CVD events forest plot to RR 0.83 (95% CI 0.70 to 0.98, I2 67%). This altered effect size has been worked through the review, and does not alter the main conclusions of the review.
Contributors
Feedback editor: William Cayley
Lead author: Lee Hooper
George Henderson, 28 May 2020
Summary
The introduction to this meta‐analysis includes an error uncorrected from the 2015 version. Oliver 1953 measured total cholesterol, not LDL cholesterol. Further, it is relevant that every subject in Oliver 1953 had been eating the same hospital diet for at least 5 weeks before the cholesterol samples were taken, which does not support a diet‐heart interpretation of the results.[1] (The presence of FH in the sample, and/or survivorship bias, are probably more reasonable interpretations) The section headed "Agreements and disagreements with other studies or reviews" has not addressed any written after 2014, meaning that this section has not been updated. There are several analyses of the diet heart trials since 2015 that should have been addressed (indeed, that should have been read before the current Cochrane review was designed). Some are listed below.[2,3.4] The discussion of Siri‐Tarino 2010 in "Agreements and disagreements with other studies or reviews" claims that adjustment for lipids has confounded its null result, however Siri‐Tarino at al had already addressed this by isolating studies not adjusted for lipids with no difference in their null result. This is quite understandable as adjusting for lipids also means adjusting for TG and HDL, cardiometabolic risk markers which can be beneficially influenced by saturated fat and worsened by carbohydrate. Studies which do not adjust for lipids can be non‐significantly favourable to saturated fat, for example the Malmo DCS, a high‐quality observational study using a 7‐day food diary and more rigorous exclusion criteria than is usual, or the 2019 dose‐response meta‐analysis of observational studies by Zhu et al.[5,6] The claim that greater lowering of LDL in trials being associated with greater reduction of events supports the diet‐heart hypothesis may be unsound. Persons in good metabolic health are at significantly lower risk of CVD events despite other risk factors.[7] Persons who are obese, have diabetes, or the metabolic syndrome do not usually experience drops in LDL cholesterol when fat in the diet is changed; the subjects in the feeding studies cited, who did experience such drops, were healthy volunteers.[8,9,10]
It is also relevant that from 2004 the Swedish population began to reject diet‐heart advice, to such an extent that butter sales rose and margarine sales dropped; cholesterol levels also rose.[11] Yet as recently as 2018 mortality from, and incidence of, AMI was continuing to decline in Sweden. In fact incidence of AMI had stayed stable from 1987 to 2005, after which it began to drop from 42,263 PA to 25,789 PA in 2018.[12]
References
[1] The Plasma Lipids in Coronary Artery Disease. Oliver MF, Boyd GS. Br Heart J. 1953 Oct;15(4):387‐92.
[2] Hamley, S. The effect of replacing saturated fat with mostly n‐6 polyunsaturated fat on coronary heart disease: a meta‐analysis of randomised controlled trials. Nutr J 16, 30 (2017). https://doi.org/10.1186/s12937-017-0254-5 [3] Thornley S, Schofield G, Zinn C, Henderson G. How reliable is the statistical evidence for limiting saturated fat intake? A fresh look at the influential Hooper meta‐analysis. Intern Med J. 2019;49(11):1418‐1424. doi:10.1111/imj.14325 [4] Jeffery L Heileson, Dietary saturated fat and heart disease: a narrative review, Nutrition Reviews, Volume 78, Issue 6, June 2020, Pages 474–485, https://doi.org/10.1093/nutrit/nuz091
[5] Leosdottir M, Nilsson PM, Nilsson JA, Månsson H, Berglund G. Dietary fat intake and early mortality patterns‐‐data from The Malmö Diet and Cancer Study. J Intern Med. 2005;258(2):153‐165. doi:10.1111/j.1365‐2796.2005.01520.x [6] Zhu, Y., Bo, Y. & Liu, Y. Dietary total fat, fatty acids intake, and risk of cardiovascular disease: a dose‐response meta‐analysis of cohort studies. Lipids Health Dis 18, 91 (2019). https://doi.org/10.1186/s12944-019-1035-2
[7] Jeppesen J, Hein HO, Suadicani P, Gyntelberg F. Low triglycerides‐high high‐density lipoprotein cholesterol and risk of ischemic heart disease. Arch Intern Med. 2001;161(3):361‐366. doi:10.1001/archinte.161.3.361 [8] Flock MR, Green MH, Kris‐Etherton PM; Effects of Adiposity on Plasma Lipid Response to Reductions in Dietary Saturated Fatty Acids and Cholesterol, Advances in Nutrition. 2011;2,(3):261–274, https://doi.org/10.3945/an.111.000422 [9] Benatar JR, Sidhu K, Stewart RAH. Effects of High and Low Fat Dairy Food on Cardio‐Metabolic Risk Factors: A Meta‐Analysis of Randomized Studies. Tu Y‐K, ed. PLoS ONE. 2013;8(10):e76480. doi:10.1371/journal.pone.0076480. [10] Lefevre M, Champagne CM, Tulley RT,et al. Individual variability in cardiovascular disease risk factor responses to low‐fat and low‐saturated‐fat diets in men: body mass index, adiposity, and insulin resistance predict changes in LDL cholesterol. Am J Clin Nutr. 2001;82(5):957–963, https://doi.org/10.1093/ajcn/82.5.957
[11] Johansson I, Nilsson LM, Stegmayr B, Boman K, Hallmans G, Winkvist A. Associations among 25‐year trends in diet, cholesterol and BMI from 140,000 observations in men and women in Northern Sweden. Nutr J. 2012;11:40. [12] Data accessed from Swedish Social Registry website 28/05/20 https://sdb.socialstyrelsen.se/if_hji/resultat.aspx
Reply
Thank you for your thoughts, comments and suggested references. There is a vast literature on effects on health of saturated fat. We limited our introduction to systematic reviews of effects of reducing saturated fats on CVD, and there do not appear to be any further substantial ones that we missed.
In discussing the Siri‐Tarino 2010 meta‐analysis of observational studies our focus is on comparison with effects observed in our systematic review of trials, and the problems of knowing what factors to adjust for in observational studies where different dietary factors are very highly correlated.
In meta‐regression the studies that reduced saturated fat the most also reduced CVD events the most, and greater reductions in total serum cholesterol levels reduced CVD events more. This explained much of the heterogeneity between studies. Overall, the relationship with serum total cholesterol was clearest (P = 0.04, accounting for 99% of between‐study variation). Apparent heterogeneity was accounted for by a dose‐effect; where SFA reduction resulted in greater serum cholesterol reduction, the reduction in CVD events was greater (see section “Effects of interventions” and additional Table 4).
Our review assessed effects of saturated fat on CVD, but it is not the only element of our lifestyles that affects CVD risk. Within Sweden smoking, physical activity, alcohol intake, medication levels for lipids and blood pressure etc etc will have changed alongside fat intakes, highlighting some of the problems of interpreting observational data. What happens to levels of CVD in Sweden reflects all of these changes, and does not detract from our review of effects of reducing saturated fats. This is not a systematic review of observational studies.
Contributors
Feedback editor: William Cayley
Lead author: Lee Hooper
Kevin Schwanz, 8 July 2020
Summary
The major problem with this review is that the studies included do not test saturated fat. They are not a simple decrease in saturated fat intake, nor are they a simple substitution of saturated fat for unsaturated fat or other nutrient. A prime example of this is the Women's Health Initiative Study. The intervention group decreased saturated fat intake compared to controls, but they also decrease MUFA, PUFA, trans‐fat, and cholesterol intake while increasing intake of fiber, fruits/vegetables, and grains. Thus, the study tells us nothing about the specific effects of saturated fat. The same can be said for most, if not all, of the other included studies. What is the rationale for including these studies in a review about the effects of saturated fat?
Reply
Thank you for your comments. As you know it is never possible to make a single change to dietary intake – if one nutrient is altered then its energy will be replaced by another nutrient. But more than that, we eat foods, so nutrients are grouped (the basis of our interest in dietary patterns). However good and explicit your dietary advice to a patient post‐MI you will never be able to effect a simple reduction in saturated fat and an increase in (for example) complex carbohydrate – other dietary changes will also happen. If a patient reduces their cheese intake their calcium intake will also fall, if that patient reduces their red meat intake their iron intake will fall. For this reason we focused on including studies that reduced saturated fat intake, regardless of what replaced it. The thinking is that this gives us the best idea of the effect of reducing saturated fat and as different studies replaced the saturated fat with slightly different nutrients any effect of these replacements will tend to be diluted out. However, because we included some trials that explicitly aimed to make additional dietary changes (for example, to reduce saturated fat and increase fruit and vegetable intake, like WHI) we ran sensitivity analyses to check effects omitting these trials (see analysis 1.43). When omitting these studies we have less power to see the effect of reducing saturated fat, but the effect size is very similar, suggesting that the effects we see are driven by the reduction in saturated fat, not the other dietary changes.
Contributors
Feedback editor: William Cayley
Lead author: Lee Hooper
What's new
| Date | Event | Description |
|---|---|---|
| 21 August 2020 | Amended | Data for the Sydney Diet‐Heart 1978 were added to primary outcome combined CVD events. This has slightly altered the effect of reducing saturated fat on combined cardiovascular events, from RR 0.79 (95% CI 0.66 to 0.93) to RR 0.83 (95% CI 0.70 to 0.98), but has not changed the overall conclusion. This suggests a reduction in cardiovascular events by 17% (moderate quality GRADE evidence). Additionally, some aspects of the review methods have been better explained, and points added to the discussion. |
| 21 August 2020 | New citation required but conclusions have not changed | Feedback incorporated, conclusions unchanged. |
History
Protocol first published: Issue 2, 1999 Review first published: Issue 6, 2015
| Date | Event | Description |
|---|---|---|
| 9 January 2020 | New citation required but conclusions have not changed | No new trials included, but four ongoing trials and one study awaiting assessment, and we found new data for two of the already included trials (WHI 2006; WINS 2006). We updated assessment of risk of bias, including assessment of summary risk of bias for each trial, and carrying out sensitivity analyses omitting trials not at low summary risk of bias. We updated assessment of small study bias by comparing results of fixed‐ and random‐effects meta‐analyses. Data, results, GRADE assessment and conclusions updated. |
| 29 December 2019 | New search has been performed | Searches updated to October 2019, searches of trials registers added. |
| 27 March 2015 | New citation required and conclusions have changed | We split a previously published review (Reduced or modified dietary fat for preventing cardiovascular disease, DOI: 10.1002/14651858.CD002137.pub3) into six smaller review updates. The conclusions are therefore now focused on reduction in saturated fat intake instead of reducing or modifying fat intake overall on its effect on cardiovascular disease risk. This split review update includes 15 randomised controlled trials. |
| 5 March 2014 | New search has been performed | The search has been updated to 5 March 2014. |
Acknowledgements
We gratefully acknowledge the help of the following investigators in providing information about their own and others' trials (whether eventually included or excluded): H Arnesen (Ullevål University Hospital), AV Astrup (University of Copenhagen), K Aziz (NICVD, Karachi), F Azizi (Research Institute for Endocrine Sciences, Tehran), SAA Beresford (University of Washington), HS Black (Baylor College of Medicine), BPM Bloemberg (National Institute of Public Health and Environmental Protection, Netherlands), DJ Bowen (Fred Hutchinson Cancer Research Center, Seattle), NF Boyd (University of Toronto), GA Bray (Pennington Biomedical Research Center, Baton Rouge), ML Burr (University of Wales), G Carruba (University of Palermo), L Castagnetta (University of Palermo), JL Curzio (University of Glasgow), RF DeBusk (Stanford University), C Defoort (Méditerranée University), Z Djuric (Wayne State University), A Due (University of Copenhagen), S Druker (University of Massachusetts), RPF Dullaart (University Hospital, Groningen), GE Eyssen (University of Toronto), TM Hayes (University Hospital of Wales, Cardiff), JA Heady (retired, formerly of MRC Social Medicine Research Unit), J Hebert (University of South Carolina), RJ Heine (Free University Hospital, Amsterdam), M‐L Hellenius (Karolinska Institute), RF Heller (University of Newcastle), TDR Hockaday (retired, formerly Radcliffe Infirmary), L‐E Holm (Swedish Radiation Protection Institute), DJ Hyman (Baylor College of Medicine, Houston), AFM Kardinaal (University of Wageningen), F Khan (Ninewells Hospital and Medical School, Dundee), RH Knopp (University of Washington), D Lairon (Méditerranée University), MEJ Lean (University of Glasgow), B Leelarthaepin (University of Sydney), P Leren (University of Oslo), A Lindman (University of Oslo), S Mackey (Stanford University), R MacLennan (retired, formerly of Queensland Institute of Medical Research), F Macrae (Royal Melbourne Hospital), JI Mann (University of Otago), J Marniemi (Social Insurance Institute), K McManus (Harvard Medical School), RP Mensink (Maastricht University), PA Metcalf (University of Auckland), A Michalsen (University Duisburg‐Essen), TF Moy (Johns Hopkins University), AR Ness (University of Bristol), I Okene (University of Massachusetts), GS Oostenbrug (Maastricht University), J Pierce (University of California, San Diego), SD Poppitt (University of Auckland), RJ Reber (University of Illinois), JE Reseland (University of Oslo), BM Retzlaff (University of Washington), AA Rivellese (Federico II University, Naples), P Roderick (University of Southampton), DP Rose (American Health Foundation), FM Sacks (Harvard School of Public Health), WHM Saris (University of Maastricht), ES Sarkkinen (University of Kuopio), A Schatzkin (National Cancer Institute), B Seppelt (German Institute of Human Nutrition), MS Simon (Wayne State University), B Smith (University of Kentucky), E Søndergaard (Svendborg Hospital, Svendborg), AS St. Leger (University of Manchester), VJ Stevens (Kaiser Permanente Centre for Health Research), A Stoddard (University of Massachusetts), LP Svetkey (Duke University Medical Center), LC Tapsell (University of Wollongong), BC Tilley (Medical University of South Carolina), H van den Berg (TNO Nutrition and Food Research Institute), W van Herpen (Unilever), K van het Hof (Unilever, Rotterdam), MW Verheijden (Wageningen University), GF Watts (University Hospital of Perth), AS Wierzbichi (St. Thomas's Hospital, London), PT Williams (Stanford University), RR Wing (University of Pittsburgh), PD Wood (Stanford University), I Zazpe (University of Navarra), PL Zock (Wageningen Centre for Food Studies).
Thank you to the peer reviewers who have contributed to this review update: Dr Dimitrios Koutoukidis of Nuffield Department of Primary Care Health Sciences, Zhou‐Qing Kang of Liaoning Provincial Hospital of Geriatrics, Kristina Petersen of Pennsylvania State University, and the additional referee (who preferred to remain anonymous) as well as to the Cochrane editors Sarah Hodgkinson and Karen Rees, and Charlene Bridges who expertly ran our searches.
We also gratefully acknowledge the expertise and help of the following who contributed to previous iterations of this systematic review: S Adams (Royal Free Hospital, London), B Anagnostelis (Royal Free Hospital, London), M Brand (Cochrane Hypertension Group), R Clarke (Universtiy of Oxford), D Darrah‐Morgan (Russian translation), A Donner (University of Western Ontario), D Fagard (University of East Anglia for duplication of inclusion and data extraction), Shweta Gidwani (University of Manchester), G Gubitz (Cochrane Stroke Group), M Haugh (Cochrane Renal Group), IU Haq (Northern General Hospital, Sheffield), J Hooper (Danish, Swedish and Norwegian translation), BK Hurley (Italian translation), L Jones (Systematic Reviews Training Unit, London), SPH Keen (Cochrane Diabetes Group), S Logan (Systematic Reviews Training Unit, London), LI Mennen (INSERM), T Moore (Cochrane Heart Group), J Muscroft (German and French translation), HL Newmark (Rutgers), E Royle (Cochrane Peripheral Vascular Diseases Group), I Tumur (Pfizer Ltd), AS Truswell (University of Sydney), M Turner (Chinese translation), JM Walsh (University of California), A Wierzbicki (St. Thomas' Hospital, London), WC Willett (Harvard School of Public Health), AF Winder (University of London).
Many thanks to those people who contributed to, and were co‐authors of, previous versions of this review (Hooper 2000; Hooper 2001; Hooper 2012; Hooper 2015a): Julian PT Higgins, Shah Ebrahim, George Davey Smith, Rudolph Riemersma, Nigel E Capps, Carolyn Summerbell, Rachel Thompson, Helen Moore, Diredre Sills, Felicia Roberts, Dorotheé Fagard and Gillian Clements.
Finally, many thanks for the members of the WHO NUGAG committee who took time to debate and discuss this review, and ensure that it was addressing the questions that WHO NUGAG were addressing. Members of this NUGAG subcommittee included Nahla C Houalla (American University of Beirut), Jim Mann (University of Otago), Barbara O Schneeman (University of California at Davis), Mary R L'Abbé (University of Toronto), Murray Skeaff (University of Otago), Due Li (Zhejiang University), Russell de Souza (McMaster University), Ibrahim Elmadfa (University of Vienna). Thank you too to all of the NUGAG group members, and members of WHO including Jason Montez, Chizuru Nishida and Emma Kennedy.
Appendices
Appendix 1. Search strategies 2019
CENTRAL
#1 lipid near (low* or reduc* or modifi*)
#2 cholesterol* near (low* or modifi* or reduc*)
#3 (#1 or #2)
#4 MeSH descriptor: [Nutrition Therapy] explode all trees
#5 diet* or food* or nutrition*
#6 (#4 or #5)
#7 (#3 and #6)
#8 fat* near (low* or reduc* or modifi* or animal* or saturat* or unsaturat*)
#9 MeSH descriptor: [Diet, Atherogenic] explode all trees
#10 MeSH descriptor: [Diet Therapy] explode all trees
#11 (#7 or #8 or #9 or #10)
#12 MeSH descriptor: [Cardiovascular Diseases] this term only
#13 MeSH descriptor: [Heart Diseases] explode all trees
#14 MeSH descriptor: [Vascular Diseases] explode all trees
#15 MeSH descriptor: [Cerebrovascular Disorders] this term only
#16 MeSH descriptor: [Brain Ischemia] explode all trees
#17 MeSH descriptor: [Carotid Artery Diseases] explode all trees
#18 MeSH descriptor: [Dementia, Vascular] explode all trees
#19 MeSH descriptor: [Intracranial Arterial Diseases] explode all trees
#20 MeSH descriptor: [Intracranial Embolism and Thrombosis] explode all trees
#21 MeSH descriptor: [Intracranial Hemorrhages] explode all trees
#22 MeSH descriptor: [Stroke] explode all trees
#23 coronar* near (bypas* or graft* or disease* or event*)
#24 cerebrovasc* or cardiovasc* or mortal* or angina* or stroke or strokes or tia or ischaem* or ischem*
#25 myocardi* near (infarct* or revascular* or ischaem* or ischem*)
#26 morbid* near (heart* or coronar* or ischaem* or ischem* or myocard*)
#27 vascular* near (peripheral* or disease* or complication*)
#28 heart* near (disease* or attack* or bypas*)
#29 (#12 or #13 or #14 or #15 or #16 or #17 or #18 or #19 or #20 or #21 or #22 or #23 or #24 or #25 or #26 or #27 or #28)
#30 (#11 and #29) Date added to CENTRAL trials database: 05/03/2014‐15/10/2019
MEDLINE OVID
1. (lipid$ adj5 (low$ or reduc$ or modifi$)).mp.
2. (cholesterol$ adj5 (low$ or modific$ or reduc$)).mp.
3. 1 or 2
4. exp Nutrition Therapy/
5. (diet$ or food$ or nutrition$).mp.
6. 4 or 5
7. 3 and 6
8. (fat adj5 (low$ or reduc$ or modifi$ or animal$ or saturat$ or unsatur$)).mp.
9. exp Diet, Atherogenic/
10. exp Diet Therapy/
11. 7 or 8 or 9 or 10
12. cardiovascular diseases/ or exp heart diseases/ or exp vascular diseases/
13. cerebrovascular disorders/ or exp brain ischemia/ or exp carotid artery diseases/ or exp dementia, vascular/ or exp intracranial arterial diseases/ or exp "intracranial embolism and thrombosis"/ or exp intracranial hemorrhages/ or exp stroke/
14. (coronar$ adj5 (bypas$ or graft$ or disease$ or event$)).mp
15. (cerebrovasc$ or cardiovasc$ or mortal$ or angina$ or stroke or strokes).mp.
16. (myocardi$ adj5 (infarct$ or revascular$ or ischaemi$ or ischemi$)).mp.
17. (morbid$ adj5 (heart$ or coronar$ or ischaem$ or ischem$ or myocard$)).mp.
18. (vascular$ adj5 (peripheral$ or disease$ or complication$)).mp.
19. (heart$ adj5 (disease$ or attack$ or bypass$)).mp.
20. 12 or 13 or 14 or 15 or 16 or 17 or 18 or 19
21. 11 and 20
22. randomized controlled trial.pt.
23. controlled clinical trial.pt.
24. randomized.ab.
25. placebo.ab.
26. drug therapy.fs.
27. randomly.ab.
28. trial.ab.
29. groups.ab.
30. 22 or 23 or 24 or 25 or 26 or 27 or 28 or 29
31. exp animals/ not humans.sh.
32. 30 not 31
33. 21 and 32
34. limit 33 to ed=20140305‐20191015
Embase OVID
1. cardiovascular diseases/ or exp heart diseases/ or exp vascular diseases/
2. cerebrovascular disorders/ or exp brain ischemia/ or exp carotid artery diseases/ or exp dementia, vascular/ or exp intracranial arterial diseases/ or exp "intracranial embolism and thrombosis"/ or exp intracranial hemorrhages/ or exp stroke/
3. (coronar$ adj5 (bypas$ or graft$ or disease$ or event$)).mp.
4. (cerebrovasc$ or cardiovasc$ or mortal$ or angina$ or stroke or strokes).mp.
5. (myocardi$ adj5 (infarct$ or revascular$ or ischaemi$ or ischemi$)).mp.
6. (morbid$ adj5 (heart$ or coronar$ or ischaem$ or ischem$ or myocard$)).mp.
7. (vascular$ adj5 (peripheral$ or disease$ or complication$)).mp.
8. (heart$ adj5 (disease$ or attack$ or bypass$)).mp.
9. or/1‐8
10. (lipid$ adj5 (low$ or reduc$ or modifi$)).mp.
11. (cholesterol$ adj5 (low$ or modific$ or reduc$)).mp.
12. 10 or 11
13. (diet$ or food$ or eat$ or nutrition$).mp.
14. exp nutrition/
15. 13 or 14
16. 12 and 15
17. (fat adj5 (low$ or reduc$ or modifi$ or animal$ or saturat$ or unsatur$)).mp.
18. exp lipid diet/ or exp fat intake/ or exp low fat diet/
19. 16 or 17 or 18
20. 9 and 19
21. random$.tw.
22. factorial$.tw.
23. crossover$.tw.
24. cross over$.tw.
25. cross‐over$.tw.
26. placebo$.tw.
27. (doubl$ adj blind$).tw.
28. (singl$ adj blind$).tw.
29. assign$.tw.
30. allocat$.tw.
31. volunteer$.tw.
32. crossover procedure/
33. double blind procedure/
34. randomized controlled trial/
35. single blind procedure/
36. 21 or 22 or 23 or 24 or 25 or 26 or 27 or 28 or 29 or 30 or 31 or 32 or 33 or 34 or 35
37. (animal/ or nonhuman/) not human/
38. 36 not 37
39. 20 and 38
40. limit 39 to dd=20140305‐20191015
Clinicaltrials.gov
Condition or disease: Cardiovascular Diseases OR CVD OR "heart disease"
Intervention/treatment: Dietary Fats OR saturated OR unsaturated OR fat
Study type: Interventional Studies (Clinical Trials)
ICTRP
Condition: Cardiovascular Diseases OR CVD OR heart disease
Intervention: Dietary Fats OR saturated OR unsaturated OR fat
Data and analyses
Comparison 1. SFA reduction vs usual diet ‐ primary outcomes.
| Outcome or subgroup title | No. of studies | No. of participants | Statistical method | Effect size |
|---|---|---|---|---|
| 1.1 ALL‐CAUSE MORTALITY | 12 | 55858 | Risk Ratio (M‐H, Random, 95% CI) | 0.96 [0.90, 1.03] |
| 1.2 All‐cause mortality, SA low summary risk of bias | 7 | 53219 | Risk Ratio (M‐H, Random, 95% CI) | 0.95 [0.84, 1.08] |
| 1.3 All‐cause mortality, SA aim to reduce SFA | 9 | 53112 | Risk Ratio (M‐H, Random, 95% CI) | 0.97 [0.89, 1.06] |
| 1.4 All‐cause mortality, SA statistically significant SFA reduction | 8 | 54973 | Risk Ratio (M‐H, Random, 95% CI) | 0.98 [0.92, 1.04] |
| 1.5 All‐cause mortality, SA TC reduction | 8 | 53073 | Risk Ratio (M‐H, Random, 95% CI) | 0.97 [0.88, 1.07] |
| 1.6 All‐cause mortality, SA excluding WHI | 11 | 7023 | Risk Ratio (M‐H, Random, 95% CI) | 0.95 [0.83, 1.07] |
| 1.7 All‐cause mortality, SA Mantel‐Haenszel fixed‐effect | 12 | 55858 | Risk Ratio (M‐H, Fixed, 95% CI) | 0.97 [0.91, 1.03] |
| 1.8 All‐cause mortality, SA Peto fixed‐effect | 12 | 55858 | Peto Odds Ratio (Peto, Fixed, 95% CI) | 0.96 [0.90, 1.04] |
| 1.9 All‐cause mortality, subgroup by any substitution | 12 | Risk Ratio (M‐H, Random, 95% CI) | Subtotals only | |
| 1.9.1 replaced by PUFA | 7 | 4238 | Risk Ratio (M‐H, Random, 95% CI) | 0.96 [0.82, 1.13] |
| 1.9.2 replaced by MUFA | 1 | 52 | Risk Ratio (M‐H, Random, 95% CI) | 3.00 [0.33, 26.99] |
| 1.9.3 replaced by CHO | 6 | 53669 | Risk Ratio (M‐H, Random, 95% CI) | 0.97 [0.90, 1.04] |
| 1.9.4 replaced by protein | 5 | 53614 | Risk Ratio (M‐H, Random, 95% CI) | 0.97 [0.90, 1.04] |
| 1.9.5 replacement unclear | 0 | 0 | Risk Ratio (M‐H, Random, 95% CI) | Not estimable |
| 1.10 All‐cause mortality, subgroup by main substitution | 12 | Risk Ratio (M‐H, Random, 95% CI) | Subtotals only | |
| 1.10.1 replaced by PUFA | 6 | 4183 | Risk Ratio (M‐H, Random, 95% CI) | 0.97 [0.82, 1.14] |
| 1.10.2 replaced by MUFA | 1 | 52 | Risk Ratio (M‐H, Random, 95% CI) | 3.00 [0.33, 26.99] |
| 1.10.3 replaced by CHO | 5 | 51636 | Risk Ratio (M‐H, Random, 95% CI) | 0.97 [0.90, 1.04] |
| 1.10.4 replaced by protein | 0 | 0 | Risk Ratio (M‐H, Random, 95% CI) | Not estimable |
| 1.10.5 replacement unclear | 0 | 0 | Risk Ratio (M‐H, Random, 95% CI) | Not estimable |
| 1.11 All‐cause mortality, subgroup by duration | 12 | 55858 | Risk Ratio (M‐H, Random, 95% CI) | 0.96 [0.90, 1.03] |
| 1.11.1 up to 24mo | 4 | 2246 | Risk Ratio (M‐H, Random, 95% CI) | 0.99 [0.78, 1.26] |
| 1.11.2 >24 to 48mo | 3 | 1294 | Risk Ratio (M‐H, Random, 95% CI) | 0.96 [0.83, 1.12] |
| 1.11.3 >48mo | 4 | 52142 | Risk Ratio (M‐H, Random, 95% CI) | 0.96 [0.79, 1.16] |
| 1.11.4 unclear duration | 1 | 176 | Risk Ratio (M‐H, Random, 95% CI) | 0.33 [0.07, 1.61] |
| 1.12 All‐cause mortality, subgroup by baseline SFA | 12 | 55858 | Risk Ratio (M‐H, Random, 95% CI) | 0.96 [0.90, 1.03] |
| 1.12.1 up to 12%E SFA baseline | 1 | 2437 | Risk Ratio (M‐H, Random, 95% CI) | 0.90 [0.67, 1.21] |
| 1.12.2 >12 to 15%E SFA baseline | 5 | 51635 | Risk Ratio (M‐H, Random, 95% CI) | 1.01 [0.86, 1.19] |
| 1.12.3 >15 to 18%E SFA baseline | 1 | 55 | Risk Ratio (M‐H, Random, 95% CI) | 0.35 [0.04, 3.12] |
| 1.12.4 >18%E SFA baseline | 1 | 846 | Risk Ratio (M‐H, Random, 95% CI) | 0.98 [0.83, 1.15] |
| 1.12.5 unclear | 4 | 885 | Risk Ratio (M‐H, Random, 95% CI) | 0.80 [0.62, 1.04] |
| 1.13 All‐cause mortality, subgroup by SFA change | 12 | 55858 | Risk Ratio (M‐H, Random, 95% CI) | 0.96 [0.90, 1.03] |
| 1.13.1 up to 4%E difference | 5 | 53939 | Risk Ratio (M‐H, Random, 95% CI) | 0.99 [0.86, 1.13] |
| 1.13.2 >4 to 8%E difference | 2 | 188 | Risk Ratio (M‐H, Random, 95% CI) | 0.41 [0.08, 2.07] |
| 1.13.3 >8%E difference | 1 | 846 | Risk Ratio (M‐H, Random, 95% CI) | 0.98 [0.83, 1.15] |
| 1.13.4 unclear | 4 | 885 | Risk Ratio (M‐H, Random, 95% CI) | 0.80 [0.62, 1.04] |
| 1.14 All‐cause mortality, subgroup by sex | 12 | 55858 | Risk Ratio (M‐H, Random, 95% CI) | 0.96 [0.90, 1.03] |
| 1.14.1 Men | 9 | 4410 | Risk Ratio (M‐H, Random, 95% CI) | 0.96 [0.83, 1.11] |
| 1.14.2 Women | 2 | 51272 | Risk Ratio (M‐H, Random, 95% CI) | 0.97 [0.90, 1.05] |
| 1.14.3 Mixed, men and women | 1 | 176 | Risk Ratio (M‐H, Random, 95% CI) | 0.33 [0.07, 1.61] |
| 1.15 All‐cause mortality, subgroup by CVD risk | 12 | 55858 | Risk Ratio (M‐H, Random, 95% CI) | 0.96 [0.90, 1.03] |
| 1.15.1 Low CVD risk | 4 | 52251 | Risk Ratio (M‐H, Random, 95% CI) | 0.97 [0.91, 1.04] |
| 1.15.2 Moderate CVD risk | 1 | 176 | Risk Ratio (M‐H, Random, 95% CI) | 0.33 [0.07, 1.61] |
| 1.15.3 Existing CVD disease | 7 | 3431 | Risk Ratio (M‐H, Random, 95% CI) | 0.97 [0.76, 1.24] |
| 1.16 All‐cause mortality, subgroup by TC reduction | 12 | Risk Ratio (M‐H, Random, 95% CI) | Subtotals only | |
| 1.16.1 serum chol reduced by at least 0.2mmol/L | 7 | 4238 | Risk Ratio (M‐H, Random, 95% CI) | 0.96 [0.81, 1.14] |
| 1.16.2 serum chol reduced by <0.2mmol/L | 4 | 51487 | Risk Ratio (M‐H, Random, 95% CI) | 0.97 [0.90, 1.04] |
| 1.16.3 serum chol reduction unclear | 1 | 133 | Risk Ratio (M‐H, Random, 95% CI) | 0.51 [0.05, 5.46] |
| 1.17 All‐cause mortality, subgroup decade of publication | 12 | 55858 | Risk Ratio (M‐H, Random, 95% CI) | 0.96 [0.90, 1.03] |
| 1.17.1 1960s | 5 | 1731 | Risk Ratio (M‐H, Random, 95% CI) | 0.92 [0.80, 1.07] |
| 1.17.2 1970s | 1 | 458 | Risk Ratio (M‐H, Random, 95% CI) | 1.49 [0.95, 2.34] |
| 1.17.3 1980s | 1 | 2033 | Risk Ratio (M‐H, Random, 95% CI) | 0.98 [0.76, 1.25] |
| 1.17.4 1990s | 2 | 188 | Risk Ratio (M‐H, Random, 95% CI) | 0.41 [0.08, 2.07] |
| 1.17.5 2000s | 3 | 51448 | Risk Ratio (M‐H, Random, 95% CI) | 0.97 [0.88, 1.05] |
| 1.18 CARDIOVASCULAR MORTALITY | 11 | 53421 | Risk Ratio (M‐H, Random, 95% CI) | 0.94 [0.78, 1.13] |
| 1.19 CVD mortality, SA low summary risk of bias | 4 | 50315 | Risk Ratio (M‐H, Random, 95% CI) | 0.96 [0.67, 1.38] |
| 1.20 CVD mortality, SA aim to reduce SFA | 9 | 53112 | Risk Ratio (M‐H, Random, 95% CI) | 0.95 [0.79, 1.14] |
| 1.21 CVD mortality, SA statistically significant SFA reduction | 7 | 52536 | Risk Ratio (M‐H, Random, 95% CI) | 0.95 [0.75, 1.21] |
| 1.22 CVD mortality, SA TC reduction | 8 | 53073 | Risk Ratio (M‐H, Random, 95% CI) | 0.95 [0.78, 1.15] |
| 1.23 CVD mortality, SA excluding WHI | 10 | 4586 | Risk Ratio (M‐H, Random, 95% CI) | 0.92 [0.72, 1.18] |
| 1.24 CVD mortality, SA Mantel‐Haenszel fixed‐effect | 11 | 53421 | Risk Ratio (M‐H, Fixed, 95% CI) | 0.95 [0.85, 1.07] |
| 1.25 CVD mortality, SA Peto fixed‐effect | 11 | 53421 | Peto Odds Ratio (Peto, Fixed, 95% CI) | 0.95 [0.84, 1.08] |
| 1.26 CVD mortality, subgroup by any substitution | 11 | Risk Ratio (M‐H, Random, 95% CI) | Subtotals only | |
| 1.26.1 replaced by PUFA | 7 | 4251 | Risk Ratio (M‐H, Random, 95% CI) | 0.95 [0.73, 1.25] |
| 1.26.2 replaced by MUFA | 1 | 52 | Risk Ratio (M‐H, Random, 95% CI) | 3.00 [0.33, 26.99] |
| 1.26.3 replace by CHO | 5 | 51232 | Risk Ratio (M‐H, Random, 95% CI) | 0.99 [0.85, 1.14] |
| 1.26.4 replaced by protein | 4 | 51177 | Risk Ratio (M‐H, Random, 95% CI) | 0.99 [0.86, 1.14] |
| 1.26.5 replacement unclear | 0 | 0 | Risk Ratio (M‐H, Random, 95% CI) | Not estimable |
| 1.27 CVD mortality, subgroup by main substitution | 11 | Risk Ratio (M‐H, Random, 95% CI) | Subtotals only | |
| 1.27.1 replaced by PUFA | 6 | 4196 | Risk Ratio (M‐H, Random, 95% CI) | 0.97 [0.73, 1.28] |
| 1.27.2 replaced by MUFA | 1 | 52 | Risk Ratio (M‐H, Random, 95% CI) | 3.00 [0.33, 26.99] |
| 1.27.3 replace by CHO | 4 | 49199 | Risk Ratio (M‐H, Random, 95% CI) | 0.78 [0.42, 1.46] |
| 1.27.4 replaced by protein | 0 | 0 | Risk Ratio (M‐H, Random, 95% CI) | Not estimable |
| 1.27.5 replacement unclear | 0 | 0 | Risk Ratio (M‐H, Random, 95% CI) | Not estimable |
| 1.28 CVD mortality, subgroup by duration | 11 | 53447 | Risk Ratio (M‐H, Random, 95% CI) | 0.95 [0.78, 1.16] |
| 1.28.1 up to 24mo | 4 | 2272 | Risk Ratio (M‐H, Random, 95% CI) | 1.26 [0.54, 2.94] |
| 1.28.2 >24 to 48mo | 3 | 1294 | Risk Ratio (M‐H, Random, 95% CI) | 0.79 [0.57, 1.08] |
| 1.28.3 >48 mo | 3 | 49705 | Risk Ratio (M‐H, Random, 95% CI) | 1.02 [0.73, 1.43] |
| 1.28.4 unclear duration | 1 | 176 | Risk Ratio (M‐H, Random, 95% CI) | 0.25 [0.03, 2.19] |
| 1.29 CVD mortality, subgroup by baseline SFA | 11 | 53447 | Risk Ratio (M‐H, Random, 95% CI) | 0.95 [0.78, 1.16] |
| 1.29.1 up to 12%E SFA baseline | 0 | 0 | Risk Ratio (M‐H, Random, 95% CI) | Not estimable |
| 1.29.2 >12 to 15%E SFA baseline | 5 | 51635 | Risk Ratio (M‐H, Random, 95% CI) | 1.06 [0.84, 1.32] |
| 1.29.3 >15 to 18%E SFA baseline | 1 | 55 | Risk Ratio (M‐H, Random, 95% CI) | 0.35 [0.04, 3.12] |
| 1.29.4 >18%E SFA baseline | 1 | 846 | Risk Ratio (M‐H, Random, 95% CI) | 0.70 [0.51, 0.96] |
| 1.29.5 unclear | 4 | 911 | Risk Ratio (M‐H, Random, 95% CI) | 1.00 [0.61, 1.66] |
| 1.30 CVD mortality, subgroup by SFA change | 11 | 53447 | Risk Ratio (M‐H, Random, 95% CI) | 0.95 [0.78, 1.16] |
| 1.30.1 up to 4%E difference | 4 | 51502 | Risk Ratio (M‐H, Random, 95% CI) | 1.07 [0.85, 1.33] |
| 1.30.2 >4 to 8%E difference | 2 | 188 | Risk Ratio (M‐H, Random, 95% CI) | 0.29 [0.05, 1.70] |
| 1.30.3 >8%E difference | 1 | 846 | Risk Ratio (M‐H, Random, 95% CI) | 0.70 [0.51, 0.96] |
| 1.30.4 unclear | 4 | 911 | Risk Ratio (M‐H, Random, 95% CI) | 1.00 [0.61, 1.66] |
| 1.31 CVD mortality, subgroup by sex | 11 | 53447 | Risk Ratio (M‐H, Random, 95% CI) | 0.95 [0.78, 1.16] |
| 1.31.1 Men | 9 | 4436 | Risk Ratio (M‐H, Random, 95% CI) | 0.96 [0.73, 1.25] |
| 1.31.2 Women | 1 | 48835 | Risk Ratio (M‐H, Random, 95% CI) | 1.00 [0.84, 1.19] |
| 1.31.3 Mixed, men and women | 1 | 176 | Risk Ratio (M‐H, Random, 95% CI) | 0.25 [0.03, 2.19] |
| 1.32 CVD mortality, subgroup by CVD risk | 11 | 53447 | Risk Ratio (M‐H, Random, 95% CI) | 0.96 [0.80, 1.14] |
| 1.32.1 Low CVD risk | 3 | 47537 | Risk Ratio (M‐H, Random, 95% CI) | 0.84 [0.60, 1.16] |
| 1.32.2 Moderate CVD risk | 1 | 176 | Risk Ratio (M‐H, Random, 95% CI) | 0.25 [0.03, 2.19] |
| 1.32.3 Existing CVD disease | 8 | 5734 | Risk Ratio (M‐H, Random, 95% CI) | 1.04 [0.83, 1.31] |
| 1.33 CVD mortality, subgroup by TC reduction | 11 | Risk Ratio (M‐H, Random, 95% CI) | Subtotals only | |
| 1.33.1 serum chol reduced by at least 0.2mmol/L | 7 | 4251 | Risk Ratio (M‐H, Random, 95% CI) | 0.95 [0.73, 1.25] |
| 1.33.2 serum chol reduced by <0.2mmol/L | 3 | 49063 | Risk Ratio (M‐H, Random, 95% CI) | 0.97 [0.47, 2.01] |
| 1.33.3 serum chol reduction unclear | 1 | 133 | Risk Ratio (M‐H, Random, 95% CI) | 0.20 [0.01, 4.15] |
| 1.34 CVD mortality, subgroup decade of publication | 11 | 53421 | Risk Ratio (M‐H, Random, 95% CI) | 0.94 [0.78, 1.13] |
| 1.34.1 1960s | 5 | 1731 | Risk Ratio (M‐H, Random, 95% CI) | 0.78 [0.63, 0.97] |
| 1.34.2 1970s | 1 | 458 | Risk Ratio (M‐H, Random, 95% CI) | 1.59 [0.99, 2.55] |
| 1.34.3 1980s | 1 | 2033 | Risk Ratio (M‐H, Random, 95% CI) | 1.01 [0.77, 1.31] |
| 1.34.4 1990s | 2 | 188 | Risk Ratio (M‐H, Random, 95% CI) | 0.29 [0.05, 1.70] |
| 1.34.5 2000s | 2 | 49011 | Risk Ratio (M‐H, Random, 95% CI) | 0.78 [0.27, 2.21] |
| 1.35 COMBINED CARDIOVASCULAR EVENTS | 13 | 53758 | Risk Ratio (M‐H, Random, 95% CI) | 0.83 [0.70, 0.98] |
| 1.36 CVD events, SA low summary risk of bias | 4 | 50315 | Risk Ratio (M‐H, Random, 95% CI) | 0.96 [0.76, 1.20] |
| 1.37 CVD events, SA aim to reduce SFA | 11 | 53449 | Risk Ratio (M‐H, Random, 95% CI) | 0.84 [0.70, 1.00] |
| 1.38 CVD events, SA statistically significant SFA reduction | 8 | 52771 | Risk Ratio (M‐H, Random, 95% CI) | 0.90 [0.74, 1.08] |
| 1.39 CVD events, SA TC reduction | 10 | 53410 | Risk Ratio (M‐H, Random, 95% CI) | 0.83 [0.69, 1.00] |
| 1.40 CVD events, SA excluding WHI | 12 | 4923 | Risk Ratio (M‐H, Random, 95% CI) | 0.79 [0.64, 0.98] |
| 1.41 CVD events, SA Mantel‐Haenszel fixed‐effect | 13 | 53758 | Risk Ratio (M‐H, Fixed, 95% CI) | 0.94 [0.89, 0.99] |
| 1.42 CVD events, SA Peto fixed‐effect | 13 | 53758 | Peto Odds Ratio (Peto, Fixed, 95% CI) | 0.93 [0.88, 0.99] |
| 1.43 CVD events, SA excluding trials with additional interventions | 10 | 4456 | Risk Ratio (M‐H, Random, 95% CI) | 0.86 [0.67, 1.09] |
| 1.44 CVD events, subgroup by any substitution | 13 | Risk Ratio (M‐H, Random, 95% CI) | Subtotals only | |
| 1.44.1 replaced by PUFA | 8 | 4353 | Risk Ratio (M‐H, Random, 95% CI) | 0.79 [0.62, 1.00] |
| 1.44.2 replaced by MUFA | 1 | 52 | Risk Ratio (M‐H, Random, 95% CI) | 1.00 [0.53, 1.89] |
| 1.44.3 replace by CHO | 5 | 51232 | Risk Ratio (M‐H, Random, 95% CI) | 0.84 [0.67, 1.06] |
| 1.44.4 replaced by protein | 4 | 51177 | Risk Ratio (M‐H, Random, 95% CI) | 0.97 [0.91, 1.03] |
| 1.44.5 replacement unclear | 1 | 235 | Risk Ratio (M‐H, Random, 95% CI) | 1.68 [0.41, 6.87] |
| 1.45 CVD events, subgroup by main substitution | 13 | Risk Ratio (M‐H, Random, 95% CI) | Subtotals only | |
| 1.45.1 replaced by PUFA | 7 | 4298 | Risk Ratio (M‐H, Random, 95% CI) | 0.84 [0.66, 1.06] |
| 1.45.2 replaced by MUFA | 1 | 52 | Risk Ratio (M‐H, Random, 95% CI) | 1.00 [0.53, 1.89] |
| 1.45.3 replace by CHO | 4 | 49199 | Risk Ratio (M‐H, Random, 95% CI) | 0.67 [0.39, 1.16] |
| 1.45.4 replaced by protein | 0 | 0 | Risk Ratio (M‐H, Random, 95% CI) | Not estimable |
| 1.45.5 replacement unclear | 1 | 235 | Risk Ratio (M‐H, Random, 95% CI) | 1.68 [0.41, 6.87] |
| 1.46 CVD events, subgroup by duration | 13 | 53758 | Risk Ratio (M‐H, Random, 95% CI) | 0.83 [0.70, 0.98] |
| 1.46.1 up to 24mo | 5 | 2481 | Risk Ratio (M‐H, Random, 95% CI) | 0.96 [0.78, 1.16] |
| 1.46.2 >24 to 48mo | 3 | 1294 | Risk Ratio (M‐H, Random, 95% CI) | 0.73 [0.56, 0.95] |
| 1.46.3 >48mo | 3 | 49705 | Risk Ratio (M‐H, Random, 95% CI) | 0.97 [0.72, 1.33] |
| 1.46.4 unclear duration | 2 | 278 | Risk Ratio (M‐H, Random, 95% CI) | 0.43 [0.17, 1.08] |
| 1.47 CVD events, subgroup by baseline SFA | 13 | 53758 | Risk Ratio (M‐H, Random, 95% CI) | 0.83 [0.70, 0.98] |
| 1.47.1 up to 12%E SFA baseline | 0 | 0 | Risk Ratio (M‐H, Random, 95% CI) | Not estimable |
| 1.47.2 >12 to 15%E SFA baseline | 6 | 51870 | Risk Ratio (M‐H, Random, 95% CI) | 0.99 [0.85, 1.15] |
| 1.47.3 >15 to 18%E SFA baseline | 1 | 55 | Risk Ratio (M‐H, Random, 95% CI) | 0.41 [0.22, 0.78] |
| 1.47.4 >18%E SFA baseline | 1 | 846 | Risk Ratio (M‐H, Random, 95% CI) | 0.79 [0.63, 1.00] |
| 1.47.5 unclear | 5 | 987 | Risk Ratio (M‐H, Random, 95% CI) | 0.72 [0.51, 1.03] |
| 1.48 CVD events, subgroup by SFA change | 13 | 53758 | Risk Ratio (M‐H, Random, 95% CI) | 0.83 [0.70, 0.98] |
| 1.48.1 up to 4%E difference | 5 | 51737 | Risk Ratio (M‐H, Random, 95% CI) | 1.00 [0.86, 1.16] |
| 1.48.2 >4 to 8%E difference | 2 | 188 | Risk Ratio (M‐H, Random, 95% CI) | 0.40 [0.22, 0.74] |
| 1.48.3 >8%E difference | 1 | 846 | Risk Ratio (M‐H, Random, 95% CI) | 0.79 [0.63, 1.00] |
| 1.48.4 unclear | 5 | 987 | Risk Ratio (M‐H, Random, 95% CI) | 0.72 [0.51, 1.03] |
| 1.49 CVD events, subgroup by sex | 13 | 53758 | Risk Ratio (M‐H, Random, 95% CI) | 0.83 [0.70, 0.98] |
| 1.49.1 Men | 9 | 4410 | Risk Ratio (M‐H, Random, 95% CI) | 0.85 [0.71, 1.03] |
| 1.49.2 Women | 1 | 48835 | Risk Ratio (M‐H, Random, 95% CI) | 0.98 [0.92, 1.04] |
| 1.49.3 Mixed, men and women | 3 | 513 | Risk Ratio (M‐H, Random, 95% CI) | 0.59 [0.23, 1.49] |
| 1.50 CVD events, subgroup by CVD risk | 13 | 53758 | Risk Ratio (M‐H, Random, 95% CI) | 0.86 [0.74, 1.00] |
| 1.50.1 Low CVD risk | 3 | 47537 | Risk Ratio (M‐H, Random, 95% CI) | 0.89 [0.75, 1.06] |
| 1.50.2 Moderate CVD risk | 3 | 513 | Risk Ratio (M‐H, Random, 95% CI) | 0.59 [0.23, 1.49] |
| 1.50.3 Existing CVD disease | 8 | 5708 | Risk Ratio (M‐H, Random, 95% CI) | 0.91 [0.75, 1.12] |
| 1.51 CVD events, subgroup by TC reduction | 13 | Risk Ratio (M‐H, Random, 95% CI) | Subtotals only | |
| 1.51.1 serum chol reduced by at least 0.2mmol/L | 9 | 4575 | Risk Ratio (M‐H, Random, 95% CI) | 0.79 [0.63, 1.00] |
| 1.51.2 serum chol reduced by <0.2mmol/L | 3 | 49050 | Risk Ratio (M‐H, Random, 95% CI) | 0.98 [0.91, 1.04] |
| 1.51.3 serum chol reduction unclear | 1 | 133 | Risk Ratio (M‐H, Random, 95% CI) | 0.20 [0.01, 4.15] |
| 1.52 CVD events, subgroup decade of publication | 13 | 53758 | Risk Ratio (M‐H, Random, 95% CI) | 0.83 [0.70, 0.98] |
| 1.52.1 1960s | 5 | 1731 | Risk Ratio (M‐H, Random, 95% CI) | 0.79 [0.69, 0.91] |
| 1.52.2 1970s | 2 | 560 | Risk Ratio (M‐H, Random, 95% CI) | 0.66 [0.12, 3.80] |
| 1.52.3 1980s | 1 | 2033 | Risk Ratio (M‐H, Random, 95% CI) | 0.92 [0.74, 1.15] |
| 1.52.4 1990s | 2 | 188 | Risk Ratio (M‐H, Random, 95% CI) | 0.40 [0.22, 0.74] |
| 1.52.5 2000s | 3 | 49246 | Risk Ratio (M‐H, Random, 95% CI) | 0.98 [0.91, 1.04] |
Comparison 2. SFA reduction vs usual diet ‐ secondary health events.
| Outcome or subgroup title | No. of studies | No. of participants | Statistical method | Effect size |
|---|---|---|---|---|
| 2.1 MYOCARDIAL INFARCTION | 11 | 53167 | Risk Ratio (M‐H, Random, 95% CI) | 0.90 [0.80, 1.01] |
| 2.2 MI, SA by low summary risk of bias | 3 | 49857 | Risk Ratio (M‐H, Random, 95% CI) | 0.93 [0.81, 1.08] |
| 2.3 MI, SA aim to reduce SFA | 10 | 52991 | Risk Ratio (M‐H, Random, 95% CI) | 0.89 [0.78, 1.02] |
| 2.4 MI, SA statistically significant SFA reduction | 6 | 52180 | Risk Ratio (M‐H, Random, 95% CI) | 0.94 [0.85, 1.04] |
| 2.5 MI, SA by TC reduction | 9 | 52952 | Risk Ratio (M‐H, Random, 95% CI) | 0.88 [0.77, 1.01] |
| 2.6 MI, SA excluding WHI | 10 | 4332 | Risk Ratio (M‐H, Random, 95% CI) | 0.85 [0.73, 0.98] |
| 2.7 MI, SA Mantel‐Haenszel fixed‐effect | 11 | 53167 | Risk Ratio (M‐H, Fixed, 95% CI) | 0.92 [0.84, 1.01] |
| 2.8 MI, SA Peto fixed‐effect | 11 | 53167 | Peto Odds Ratio (Peto, Fixed, 95% CI) | 0.92 [0.83, 1.01] |
| 2.9 MI, subgroup by any substitution | 11 | Risk Ratio (M‐H, Random, 95% CI) | Subtotals only | |
| 2.9.1 replaced by PUFA | 7 | 3895 | Risk Ratio (M‐H, Random, 95% CI) | 0.83 [0.67, 1.02] |
| 2.9.2 replaced by MUFA | 1 | 52 | Risk Ratio (M‐H, Random, 95% CI) | 1.40 [0.51, 3.85] |
| 2.9.3 replace by CHO | 4 | 51099 | Risk Ratio (M‐H, Random, 95% CI) | 0.96 [0.86, 1.06] |
| 2.9.4 replaced by protein | 3 | 51044 | Risk Ratio (M‐H, Random, 95% CI) | 0.96 [0.86, 1.07] |
| 2.9.5 replacement unclear | 1 | 235 | Risk Ratio (M‐H, Random, 95% CI) | 2.02 [0.19, 21.94] |
| 2.10 MI, subgroup by main substitution | 11 | Risk Ratio (M‐H, Random, 95% CI) | Subtotals only | |
| 2.10.1 replaced by PUFA | 6 | 3840 | Risk Ratio (M‐H, Random, 95% CI) | 0.83 [0.67, 1.04] |
| 2.10.2 replaced by MUFA | 1 | 52 | Risk Ratio (M‐H, Random, 95% CI) | 1.40 [0.51, 3.85] |
| 2.10.3 replace by CHO | 3 | 49066 | Risk Ratio (M‐H, Random, 95% CI) | 0.97 [0.86, 1.09] |
| 2.10.4 replaced by protein | 0 | 0 | Risk Ratio (M‐H, Random, 95% CI) | Not estimable |
| 2.10.5 replacement unclear | 1 | 235 | Risk Ratio (M‐H, Random, 95% CI) | 2.02 [0.19, 21.94] |
| 2.11 MI, subgroup by duration | 11 | 53167 | Risk Ratio (M‐H, Random, 95% CI) | 0.90 [0.80, 1.01] |
| 2.11.1 up to 24mo | 4 | 2348 | Risk Ratio (M‐H, Random, 95% CI) | 0.95 [0.77, 1.17] |
| 2.11.2 >24 to 48mo | 3 | 1294 | Risk Ratio (M‐H, Random, 95% CI) | 0.83 [0.64, 1.06] |
| 2.11.3 >48mo | 2 | 49247 | Risk Ratio (M‐H, Random, 95% CI) | 0.81 [0.54, 1.24] |
| 2.11.4 unclear | 2 | 278 | Risk Ratio (M‐H, Random, 95% CI) | 0.41 [0.02, 7.73] |
| 2.12 MI, subgroup by baseline SFA | 11 | 53167 | Risk Ratio (M‐H, Random, 95% CI) | 0.90 [0.80, 1.01] |
| 2.12.1 up to 12%E SFA baseline | 0 | 0 | Risk Ratio (M‐H, Random, 95% CI) | Not estimable |
| 2.12.2 >12 to 15%E SFA baseline | 4 | 51279 | Risk Ratio (M‐H, Random, 95% CI) | 0.96 [0.87, 1.07] |
| 2.12.3 >15 to 18%E SFA baseline | 1 | 55 | Risk Ratio (M‐H, Random, 95% CI) | 0.52 [0.05, 5.39] |
| 2.12.4 >18%E SFA baseline | 1 | 846 | Risk Ratio (M‐H, Random, 95% CI) | 0.76 [0.55, 1.05] |
| 2.12.5 unclear | 5 | 987 | Risk Ratio (M‐H, Random, 95% CI) | 0.84 [0.54, 1.30] |
| 2.13 MI, subgroup by SFA change | 11 | 53167 | Risk Ratio (M‐H, Random, 95% CI) | 0.90 [0.80, 1.01] |
| 2.13.1 up to 4%E difference | 4 | 51279 | Risk Ratio (M‐H, Random, 95% CI) | 0.96 [0.87, 1.07] |
| 2.13.2 >4 to 8%E difference | 1 | 55 | Risk Ratio (M‐H, Random, 95% CI) | 0.52 [0.05, 5.39] |
| 2.13.3 >8%E difference | 1 | 846 | Risk Ratio (M‐H, Random, 95% CI) | 0.76 [0.55, 1.05] |
| 2.13.4 unclear | 5 | 987 | Risk Ratio (M‐H, Random, 95% CI) | 0.84 [0.54, 1.30] |
| 2.14 MI, subgroup by sex | 11 | 53167 | Risk Ratio (M‐H, Random, 95% CI) | 0.90 [0.80, 1.01] |
| 2.14.1 Men | 7 | 3819 | Risk Ratio (M‐H, Random, 95% CI) | 0.85 [0.73, 0.98] |
| 2.14.2 Women | 1 | 48835 | Risk Ratio (M‐H, Random, 95% CI) | 0.97 [0.86, 1.09] |
| 2.14.3 Mixed, men and women | 3 | 513 | Risk Ratio (M‐H, Random, 95% CI) | 0.75 [0.13, 4.47] |
| 2.15 MI, subgroup by CVD risk | 11 | 53167 | Risk Ratio (M‐H, Random, 95% CI) | 0.90 [0.80, 1.01] |
| 2.15.1 Low CVD risk | 2 | 49681 | Risk Ratio (M‐H, Random, 95% CI) | 0.90 [0.72, 1.13] |
| 2.15.2 Moderate CVD risk | 3 | 513 | Risk Ratio (M‐H, Random, 95% CI) | 0.75 [0.13, 4.47] |
| 2.15.3 Existing CVD disease | 6 | 2973 | Risk Ratio (M‐H, Random, 95% CI) | 0.87 [0.74, 1.03] |
| 2.16 MI, subgroup by TC reduction | 11 | Risk Ratio (M‐H, Random, 95% CI) | Subtotals only | |
| 2.16.1 serum chol reduced by at least 0.2mmol/L | 8 | 4117 | Risk Ratio (M‐H, Random, 95% CI) | 0.83 [0.70, 0.98] |
| 2.16.2 serum chol reduced by <0.2mmol/L | 3 | 49050 | Risk Ratio (M‐H, Random, 95% CI) | 0.98 [0.87, 1.10] |
| 2.16.3 serum chol reduction unclear | 0 | 0 | Risk Ratio (M‐H, Random, 95% CI) | Not estimable |
| 2.17 MI, subgroup decade of publication | 11 | 53167 | Risk Ratio (M‐H, Random, 95% CI) | 0.90 [0.80, 1.01] |
| 2.17.1 1960s | 5 | 1731 | Risk Ratio (M‐H, Random, 95% CI) | 0.80 [0.64, 1.00] |
| 2.17.2 1970s | 1 | 102 | Risk Ratio (M‐H, Random, 95% CI) | 0.08 [0.00, 1.33] |
| 2.17.3 1980s | 1 | 2033 | Risk Ratio (M‐H, Random, 95% CI) | 0.91 [0.73, 1.14] |
| 2.17.4 1990s | 1 | 55 | Risk Ratio (M‐H, Random, 95% CI) | 0.52 [0.05, 5.39] |
| 2.17.5 2000s | 3 | 49246 | Risk Ratio (M‐H, Random, 95% CI) | 0.98 [0.87, 1.10] |
| 2.18 NON‐FATAL MYOCARDIAL INFARCTION | 8 | 52834 | Risk Ratio (M‐H, Random, 95% CI) | 0.97 [0.87, 1.07] |
| 2.19 Non‐fatal MI, SA by low summary risk of bias | 2 | 49681 | Risk Ratio (M‐H, Random, 95% CI) | 0.89 [0.58, 1.35] |
| 2.20 Non‐fatal MI, SA aim to reduce SFA | 8 | 52834 | Risk Ratio (M‐H, Random, 95% CI) | 0.97 [0.87, 1.07] |
| 2.21 Non‐fatal MI, SA statistically significant SFA reduction | 4 | 51949 | Risk Ratio (M‐H, Random, 95% CI) | 0.90 [0.72, 1.14] |
| 2.22 Non‐fatal MI, SA by TC reduction | 7 | 52795 | Risk Ratio (M‐H, Random, 95% CI) | 0.97 [0.87, 1.07] |
| 2.23 Non‐fatal MI, SA excluding WHI | 7 | 3999 | Risk Ratio (M‐H, Random, 95% CI) | 0.81 [0.64, 1.04] |
| 2.24 Non‐fatal MI, SA Mantel‐Haenszel fixed‐effect | 8 | 52834 | Risk Ratio (M‐H, Fixed, 95% CI) | 0.97 [0.87, 1.08] |
| 2.25 Non‐fatal MI, SA Peto fixed‐effect | 8 | 52834 | Peto Odds Ratio (Peto, Fixed, 95% CI) | 0.97 [0.87, 1.08] |
| 2.26 Non‐fatal MI, subgroup by any substitution | 8 | Risk Ratio (M‐H, Random, 95% CI) | Subtotals only | |
| 2.26.1 replaced by PUFA | 5 | 3738 | Risk Ratio (M‐H, Random, 95% CI) | 0.80 [0.63, 1.03] |
| 2.26.2 replaced by MUFA | 1 | 52 | Risk Ratio (M‐H, Random, 95% CI) | 1.20 [0.42, 3.45] |
| 2.26.3 replace by CHO | 2 | 50868 | Risk Ratio (M‐H, Random, 95% CI) | 0.93 [0.72, 1.21] |
| 2.26.4 replaced by protein | 2 | 50868 | Risk Ratio (M‐H, Random, 95% CI) | 0.93 [0.72, 1.21] |
| 2.26.5 replacement unclear | 1 | 235 | Risk Ratio (M‐H, Random, 95% CI) | 2.02 [0.19, 21.94] |
| 2.27 Non‐fatal MI, subgroup by main substitution | 8 | Risk Ratio (M‐H, Random, 95% CI) | Subtotals only | |
| 2.27.1 replaced by PUFA | 5 | 3738 | Risk Ratio (M‐H, Random, 95% CI) | 0.80 [0.63, 1.03] |
| 2.27.2 replaced by MUFA | 1 | 52 | Risk Ratio (M‐H, Random, 95% CI) | 1.20 [0.42, 3.45] |
| 2.27.3 replace by CHO | 1 | 48835 | Risk Ratio (M‐H, Random, 95% CI) | 1.01 [0.90, 1.13] |
| 2.27.4 replaced by protein | 0 | 0 | Risk Ratio (M‐H, Random, 95% CI) | Not estimable |
| 2.27.5 replacement unclear | 1 | 235 | Risk Ratio (M‐H, Random, 95% CI) | 2.02 [0.19, 21.94] |
| 2.28 Non‐fatal MI, subgroup by duration | 8 | 52834 | Risk Ratio (M‐H, Random, 95% CI) | 0.97 [0.87, 1.07] |
| 2.28.1 up to 24mo | 4 | 2348 | Risk Ratio (M‐H, Random, 95% CI) | 0.83 [0.57, 1.22] |
| 2.28.2 >24 to 48mo | 2 | 1239 | Risk Ratio (M‐H, Random, 95% CI) | 0.82 [0.53, 1.27] |
| 2.28.3 >48mo | 2 | 49247 | Risk Ratio (M‐H, Random, 95% CI) | 0.99 [0.88, 1.12] |
| 2.28.4 unclear | 0 | 0 | Risk Ratio (M‐H, Random, 95% CI) | Not estimable |
| 2.29 Non‐fatal MI, subgroup by baseline SFA | 8 | 52834 | Risk Ratio (M‐H, Random, 95% CI) | 0.97 [0.87, 1.07] |
| 2.29.1 up to 12%E SFA baseline | 0 | 0 | Risk Ratio (M‐H, Random, 95% CI) | Not estimable |
| 2.29.2 >12 to 15%E SFA baseline | 3 | 51103 | Risk Ratio (M‐H, Random, 95% CI) | 0.97 [0.83, 1.13] |
| 2.29.3 >15 to 18%E SFA baseline | 0 | 0 | Risk Ratio (M‐H, Random, 95% CI) | Not estimable |
| 2.29.4 >18%E SFA baseline | 1 | 846 | Risk Ratio (M‐H, Random, 95% CI) | 0.62 [0.31, 1.21] |
| 2.29.5 unclear | 4 | 885 | Risk Ratio (M‐H, Random, 95% CI) | 0.91 [0.65, 1.27] |
| 2.30 Non‐fatal MI, subgroup by SFA change | 8 | 52834 | Risk Ratio (M‐H, Random, 95% CI) | 0.97 [0.87, 1.07] |
| 2.30.1 up to 4%E difference | 3 | 51103 | Risk Ratio (M‐H, Random, 95% CI) | 0.97 [0.83, 1.13] |
| 2.30.2 >4 to 8%E difference | 0 | 0 | Risk Ratio (M‐H, Random, 95% CI) | Not estimable |
| 2.30.3 >8%E difference | 1 | 846 | Risk Ratio (M‐H, Random, 95% CI) | 0.62 [0.31, 1.21] |
| 2.30.4 unclear | 4 | 885 | Risk Ratio (M‐H, Random, 95% CI) | 0.91 [0.65, 1.27] |
| 2.31 Non‐fatal MI, subgroup by sex | 8 | 52834 | Risk Ratio (M‐H, Random, 95% CI) | 0.97 [0.87, 1.07] |
| 2.31.1 Men | 6 | 3764 | Risk Ratio (M‐H, Random, 95% CI) | 0.81 [0.63, 1.03] |
| 2.31.2 Women | 1 | 48835 | Risk Ratio (M‐H, Random, 95% CI) | 1.01 [0.90, 1.13] |
| 2.31.3 Mixed, men and women | 1 | 235 | Risk Ratio (M‐H, Random, 95% CI) | 2.02 [0.19, 21.94] |
| 2.32 Non‐fatal MI, subgroup by CVD risk | 8 | 52834 | Risk Ratio (M‐H, Random, 95% CI) | 0.95 [0.80, 1.13] |
| 2.32.1 Low CVD risk | 2 | 47404 | Risk Ratio (M‐H, Random, 95% CI) | 0.87 [0.68, 1.12] |
| 2.32.2 Moderate CVD risk | 1 | 235 | Risk Ratio (M‐H, Random, 95% CI) | 2.02 [0.19, 21.94] |
| 2.32.3 Existing CVD disease | 6 | 5195 | Risk Ratio (M‐H, Random, 95% CI) | 1.00 [0.76, 1.31] |
| 2.33 Non‐fatal MI, subgroup by TC reduction | 8 | Risk Ratio (M‐H, Random, 95% CI) | Subtotals only | |
| 2.33.1 serum chol reduced by at least 0.2mmol/L | 6 | 3960 | Risk Ratio (M‐H, Random, 95% CI) | 0.80 [0.62, 1.03] |
| 2.33.2 serum chol reduced by <0.2mmol/L | 2 | 48874 | Risk Ratio (M‐H, Random, 95% CI) | 1.01 [0.90, 1.13] |
| 2.33.3 serum chol reduction unclear | 0 | 0 | Risk Ratio (M‐H, Random, 95% CI) | Not estimable |
| 2.34 Non‐fatal MI, subgroup decade of publication | 8 | 52834 | Risk Ratio (M‐H, Random, 95% CI) | 0.97 [0.87, 1.07] |
| 2.34.1 1960s | 5 | 1731 | Risk Ratio (M‐H, Random, 95% CI) | 0.84 [0.62, 1.13] |
| 2.34.2 1970s | 0 | 0 | Risk Ratio (M‐H, Random, 95% CI) | Not estimable |
| 2.34.3 1980s | 1 | 2033 | Risk Ratio (M‐H, Random, 95% CI) | 0.74 [0.48, 1.14] |
| 2.34.4 1990s | 0 | 0 | Risk Ratio (M‐H, Random, 95% CI) | Not estimable |
| 2.34.5 2000s | 2 | 49070 | Risk Ratio (M‐H, Random, 95% CI) | 1.01 [0.90, 1.13] |
| 2.35 STROKE | 7 | 50952 | Risk Ratio (M‐H, Random, 95% CI) | 0.92 [0.68, 1.25] |
| 2.36 Stroke, SA by low summary risk of bias | 3 | 49857 | Risk Ratio (M‐H, Random, 95% CI) | 0.76 [0.42, 1.38] |
| 2.37 Stroke, SA aim to reduce SFA | 6 | 50776 | Risk Ratio (M‐H, Random, 95% CI) | 1.01 [0.90, 1.14] |
| 2.38 Stroke, SA statistically significant SFA reduction | 5 | 50147 | Risk Ratio (M‐H, Random, 95% CI) | 0.83 [0.55, 1.25] |
| 2.39 Stroke, SA by TC reduction | 6 | 50776 | Risk Ratio (M‐H, Random, 95% CI) | 1.01 [0.90, 1.14] |
| 2.40 Stroke, SA excluding WHI | 6 | 2117 | Risk Ratio (M‐H, Random, 95% CI) | 0.63 [0.35, 1.14] |
| 2.41 Stroke, SA Mantel‐Haenszel fixed‐effect | 7 | 50952 | Risk Ratio (M‐H, Fixed, 95% CI) | 1.01 [0.89, 1.13] |
| 2.42 Stroke, SA Peto fixed‐effect | 7 | 50952 | Peto Odds Ratio (Peto, Fixed, 95% CI) | 1.01 [0.89, 1.14] |
| 2.43 Stroke, subgroup by any substitution | 7 | Risk Ratio (M‐H, Random, 95% CI) | Subtotals only | |
| 2.43.1 replaced by PUFA | 4 | 1706 | Risk Ratio (M‐H, Random, 95% CI) | 0.68 [0.37, 1.27] |
| 2.43.2 replaced by MUFA | 0 | 0 | Risk Ratio (M‐H, Random, 95% CI) | Not estimable |
| 2.43.3 replace by CHO | 3 | 49066 | Risk Ratio (M‐H, Random, 95% CI) | 0.73 [0.29, 1.87] |
| 2.43.4 replaced by protein | 2 | 49011 | Risk Ratio (M‐H, Random, 95% CI) | 0.65 [0.15, 2.75] |
| 2.43.5 replacement unclear | 1 | 235 | Risk Ratio (M‐H, Random, 95% CI) | 1.01 [0.06, 15.93] |
| 2.44 Stroke, subgroup by main substitution | 7 | Risk Ratio (M‐H, Random, 95% CI) | Subtotals only | |
| 2.44.1 replaced by PUFA | 3 | 1651 | Risk Ratio (M‐H, Random, 95% CI) | 0.92 [0.31, 2.69] |
| 2.44.2 replaced by MUFA | 0 | 0 | Risk Ratio (M‐H, Random, 95% CI) | Not estimable |
| 2.44.3 replace by CHO | 3 | 49066 | Risk Ratio (M‐H, Random, 95% CI) | 0.73 [0.29, 1.87] |
| 2.44.4 replaced by protein | 0 | 0 | Risk Ratio (M‐H, Random, 95% CI) | Not estimable |
| 2.44.5 replacement unclear | 1 | 235 | Risk Ratio (M‐H, Random, 95% CI) | 1.01 [0.06, 15.93] |
| 2.45 Stroke, subgroup by duration | 6 | 50559 | Risk Ratio (M‐H, Random, 95% CI) | 0.91 [0.67, 1.23] |
| 2.45.1 up to 24mo | 1 | 235 | Risk Ratio (M‐H, Random, 95% CI) | 1.01 [0.06, 15.93] |
| 2.45.2 >24 to 48mo | 2 | 901 | Risk Ratio (M‐H, Random, 95% CI) | 0.57 [0.30, 1.11] |
| 2.45.3 >48mo | 2 | 49247 | Risk Ratio (M‐H, Random, 95% CI) | 1.03 [0.91, 1.16] |
| 2.45.4 unclear duration | 1 | 176 | Risk Ratio (M‐H, Random, 95% CI) | 0.20 [0.02, 1.68] |
| 2.46 Stroke, subgroup by baseline SFA | 6 | 50559 | Risk Ratio (M‐H, Random, 95% CI) | 0.91 [0.67, 1.23] |
| 2.46.1 up to 12%E SFA baseline | 0 | 0 | Risk Ratio (M‐H, Random, 95% CI) | Not estimable |
| 2.46.2 >12 to 15%E SFA baseline | 3 | 49246 | Risk Ratio (M‐H, Random, 95% CI) | 0.91 [0.50, 1.66] |
| 2.46.3 >15 to 18%E SFA baseline | 1 | 55 | Risk Ratio (M‐H, Random, 95% CI) | 0.35 [0.01, 8.12] |
| 2.46.4 >18%E SFA baseline | 1 | 846 | Risk Ratio (M‐H, Random, 95% CI) | 0.59 [0.30, 1.15] |
| 2.46.5 unclear | 1 | 412 | Risk Ratio (M‐H, Random, 95% CI) | 2.00 [0.18, 21.89] |
| 2.47 Stroke, subgroup by SFA change | 6 | 50559 | Risk Ratio (M‐H, Random, 95% CI) | 0.91 [0.67, 1.23] |
| 2.47.1 up to 4%E difference | 3 | 49246 | Risk Ratio (M‐H, Random, 95% CI) | 0.91 [0.50, 1.66] |
| 2.47.2 >4 to 8%E difference | 1 | 55 | Risk Ratio (M‐H, Random, 95% CI) | 0.35 [0.01, 8.12] |
| 2.47.3 >8%E difference | 1 | 846 | Risk Ratio (M‐H, Random, 95% CI) | 0.59 [0.30, 1.15] |
| 2.47.4 unclear | 1 | 412 | Risk Ratio (M‐H, Random, 95% CI) | 2.00 [0.18, 21.89] |
| 2.48 Stroke, subgroup by sex | 6 | 50559 | Risk Ratio (M‐H, Random, 95% CI) | 0.91 [0.67, 1.23] |
| 2.48.1 Men | 3 | 1313 | Risk Ratio (M‐H, Random, 95% CI) | 0.63 [0.33, 1.18] |
| 2.48.2 Women | 1 | 48835 | Risk Ratio (M‐H, Random, 95% CI) | 1.03 [0.91, 1.16] |
| 2.48.3 Mixed, men and women | 2 | 411 | Risk Ratio (M‐H, Random, 95% CI) | 0.37 [0.07, 1.97] |
| 2.49 Stroke, subgroup by CVD risk | 6 | 50559 | Risk Ratio (M‐H, Random, 95% CI) | 1.00 [0.89, 1.11] |
| 2.49.1 Low CVD risk | 2 | 47404 | Risk Ratio (M‐H, Random, 95% CI) | 0.86 [0.52, 1.42] |
| 2.49.2 Moderate CVD risk | 2 | 411 | Risk Ratio (M‐H, Random, 95% CI) | 0.37 [0.07, 1.97] |
| 2.49.3 Existing CVD disease | 3 | 2744 | Risk Ratio (M‐H, Random, 95% CI) | 1.01 [0.86, 1.18] |
| 2.50 Stroke, subgroup by TC reduction | 7 | Risk Ratio (M‐H, Random, 95% CI) | Subtotals only | |
| 2.50.1 serum chol reduced by at least 0.2mmol/L | 5 | 1941 | Risk Ratio (M‐H, Random, 95% CI) | 0.70 [0.38, 1.28] |
| 2.50.2 serum chol reduced by <0.2mmol/L | 2 | 49011 | Risk Ratio (M‐H, Random, 95% CI) | 0.65 [0.15, 2.75] |
| 2.50.3 serum chol reduction unclear | 0 | 0 | Risk Ratio (M‐H, Random, 95% CI) | Not estimable |
| 2.51 Stroke, subgroup decade of publication | 7 | 50952 | Risk Ratio (M‐H, Random, 95% CI) | 0.92 [0.68, 1.25] |
| 2.51.1 1960s | 3 | 1651 | Risk Ratio (M‐H, Random, 95% CI) | 0.92 [0.31, 2.69] |
| 2.51.2 1970s | 0 | 0 | Risk Ratio (M‐H, Random, 95% CI) | Not estimable |
| 2.51.3 1980s | 0 | 0 | Risk Ratio (M‐H, Random, 95% CI) | Not estimable |
| 2.51.4 1990s | 1 | 55 | Risk Ratio (M‐H, Random, 95% CI) | 0.35 [0.01, 8.12] |
| 2.51.5 2000s | 3 | 49246 | Risk Ratio (M‐H, Random, 95% CI) | 0.91 [0.50, 1.66] |
| 2.52 CORONARY HEART DISEASE MORTALITY | 9 | 53159 | Risk Ratio (M‐H, Random, 95% CI) | 0.97 [0.82, 1.16] |
| 2.53 CHD mortality, SA by low summary risk of bias | 3 | 50139 | Risk Ratio (M‐H, Random, 95% CI) | 1.05 [0.77, 1.43] |
| 2.54 CHD mortality, SA aim to reduce SFA | 9 | 53159 | Risk Ratio (M‐H, Random, 95% CI) | 0.97 [0.82, 1.16] |
| 2.55 CHD mortality, SA statistically significant SFA reduction | 4 | 52172 | Risk Ratio (M‐H, Random, 95% CI) | 1.02 [0.84, 1.24] |
| 2.56 CHD mortality, SA by TC reduction | 8 | 53120 | Risk Ratio (M‐H, Random, 95% CI) | 0.97 [0.81, 1.16] |
| 2.57 CHD mortality, SA excluding WHI | 8 | 4324 | Risk Ratio (M‐H, Random, 95% CI) | 0.97 [0.76, 1.24] |
| 2.58 CHD mortality, SA Mantel‐Haenszel fixed‐effect | 9 | 53159 | Risk Ratio (M‐H, Fixed, 95% CI) | 0.97 [0.86, 1.10] |
| 2.59 CHD mortality, SA Peto fixed‐effect | 9 | 53159 | Peto Odds Ratio (Peto, Fixed, 95% CI) | 0.97 [0.85, 1.11] |
| 2.60 CHD mortality, subgroup by any substitution | 9 | Risk Ratio (M‐H, Random, 95% CI) | Subtotals only | |
| 2.60.1 replaced by PUFA | 7 | 4298 | Risk Ratio (M‐H, Random, 95% CI) | 0.98 [0.74, 1.28] |
| 2.60.2 replaced by MUFA | 1 | 52 | Risk Ratio (M‐H, Random, 95% CI) | 3.00 [0.33, 26.99] |
| 2.60.3 replaced by CHO | 2 | 50868 | Risk Ratio (M‐H, Random, 95% CI) | 0.99 [0.85, 1.16] |
| 2.60.4 replaced by protein | 2 | 50868 | Risk Ratio (M‐H, Random, 95% CI) | 0.99 [0.85, 1.16] |
| 2.60.5 replacement unclear | 0 | 0 | Risk Ratio (M‐H, Random, 95% CI) | Not estimable |
| 2.61 CHD mortality, subgroup by main substitution | 9 | Risk Ratio (M‐H, Random, 95% CI) | Subtotals only | |
| 2.61.1 replaced by PUFA | 7 | 4298 | Risk Ratio (M‐H, Random, 95% CI) | 0.98 [0.74, 1.28] |
| 2.61.2 replaced by MUFA | 1 | 52 | Risk Ratio (M‐H, Random, 95% CI) | 3.00 [0.33, 26.99] |
| 2.61.3 replaced by CHO | 1 | 48835 | Risk Ratio (M‐H, Random, 95% CI) | 0.99 [0.82, 1.20] |
| 2.61.4 replaced by protein | 0 | 0 | Risk Ratio (M‐H, Random, 95% CI) | Not estimable |
| 2.61.5 replacement unclear | 0 | 0 | Risk Ratio (M‐H, Random, 95% CI) | Not estimable |
| 2.62 CHD mortality, subgroup by duration | 9 | Risk Ratio (M‐H, Random, 95% CI) | Subtotals only | |
| 2.62.1 up to 24mo | 3 | 2113 | Risk Ratio (M‐H, Random, 95% CI) | 1.02 [0.78, 1.33] |
| 2.62.2 >24 to 48months | 2 | 1239 | Risk Ratio (M‐H, Random, 95% CI) | 0.87 [0.64, 1.19] |
| 2.62.3 >48 months | 3 | 49705 | Risk Ratio (M‐H, Random, 95% CI) | 1.02 [0.72, 1.45] |
| 2.62.4 unclear duration | 1 | 102 | Risk Ratio (M‐H, Random, 95% CI) | 0.09 [0.01, 1.60] |
| 2.63 CHD mortality, subgroup by baseline SFA | 9 | Risk Ratio (M‐H, Random, 95% CI) | Subtotals only | |
| 2.63.1 up to 12%E SFA baseline | 0 | 0 | Risk Ratio (M‐H, Random, 95% CI) | Not estimable |
| 2.63.2 >12% to 15%E SFA baseline | 3 | 51326 | Risk Ratio (M‐H, Random, 95% CI) | 1.07 [0.86, 1.34] |
| 2.63.3 >15 to 18%E SFA baseline | 0 | 0 | Risk Ratio (M‐H, Random, 95% CI) | Not estimable |
| 2.63.4 >18%E SFA baseline | 1 | 846 | Risk Ratio (M‐H, Random, 95% CI) | 0.82 [0.55, 1.21] |
| 2.63.5 unclear | 5 | 987 | Risk Ratio (M‐H, Random, 95% CI) | 0.85 [0.56, 1.29] |
| 2.64 CHD mortality, subgroup by SFA change | 9 | Risk Ratio (M‐H, Random, 95% CI) | Subtotals only | |
| 2.64.1 up to 4%E difference | 3 | 51326 | Risk Ratio (M‐H, Random, 95% CI) | 1.07 [0.86, 1.34] |
| 2.64.2 >4 to 8%E difference | 0 | 0 | Risk Ratio (M‐H, Random, 95% CI) | Not estimable |
| 2.64.3 >8%E difference | 1 | 846 | Risk Ratio (M‐H, Random, 95% CI) | 0.82 [0.55, 1.21] |
| 2.64.4 unclear | 5 | 987 | Risk Ratio (M‐H, Random, 95% CI) | 0.85 [0.56, 1.29] |
| 2.65 CHD mortality, subgroup by sex | 9 | Risk Ratio (M‐H, Random, 95% CI) | Subtotals only | |
| 2.65.1 Men | 7 | 4222 | Risk Ratio (M‐H, Random, 95% CI) | 0.98 [0.79, 1.23] |
| 2.65.2 Women | 1 | 48835 | Risk Ratio (M‐H, Random, 95% CI) | 0.99 [0.82, 1.20] |
| 2.65.3 Mixed, men and women | 1 | 102 | Risk Ratio (M‐H, Random, 95% CI) | 0.09 [0.01, 1.60] |
| 2.66 CHD mortality, subgroup by CVD risk | 9 | Risk Ratio (M‐H, Random, 95% CI) | Subtotals only | |
| 2.66.1 Low CVD risk | 2 | 47404 | Risk Ratio (M‐H, Random, 95% CI) | 0.95 [0.78, 1.16] |
| 2.66.2 Moderate CVD risk | 1 | 102 | Risk Ratio (M‐H, Random, 95% CI) | 0.09 [0.01, 1.60] |
| 2.66.3 Existing CVD disease | 7 | 5653 | Risk Ratio (M‐H, Random, 95% CI) | 1.03 [0.83, 1.27] |
| 2.67 CHD mortality, subgroup by TC reduction | 9 | Risk Ratio (M‐H, Random, 95% CI) | Subtotals only | |
| 2.67.1 serum chol reduced by at least 0.2mmol/L | 7 | 4285 | Risk Ratio (M‐H, Random, 95% CI) | 0.96 [0.75, 1.24] |
| 2.67.2 serum chol reduced by <0.2mmol/L | 2 | 48874 | Risk Ratio (M‐H, Random, 95% CI) | 0.99 [0.82, 1.20] |
| 2.67.3 serum chol reduction unclear | 0 | 0 | Risk Ratio (M‐H, Random, 95% CI) | Not estimable |
| 2.68 CHD mortality, subgroup decade of publication | 9 | 53159 | Risk Ratio (M‐H, Random, 95% CI) | 0.97 [0.82, 1.16] |
| 2.68.1 1960s | 5 | 1731 | Risk Ratio (M‐H, Random, 95% CI) | 0.84 [0.66, 1.06] |
| 2.68.2 1970s | 2 | 560 | Risk Ratio (M‐H, Random, 95% CI) | 0.54 [0.03, 9.26] |
| 2.68.3 1980s | 1 | 2033 | Risk Ratio (M‐H, Random, 95% CI) | 1.00 [0.76, 1.30] |
| 2.68.4 1990s | 0 | 0 | Risk Ratio (M‐H, Random, 95% CI) | Not estimable |
| 2.68.5 2000s | 1 | 48835 | Risk Ratio (M‐H, Random, 95% CI) | 0.99 [0.82, 1.20] |
| 2.69 CORONARY HEART DISEASE EVENTS | 11 | 53199 | Risk Ratio (M‐H, Random, 95% CI) | 0.83 [0.68, 1.01] |
| 2.70 CHD events, SA by low summary risk of bias | 3 | 49857 | Risk Ratio (M‐H, Random, 95% CI) | 0.92 [0.77, 1.10] |
| 2.71 CHD events, SA excluding WHI | 10 | 4364 | Risk Ratio (M‐H, Random, 95% CI) | 0.80 [0.62, 1.03] |
| 2.72 CHD events, SA statistically significant SFA reduction | 6 | 52212 | Risk Ratio (M‐H, Random, 95% CI) | 0.91 [0.77, 1.06] |
| 2.73 CHD events, SA by TC reduction | 9 | 52984 | Risk Ratio (M‐H, Random, 95% CI) | 0.80 [0.65, 0.99] |
| 2.74 CHD events, SA aim to reduce SFA | 10 | 53023 | Risk Ratio (M‐H, Random, 95% CI) | 0.82 [0.67, 1.00] |
| 2.75 CHD events, SA Mantel‐Haenszel fixed‐effect | 11 | 53199 | Risk Ratio (M‐H, Fixed, 95% CI) | 0.91 [0.84, 0.99] |
| 2.76 CHD events, SA Peto fixed‐effect | 11 | 53199 | Peto Odds Ratio (Peto, Fixed, 95% CI) | 0.90 [0.83, 0.99] |
| 2.77 CHD events, subgroup by any substitution | 11 | Risk Ratio (M‐H, Random, 95% CI) | Subtotals only | |
| 2.77.1 replaced by PUFA | 7 | 3895 | Risk Ratio (M‐H, Random, 95% CI) | 0.76 [0.57, 1.00] |
| 2.77.2 replaced by MUFA | 1 | 52 | Risk Ratio (M‐H, Random, 95% CI) | 1.50 [0.62, 3.61] |
| 2.77.3 replaced by CHO | 4 | 51104 | Risk Ratio (M‐H, Random, 95% CI) | 0.93 [0.78, 1.11] |
| 2.77.4 replaced by protein | 3 | 51044 | Risk Ratio (M‐H, Random, 95% CI) | 0.96 [0.88, 1.05] |
| 2.77.5 replacement unclear | 1 | 267 | Risk Ratio (M‐H, Random, 95% CI) | 2.93 [0.31, 27.84] |
| 2.78 CHD events, subgroup by main substitution | 11 | Risk Ratio (M‐H, Random, 95% CI) | Subtotals only | |
| 2.78.1 replaced by PUFA | 6 | 3840 | Risk Ratio (M‐H, Random, 95% CI) | 0.79 [0.60, 1.04] |
| 2.78.2 replaced by MUFA | 1 | 52 | Risk Ratio (M‐H, Random, 95% CI) | 1.50 [0.62, 3.61] |
| 2.78.3 replaced by CHO | 3 | 49071 | Risk Ratio (M‐H, Random, 95% CI) | 0.82 [0.39, 1.72] |
| 2.78.4 replaced by protein | 0 | 0 | Risk Ratio (M‐H, Random, 95% CI) | Not estimable |
| 2.78.5 replacement unclear | 1 | 267 | Risk Ratio (M‐H, Random, 95% CI) | 2.93 [0.31, 27.84] |
| 2.79 CHD events, subgroup by duration | 11 | Risk Ratio (M‐H, Random, 95% CI) | Subtotals only | |
| 2.79.1 up to 24 months | 4 | 2380 | Risk Ratio (M‐H, Random, 95% CI) | 1.01 [0.76, 1.35] |
| 2.79.2 >24 to 48 months | 3 | 1294 | Risk Ratio (M‐H, Random, 95% CI) | 0.79 [0.55, 1.13] |
| 2.79.3 >48 months | 2 | 49247 | Risk Ratio (M‐H, Random, 95% CI) | 0.85 [0.63, 1.15] |
| 2.79.4 unclear duration | 2 | 278 | Risk Ratio (M‐H, Random, 95% CI) | 0.60 [0.10, 3.58] |
| 2.80 CHD events, subgroup by baseline SFA | 11 | Risk Ratio (M‐H, Random, 95% CI) | Subtotals only | |
| 2.80.1 up to 12%E SFA baseline | 0 | 0 | Risk Ratio (M‐H, Random, 95% CI) | Not estimable |
| 2.80.2 >12 to 15%E SFA baseline | 4 | 51311 | Risk Ratio (M‐H, Random, 95% CI) | 0.96 [0.88, 1.06] |
| 2.80.3 >15 to 18%E SFA baseline | 1 | 55 | Risk Ratio (M‐H, Random, 95% CI) | 0.31 [0.10, 1.01] |
| 2.80.4 >18%E SFA baseline | 1 | 846 | Risk Ratio (M‐H, Random, 95% CI) | 0.77 [0.56, 1.04] |
| 2.80.5 unclear | 5 | 987 | Risk Ratio (M‐H, Random, 95% CI) | 0.78 [0.49, 1.26] |
| 2.81 CHD events, subgroup by SFA change | 11 | Risk Ratio (M‐H, Random, 95% CI) | Subtotals only | |
| 2.81.1 up to 4%E difference | 4 | 51311 | Risk Ratio (M‐H, Random, 95% CI) | 0.96 [0.88, 1.06] |
| 2.81.2 >4 to 8%E difference | 1 | 55 | Risk Ratio (M‐H, Random, 95% CI) | 0.31 [0.10, 1.01] |
| 2.81.3 >8%E difference | 1 | 846 | Risk Ratio (M‐H, Random, 95% CI) | 0.77 [0.56, 1.04] |
| 2.81.4 unclear | 5 | 987 | Risk Ratio (M‐H, Random, 95% CI) | 0.78 [0.49, 1.26] |
| 2.82 CHD events, subgroup by sex | 11 | Risk Ratio (M‐H, Random, 95% CI) | Subtotals only | |
| 2.82.1 Men | 7 | 3819 | Risk Ratio (M‐H, Random, 95% CI) | 0.84 [0.70, 1.02] |
| 2.82.2 Women | 1 | 48835 | Risk Ratio (M‐H, Random, 95% CI) | 0.97 [0.87, 1.07] |
| 2.82.3 Mixed, men and women | 3 | 545 | Risk Ratio (M‐H, Random, 95% CI) | 0.88 [0.18, 4.36] |
| 2.83 CHD events, subgroup by CVD risk | 11 | Risk Ratio (M‐H, Random, 95% CI) | Subtotals only | |
| 2.83.1 Low CVD risk | 2 | 47404 | Risk Ratio (M‐H, Random, 95% CI) | 0.90 [0.76, 1.05] |
| 2.83.2 Moderate CVD risk | 3 | 545 | Risk Ratio (M‐H, Random, 95% CI) | 0.88 [0.18, 4.36] |
| 2.83.3 Existing CVD disease | 7 | 5250 | Risk Ratio (M‐H, Random, 95% CI) | 0.94 [0.75, 1.16] |
| 2.84 CHD events, subgroup by TC reduction | 11 | Risk Ratio (M‐H, Random, 95% CI) | Subtotals only | |
| 2.84.1 serum chol reduced by at least 0.2mmol/L | 8 | 4149 | Risk Ratio (M‐H, Random, 95% CI) | 0.76 [0.58, 0.99] |
| 2.84.2 serum chol reduced by <0.2mmol/L | 3 | 49050 | Risk Ratio (M‐H, Random, 95% CI) | 0.97 [0.88, 1.08] |
| 2.84.3 serum chol reduction unclear | 0 | 0 | Risk Ratio (M‐H, Random, 95% CI) | Not estimable |
| 2.85 CHD events, subgroup decade of publication | 11 | 53201 | Risk Ratio (M‐H, Random, 95% CI) | 0.83 [0.68, 1.01] |
| 2.85.1 1960s | 5 | 1731 | Risk Ratio (M‐H, Random, 95% CI) | 0.84 [0.68, 1.05] |
| 2.85.2 1970s | 1 | 102 | Risk Ratio (M‐H, Random, 95% CI) | 0.27 [0.14, 0.52] |
| 2.85.3 1980s | 1 | 2033 | Risk Ratio (M‐H, Random, 95% CI) | 0.91 [0.73, 1.14] |
| 2.85.4 1990s | 1 | 57 | Risk Ratio (M‐H, Random, 95% CI) | 0.33 [0.10, 1.09] |
| 2.85.5 2000s | 3 | 49278 | Risk Ratio (M‐H, Random, 95% CI) | 0.97 [0.88, 1.08] |
| 2.86 DIABETES DIAGNOSES | 1 | Risk Ratio (M‐H, Random, 95% CI) | Subtotals only |
2.45. Analysis.
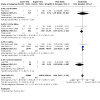
Comparison 2: SFA reduction vs usual diet ‐ secondary health events, Outcome 45: Stroke, subgroup by duration
Comparison 3. SFA reduction vs usual diet ‐ secondary blood outcomes.
| Outcome or subgroup title | No. of studies | No. of participants | Statistical method | Effect size |
|---|---|---|---|---|
| 3.1 Total cholesterol, mmol/L | 14 | 7115 | Mean Difference (IV, Random, 95% CI) | ‐0.24 [‐0.36, ‐0.13] |
| 3.2 TC, mmol/L, subgroup by any replacement | 14 | Mean Difference (IV, Random, 95% CI) | Subtotals only | |
| 3.2.1 replaced by PUFA | 9 | 3888 | Mean Difference (IV, Random, 95% CI) | ‐0.33 [‐0.47, ‐0.19] |
| 3.2.2 replace by MUFA | 1 | 24 | Mean Difference (IV, Random, 95% CI) | 0.30 [‐0.93, 1.53] |
| 3.2.3 replace by CHO | 6 | 5094 | Mean Difference (IV, Random, 95% CI) | ‐0.18 [‐0.32, ‐0.04] |
| 3.2.4 replace by protein | 4 | 4986 | Mean Difference (IV, Random, 95% CI) | ‐0.15 [‐0.27, ‐0.04] |
| 3.2.5 replacement unclear | 1 | 72 | Mean Difference (IV, Random, 95% CI) | ‐0.34 [‐0.64, ‐0.04] |
| 3.3 TC, mmol/L, subgroup by main replacement | 14 | Mean Difference (IV, Random, 95% CI) | Subtotals only | |
| 3.3.1 replaced by PUFA | 8 | 3838 | Mean Difference (IV, Random, 95% CI) | ‐0.28 [‐0.37, ‐0.19] |
| 3.3.2 replace by MUFA | 1 | 24 | Mean Difference (IV, Random, 95% CI) | 0.30 [‐0.93, 1.53] |
| 3.3.3 replace by CHO | 4 | 3181 | Mean Difference (IV, Random, 95% CI) | ‐0.19 [‐0.40, 0.01] |
| 3.3.4 replace by protein | 0 | 0 | Mean Difference (IV, Random, 95% CI) | Not estimable |
| 3.3.5 replacement unclear | 1 | 72 | Mean Difference (IV, Random, 95% CI) | ‐0.34 [‐0.64, ‐0.04] |
| 3.4 LDL cholesterol, mmol/L | 5 | 3291 | Mean Difference (IV, Random, 95% CI) | ‐0.19 [‐0.33, ‐0.05] |
| 3.5 LDL, mmol/L, subgroup by any replacement | 5 | Mean Difference (IV, Random, 95% CI) | Subtotals only | |
| 3.5.1 replaced by PUFA | 1 | 50 | Mean Difference (IV, Random, 95% CI) | ‐0.48 [‐0.90, ‐0.06] |
| 3.5.2 replace by MUFA | 0 | 0 | Mean Difference (IV, Random, 95% CI) | Not estimable |
| 3.5.3 replace by CHO | 3 | 2985 | Mean Difference (IV, Random, 95% CI) | ‐0.16 [‐0.35, 0.02] |
| 3.5.4 replace by protein | 2 | 2935 | Mean Difference (IV, Random, 95% CI) | ‐0.09 [‐0.15, ‐0.04] |
| 3.5.5 replacement unclear | 2 | 306 | Mean Difference (IV, Random, 95% CI) | ‐0.29 [‐0.51, ‐0.08] |
| 3.6 LDL, mmol/L, subgroup by main replacement | 5 | Mean Difference (IV, Random, 95% CI) | Subtotals only | |
| 3.6.1 replaced by PUFA | 0 | 0 | Mean Difference (IV, Random, 95% CI) | Not estimable |
| 3.6.2 replace by MUFA | 0 | 0 | Mean Difference (IV, Random, 95% CI) | Not estimable |
| 3.6.3 replace by CHO | 3 | 2985 | Mean Difference (IV, Random, 95% CI) | ‐0.16 [‐0.35, 0.02] |
| 3.6.4 replace by protein | 0 | 0 | Mean Difference (IV, Random, 95% CI) | Not estimable |
| 3.6.5 replacement unclear | 2 | 306 | Mean Difference (IV, Random, 95% CI) | ‐0.29 [‐0.51, ‐0.08] |
| 3.7 HDL cholesterol, mmol/L | 6 | 5147 | Mean Difference (IV, Random, 95% CI) | ‐0.01 [‐0.02, 0.01] |
| 3.8 HDL, mmol/L, subgroup by any replacement | 6 | Mean Difference (IV, Random, 95% CI) | Subtotals only | |
| 3.8.1 replaced by PUFA | 2 | 1905 | Mean Difference (IV, Random, 95% CI) | ‐0.01 [‐0.04, 0.01] |
| 3.8.2 replace by MUFA | 0 | 0 | Mean Difference (IV, Random, 95% CI) | Not estimable |
| 3.8.3 replace by CHO | 4 | 4840 | Mean Difference (IV, Random, 95% CI) | ‐0.01 [‐0.03, 0.00] |
| 3.8.4 replace by protein | 3 | 4790 | Mean Difference (IV, Random, 95% CI) | ‐0.01 [‐0.03, 0.00] |
| 3.8.5 replacement unclear | 2 | 307 | Mean Difference (IV, Random, 95% CI) | 0.01 [‐0.10, 0.12] |
| 3.9 HDL, mmol/L, subgroup by main replacement | 6 | Mean Difference (IV, Random, 95% CI) | Subtotals only | |
| 3.9.1 replaced by PUFA | 1 | 1855 | Mean Difference (IV, Random, 95% CI) | ‐0.01 [‐0.04, 0.02] |
| 3.9.2 replace by MUFA | 0 | 0 | Mean Difference (IV, Random, 95% CI) | Not estimable |
| 3.9.3 replace by CHO | 3 | 2985 | Mean Difference (IV, Random, 95% CI) | ‐0.01 [‐0.03, 0.01] |
| 3.9.4 replace by protein | 0 | 0 | Mean Difference (IV, Random, 95% CI) | Not estimable |
| 3.9.5 replacement unclear | 2 | 307 | Mean Difference (IV, Random, 95% CI) | 0.01 [‐0.10, 0.12] |
| 3.10 Triglycerides, mmol/L | 7 | 3845 | Mean Difference (IV, Random, 95% CI) | ‐0.08 [‐0.21, 0.04] |
| 3.11 TG, mmol/L, subgroup by any replacement | 7 | Mean Difference (IV, Random, 95% CI) | Subtotals only | |
| 3.11.1 replaced by PUFA | 3 | 604 | Mean Difference (IV, Random, 95% CI) | ‐0.19 [‐0.35, ‐0.02] |
| 3.11.2 replace by MUFA | 0 | 0 | Mean Difference (IV, Random, 95% CI) | Not estimable |
| 3.11.3 replace by CHO | 3 | 2985 | Mean Difference (IV, Random, 95% CI) | ‐0.04 [‐0.32, 0.25] |
| 3.11.4 replace by protein | 2 | 2935 | Mean Difference (IV, Random, 95% CI) | 0.01 [‐0.08, 0.09] |
| 3.11.5 replacement unclear | 2 | 306 | Mean Difference (IV, Random, 95% CI) | ‐0.09 [‐0.52, 0.33] |
| 3.12 TG, mmol/L, subgroup by main replacement | 7 | Mean Difference (IV, Random, 95% CI) | Subtotals only | |
| 3.12.1 replaced by PUFA | 2 | 554 | Mean Difference (IV, Random, 95% CI) | ‐0.16 [‐0.30, ‐0.01] |
| 3.12.2 replace by MUFA | 0 | 0 | Mean Difference (IV, Random, 95% CI) | Not estimable |
| 3.12.3 replace by CHO | 3 | 2985 | Mean Difference (IV, Random, 95% CI) | ‐0.04 [‐0.32, 0.25] |
| 3.12.4 replace by protein | 0 | 0 | Mean Difference (IV, Random, 95% CI) | Not estimable |
| 3.12.5 replacement unclear | 2 | 306 | Mean Difference (IV, Random, 95% CI) | ‐0.09 [‐0.52, 0.33] |
| 3.13 total cholesterol /HDL ratio | 3 | 2985 | Mean Difference (IV, Random, 95% CI) | ‐0.10 [‐0.33, 0.13] |
| 3.14 TC /HDL ratio, subgroup by any replacement | 3 | Mean Difference (IV, Random, 95% CI) | Subtotals only | |
| 3.14.1 replaced by PUFA | 1 | 50 | Mean Difference (IV, Random, 95% CI) | ‐0.58 [‐1.33, 0.17] |
| 3.14.2 replace by MUFA | 0 | 0 | Mean Difference (IV, Random, 95% CI) | Not estimable |
| 3.14.3 replace by CHO | 3 | 2985 | Mean Difference (IV, Random, 95% CI) | ‐0.10 [‐0.33, 0.13] |
| 3.14.4 replace by protein | 2 | 2935 | Mean Difference (IV, Random, 95% CI) | ‐0.09 [‐0.21, 0.04] |
| 3.14.5 replacement unclear | 0 | 0 | Mean Difference (IV, Random, 95% CI) | Not estimable |
| 3.15 TC /HDL ratio, subgroup by main replacement | 3 | Mean Difference (IV, Random, 95% CI) | Subtotals only | |
| 3.15.1 replaced by PUFA | 0 | 0 | Mean Difference (IV, Random, 95% CI) | Not estimable |
| 3.15.2 replace by MUFA | 0 | 0 | Mean Difference (IV, Random, 95% CI) | Not estimable |
| 3.15.3 replace by CHO | 3 | 2985 | Mean Difference (IV, Random, 95% CI) | ‐0.10 [‐0.33, 0.13] |
| 3.15.4 replace by protein | 0 | 0 | Mean Difference (IV, Random, 95% CI) | Not estimable |
| 3.15.5 replacement unclear | 0 | 0 | Mean Difference (IV, Random, 95% CI) | Not estimable |
| 3.16 LDL /HDL ratio | 1 | Mean Difference (IV, Random, 95% CI) | Subtotals only | |
| 3.17 Lp(a), mmol/L | 2 | 2882 | Mean Difference (IV, Random, 95% CI) | 0.00 [‐0.00, 0.00] |
| 3.18 Lp(a), mmol/L, subgroup by any replacement | 2 | Mean Difference (IV, Random, 95% CI) | Subtotals only | |
| 3.18.1 replaced by PUFA | 1 | 50 | Mean Difference (IV, Random, 95% CI) | 0.00 [‐1.37, 1.37] |
| 3.18.2 replace by MUFA | 0 | 0 | Mean Difference (IV, Random, 95% CI) | Not estimable |
| 3.18.3 replace by CHO | 2 | 2882 | Mean Difference (IV, Random, 95% CI) | 0.00 [‐0.00, 0.00] |
| 3.18.4 replace by protein | 1 | 2832 | Mean Difference (IV, Random, 95% CI) | 0.00 [‐0.00, 0.00] |
| 3.18.5 replacement unclear | 0 | 0 | Mean Difference (IV, Random, 95% CI) | Not estimable |
| 3.19 Lp(a), mmol/L, subgroup by main replacement | 2 | Mean Difference (IV, Random, 95% CI) | Subtotals only | |
| 3.19.1 replaced by PUFA | 0 | 0 | Mean Difference (IV, Random, 95% CI) | Not estimable |
| 3.19.2 replace by MUFA | 0 | 0 | Mean Difference (IV, Random, 95% CI) | Not estimable |
| 3.19.3 replace by CHO | 2 | 2882 | Mean Difference (IV, Random, 95% CI) | 0.00 [‐0.00, 0.00] |
| 3.19.4 replace by protein | 0 | 0 | Mean Difference (IV, Random, 95% CI) | Not estimable |
| 3.19.5 replacement unclear | 0 | 0 | Mean Difference (IV, Random, 95% CI) | Not estimable |
| 3.20 Insulin sensitivity | 4 | Mean Difference (IV, Random, 95% CI) | Subtotals only | |
| 3.20.1 HbA1c (glycosylated haemoglobin), % | 0 | 0 | Mean Difference (IV, Random, 95% CI) | Not estimable |
| 3.20.2 GTT (glucose tolerance test), glucose at 2 hours, mmol/L | 3 | 249 | Mean Difference (IV, Random, 95% CI) | ‐1.69 [‐2.55, ‐0.82] |
| 3.20.3 HOMA | 1 | 2832 | Mean Difference (IV, Random, 95% CI) | 0.00 [‐0.04, 0.04] |
Comparison 4. SFA reduction vs usual diet ‐ secondary outcomes including potential adverse effects.
| Outcome or subgroup title | No. of studies | No. of participants | Statistical method | Effect size |
|---|---|---|---|---|
| 4.1 Cancer diagnoses | 4 | 52294 | Risk Ratio (M‐H, Random, 95% CI) | 0.94 [0.83, 1.07] |
| 4.2 Cancer deaths | 5 | 52283 | Risk Ratio (M‐H, Random, 95% CI) | 1.00 [0.61, 1.64] |
| 4.3 Weight, kg | 6 | 43062 | Mean Difference (IV, Random, 95% CI) | ‐1.77 [‐3.54, ‐0.01] |
| 4.4 BMI, kg/m2 | 6 | 43894 | Mean Difference (IV, Random, 95% CI) | ‐0.42 [‐0.72, ‐0.12] |
| 4.5 Systolic Blood Pressure, mmHg | 5 | 3812 | Mean Difference (IV, Random, 95% CI) | ‐0.19 [‐1.36, 0.97] |
| 4.6 Diastolic Blood Pressure, mmHg | 5 | 3812 | Mean Difference (IV, Random, 95% CI) | ‐0.36 [‐1.03, 0.32] |
| 4.7 Quality of Life | 1 | 40130 | Mean Difference (IV, Random, 95% CI) | 0.04 [0.01, 0.07] |
Characteristics of studies
Characteristics of included studies [ordered by study ID]
Black 1994.
| Study characteristics | ||
| Methods | RCT Summary risk of bias: moderate to high |
|
| Participants | People with non‐melanoma skin cancer (USA)
CVD risk: low
Control: randomised 67, analysed 58
Intervention: randomised 66, analysed 57
Mean years in trial: 1.9
% male: control 67%, intervention 54%
Age: mean control 52.3 (SD 13.2), intervention 50.6 (SD 9.7) Ethnicity: white 100% (excluded from study if of Asian, Black, Hispanic or American Indian ancestry) Statins use allowed: Unclear % taking statins: Not reported |
|
| Interventions | Reduced fat vs usual diet Control aims: no dietary advice Intervention aims: total fat 20%E, protein 15%E, CHO 65%E Control methods: no dietary change, 4‐month intervals clinic examination by dermatologist Intervention methods: 8 x weekly classes plus monthly follow‐up sessions, with behavioural techniques being taught following individual approach (not clear if in a group or individual). 4‐month intervals clinic examination by dermatologist Intervention delivered face‐to‐face by a dietitian Total fat intake, %E ("during study" months 4 ‐ 24): cont 37.8 (SD 4.1), int 20.7 (SD 5.5) (mean difference ‐17.10, 95% CI ‐18.88 to ‐15.32) significant reduction Saturated fat intake, %E ("during study", months 4 ‐ 24): cont 12.8 (SD 2.0), int 6.6 (SD 1.8), (mean difference ‐6.20, 95% CI ‐6.90 to ‐5.50) significant reduction PUFA intake, %E ("during study", months 4 ‐ 24): cont 7.8 (SD 1.4), int 4.5 (SD 1.3), (mean difference ‐3.30, 95% CI ‐3.79 to ‐2.81) significant reduction PUFA n‐3 intake: not reported PUFA n‐6 intake: Linoleic acid, cont 16.9 (SD 5.6) g, int 8.5 (SD 3.3) g MUFA intake, %E ("during study", months 4 ‐ 24): cont 14.4 (SD 1.7), int 7.6 (SD 2.2), (mean difference ‐6.80, 95% CI ‐7.52 to ‐6.08) significant reduction CHO intake, %E ("during study", months 4 ‐ 24): cont 44.6 (SD 6.9), int 60.3 (SD 6.3), (mean difference 15.70, 95% CI 13.29 to 18.11) significant increase Protein intake, %E ("during study", months 4 ‐ 24): cont 15.7 (SD 2.4), int 17.7 (SD 2.2), (mean difference 2.00, 95% CI 1.16 to 2.84) significant increase Trans fat intake: not reported Replacement for saturated fat: CHO and protein (by dietary aims and achievements), main is CHO Style: diet advice Setting: community |
|
| Outcomes | Stated trial outcomes: incidence of actinic keratosis and non‐melanoma skin cancer
Data available on total mortality? yes
Cardiovascular mortality? yes
Events available for combined cardiovascular events: cardiovascular deaths Secondary outcomes: cancer deaths (none) Tertiary outcomes: none (weight data provided, but no variance info) |
|
| Notes |
Study duration 24 months. Study aim was to achieve low‐fat diet, but the study achieved a statistically significant reduction in saturated fat intake in the low‐fat group compared to control. SFA reduction achieved. Total serum cholesterol: not reported At 2 years control ‐1.5 kg n = 50?, intervention ‐1 kg n = 51? Trial dates: Study dates not reported (but still recruiting at first publication in 1994) Funding: National Cancer Institute Declarations of Interest of primary researchers: none stated, all authors worked for academic or health institutions |
|
| Risk of bias | ||
| Bias | Authors' judgement | Support for judgement |
| Random sequence generation (selection bias) | Low risk | "list of randomly generated numbers" |
| Allocation concealment (selection bias) | Unclear risk | Allocation method not clearly described |
| Blinding of participants and personnel (performance bias) All outcomes | High risk | Dietary advice provided, so participants not blinded |
| Blinding of outcome assessment (detection bias) CVD outcomes | Low risk | "examined .... by dermatologists unaware of their treatment assignments". Deaths (all‐cause and CVD) not considered relevant to the intervention |
| Blinding of outcome assessment (detection bias) All‐cause mortality | Low risk | Blinding is not relevant in assessment of mortality |
| Incomplete outcome data (attrition bias) All outcomes | Low risk | Low risk for all‐cause and CVD mortality. Unclear for other outcomes |
| Selective reporting (reporting bias) | Low risk | Not relevant for primary and secondary outcomes as all trialists asked for data |
| Free of systematic difference in care? | High risk | Minor, all have 4‐monthly clinic visits, the intervention group had 8 behavioural technique classes that the control group did not have |
| Stated aim to reduce SFA | High risk | Aim to reduce SFA not stated |
| Achieved SFA reduction | Low risk | Statistically significant SFA reduction achieved |
| Achieved TC reduction | Unclear risk | Not reported |
| Other bias | Low risk | None noted |
DART 1989.
| Study characteristics | ||
| Methods | Factorial RCT Diet And Reinfarction Trial (DART) Summary risk of bias: moderate to high |
|
| Participants | Men recovering from an MI (UK)
CVD risk: high
Control: randomised 1015, analysed unclear
Intervention: randomised 1018, analysed unclear
Mean years in trial: control 1.9, randomised 1.9
% male: 100%
Age: mean control 56.8, intervention 56.4 (< 70) Ethnicity: not stated Statins use allowed? Unclear, but there do not appear to have been any medication‐based exclusion criteria and included participants were taking anti‐hypertensives, anti‐anginals, anti‐coagulants, anti‐platelet, digoxin and "other cardiac drugs". % taking statins: Not reported, but only 5.4% were taking "other cardiac drugs" which may have included statins. |
|
| Interventions | Reduced and modified fat vs usual diet Control aims: no dietary advice on fat, weight reducing advice if BMI > 30 Intervention aims: reduce fat intake to 30%E, increase P/S to 1.0, weight‐reducing advice if BMI > 30 Note: This was a factorial trial, and so some in each group were randomised to increased fatty fish and/or increased cereal fibre. Control methods: dietitians provided 'sensible eating' advice without specific information on fats. Intervention methods: dietitians provided the participants and their wives with initial individual advice and a diet information sheet; participants were revisited for further advice, recipes, encouragement at 1, 3, 6, 9, 12, 15, 18 and 21 months. Intervention delivered individually face‐to‐face by a dietitian Total fat intake, %E (through study): cont 35 (SD 6), int 31 (SD 7) (mean difference ‐4.00, 95% CI ‐4.57 to ‐3.43) significant reduction Saturated fat intake, %E (through study): cont 15 (SD3), int 11 (SD3), (mean difference ‐4.00, 95% CI ‐4.26 to ‐3.74) significant reduction PUFA intake (through study)⁑: cont 7 (SD unclear), int 9 (SD unclear), (mean difference 2.00, 95% CI 1.57 to 2.43 assuming SDs of 5) significant increase PUFA n‐3 intake: EPA, cont 0.6 (SD 0.7) g/wk, Int 2.4 (SD 1.4) g/wk PUFA n‐6 intake: not reported MUFA intake (through study)⁑: cont 13 (SD unclear), int 11 (SD unclear) (mean difference ‐2.00, 95% CI ‐2.43 to ‐1.57 assuming SDs of 5) significant reduction CHO intake (through study): cont 44 (SD 6), int 46 (SD 7) (mean difference 2.00, 95% CI 1.43 to 2.57) significant increase Protein intake (through study): cont 17 (SD 4), int 18 (SD 4) (mean difference 1.00, 95% CI 0.65 to 1.35) significant increase Trans fat intake: not reported Replacement for saturated fat: PUFA and CHO (by dietary aims), PUFA, CHO and protein (by dietary achievements), main PUFA Style: diet advice Setting: community ⁑Estimated by subtraction (assuming total fat = SFA + PUFA + MUFA) or using the ratio (assuming P/S = PUFA/SFA) |
|
| Outcomes | Stated trial outcomes: mortality, reinfarction
Data available on total mortality? yes
Cardiovascular mortality? yes
Events available for combined cardiovascular events: cardiovascular deaths (including stroke deaths) plus non‐fatal MI Secondary outcomes: cancer deaths, total MI, non‐fatal MI, CHD mortality, CHD events (total MI) Tertiary outcomes: total and HDL cholesterol |
|
| Notes |
Study duration: 24 months Study aim was to achieve low fat diet with raised P/S ratio and saturated fat intake in the intervention group was significantly lower than in the control group. SFA reduction aimed and achieved. Total serum cholesterol, difference between intervention and control, mmol/L: ‐0.26 (95% CI ‐0.36 to ‐0.16), statistically significant reduction Trial dates: Study dates not reported (published in 1989) Funding: Welsh Scheme for the Development of Health and Social Research, Welsh Heart Research Foundation, Flora Project, Health Promotion Research Trust. (Seven Seas Health Care and Duncan Flockhart provided the MaxEPA capsules and Norgene provided 'Fybranta' tablets ‐ but these were not used in the comparison discussed in this systematic review) Declarations of Interest of primary researchers: none stated, all authors worked for academic or health institutions |
|
| Risk of bias | ||
| Bias | Authors' judgement | Support for judgement |
| Random sequence generation (selection bias) | Low risk | Randomised using sealed envelopes |
| Allocation concealment (selection bias) | Unclear risk | Unclear if envelopes were opaque |
| Blinding of participants and personnel (performance bias) All outcomes | High risk | Very difficult to blind trials where participants need to make their own dietary changes |
| Blinding of outcome assessment (detection bias) CVD outcomes | Low risk | Quote: "outcome assessors were not aware of study allocation" (Prof Burr, personal communication). Method of blinding not stated |
| Blinding of outcome assessment (detection bias) All‐cause mortality | Low risk | Blinding is not relevant in assessment of mortality |
| Incomplete outcome data (attrition bias) All outcomes | Low risk | GPs contacted for information on mortality and morbidity when participants did not attend |
| Selective reporting (reporting bias) | Low risk | Not relevant for primary and secondary outcomes as we asked all trialists for data |
| Free of systematic difference in care? | High risk | Different levels of advice appear to have been provided. See control and intervention methods in the Interventions section of the table of Characteristics of included studies |
| Stated aim to reduce SFA | Low risk | Aim to reduce SFA stated |
| Achieved SFA reduction | Low risk | SFA reduction achieved |
| Achieved TC reduction | Low risk | Statistically significant TC fall |
| Other bias | Low risk | None noted |
Houtsmuller 1979.
| Study characteristics | ||
| Methods | RCT Summary risk of bias: moderate to high |
|
| Participants | Adults with newly‐diagnosed diabetes (the Netherlands)
CVD risk: moderate Control: 51 randomised, unclear how many analysed (all analysed re deaths) Intervention: 51 randomised, unclear how many analysed (all re deaths) Mean years in trial: unclear (max duration 6 years) % male: 56% overall Age: mean unclear Baseline total fat intake: unclear Baseline saturated fat intake: unclear Ethnicity: not stated Statins use allowed? Unclear % taking statins: Not reported (probably none as too early, pre‐1980) |
|
| Interventions | Modified fat vs usual diet Control aims: SFA 35%E, CHO 50%E, protein 15%E Intervention aims: total fat 40%E, 1/3 linoleic acid, CHO 45%E, protein 15%E Control methods: unclear, surveyed by dietitian Intervention methods: unclear, surveyed by dietitian Intervention appears to be delivered by dietitian but no clear details on format or frequency Total fat intake: not reported Saturated fat intake: not reported (mean difference unclear) PUFA intake: not reported PUFA n‐3 intake: not reported PUFA n‐6 intake: not reported MUFA intake: not reported CHO intake: not reported Protein intake: not reported Trans fat intake: not reported Replacement for saturated fat: mainly PUFA (based on dietary aims) Style: diet advice? Setting: community |
|
| Outcomes | Stated trial outcomes: progression of diabetic retinopathy
Data available on total mortality? no
Cardiovascular mortality? no
Events available for combined cardiovascular events: total MI and angina Secondary outcomes: total cholesterol, TGs (data read off graph), CHD mortality (fatal MI), CHD events (MI, angina) |
|
| Notes | Study duration 6 years. Study aim was for control group to take 35%E as saturated fat, and the intervention group 40%E from fat, of which 33% was from linoleic acid (so saturated fat < 27%E), but saturated fat intake during trial not reported SFA reduction aimed (unclear whether achieved). Total serum cholesterol, difference between intervention and control, mmol/L: ‐0.47(95% CI ‐0.76 to ‐0.18), statistically significant reduction Trial dates: Study recruitment 1973 to (unclear) Funding: Dutch Heart Foundation Declarations of Interest of primary researchers: none stated, all authors worked for academic or health institutions |
|
| Risk of bias | ||
| Bias | Authors' judgement | Support for judgement |
| Random sequence generation (selection bias) | Low risk | Participants matched in pairs then randomised |
| Allocation concealment (selection bias) | Unclear risk | Allocation method not clearly described |
| Blinding of participants and personnel (performance bias) All outcomes | High risk | Unclear, though unlikely as dietary advice provided |
| Blinding of outcome assessment (detection bias) CVD outcomes | Unclear risk | Blinding of outcome assessors not mentioned |
| Blinding of outcome assessment (detection bias) All‐cause mortality | Low risk | Blinding is not relevant in assessment of mortality |
| Incomplete outcome data (attrition bias) All outcomes | Unclear risk | Unclear, deaths, cancer and CV events are dropouts, trialists asked for data ‐ unclear if any data missing |
| Selective reporting (reporting bias) | Low risk | Not relevant for primary and secondary outcomes as we asked all trialists for data |
| Free of systematic difference in care? | Unclear risk | Level and type of intervention unclear. See control and intervention methods in the Interventions section of the table of Characteristics of included studies |
| Stated aim to reduce SFA | Low risk | Aim to reduce SFA stated |
| Achieved SFA reduction | Unclear risk | SFA intake not reported |
| Achieved TC reduction | Low risk | Statistically significant TC fall |
| Other bias | High risk | Some concerns around fraud in the first authors later research on diet in cancer. No allegations found regarding his research in diabetes (but much information is in Dutch). Numbers of events are not clear by arm and assumed from adding across various publications |
Ley 2004.
| Study characteristics | ||
| Methods | RCT Summary risk of bias: low |
|
| Participants | People with impaired glucose intolerance or high normal blood glucose (New Zealand)
CVD risk: moderate
Control: unclear how many randomised (176 between both groups), unclear how many analysed (112 between both groups at 5 years)
Intervention: as above
Mean years in trial: 4.1 over whole trial
% male: control 80%, intervention 68%
Age: mean control 52.0 (SE 0.8), intervention 52.5 (SE 0.8) Ethnicity: European 67% int, 77% control, Maori 11% int, 7% control, Pacific islander 20% int, 13% control, Other 3% int, 4% control (outcomes not provided by ethnicity) Statins use allowed? Unclear % taking statins: Not reported |
|
| Interventions | Reduced fat vs usual diet Control aims: usual diet Intervention aims: reduced fat diet (no specific goal stated) Control methods: usual intake plus general advice on healthy eating consistent with the New Zealand guidelines and standard dietary information for people with nutrition‐related problems upon entering the trial Intervention methods: monthly small group meetings to follow a 1‐year structured programme aimed at reducing fat in the diet, includes education, personal goal‐setting, self‐monitoring Total fat intake, %E (at 1 year): int 26.1 (SD 7.7), cont 33.6 (SD 7.8) (mean difference ‐7.50, 95% CI ‐10.37 to ‐4.63) significant reduction Intervention delivered in small face‐to‐face groups but unclear by whom Saturated fat intake, %E (at 1 year): cont 13.4 (SD 4.7), int 10.0 (SD 4.2) (mean difference ‐3.40, 95% CI ‐5.05 to ‐1.75) significant reduction PUFA intake, %E (at 1 year): cont 4.8 (SD 1.6), int 4.0 (SD 1.4) (mean difference ‐0.80, 95% CI ‐1.36 to ‐0.24) significant reduction PUFA n‐3 intake: not reported PUFA n‐6 intake: not reported MUFA intake, %E (at 1 year): cont 11.8 (SD 3.1), int 8.9 (SD 2.8) (mean difference ‐2.90, 95% CI ‐3.99 to ‐1.81) significant reduction CHO intake, %E (at 1 year): cont 45.8 (SD 10.9), int 54.2 (SD 10.5) (mean difference 8.40, 95% CI 4.44 to 12.36) significant increase Protein intake, %E (at 1 year): cont 16.6 (SD 3.9), int 18.4 (SD 3.5), (mean difference 1.80, 95% CI 0.43 to 3.17) significant increase Trans fat intake: not reported Replacement for saturated fat: carbohydrate and protein (based on dietary achievements) Style: diet advice Setting: community |
|
| Outcomes | Stated trial outcomes: lipids, glucose, blood pressure
Data available on total mortality? yes
Cardiovascular mortality? yes
Events available for combined cardiovascular events: MI, angina, stroke, heart failure Secondary outcomes: total MI, stroke, cancer diagnoses, cancer deaths, CHD events (MI or angina) Tertiary outcomes: weight, total, LDL and HDL cholesterol, TGs, BP |
|
| Notes |
Study duration over 4 years Study aim was to reduce total fat (not saturated fat), but saturated fat intake in the intervention group was significantly lower than in the control group. SFA reduction achieved Total serum cholesterol, difference between intervention and control, mmol/L: ‐0.05 (95% CI ‐0.46 to 0.36), NO statistically significant reduction and smaller than 0.20 Trial dates: Recruitment 1988 to 1990 Funding: National Heart Foundation of New Zealand, Auckland Medical Research Foundation, Lotteries Medical Board and the Health Research Council of New Zealand Declarations of Interest of primary researchers: none stated, all authors worked for academic or health institutions |
|
| Risk of bias | ||
| Bias | Authors' judgement | Support for judgement |
| Random sequence generation (selection bias) | Low risk | Unmarked opaque envelopes were opened by the person recruiting, unable to alter allocation later (trial author stated in their reply to us that randomisation and preparation of the envelopes was by people not involved in recruitment). |
| Allocation concealment (selection bias) | Low risk | Unmarked opaque envelopes were opened by the person recruiting, unable to alter allocation later. |
| Blinding of participants and personnel (performance bias) All outcomes | High risk | Dietary advice, not blinded |
| Blinding of outcome assessment (detection bias) CVD outcomes | Low risk | Trial authors stated that outcome assessors were blinded. |
| Blinding of outcome assessment (detection bias) All‐cause mortality | Low risk | Blinding is not relevant in assessment of mortality. |
| Incomplete outcome data (attrition bias) All outcomes | Unclear risk | Unclear, deaths, cancer and CV events are dropouts, trialists were asked for data ‐ unclear if any data missing |
| Selective reporting (reporting bias) | Low risk | Not relevant for primary and secondary outcomes as we asked all trialists for data |
| Free of systematic difference in care? | High risk | See control and intervention methods in the Interventions section of the table of Characteristics of included studies |
| Stated aim to reduce SFA | High risk | Aim to reduce SFA not stated |
| Achieved SFA reduction | Low risk | SFA reduction achieved |
| Achieved TC reduction | High risk | TC fall small (0.05 mmol/L only) and not statistically significant |
| Other bias | Low risk | None noted |
Moy 2001.
| Study characteristics | ||
| Methods | RCT Summary risk of bias: moderate to high |
|
| Participants | Middle‐aged siblings of people with early CHD, with at least 1 CVD risk factor (USA)
CVD risk: moderate
Control: randomised 132, analysed 118
Intervention: randomised 135, analysed 117
Mean years in trial: 1.9
% male: control 49%, intervention 55%
Age: control mean 45.7 (SD 7), intervention 46.2 (SD 7) Ethnicity: African‐American 18% int, 25% control (remainder of group ethnicity not described, and outcomes not presented by ethnicity) Statins use allowed? Unclear (raised LDL cholesterol was a condition of entry, so use of statins probably minimal) % taking statins: Not reported |
|
| Interventions | Reduced fat intake vs usual diet Control aim: usual care Intervention aim: total fat 40 g/d or less Control methods: usual physician care with risk factor management at 0, 1 and 2 years Intervention methods: Individualised counselling by trained nurse, appointments 6 ‐ 8 weekly for 2 years Intervention delivered individually, face‐to‐face by a trained nurse. Total fat intake, %E (at 2 years): int 34.1 (SD unclear), cont 38.0 (SD unclear) (mean difference ‐3.90, 95% CI ‐6.46 to ‐1.34 assuming SDs of 10) significant reduction Saturated fat intake, %E (at 2 years): int 11.5 (SD unclear), cont 14.4 (SD unclear) (mean difference ‐2.90, 95% CI ‐4.18 to ‐1.62 assuming SDs of 5) significant reduction PUFA intake: not reported PUFA n‐3 intake: not reported PUFA n‐6 intake: not reported MUFA intake: not reported CHO intake: not reported Protein intake: not reported Trans fat intake: not reported Replacement for saturated fat: unclear Style: diet advice Setting: community |
|
| Outcomes | Stated trial outcomes: dietary intake
Data available on total mortality? yes, no deaths
Cardiovascular mortality? yes, no deaths
Events available for combined cardiovascular events: total MI, stroke, unstable angina, PVD and PTCA Secondary outcomes: cancer diagnoses (no events), cancer deaths (none), stroke, total and non‐fatal MI, CHD mortality (none), CHD events (MI or angina) Tertiary outcomes: BMI, HDL and LDL cholesterol, TG |
|
| Notes | Study duration 2 years Study aim was to reduce total fat based on ATPII dietary guidelines, and preliminary work established that this intervention reduced saturated fat and dietary cholesterol, and saturated fat intake was significantly lower than in the control group SFA reduction aimed and achieved Total serum cholesterol not reported, but LDL was, difference between intervention and control, mmol/L: ‐0.29 (95% CI ‐0.54 to ‐0.04), statistically significant reduction Trial dates: Study recruitment 1991 to 1994 Funding: National Institute of Nursing Research, General Clinical Research Center of the National Institutes of Health Declarations of Interest of primary researchers: none stated, all authors worked for academic or health institutions |
|
| Risk of bias | ||
| Bias | Authors' judgement | Support for judgement |
| Random sequence generation (selection bias) | Low risk | Randomly assigned via computerised schema after all eligible siblings from a family had been screened |
| Allocation concealment (selection bias) | Unclear risk | Allocation method not clearly described |
| Blinding of participants and personnel (performance bias) All outcomes | High risk | Participants clear about their allocation |
| Blinding of outcome assessment (detection bias) CVD outcomes | High risk | Trialists clear about allocation |
| Blinding of outcome assessment (detection bias) All‐cause mortality | Low risk | Blinding is not relevant in assessment of mortality. |
| Incomplete outcome data (attrition bias) All outcomes | Unclear risk | Unclear, deaths, cancer and CV events are dropouts, trialists were asked for data ‐ unclear if any data missing |
| Selective reporting (reporting bias) | Low risk | Not relevant for primary and secondary outcomes as all trialists asked for data |
| Free of systematic difference in care? | High risk | Differences in frequency of follow‐up, but unclear what differences in care occurred between the physician and nurse‐led care. See control and intervention methods in Interventions section of the table of Characteristics of included studies |
| Stated aim to reduce SFA | Low risk | Aim to reduce SFA stated |
| Achieved SFA reduction | Low risk | SFA reduction achieved |
| Achieved TC reduction | Low risk | Statistically significant LDL fall (though TC not reported) |
| Other bias | Low risk | None noted |
MRC 1968.
| Study characteristics | ||
| Methods | RCT Medical Research Council (MRC) Summary risk of bias: moderate to high |
|
| Participants | Free‐living men who have survived a first MI (UK)
CVD risk: high
Control: randomised 194, analysed 181 at 2 years
Intervention: randomised 199, analysed 172 at 2 years
Mean years in trial: control 3.7, intervention 3.8
% male: 100
Age: unclear (all < 60) Ethnicity: not stated Statins use allowed? Unclear (anti‐coagulants allowed, but few other medications appear to have been used) % taking statins: Not reported (probably none as too early, pre‐1980) |
|
| Interventions | Modified fat vs usual diet Control aims: usual diet Intervention aims: reduce dietary fat to 35 g fat per day, add 84 g soya oil per day Control methods: usual diet plus reducing diet (reduced CHO) for weight management for overweight men Intervention methods: instructed to follow a dietary regimen removing saturated fat from the diet plus daily dose of 85 g soya oil; half of it had to be taken unheated. Reduced CHO diet for weight management in overweight men Intervention appears to be delivered and supervised by trial dietitian but unclear how often. Total fat intake, %E (at 3.5 years): int 46 (SD unclear), cont 43 (SD unclear) (mean difference 3.00, 95% CI 0.91 to 5.09 assuming SDs of 10) significant increase Saturated fat intake: not reported (mean difference unclear) PUFA intake: not reported PUFA n‐3 intake: not reported PUFA n‐6 intake: not reported MUFA intake: not reported CHO intake: not reported Protein intake: not reported Trans fat intake: not reported Replacement for saturated fat: mainly PUFA (based on dietary goals) Style: diet advice & supplement (soy oil) Setting: community |
|
| Outcomes | Stated trial outcomes: MI or sudden death
Data available on total mortality? yes
Cardiovascular mortality? yes
Events available for combined cardiovascular events: cardiovascular deaths and fatal or non‐fatal MI Secondary outcomes: total and non‐fatal MI, stroke, cancer deaths, CHD mortality, CHD events (CHD mortality or non‐fatal MI) Tertiary outcomes: none (data for weight, total cholesterol and BP, but no variance info) |
|
| Notes | Study duration over 6 years Study aim: for intervention "saturated fats were replaced by polyunsaturated fats", but saturated fat intakes during trial were not reported. SFA reduction aimed Total serum cholesterol, difference between intervention and control, mmol/L: ‐0.64 (95% CI unclear), reduction > 0.20 For all, data at 4 years, control n = 89, intervention n = 88 Weight change: control ‐3 kg, intervention 0 kg Total cholesterol change: control ‐0.47 mmol/L, intervention ‐1.11 mmol/L Systolic BP change: control 0 mmHg, intervention +2 mmHg Diastolic BP change: control +3 mmHg, intervention ‐1 mmHg Trial dates: Study recruitment 1960 to 1965, analysed 1967 Funding: Medical Research Council Declarations of Interest of primary researchers: none stated, all authors worked for academic or health institutions. |
|
| Risk of bias | ||
| Bias | Authors' judgement | Support for judgement |
| Random sequence generation (selection bias) | Low risk | Quote: "using random numbers, by blocks within hospitals" |
| Allocation concealment (selection bias) | Unclear risk | Not described |
| Blinding of participants and personnel (performance bias) All outcomes | High risk | Big changes to fat intake in intervention group while control group ate their usual diet |
| Blinding of outcome assessment (detection bias) CVD outcomes | Low risk | Quote: "Suspected relapses were assessed at regular intervals by a review committee unaware of the patients diet group". |
| Blinding of outcome assessment (detection bias) All‐cause mortality | Low risk | Blinding is not relevant in assessment of mortality. |
| Incomplete outcome data (attrition bias) All outcomes | Unclear risk | Data collection was thorough, but some participants dropped out and contact was lost, so some events may have been missed. |
| Selective reporting (reporting bias) | Low risk | Not relevant for primary and secondary outcomes as all trialists were asked for data |
| Free of systematic difference in care? | High risk | Unlikely as control group continued diet as usual, intervention group were likely to have had additional contact. See control and intervention methods in the Interventions section of the table of Characteristics of included studies |
| Stated aim to reduce SFA | Low risk | Aim to reduce SFA stated |
| Achieved SFA reduction | Unclear risk | SFA intake not reported |
| Achieved TC reduction | Low risk | Although statistical significance was not reported or calculable, TC in the intervention group was 0.64 mmol/L lower than in the control group, a large fall (and almost certainly statistically significant). |
| Other bias | Low risk | None noted |
Oslo Diet‐Heart 1966.
| Study characteristics | ||
| Methods | RCT Oslo Diet‐Heart Trial Summary risk of bias: moderate to high for CVD outcomes, low for all‐cause mortality |
|
| Participants | Men with previous MI (Norway)
CVD risk: high
Control: randomised 206, analysed 148 (at 5 years)
Intervention: randomised 206, analysed 152 (at 5 years)
Mean years in trial: control 4.3, intervention 4.3
% male: 100
Age: mean control 56.3, intervention 56.2 (all 30 ‐ 67) Ethnicity: ethnicity not mentioned Statins use allowed? Unclear (medications not mentioned as exclusion criteria, most appeared to be on anti‐coagulant medications, statins not mentioned) % taking statins: Not reported (probably none as too early, pre‐1980) |
|
| Interventions | Modified fat diet vs control Control aims: no dietary advice but direct questions answered, supplement = 1 vitamin tablet daily Intervention aims: reduce meat and dairy fats, increase fish, vegetables, supplement ‐ 1 vitamin tablet daily, 0.5 L soy bean oil per week (free to 25% of participants), sardines in cod liver oil (free at certain times to encourage compliance) Control methods: usual diet Intervention methods: continuous instruction and supervision by dietitian, including home visits, letters and phone calls Total fat intake: unclear (note ‐ intake of total fat, carbohydrate, protein and sugar was assessed in 17 "especially conscientious and positive" as well as intelligent dieters, but this was not reported here as unlikely to be representative, and lacking control group data) Saturated fat intake: unclear (mean difference unclear) PUFA intake: unclear PUFA n‐3 intake: not reported PUFA n‐6 intake: not reported MUFA intake: unclear CHO intake: unclear Protein intake: unclear Trans fat intake: unclear Replacement for saturated fat: PUFA (based on dietary goals) Style: diet advice and supplement (food) Setting: community |
|
| Outcomes | Stated trial outcomes: coronary heart disease morbidity and mortality
Data available on total mortality? yes
Cardiovascular mortality? yes
Events available for combined cardiovascular events: total MI, sudden death, stroke, angina Secondary outcomes: non‐fatal and total MI, stroke, CHD mortality (fatal MI and sudden death), CHD events (MI, angina and sudden death) Tertiary outcomes: weight, total cholesterol, systolic and diastolic BP (but no variance information was provided) |
|
| Notes | Study duration over 4 years Study aim was to reduce serum cholesterol by a diet "low in saturated fats and in cholesterol, and rich in highly unsaturated fats", saturated fat intakes during study were not reported SFA reduction aimed (reduction unclear as not measured except in a highly compliant subgroup) Total serum cholesterol, difference between intervention and control, mmol/L: ‐1.07 (95% CI unclear), reduction > 0.20 Weight change from baseline was ‐0.5 kg in the control group (n ~ 155), ‐2.5 kg in the intervention group (n ~ 160) at 51 months Total cholesterol change from baseline was ‐0.46 mmol/L in the control group and ‐1.53 mmol/L in the intervention group at 51 months Systolic BP at baseline was 153.8 mmHg in control and 159.0 in intervention, and mean sBP through trial was 154.3 mmHg in control and 158.2 mmHg in the intervention group. Diastolic BP at baseline was 93.5 mmHg in control and 97.1 mmHg in intervention, through trial mean dBP was 95.5 mmHg in control and 98.6 mmHg in intervention participants Trial dates: Recruitment 1956 to 1958 Funding: Det Norske Råd for Hjerte‐ og karsyk‐dommer, A/S Freia Chokoladefabriks Arbeidsfond for Ernærings‐forskning, JL Tiedemanns Tobaksfabrik Joh H Andresens medisinske fond, plus A/S Farmacöytisk Industri provided a multivitamin free of charge, DE‐NO‐FA and Lillleborg Fabriker provided soy bean oil at reduced prices, the Research Laboratory of the Norwegian Canning Industry, Stavanger Preserving Co and Kommendal Packing Comp provided Norwegian sardines in cod liver oil free to those in the intervention group. Declarations of Interest of primary researchers: none stated, all authors worked for academic or health institutions. |
|
| Risk of bias | ||
| Bias | Authors' judgement | Support for judgement |
| Random sequence generation (selection bias) | Low risk | "table of random numbers used", by Prof Knut Westlund |
| Allocation concealment (selection bias) | Low risk | Randomisation appears to have occurred before medical examination within the study, so was not affected by participant characteristics and was concealed. |
| Blinding of participants and personnel (performance bias) All outcomes | High risk | Participants were aware of their allocation as was the main trialist. |
| Blinding of outcome assessment (detection bias) CVD outcomes | Unclear risk | Outcomes were categorised by a diagnostic board, but their blinded status was unclear. |
| Blinding of outcome assessment (detection bias) All‐cause mortality | Low risk | Blinding is not relevant in assessment of mortality. |
| Incomplete outcome data (attrition bias) All outcomes | Low risk | The participants who could not be directly followed up for the 5 years were followed until death or study end through personal interviews, or contact with their physicians or relatives. |
| Selective reporting (reporting bias) | Low risk | Not relevant for primary and secondary outcomes as all trialists were asked for data |
| Free of systematic difference in care? | High risk | Dietetic input level very different, although medical care appeared similar. See control and intervention methods in the Interventions section of the table of Characteristics of included studies |
| Stated aim to reduce SFA | Low risk | Aim to reduce SFA stated |
| Achieved SFA reduction | Unclear risk | SFA intake not reported |
| Achieved TC reduction | Low risk | Although statistical significance was not reported or calculable, TC in the intervention group was 1.07 mmol/L lower than in the control group, a large fall (and almost certainly statistically significant). |
| Other bias | Low risk | None noted |
Oxford Retinopathy 1978.
| Study characteristics | ||
| Methods | RCT Summary risk of bias: moderate to high for CVD outcomes, low for all‐cause mortality |
|
| Participants | Newly‐diagnosed non‐insulin‐dependent diabetics (UK)
CVD risk: moderate
Control: number randomised unclear (249 split between the 2 groups, 125?), number analysed for mortality unclear (all but 2 overall at 16 years)
Intervention: number randomised unclear (249 split between the 2 groups, 125?), number analysed as above
Mean years in trial: overall 9.3?
% male: overall 49%
Age: mean overall 47.1 (all < 65) Ethnicity: not stated Statins use allowed? Unclear % taking statins: Not reported (probably none as too early, pre‐1980) |
|
| Interventions | Reduced and modified dietary fat vs average diet Control aims: total fat 40%E, PUFA 12%E, protein 20%E, CHO 40%E (reducing simple sugars), 1500 kcal/day Intervention aims: total fat 26%E, PUFA 16%E, protein 20%E, CHO 54%E (reducing simple sugars), 1500 kcal/day Control methods: dietary advice from diabetes dietitian Intervention methods: dietary advice from diabetes dietitian Total fat intake, %E (at 7 ‐ 9 years)§: int 32 (SD unclear), cont 41 (SD unclear) (mean difference ‐9.00, 95% CI ‐11.48 to ‐6.52 assuming SDs of 10) significant reduction Saturated fat intake, %E (at 7 ‐ 9 years)§: int 10.7 (SD unclear), cont 20.4 (SD unclear) (mean difference ‐9.70, 95% CI ‐10.94 to ‐8.46 assuming SD of 5) significant reduction PUFA intake, %E (at 7 ‐ 9 years)§: int 11.8 (SD unclear), cont 2.1 (SD unclear) (mean difference 9.70, 95% CI 8.46 to 10.94 assuming SDs of 5) significant increase PUFA n‐3 intake: not reported PUFA n‐6 intake: not reported MUFA intake, %E (at 7 ‐ 9 years)§: int 9.5 (SD unclear), cont 18.6 (SD unclear) (mean difference ‐9.10, 95% CI ‐10.34 to 7.86 assuming SDs of 5) significant reduction Carbohydrate intake: not reported Protein intake: not reported Trans fat intake: not reported Replacement for saturated fat: PUFA and CHO (based on dietary goals and achievements) Style: diet advice Setting: community (outpatients clinic) §validity of these data is questionable as it represents only 3 intervention and 3 control participants. Source: Lopez‐Espinoza 1984 |
|
| Outcomes | Stated trial outcomes: retinopathy
Data available on total mortality? yes, but unable to ascertain from which intervention groups (34 deaths at 10 years)
Cardiovascular mortality? no
Events available for combined cardiovascular events: none Secondary outcomes: none Tertiary outcomes: BMI, total cholesterol |
|
| Notes | Study duration over 9 years Study aim was to reduce total fat and increase PUFAs (so reducing saturates), and saturated fat intake in the intervention group was significantly lower than in the control group SFA reduction achieved Total serum cholesterol, difference between intervention and control, mmol/L: 0.07 (95% CI ‐0.34 to 0.48), NO statistically significant reduction and smaller than 0.20 Trial dates: Recruitment 1973 to 1976 Funding: Oxford Diabetes Trust, British Diabetic Association, International Sugar Research Foundation Inc Declarations of Interest of primary researchers: none stated, all authors worked for academic or health institutions. |
|
| Risk of bias | ||
| Bias | Authors' judgement | Support for judgement |
| Random sequence generation (selection bias) | Low risk | "random number sequence, provided and allotted by a separate agency" (Prof Richard Peto) |
| Allocation concealment (selection bias) | Low risk | "random number sequence, provided and allotted by a separate agency" (Prof Richard Peto) |
| Blinding of participants and personnel (performance bias) All outcomes | High risk | Participants were not blinded. |
| Blinding of outcome assessment (detection bias) CVD outcomes | Unclear risk | Unclear whether physicians blinded to allocation |
| Blinding of outcome assessment (detection bias) All‐cause mortality | Low risk | Blinding is not relevant in assessment of mortality. |
| Incomplete outcome data (attrition bias) All outcomes | Unclear risk | Unclear, deaths, cancer and CV events are dropouts ‐ unclear if any data missing |
| Selective reporting (reporting bias) | Low risk | Not relevant for primary and secondary outcomes as all trialists were asked for data |
| Free of systematic difference in care? | Low risk | Dietetic advice for both groups. See control and intervention methods in the Interventions section of the table of Characteristics of included studies |
| Stated aim to reduce SFA | High risk | Aim to reduce SFA not stated |
| Achieved SFA reduction | Low risk | SFA reduction achieved |
| Achieved TC reduction | High risk | No statistically significant TC fall, and difference only 0.07 mmol/L |
| Other bias | Low risk | None noted |
Rose corn oil 1965.
| Study characteristics | ||
| Methods | RCT Summary risk of bias: moderate to high |
|
| Participants | Men (?) with angina or following MI (UK)
CVD risk: high
Control: randomised 26, analysed 18 Intervention ‐ corn: randomised 26, analysed 13 Mean years in trial: control 1.7, corn 1.5 % male: unclear (100%?) Age: mean control 58.8, corn 52.6 (all < 70) Ethnicity: not stated Statins use allowed? Unclear (anti‐coagulants not allowed, but all participants received conventional treatments at the discretion of their physicians) % taking statins: Not reported (probably none as too early, pre‐1980) |
|
| Interventions | Modified fat vs usual diet Control aims: usual diet Intervention aims ‐ corn: restrict dietary fat, plus 80 g/day corn oil provided Control methods: usual physician care plus follow‐up clinic monthly, then every 2 months, no dietary fat advice or oil provided Intervention methods: usual physician care plus follow‐up clinic monthly, then every 2 months, dietary fat advice plus oil provided Unclear how the advice was delivered or by whom Total fat intake, %E (at 18 months): corn 50.5 (SD unclear), cont 32.6 (SD unclear) (mean difference 17.90, 95% CI 10.77 to 25.03 assuming SDs of 10) significant increase Saturated fat intake: unclear (mean difference unclear) PUFA intake: unclear PUFA n‐3 intake: not reported PUFA n‐6 intake: not reported MUFA intake: unclear CHO intake, %E (at 18 months): corn 36.5 (SD unclear), cont 51.5 (|SD unclear) (mean difference ‐15.00, 95% CI ‐29.27 to ‐0.73 assuming SDs of 20) significant reduction Protein intake, %E (at 18 months): corn 11.0 (SD unclear), cont 13.2 (SD unclear) (mean difference ‐2.20, 95% CI ‐5.77 to 1.37 assuming SDs of 5) no significant difference Trans fat intake: unclear Replacement for saturated fat: mainly PUFA (based on aims and achievements) Style: diet advice and supplement (oil) Setting: community |
|
| Outcomes | Stated trial outcomes: cardiac events
Data available on total mortality? yes
Cardiovascular mortality? yes
Events available for combined cardiovascular events: cardiovascular deaths, non‐fatal MI, angina, stroke Secondary outcomes: stroke (none), non‐fatal and total MI, CHD mortality (fatal MI and sudden death), CHD events (all MI and sudden death) Tertiary outcomes: total cholesterol |
|
| Notes | Study duration 2 years Study aim was to reduce total fat (by restricting fatty meat, sausages, pastry, ice cream, cheese, cake, milk, eggs and butter) and prescribe vegetable oil (so reducing saturates), but saturated fat intakes during intervention were not reported. SFA reduction aimed (but unclear whether achieved as SFA intake not reported) Total serum cholesterol, difference between intervention and control, mmol/L: ‐0.58 (95% CI ‐1.42 to 0.26), NO statistically significant reduction but > 0.20 Trial dates: unclear, published in 1965 Funding: probably unfunded (they thank the Paddington General Hospital for clinic facilities, and St Mary's and Paddington General Hospital physicians for referral of patients, but no funding acknowledged) Declarations of Interest of primary researchers: none stated, all authors worked for academic or health institutions. |
|
| Risk of bias | ||
| Bias | Authors' judgement | Support for judgement |
| Random sequence generation (selection bias) | Low risk | Trial was stated as "randomised" but without further detail, apart from use of a sealed envelope as below. |
| Allocation concealment (selection bias) | Unclear risk | When a new participant was accepted for the trial a sealed envelope was opened containing the allocation instructions. In the case of participants allocated to an oil group, the instructions referred only to a code number. |
| Blinding of participants and personnel (performance bias) All outcomes | High risk | The physicians in charge knew which participants were receiving oil, but they did not know until the end of the trial the kind of oil that they were receiving. |
| Blinding of outcome assessment (detection bias) CVD outcomes | Low risk | The electrocardiograms were assessed without the knowledge of the participant's treatment group. |
| Blinding of outcome assessment (detection bias) All‐cause mortality | Low risk | Blinding is not relevant in assessment of mortality. |
| Incomplete outcome data (attrition bias) All outcomes | Unclear risk | Some lost to follow‐up by 2 years, so some events may have been missed |
| Selective reporting (reporting bias) | Low risk | Not relevant for primary and secondary outcomes as all trialists were asked for data. |
| Free of systematic difference in care? | Low risk | All received conventional treatments at the discretion of the physicians, all attended a special follow‐up clinic. See control and intervention methods in the Interventions section of the table of Characteristics of included studies |
| Stated aim to reduce SFA | Low risk | Aim to reduce SFA stated |
| Achieved SFA reduction | Unclear risk | SFA intake not reported |
| Achieved TC reduction | High risk | Although the TC in the intervention group was 0.58 mmol/L lower than in the control group, this was not statistically significant in this small study. |
| Other bias | Low risk | None noted |
Rose olive 1965.
| Study characteristics | ||
| Methods | RCT Summary risk of bias: moderate to high |
|
| Participants | Men (?) with angina or following MI (UK)
CVD risk: high
Control: randomised 26, analysed 18
Intervention ‐ olive: randomised 28, analysed 12 Mean years in trial: control 1.7, olive 1.5 % male: unclear (100%?) Age: mean control 58.8, olive 55.0 (all < 70) Ethnicity: Not stated Statins use allowed? Unclear (anti‐coagulants not allowed, but all participants received conventional treatments at the discretion of their physicians) % taking statins: Not reported (probably none as too early, pre‐1980) |
|
| Interventions | Modified fat vs usual diet Control aims: usual diet Intervention aims ‐ olive: restrict dietary fat, plus 80 g/day olive oil provided Control methods: usual physician care plus follow‐up clinic monthly, then every 2 months, no dietary fat advice or oil provided Intervention methods: usual physician care plus follow‐up clinic monthly, then every 2 months, dietary fat advice plus oil provided Unclear how the advice was delivered or by whom Total fat intake, %E (at 18 months): olive 46.2 (SD unclear), cont 32.6 (SD unclear) (mean difference 13.60, 95% CI 6.30 to 20.90 assuming SDs of 10) significant increase Saturated fat intake: unclear (mean difference unclear) PUFA intake: unclear PUFA n‐3 intake: not reported PUFA n‐6 intake: not reported MUFA intake: unclear CHO intake, %E (at 18 months): olive 42.2 (SD unclear), cont 51.5 (SD unclear) (mean difference ‐9.30, 95% CI ‐23.91 to 5.31 assuming SDs of 20) no significant difference Protein intake, %E (at 18 months): olive 9.6 (SD unclear), cont 13.2 (SD unclear) (mean difference ‐3.60, 95% CI ‐7.25 to 0.05 assuming SDs of 5) no significant difference Trans fat intake: unclear Replacement for saturated fat: mainly MUFA (based on dietary aims) Style: diet advice and supplement (oil) Setting: community |
|
| Outcomes | Stated trial outcomes: cardiac events
Data available on total mortality? yes
Cardiovascular mortality? yes
Events available for combined cardiovascular events: cardiovascular deaths, non‐fatal MI, angina, stroke Secondary outcomes: stroke (none), non‐fatal and total MI, CHD mortality (fatal MI and sudden death), CHD events (all MI and sudden death) Tertiary outcomes: total cholesterol |
|
| Notes | Study duration 2 years Study aim was to reduce total fat (by restricting fatty meat, sausages, pastry, ice cream, cheese, cake, milk, eggs and butter) and prescribe vegetable oil (so reducing saturates), but saturated fat intakes during intervention were not reported SFA reduction aimed (but unclear whether achieved as SFA intake not reported) Total serum cholesterol, difference between intervention and control, mmol/L: 0.30 (95% CI ‐0.93 to 1.53), NO statistically significant reduction, mean total cholesterol rose Trial dates: unclear, published in 1965 Funding: probably unfunded (they thank the Paddington General Hospital for clinic facilities, and St Mary's and Paddington General Hospital physicians for referral of patients, but no funding acknowledged) Declarations of Interest of primary researchers: none stated, all authors worked for academic or health institutions. |
|
| Risk of bias | ||
| Bias | Authors' judgement | Support for judgement |
| Random sequence generation (selection bias) | Low risk | Trial was stated as "randomised" but without further detail, apart from use of a sealed envelope as below. |
| Allocation concealment (selection bias) | Unclear risk | When a new participant was accepted for the trial a sealed envelope was opened containing the allocation instructions. In the case of participants allocated to an oil group, the instructions referred only to a code number. |
| Blinding of participants and personnel (performance bias) All outcomes | High risk | The physicians in charge knew which participants were receiving oil, but they did not know until the end of the trial the kind of oil that they were receiving. |
| Blinding of outcome assessment (detection bias) CVD outcomes | Low risk | The electrocardiograms were assessed without the knowledge of the participant's treatment group. |
| Blinding of outcome assessment (detection bias) All‐cause mortality | Low risk | Blinding is not relevant in assessment of mortality. |
| Incomplete outcome data (attrition bias) All outcomes | Unclear risk | Some lost to follow‐up by 2 years, so some events may have been missed |
| Selective reporting (reporting bias) | Low risk | Not relevant for primary and secondary outcomes as all trialists were asked for data. |
| Free of systematic difference in care? | Low risk | All received conventional treatments at the discretion of the physicians, all attended a special follow‐up clinic. See control and intervention methods in the Interventions section of the table of Characteristics of included studies |
| Stated aim to reduce SFA | Low risk | Aim to reduce SFA stated |
| Achieved SFA reduction | Unclear risk | SFA intake not reported |
| Achieved TC reduction | High risk | Although the TC in the intervention group was 0.58 mmol/L lower than in the control group, this was not statistically significant in this small study. |
| Other bias | Low risk | None noted |
Simon 1997.
| Study characteristics | ||
| Methods | RCT Summary risk of bias: moderate to high |
|
| Participants | Women with a high risk of breast cancer (USA)
CVD risk: low
Control: randomised 96, analysed 75
Intervention: randomised 98, analysed 72
Mean years in trial: control 1.8, intervention 1.7
% male: 0
Age: mean control 46, intervention 46 Ethnicity: White 89%, African‐American 9%, Hispanic 2% Statins use allowed? No (those on lipid‐lowering medications were excluded) % taking statins: 0% |
|
| Interventions | Reduced fat vs usual diet Control aims: usual diet Intervention aims: total fat 15%E Control methods: continued usual diet Intervention methods: Bi‐weekly individual dietetic appointments over 3 months followed by monthly individual or group appointments, including education, goal‐setting, evaluation, feedback and self‐monitoring Intervention delivered face‐to‐face by a dietitian Total fat intake, %E (at 12 months)§: int 17.6 (SD 5.8), cont 33.8 (SD 7.4) (mean difference ‐16.20, 95% CI ‐18.34 to ‐14.06) significant reduction Saturated fat intake, %E (at 12 months)§: int 6.0 (SD 3.0), cont 12.1 (SD 5.2) (mean difference ‐6.10, 95% CI ‐7.47 to ‐4.73) significant reduction PUFA intake, %E (at 12 months)§: int 3.8 (SD 1.7), cont 7.3 (SD 4.1) (mean difference ‐3.50, 95% CI ‐4.51 to ‐2.49) significant reduction PUFA n‐3 intake: not reported PUFA n‐6 intake: not reported MUFA intake, %E (at 12 months)§: int 6.1 (SD 3.0), cont 12.8 (SD 6.3) (mean difference ‐6.70, 95% CI ‐8.29 to ‐5.11) significant reduction CHO intake: not reported Protein intake: not reported Trans fat intake: not reported Replacement for saturated fat: unclear, either carbohydrate or protein (based on aims and achievements) Style: diet advice Setting: community §Kasim 1993 |
|
| Outcomes | Stated trial outcomes: intervention feasibility
Data available on total mortality? yes (2 deaths, but not clear in which arms)
Cardiovascular mortality? no
Events available for combined cardiovascular events: none Secondary outcomes: cancer diagnosis (8 diagnoses, but not clear in which arms) Tertiary outcomes: weight, total, LDL and HDL cholesterol, TGs |
|
| Notes | Study duration 2 years Study aim was to reduce total fat to 15%E (saturated fat not mentioned), but saturated fat intake in the intervention group was significantly lower than in the control group SFA reduction achieved Total serum cholesterol, difference between intervention and control, mmol/L: ‐0.34 (95% CI ‐0.64 to ‐0.04), statistically significant reduction Trial dates: Recruitment 1987 to 1989 Funding: Marilyn J Smith Fund, Harper‐Grace Hospitals, the Wesley Foundation, National Cancer Institute, Karmanos Cancer Institute Core Grant, the United Foundation of Detroit Declarations of Interest of primary researchers: none stated, all authors worked for academic or health institutions except PN Kim who was affiliated with Wesley Health Strategies (now Health Strategies, which offers a "full‐service health and fitness centre with an educated fitness staff and spacious workout areas", see healthstrategiesfitness.com/) |
|
| Risk of bias | ||
| Bias | Authors' judgement | Support for judgement |
| Random sequence generation (selection bias) | Low risk | Randomisation method not clearly described, but participants were stratified by age and randomised (block size 2). |
| Allocation concealment (selection bias) | Unclear risk | Allocation method not clearly described |
| Blinding of participants and personnel (performance bias) All outcomes | High risk | Participants knew their allocation. |
| Blinding of outcome assessment (detection bias) CVD outcomes | Unclear risk | Unclear whether physicians knew allocations |
| Blinding of outcome assessment (detection bias) All‐cause mortality | Low risk | Blinding is not relevant in assessment of mortality. |
| Incomplete outcome data (attrition bias) All outcomes | Unclear risk | Unclear, deaths, cancer and CV events are dropouts ‐ unclear if any data missing |
| Selective reporting (reporting bias) | Low risk | Not relevant for primary and secondary outcomes as all trialists were asked for data |
| Free of systematic difference in care? | High risk | Very different contact time with dietitian, but medical appointments same in both groups. See control and intervention methods in the Interventions section of the table of Characteristics of included studies |
| Stated aim to reduce SFA | High risk | Aim to reduce SFA not stated |
| Achieved SFA reduction | Low risk | SFA reduction achieved |
| Achieved TC reduction | Low risk | Statistically significant TC fall |
| Other bias | Low risk | None noted |
STARS 1992.
| Study characteristics | ||
| Methods | RCT St Thomas' Atherosclerosis Regression Study (STARS) Summary risk of bias: moderate to high for CVD outcomes, low for all‐cause mortality |
|
| Participants | Men with angina referred for angiography (UK)
CVD risk: high
Control: unclear how many randomised (30?), analysed 24
Intervention: unclear how many randomised (30?), analysed 26
Mean years in trial: control 2.9, intervention 3.0
% male: 100%
Age: mean control 53.9, intervention 48.9 (all < 66) Ethnicity: not stated Statins use allowed? No (1 arm of the trial, not described here, prescribed cholestyramine) % taking statins: 0% |
|
| Interventions | Reduced and modified fat diet vs usual diet Control aims: no diet intervention but advised to lose weight if BMI > 25 Intervention aims: total fat 27%E, SFA 8 ‐ 10%E, omega‐3 and omega‐6 PUFA 8%E, increase in plant‐derived soluble fibre, dietary cholesterol 100 mg/1000 kcal, advised to lose weight if BMI > 25 Control methods: usual care but no formal dietetic counselling. They were counselled against smoking if appropriate and advised about daily exercise level. Intervention methods: Usual care plus dietetic individual assessment of diet and advice. Further dietetic counselling and food stuffs were given to participants who did not achieve or maintain certain levels of serum cholesterol reduction Initial intervention was delivered individually face‐to‐face by a dietitian and follow‐up by a clinician. Total fat intake, %E (through study): int 27 (SD 7), cont 37 (SD 5) (mean difference ‐10.00, 95% CI ‐13.35 to ‐6.65) significant reduction Saturated fat intake, %E (through study): int 9 (SD 3), cont 16 (SD 4) (mean difference ‐7.00, 95% CI ‐8.97 to ‐5.03) significant reduction PUFA intake, %E (through study)§: int 7 (SD 2), cont 5 (SD 2) (mean difference 2.00, 95% CI 0.89 to 3.11) significant increase PUFA n‐3 intake: not reported PUFA n‐6 intake: not reported MUFA intake, %E (through study)§: int 10 (SD 4), cont 17 (SD 5) (mean difference ‐7.00, 95% CI ‐9.52 to ‐4.48) significant reduction CHO intake, %E (through study)§: int 49 (SD 7), cont 41 (SD 7) (mean difference 8.00, 95% CI 4.12 to 11.88) significant increase Protein intake, %E (through study)§: int 19 (SD 4), cont 18 (SD 2) (mean difference 1.00, 95% CI ‐0.73 to 2.73) no significant effect Trans fat intake: not reported Replacement for saturated fat: CHO and PUFA (based on aims and achievements) Style: diet advice Setting: community §Blann 1995 |
|
| Outcomes | Stated trial outcomes: angiography
Data available on total mortality? yes
Cardiovascular mortality? yes
Events available for combined cardiovascular events: cardiovascular deaths, non‐fatal MI, angina, stroke, CABG, angioplasty, stroke, total MI, CHD events, plus cancer deaths (none) Secondary outcomes: total, HDL, LDL cholesterol, TGs, total/HDL and LDL/HDL ratios, 2‐hour post‐load glucose (weight and BP "remained similar" but were not reported, Lp(a) reported but as geometric means) |
|
| Notes | Study duration: 3 years Study aim was to reduce saturated fats (to 8 ‐ 10%E), and saturated fat intake in the intervention group was significantly reduced SFA reduction aimed and achieved Total serum cholesterol, difference between intervention and control, mmol/L: ‐0.76 (95% CI ‐1.19 to ‐0.33), statistically significant reduction Trial dates: Study dates not reported (published in 1992) Funding: Unilever plc, the Chemical Pathology Fund of St Thomas' Hospital, and Bristol‐Meyers Ltd Declarations of Interest of primary researchers: none stated, all authors worked for academic or health institutions. |
|
| Risk of bias | ||
| Bias | Authors' judgement | Support for judgement |
| Random sequence generation (selection bias) | Low risk | "blinded random cards issued centrally by statistician advisor" |
| Allocation concealment (selection bias) | Low risk | "blinded random cards issued centrally by statistician advisor" |
| Blinding of participants and personnel (performance bias) All outcomes | High risk | Participant blinding: inadequate |
| Blinding of outcome assessment (detection bias) CVD outcomes | Unclear risk | Physician blinding: unclear |
| Blinding of outcome assessment (detection bias) All‐cause mortality | Low risk | Blinding is not relevant in assessment of mortality. |
| Incomplete outcome data (attrition bias) All outcomes | Unclear risk | Unclear, deaths, cancer and CV events are dropouts ‐ unclear if any data missing |
| Selective reporting (reporting bias) | Low risk | Not relevant for primary and secondary outcomes as all trialists were asked for data |
| Free of systematic difference in care? | High risk | Usual care in both groups, dietetic counselling only in the intervention group. See control and intervention methods in the Interventions section of the table of Characteristics of included studies |
| Stated aim to reduce SFA | Low risk | Aim to reduce SFA stated |
| Achieved SFA reduction | Low risk | SFA reduction achieved |
| Achieved TC reduction | Low risk | Statistically significant TC fall |
| Other bias | Low risk | None noted |
Sydney Diet‐Heart 1978.
| Study characteristics | ||
| Methods | RCT Sydney Diet‐Heart Trial Summary risk of bias: moderate to high |
|
| Participants | Men with previous MI (Australia)
CVD risk: high
Control: randomised 237, analysed 221 at 2 years
Intervention: randomised 221, analysed 205 at 2 years
Mean years in trial: control 4.3, intervention 4.3
% male: 100
Age: mean control 49.1 (SD 6.5), intervention 48.7 (SD 6.8) Ethnicity: not stated Statins use allowed? Unclear (use of medication did not appear to be an exclusion criteria) % taking statins: Not reported (probably none as too early, pre‐1980) |
|
| Interventions | Modified fat diet vs usual diet Control aims: reduction in energy if overweight, no other specific dietary advice, allowed to use PUFA margarine instead of butter Intervention aims: SFA 10%E, PUFA 15%E, reduction in energy if overweight, dietary chol < 300 mg/day Control methods: no specific dietary instruction (except re weight) Intervention methods: advised and tutored individually, diet assessed 3 times in 1st year and twice annually thereafter Intervention was delivered face‐to‐face individually but unclear by whom Total fat intake, %E ("during follow‐up"): int 38.3 (SD 5.9), cont 38.1 (SD 5.4) (mean difference 0.20, 95% CI ‐0.88 to 1.28) no significant difference Saturated fat intake, %E ("during follow‐up"): int 9.8 (SD 2.6), cont 13.5 (SD 3.2) (mean difference ‐3.70, 95% CI ‐4.25 to ‐3.15) significant reduction PUFA intake, %E ("during follow‐up"): int 15.1 (SD 4.3), cont 8.9 (SD 3.5) (mean difference 6.20, 95% CI 5.45 to 6.95) significant increase PUFA n‐3 intake: not reported PUFA n‐6 intake: not reported MUFA intake, %E ("during follow‐up"): int 11.5 (SD 2.1), cont 13.8 (SD 2.5) (mean difference ‐2.30, 95% CI ‐2.74 to ‐1.86) significant reduction CHO intake, %E ("during follow‐up"): int 40.9 (SD 7.3), cont 40.3 (SD 7.3) (mean difference 0.60, 95% CI ‐0.79 to 1.99) no significant difference Protein intake, %E ("during follow‐up"): int 15.2 (SD 2.8), cont 15.7 (SD 3.4) (mean difference ‐0.50, 95% CI ‐1.09 to 0.09) no significant difference Trans fat intake: not reported Primary replacement for saturated fat: mainly PUFA (based on dietary aims and achievements) Style: diet advice Setting: community |
|
| Outcomes | Stated trial outcomes: cardiovascular mortality and morbidity
Data available on total mortality? yes
Cardiovascular mortality? yes (exact events included not stated)
Events available for combined cardiovascular events: none Secondary outcomes: CHD deaths (exact events included not stated) Tertiary outcomes: total cholesterol, TG, BMI, sBP, dBP |
|
| Notes | Study duration 7 years Study aim was saturated fat 10%E, and saturated fat intake in the intervention group was less than 80% of that in the control (73%) SFA reduction aimed and achieved Total serum cholesterol, difference between intervention and control, mmol/L: ‐0.30 (95% CI ‐0.51 to ‐0.09), statistically significant reduction Trial dates: Recruitment 1966 to [unclear] and followed for 2 to 7 years Funding: Life Insurance Medical Research Fund of Australia and New Zealand Declarations of Interest of primary researchers: none stated, all authors worked for academic or health institutions. |
|
| Risk of bias | ||
| Bias | Authors' judgement | Support for judgement |
| Random sequence generation (selection bias) | Low risk | Quote: "table of random numbers ... generated by a research assistant and was concealed until after medical evaluations and testing at baseline were completed". |
| Allocation concealment (selection bias) | Low risk | As above |
| Blinding of participants and personnel (performance bias) All outcomes | High risk | Very difficult to blind trials where participants need to make their own dietary changes |
| Blinding of outcome assessment (detection bias) CVD outcomes | Low risk | Initially masked to group assignment (though success of blinding not checked) |
| Blinding of outcome assessment (detection bias) All‐cause mortality | Low risk | Blinding is not relevant in assessment of mortality. |
| Incomplete outcome data (attrition bias) All outcomes | Low risk | Survival analysis used |
| Selective reporting (reporting bias) | Low risk | Not relevant for primary and secondary outcomes as all trialists were asked for data |
| Free of systematic difference in care? | High risk | Advice and follow‐up in intervention group, not in control. See control and intervention methods in the Interventions section of the table of Characteristics of included studies |
| Stated aim to reduce SFA | Low risk | Aim to reduce SFA stated |
| Achieved SFA reduction | Low risk | SFA reduction achieved |
| Achieved TC reduction | Low risk | Statistically significant TC fall |
| Other bias | Low risk | None noted |
Veterans Admin 1969.
| Study characteristics | ||
| Methods | RCT Summary risk of bias: moderate to high |
|
| Participants | Men living at the Veterans Administration Center (USA)
CVD risk: low
Control: randomised 422, analysed 422
Intervention: randomised 424, analysed 424
Mean years in trial: control 3.7, intervention 3.7
% male: 100
Age: mean control 65.6, intervention 65.4 (all 54 ‐ 88) Ethnicity: White 90%, African‐American 7%, Asian 1%, Mexican 1%, other 1% Statins use allowed? Unclear (only 4 participants were taking nicotinic acid, 17 diuretics, 56 digitalis, none on heparin) % taking statins: Not reported (probably none as too early, pre‐1980) |
|
| Interventions | Modified fat vs usual diet Control aims: provided, total fat 40%E Intervention aims: total fat 40%E, ⅔ of SFA replaced by unsaturated fats, dietary chol reduced Control methods: whole diet provided Intervention methods: whole diet provided Total fat intake, %E (during trial): int 38.9 (SD unclear), cont 40 (SD unclear) (mean difference ‐1.10, 95% CI ‐2.45 to 0.25 assuming SDs of 10) no significant difference Saturated fat intake, %E (during trial): int 8.3 (SD unclear), cont 18.5 (SD unclear) (mean difference ‐10.20, 95% CI ‐10.87 to ‐9.53 assuming SDs of 5) significant reduction PUFA intake, %E (during trial)§: int 16.0 (SD ?), cont 4.9 (SD 0.10) (mean difference 11.10, 95% CI 10.62 to 11.58 assuming missing SD was 5) significant increase PUFA n‐3 intake: not reported PUFA n‐6 intake: not reported MUFA intake, %E (during trial)⁑: not reported, approx int 14.0, cont 17.2 (mean difference ‐3.20, 95% CI ‐3.87 to ‐2.53) significant reduction CHO intake, %E (during trial)⁑: not reported, approx int 45.9, cont 44.8 (mean difference 1.10, 95% CI ‐1.60 to 3.80 assuming SDs of 20) no significant difference Protein intake, %E (during trial)§: int 15.2 (SD ?), cont 15.2 (SD ?) (mean difference 0.00, 95% CI ‐0.67 to 0.67 assuming SDs of 5) no significant difference Trans fat intake: not reported Replacement for saturated fat: mainly PUFA (based on dietary aims and achievements) Style: diet provided Setting: residential institution §Dayton 1965 ⁑Estimated by subtraction (assuming total fat = SFA + PUFA + MUFA or energy intake = energy from fat + CHO + protein) |
|
| Outcomes | Stated trial outcomes: mortality, heart disease
Data available on total mortality? yes
Cardiovascular mortality? yes
Events available for combined cardiovascular events: sudden death, definite MI, definite stroke, angina, PVD events Secondary outcomes: cancer deaths, cancer diagnoses, stroke, non‐fatal MI, total MI, CHD deaths (fatal MI and sudden death due to CHD), CHD events (any MI or sudden death due to CHD) Tertiary outcomes: none (some data on total cholesterol, but no variance info) |
|
| Notes | Study duration over 8 years Study aim was to replace 66% of saturated fat by unsaturated fats, and saturated fat intake in the intervention group was significantly lower than in control SFA reduction aimed and achieved Total serum cholesterol, difference between intervention and control, mmol/L: ‐0.37 (95% CI ‐0.77 to 0.03), NO statistically significant reduction but reduction > 0.20 Trial dates: Recruitment 1959 to 1967 Funding: Veterans Administration, Arthur Dodd Fuller Foundation, National Heart Institute, Los Angeles County Heart Association, plus gifts of foods from Mazola corn oil and Mazola margarine, the National Soybean Processors Association, Pitman‐Moore Company (Emdee margarine) and Hi‐Saff Imitation Ice‐cream from Frozen Desserts Company. Edgmar Farms donated milk refrigeration equipment. Declarations of Interest of primary researchers: none stated, all authors worked for academic or health institutions. |
|
| Risk of bias | ||
| Bias | Authors' judgement | Support for judgement |
| Random sequence generation (selection bias) | Low risk | Quote: "table of random numbers used" |
| Allocation concealment (selection bias) | Low risk | Extensive baseline assessment before randomisation |
| Blinding of participants and personnel (performance bias) All outcomes | Low risk | Institution provided diet in a masked fashion. |
| Blinding of outcome assessment (detection bias) CVD outcomes | Low risk | Physician knowledge of allocation was assessed and found similar to random. |
| Blinding of outcome assessment (detection bias) All‐cause mortality | Low risk | Blinding is not relevant in assessment of mortality. |
| Incomplete outcome data (attrition bias) All outcomes | Low risk | All followed up via Veterans Admin system |
| Selective reporting (reporting bias) | Low risk | Not relevant for primary and secondary outcomes as all trialists were asked for data |
| Free of systematic difference in care? | Low risk | All ate centre food as usual. See control and intervention methods in the Interventions section of the table of Characteristics of included studies |
| Stated aim to reduce SFA | Low risk | Aim to reduce SFA stated |
| Achieved SFA reduction | Low risk | SFA reduction achieved |
| Achieved TC reduction | High risk | No statistically significant TC fall, though fall was > 0.20 mmol/L |
| Other bias | Low risk | None noted |
WHI 2006.
| Study characteristics | ||
| Methods | RCT Women's Health Initiative (WHI) Summary risk of bias: low |
|
| Participants | Postmenopausal women aged 50 ‐ 79 with or without CVD at baseline (USA)
CVD risk: low in those without CVD at baseline, high in those with CVD
Control without CVD at baseline: randomised 29,294, analysed 29,294
Intervention without CVD at baseline: randomised 19,541, analysed 19,541 Control with CVD at baseline: randomised 1369, analysed 1369 Intervention with CVD at baseline: randomised 908, analysed 908 Mean years in trial: control 8.1, intervention 8.1 % male: 0 Age: mean (both with and without CVD at baseline) int 62.3 (SD 6.9), control 62.3 (SD 6.9) Ethnicity (women both with and without CVD at baseline): white 82%, black 11%, Asian or Pacific Islander 2%, unknown 1%, American Indian or Alaskan native < 1%. No statistically significant effects of the intervention on CHD events was seen for any ethnic subgroup. Statins use allowed? Yes % taking statins: 12% of women recruited were on lipid‐lowering medication (these were a mixture of participants with and without CVD at baseline). |
|
| Interventions | Reduced fat vs usual diet Control: diet‐related education materials Intervention: low‐fat diet (20%E from fat), reduce saturated fat to 7%E with increased fruit and vegetables Control methods: given copy of 'Dietary Guidelines for Americans' Intervention methods: 18 group sessions with trained and certified nutritionists in the 1st year, quarterly maintenance sessions thereafter, focusing on diet and behaviour modification Intervention delivered face‐to‐face in a group by nutritionists Intake data all relate to the full WHI cohort (not divided by whether participants have CVD at baseline or not) Total fat intake, %E (at 6 years): int 28.8 (SD 8.4), cont 37.0 (SD 7.3) (mean difference ‐8.20, 95% CI ‐8.34 to ‐8.06) significant reduction Saturated fat intake, %E (at 6 years): int 9.5 (SD3.2), cont 12.4 (SD3.1) (mean difference ‐2.90, 95% CI ‐2.96 to ‐2.84 for full WHI population) significant reduction PUFA intake, %E (at 6 years)§: int 6.3 (SD?), cont 7.6 (SD?) (mean difference ‐1.30, 95% CI ‐1.72 to ‐0.88 assuming missing SDs were 5) significant reduction PUFA n‐3 intake: not reported PUFA n‐6 intake: not reported MUFA intake, %E (at 6 years)§: int 11.1 (SD?), cont 14.3 (SD?) (mean difference ‐3.20, 95% CI ‐3.62 to ‐2.78 assuming unclear SDs were 5) significant reduction CHO intake, %E (at 6 years)§: int 53.9 (SD?), cont 46.3 (SD?) (mean difference 7.60, 95% CI 5.91 to 9.29 assuming SDs of 20) significant increase Protein intake, %E (at 6 years)§: int 17.7 (SD?), cont 17.0 (SD?) (mean difference 0.70, 95% CI 0.28 to 1.12 assuming SDs of 5) significant increase Trans fat intake, %E (at 6 years)§: int 1.8 (SD?), cont 2.4 (SD?) (mean difference unclear, no SDs assumed) Replacement for saturated fat: mainly carbohydrate, some protein (based on dietary achievement) Style: dietary advice Setting: community §Amongst the 881 intervention and 1373 control participants with blood samples at baseline, with or without CVD at baseline (Howard 2010) |
|
| Outcomes | Stated trial outcomes: breast cancer, mortality, other cancers, cardiovascular events, diabetes Data available on total mortality? yes* Cardiovascular mortality? yes Events available for combined cardiovascular events: CHD, stroke, heart failure, angina, peripheral vascular disease, revascularisation, pulmonary embolism, DVT Secondary outcomes: cancer deaths*, cancer diagnoses*, stroke, non‐fatal MI, diabetes diagnosis* Tertiary outcomes: weight, BMI, total, LDL and HDL cholesterol, TGs, systolic and diastolic BP (Lp(a) and HOMA reported as geometric means) * these are only available for the whole cohort, not split between low and high CVD risk groups |
|
| Notes | Study duration over 8 years Study aim was to reduce total fat to 20%E, reduce saturated fat to 7%E and increase fruit and vegetable intake (Patterson 2003), and saturated fat intake in the intervention group was significantly lower than in control SFA reduction aimed and achieved Total serum cholesterol, difference between intervention and control, mmol/L: ‐0.09 (95% CI ‐0.15 to ‐0.02), statistically significant reduction Trial dates: Recruitment was between 1993 and 1998 Funding: National Heart, Lung and Blood Institute of the National Institutes of Health Declarations of Interest of primary researchers: Declarations varied from paper to paper, but this is a typical one from Beresford 2006 "Dr Black has received research grants from Pfizer and AstraZeneca, was on the speakers bureaus for Pfizer, Novartis, Sanofi‐Aventis, Bristol‐Meyers Squibb, Searle, Pharmacia, and Boehringer and served as a consultant of on an advisory board for Myogen, Merck Sharp and Dohme, Novartis, Mylan‐Bertek, Pfizer, Bristol‐Meyers Squibb, and Sanofi‐Aventis. Dr Howard has served on the advisory boards of Merck, Schering Plough, and the Egg Nutrition Council, has received research support from Merck and Pfizer, and has consulted for General Millls. Dr Assaf is an employee of Pfizer. No other disclosures were reported." |
|
| Risk of bias | ||
| Bias | Authors' judgement | Support for judgement |
| Random sequence generation (selection bias) | Low risk | Computer generated permuted block algorithm stratified by clinical centre and age |
| Allocation concealment (selection bias) | Low risk | Allocations developed by the WHI Clinical Coordinating Center |
| Blinding of participants and personnel (performance bias) All outcomes | High risk | Participants aware of allocation |
| Blinding of outcome assessment (detection bias) CVD outcomes | Low risk | Trained clinic staff, who were responsible for anthropometric assessments and administration of FFQs, were blinded to treatment assignments to the extent practical. The dietary intervention staff did not conduct clinical assessments, and clinic staff were not permitted to participate in any intervention activities; participants were instructed not to discuss nutrition activities with clinic staff. |
| Blinding of outcome assessment (detection bias) All‐cause mortality | Low risk | Blinding not relevant for mortality assessment |
| Incomplete outcome data (attrition bias) All outcomes | Low risk | ITT analysis |
| Selective reporting (reporting bias) | Low risk | Trials register 1999, study completion 2005, but outcomes not stated in trials register. However, outcomes were well published; trialists were asked for data. |
| Free of systematic difference in care? | High risk | Intervention participants received 18 group sessions with behavioural modification plus quarterly maintenance sessions thereafter; control groups received a leaflet. See control and intervention methods in the Interventions section of the table of Characteristics of included studies |
| Stated aim to reduce SFA | Low risk | Aim to reduce SFA stated |
| Achieved SFA reduction | Low risk | SFA reduction achieved |
| Achieved TC reduction | Low risk | Statistically significant TC fall |
| Other bias | Low risk | None noted |
WINS 2006.
| Study characteristics | ||
| Methods | RCT Women's Intervention Nutrition Study (WINS) Summary risk of bias: low |
|
| Participants | Women with localised resected breast cancer (USA)
CVD risk: low Control: 1462 randomised, 1462 analysed Intervention: 975 randomised, 975 analysed Mean years in trial: overall 5.0 % men: 0 Age: control mean 58.5 (95% CI 43.6 to 73.4), intervention mean 58.6 (95% CI 44.4 to 72.8) (all postmenopausal) Ethnicity: 85% white, 5% black, 4% Hispanic, 5% Asian or Pacific Islander, < 1% American Indian or unknown (no outcome data based on ethnicity) Statins use allowed? Not stated (statins not mentioned in inclusion or exclusion criteria within trial protocol) % taking statins: Not reported |
|
| Interventions | Reduced fat intake vs usual diet Control aims: minimal nutritional counselling focused on nutritional adequacy Intervention aims: total fat 15 ‐ 20%E Control methods: 1 baseline dietetic session plus 3‐monthly sessions Intervention methods: 8 bi‐weekly individual dietetic sessions plus 3‐monthly contact and optional monthly group sessions, incorporating individual fat gram goals, social cognitive theory, self‐monitoring, goal‐setting, modelling, social support and relapse prevention and management Intervention was delivered face‐to‐face individually by trained dietitian Total fat intake, %E (at 1 year): int 20.3 (SD 8.1), cont 29.2 (SD 7.4) (mean difference ‐8.90, 95% CI ‐9.53 to ‐8.27) Total fat intake, %E (at 5 years): int 23.2 (SD 8.4) n = 380, cont 31.2 (SD 8.9) n = 648 (mean difference ‐8.00, 95% CI ‐9.09 to ‐6.91) significant reduction Saturated fat intake*, %E (at 1 year): int 6.4 (SD 0.14 [4.4]), cont 9.8 (SD 0.15 [5.7]) (mean difference ‐3.40, 95% CI ‐3.80 to ‐3.00 assuming reported SDs were actually SEs) significant reduction PUFA intake*, %E (at 1 year): int 4.5 (SD 0.09 (2.8)), cont 6.4 (SD 0.10 (3.8)) (mean difference ‐1.90, 95% CI ‐2.16 to ‐1.64) significant reduction PUFA n‐3 intake: not reported by study arm PUFA n‐6 intake: not reported by study arm MUFA intake*, %E (at 1 year): int 7.6 (SD 0.14 (4.4)), cont 11.5 (SD 0.16 (6.1)) (mean difference ‐3.90, 95% CI ‐4.32 to ‐3.48) significant reduction CHO intake, %E (at 6 months): int 60.8 (SD 19.6), cont 50.5 (SD 14.8) (mean difference 10.30, 95% CI 8.85 to 11.75) significant increase Protein intake, %E (at 6 months): int 19.1 (SD 5.2), cont 17.6 (SD 4.1) (mean difference 1.50, 95% CI 1.11 to 1.89) significant increase Trans fat intake: not reported Replacement for saturated fat: CHO and protein (based on dietary achievement) Style: dietary advice Setting: community *SDs appear incorrect, probably SEs? |
|
| Outcomes | Stated trial outcomes: dietary fat intake, total cholesterol, weight and waist measurement Data available on total mortality? yes Cardiovascular mortality? no Events available for combined cardiovascular events: none Secondary outcomes: cancer diagnoses Tertiary outcomes: weight, BMI, total cholesterol |
|
| Notes | Study duration 5 years Study aim was to reduce total fat to 15 ‐ 20%E SFA reduction achieved Total serum cholesterol, difference between intervention and control, mmol/L: ‐0.14 (95% CI ‐0.34 to 0.05), NO statistically significant reduction and reduction < 0.20 Trial dates: Recruitment 1994 to 2001 Funding: National Cancer Institute, Breast Cancer Research Foundation, American Institute for Cancer Research Declarations of Interest of primary researchers: none stated, all authors worked for academic or health institutions except that Njeri Karanja worked for Kaiser Permanente Center for Health Research, Bette Caan for Kaiser Permanente Medical Group, and Barbara L Winters for Campbell's Soup Company. |
|
| Risk of bias | ||
| Bias | Authors' judgement | Support for judgement |
| Random sequence generation (selection bias) | Low risk | Random stratified permuted block design, carried out at the statistical coordinating centre of WINS |
| Allocation concealment (selection bias) | Low risk | Random stratified permuted block design, carried out at the statistical coordinating centre of WINS |
| Blinding of participants and personnel (performance bias) All outcomes | High risk | Not for dietary advice and participants |
| Blinding of outcome assessment (detection bias) CVD outcomes | Low risk | All outcomes assessed by the blinded outcome committee |
| Blinding of outcome assessment (detection bias) All‐cause mortality | Low risk | Outcome assessors blinded |
| Incomplete outcome data (attrition bias) All outcomes | Low risk | All assessed |
| Selective reporting (reporting bias) | Low risk | Not relevant for primary and secondary outcomes as all trialists were asked for data |
| Free of systematic difference in care? | High risk | Differences in attention ‐ more time for those in intervention group. See control and intervention methods in the Interventions section of the table of Characteristics of included studies |
| Stated aim to reduce SFA | High risk | Aim to reduce SFA not stated |
| Achieved SFA reduction | Low risk | SFA reduction achieved |
| Achieved TC reduction | High risk | No statistically significant TC fall |
| Other bias | Low risk | None noted |
%E: percent of total energy intake ATPII: Adult treatment panel II BMI: body mass index (weight in kg/ height in m, squared) BP: blood pressure CABG: coronary artery bypass graft CHD: coronary heart disease CHO: carbohydrate chol: cholesterol CI: confidence interval cont: control group CVD: cardiovascular disease DART: Diet And Reinfarction Trial dBP: diastolic blood pressure DVT: deep vein thrombosis EPA: eicosapentaenoic acid GPs: general practitioners HDL: high density lipoprotein HOMA: homeostatic model assessment int: intervention group ITT: Intention to treat analysis LDL: low density lipoprotein Lp(a): lipoprotein (a) MI: myocardial infarction MRC: Medical Research Council MUFA: monounsaturated fat P/S: polyunsaturated/saturated fat ratio PCTA: percutaneous transluminal coronary angioplasty PUFA: polyunsaturated fat PVD: peripheral vascular disease RCT: randomised controlled trial sBP: systolic blood pressure SD: standard deviation SE: standard error SFA: saturated fats STARS: St Thomas' Atherosclerosis Regression Study TC: total cholesterol TG: triglyceride vs: versus WHI: Women's Health Initiative WINS: Women's Intervention Nutrition Study
Characteristics of excluded studies [ordered by study ID]
| Study | Reason for exclusion |
|---|---|
| Agewall 2001 | Multifactorial intervention |
| Ammerman 2003 | No appropriate control group (and not low fat vs modified fat) |
| Anderson 1990 | Follow‐up less than 24 months |
| Aquilani 2000 | No appropriate control group (and not low fat vs modified fat) |
| Arntzenius 1985 | No appropriate control group (and not low fat vs modified fat) |
| Aro 1990 | Intervention and randomised follow‐up less than 6 months |
| ASSIST 2001 | Intervention was not dietary fat modification or low fat diet. |
| Australian Polyp Prev 95 | Neither mortality nor cardiovascular morbidity data available (only decided after contact with at least 1 author) |
| Azadbakht 2007 | Follow‐up less than 24 months |
| Bakx 1997 | Multifactorial intervention |
| Ball 1965 | Study aim was to assess effects of a low‐fat diet and methods stated that the "nature of the fat consumed was not altered". Saturated fat content of diet was not reported. |
| Barnard 2009 | Weight reduction encouraged in the conventional diet, but not in the vegan diet arm |
| Barndt 1977 | No appropriate control group (and not low fat vs modified fat) |
| Baron 1990 | Multifactorial intervention |
| Barr 1990 | Intervention and randomised follow‐up less than 6 months |
| Barsotti 1991 | Complex paper in Italian; unclear whether cardiovascular events occurred; contact with authors not established |
| Baumann 1982 | Intervention and randomised follow‐up less than 6 months |
| BDIT Pilot Studies 1996 | Study aim was to reduce total fat intake to 15%E with no specific intervention on saturated fat. Saturated fat in intervention group was more than 80% of that in the control group. |
| Beckmann 1995 | Intervention was not dietary fat modification or low‐fat diet. |
| beFIT 1997 | Follow‐up less than 24 months |
| Beresford 1992 | Intervention and randomised follow‐up less than 6 months |
| Bergstrom 1967 | Intervention and randomised follow‐up less than 6 months |
| Bierenbaum 1963 | No appropriate control group (and not low fat vs modified fat) |
| Bloemberg 1991 | Neither mortality nor cardiovascular morbidity data available (only decided after contact with at least 1 author) |
| Bloomgarden 1987 | Multifactorial intervention |
| Bonk 1975 | Trial, unclear if randomised; contact could not be established with trialists |
| Bonnema 1995 | No appropriate control group (and not low fat vs modified fat) |
| Bosaeus 1992 | Intervention and randomised follow‐up less than 6 months |
| Boyd 1988 | Follow‐up less than 24 months |
| BREACPNT | Individual microbiome‐based dietary advice vs Mediterranean diet (no suggestion of saturated fat reduction in either arm) |
| Brehm 2009 | Unclear whether any relevant events occurred, not able to contact trialists |
| Brensike 1982 | No appropriate control group (and not low fat vs modified fat) |
| BRIDGES 2001 | Follow‐up less than 24 months |
| Broekmans 2003 | Intervention was not dietary fat modification or low fat diet. |
| Brown 1984 | No appropriate control group (and not low fat vs modified fat) |
| Bruce 1994 | No appropriate control group (and not low fat vs modified fat) |
| Bruno 1983 | Multifactorial intervention |
| Butcher 1990 | Intervention and randomised follow‐up less than 6 months |
| Byers 1995 | No appropriate control group (and not low fat vs modified fat) |
| Caggiula 1996 | No appropriate control group (and not low fat vs modified fat) |
| Canadian DBCP 1997 | Unable to establish contact with authors to provide data on numbers of deaths and CV events |
| CARMEN 2000 | Follow‐up less than 24 months |
| CARMEN substudy 2002 | Follow‐up less than 24 months |
| Casas‐Agustench 2013 | Less than 24 months duration |
| Cerin 1993 | Intervention and randomised follow‐up less than 6 months |
| Chan 1993 | Intervention and randomised follow‐up less than 6 months |
| Chapman 1950 | Intervention and randomised follow‐up less than 6 months |
| Charbonnier 1975 | Intervention and randomised follow‐up less than 6 months |
| Cheng 2004 | Intervention and randomised follow‐up less than 6 months |
| Chiostri 1988 | Intervention and randomised follow‐up less than 6 months |
| Choudhury 1984 | Intervention and randomised follow‐up less than 6 months |
| Clark 1997 | Multifactorial intervention |
| Clifton 1992 | Intervention and randomised follow‐up less than 6 months |
| Cobb 1991 | Intervention and randomised follow‐up less than 6 months |
| Cohen 1991 | Intervention was not dietary fat modification or low fat diet. |
| Cole 1988 | Intervention and randomised follow‐up less than 6 months |
| Colquhoun 1990 | Intervention and randomised follow‐up less than 6 months |
| Consolazio 1946 | Intervention and randomised follow‐up less than 6 months |
| Cox 1996 | Multifactorial intervention |
| Croft 1986 | Intervention was not dietary fat modification or low fat diet. |
| Curzio 1989 | Follow‐up less than 24 months |
| Da Qing IGT 1997 | Intervention was not dietary fat modification or low‐fat diet. |
| Dalgard 2001 | No appropriate control group (and not low fat vs modified fat) |
| DAS 2000 | No appropriate control group (and not low fat vs modified fat) |
| DASH 1997 | Intervention and randomised follow‐up less than 6 months |
| Davey Smith 2005 | Multifactorial intervention |
| De Boer 1983 | Intervention and randomised follow‐up less than 6 months |
| De Bont 1981 | Neither mortality nor cardiovascular morbidity data available as study data have been lost |
| DeBusk 1994 | Multifactorial intervention |
| DEER 1998 | Duration 1 year only |
| Delahanty 2001 | No appropriate control group (and not low fat vs modified fat) |
| Delius 1969 | Intervention was not dietary fat modification or low fat diet. |
| Demark 1990 | Intervention and randomised follow‐up less than 6 months |
| Dengel 1995 | No appropriate control group (and not low fat vs modified fat) |
| Denke 1994 | Intervention and randomised follow‐up less than 6 months |
| Diabetes CCT 1995 | Intervention was not dietary fat modification or low fat diet. |
| Diet & Hormone Study 2003 | Duration 1 year only |
| DIET 1998 | Multifactorial intervention |
| Ding 1992 | Intervention and randomised follow‐up less than 6 months |
| DIPI 2018 | Less than 24 months duration |
| DIRECT 2009 | Unable to establish contact with authors to establish whether relevant events occurred; multiple publications checked and no relevant outcomes found |
| DO IT 2006 | Intervention aim was for a "mediterranean diet" with total fat 27 ‐ 30%E, protein 15 ‐ 18%E, CHO 50 ‐ 55%E, no specific aim to reduce saturated fat (though polyunsaturated margarine given to intervention group), and intervention group saturated fat was more than 80% of that in the control. |
| Dobs 1991 | No appropriate control group (and not low fat vs modified fat) |
| Due 2008 | Follow‐up less than 24 months |
| Duffield 1982 | Multifactorial intervention |
| Dullaart 1992 | Study authors confirmed that no deaths or cardiovascular events occurred during the study. |
| Eating Patterns 1997 | Neither mortality nor cardiovascular morbidity data available (only decided after contact with at least 1 author) |
| Ehnholm 1982 | Intervention and randomised follow‐up less than 6 months |
| Ehnholm 1984 | Intervention and randomised follow‐up less than 6 months |
| Eisenberg 1990 | Intervention and randomised follow‐up less than 6 months |
| Elder 2000 | No appropriate control group (and not low fat vs modified fat) |
| Ellegard 1991 | Intervention and randomised follow‐up less than 6 months |
| Esposito 2003 | No appropriate control group (and not low fat vs modified fat) |
| Esposito 2004 | Unable to establish contact with authors to assess whether any relevant events occurred |
| EUROACTION 2008 | Multifactorial intervention |
| FARIS 1997 | Multifactorial intervention |
| Fasting HGS 1997 | No appropriate control group (and not low fat vs modified fat) |
| Ferrara 2000 | No appropriate control group (and not low fat vs modified fat) |
| Fielding 1995 | Intervention and randomised follow‐up less than 6 months |
| Finnish Diabet Prev 2000 | Multifactorial intervention |
| Finnish Mental Hosp 1972 | Not randomised (cluster‐randomised, but < 6 clusters) |
| Fisher 1981 | Intervention and randomised follow‐up less than 6 months |
| FIT Heart 2011 | Authors confirmed that differences between intervention and control groups included smoking and physical activity, as well as dietary changes. |
| Fleming 2002 | No appropriate control group (and not low fat vs modified fat) |
| Fortmann 1988 | Intervention was not dietary fat modification or low fat diet. |
| Foster 2003 | Weight reduction in 1 arm but not the other |
| Frenkiel 1986 | Follow‐up less than 24 months |
| FRESH START 2007 | Participants were newly diagnosed with cancer. |
| Gambera 1995 | Intervention and randomised follow‐up less than 6 months |
| Gaullier 2007 | No appropriate control group (and not low fat vs modified fat) |
| Ginsberg 1988 | Intervention and randomised follow‐up less than 6 months |
| Gjone 1972 | Intervention and randomised follow‐up less than 6 months |
| Glatzel 1966 | No appropriate control group (and not low fat vs modified fat) |
| Goodpaster 1999 | No appropriate control group (and not low fat vs modified fat) |
| Grundy 1986 | Intervention and randomised follow‐up less than 6 months |
| Hardcastle 2008 | Multifactorial intervention |
| Harris 1990 | Intervention and randomised follow‐up less than 6 months |
| Hartman 1993 | No appropriate control group (and not low fat vs modified fat) |
| Hartwell 1986 | No appropriate control group (and not low fat vs modified fat) |
| Hashim 1960 | Intervention and randomised follow‐up less than 6 months |
| Haufe 2011 | Aim was to reduce total fat or reduce carbohydrate, but no saturated fat aims were stated, and effects of the diets on saturated fat intakes were unclear. |
| Haynes 1984 | Intervention was not dietary fat modification or low fat diet. |
| Heber 1991 | Intervention and randomised follow‐up less than 6 months |
| Heine 1989 | Neither mortality nor cardiovascular morbidity data available (only decided after contact with at least 1 author) |
| Hellenius 1995 | The study aimed for weight loss in 1 arm and not in the comparison arm. |
| Heller 1993 | Neither mortality nor cardiovascular morbidity data available (only decided after contact with at least 1 author) |
| Hildreth 1951 | No appropriate control group (and not low fat vs modified fat) |
| Holm 1990 | Neither mortality nor cardiovascular morbidity data available (only decided after contact with at least 1 author) |
| Horlick 1957 | Intervention and randomised follow‐up less than 6 months |
| Horlick 1960 | Intervention and randomised follow‐up less than 6 months |
| Howard 1977 | Intervention and randomised follow‐up less than 6 months |
| Hunninghake 1990 | Intervention and randomised follow‐up less than 6 months |
| Hutchison 1983 | No appropriate control group (and not low fat vs modified fat) |
| Hyman 1998 | Neither mortality nor cardiovascular morbidity data available (only decided after contact with at least 1 author) |
| Iacono 1981 | Not randomised; Intervention and randomised follow‐up less than 6 months |
| IMPACT 1995 | Multifactorial intervention |
| Iso 1991 | No appropriate control group (and not low fat vs modified fat) |
| Ives 1993 | Multifactorial intervention |
| Jalkanen 1991 | Multifactorial intervention |
| Jerusalem Nut 1992 | Intervention and randomised follow‐up less than 6 months |
| Jula 1990 | Multifactorial intervention |
| Junker 2001 | Intervention and randomised follow‐up less than 6 months |
| Karmally 1990 | Intervention and randomised follow‐up less than 6 months |
| Karvetti 1992 | Multifactorial intervention |
| Kastarinen 2002 | Multifactorial intervention |
| Kather 1985 | Intervention and randomised follow‐up less than 6 months |
| Katzel 1995 | Intervention was not dietary fat modification or low fat diet. |
| Kawamura 1993 | Intervention and randomised follow‐up less than 6 months |
| Keidar 1988 | Intervention and randomised follow‐up less than 6 months |
| Kempner 1948 | No appropriate control group (and not low fat vs modified fat) |
| Keys 1957a | Intervention and randomised follow‐up less than 6 months |
| Keys 1957b | Intervention and randomised follow‐up less than 6 months |
| Keys 1957c | Intervention and randomised follow‐up less than 6 months |
| Khan 2003 | Neither mortality nor cardiovascular morbidity data available (only decided after contact with at least 1 author) |
| King 2000 | Intervention and randomised follow‐up less than 6 months |
| Kingsbury 1961 | Intervention and randomised follow‐up less than 6 months |
| KNOTA | Numerous publications checked, but no relevant outcome data found. Trialists not contacted. |
| Koopman 1990 | Intervention and randomised follow‐up less than 6 months |
| Koranyi 1963 | Unclear whether randomised, unable to contact authors to discuss |
| Korhonen 2003 | Multifactorial intervention |
| Kriketos 2001 | Intervention and randomised follow‐up less than 6 months |
| Kris 1994 | Intervention and randomised follow‐up less than 6 months |
| Kristal 1997 | Multifactorial intervention |
| Kromhout 1987 | No appropriate control group (and not low fat vs modified fat) |
| Kummel 2008 | Intervention was not dietary fat modification or low‐fat diet. |
| Laitinen 1993 | Multifactorial intervention |
| Laitinen 1994 | Multifactorial intervention |
| Lean 1997 | Follow‐up less than 24 months |
| Leduc 1994 | Multifactorial intervention |
| Lewis 1958 | Intervention and randomised follow‐up less than 6 months |
| Lewis 1981 | Intervention and randomised follow‐up less than 6 months |
| Lewis 1985 | Multifactorial intervention |
| Lichtenstein 2002 | Intervention and randomised follow‐up less than 6 months |
| Lim 2010 | Unable to establish contact with authors to gain access to data on health outcomes (none reported in paper) |
| Linko 1957 | Intervention and randomised follow‐up less than 6 months |
| Lipid Res Clinic 1984 | No appropriate control group (and not low fat vs modified fat) |
| Little 1990 | Intervention and randomised follow‐up less than 6 months |
| Little 2004 | Intervention was not dietary fat modification or low‐fat diet. |
| Lottenberg 1996 | Intervention and randomised follow‐up less than 6 months |
| Luszczynska 2007 | No appropriate control group (and not low fat vs modified fat) |
| Lyon Diet Heart 1994 | Intervention was not dietary fat modification or low‐fat diet. |
| Lysikova 2003 | Intervention and randomised follow‐up less than 6 months |
| Macdonald 1972 | Intervention and randomised follow‐up less than 6 months |
| Mansel 1990 | Intervention was not dietary fat modification or low‐fat diet |
| MARGARIN 2002 | No appropriate control group (and not low fat vs modified fat) |
| Marniemi 1990 | Both intervention groups aimed to lose weight, while the control group did not. |
| Mattson 1985 | Intervention and randomised follow‐up less than 6 months |
| McAuley 2005 | Follow‐up less than 24 months |
| McCarron 1997 | Intervention and randomised follow‐up less than 6 months |
| McCarron 2001 | Intervention was not dietary fat modification or low‐fat diet. |
| McKeown‐Eyssen 1994 | Intervention aim was to reduce total fat and increase dietary fibre (saturated fat not mentioned), and no saturated fat intakes during trial reported. |
| McManus 2001 | Neither mortality nor cardiovascular morbidity data available (only decided after contact with at least 1 author) |
| McNamara 1981 | Intervention and randomised follow‐up less than 6 months |
| Medi‐RIVAGE 2004 | Weight reduction for some low‐fat diet participants (those with BMI > 25) but not in Mediterranean group |
| MeDiet 2002 | Follow‐up less than 24 months |
| MEDINA | Less than 24 months duration |
| Mensink 1987 | Intervention and randomised follow‐up less than 6 months |
| Mensink 1989 | Intervention and randomised follow‐up less than 6 months |
| Mensink 1990a | Intervention and randomised follow‐up less than 6 months |
| Mensink 1990b | Intervention and randomised follow‐up less than 6 months |
| Metroville Health 2003 | Unable to establish contact with authors to assess whether any relevant events occurred |
| Michalsen 2006 | Diet plus stress management vs no intervention |
| Miettinen 1994 | Intervention and randomised follow‐up less than 6 months |
| Millar 1973 | No appropriate control group (and not low fat vs modified fat) |
| Miller 1998 | Intervention and randomised follow‐up less than 6 months |
| Miller 2001 | Neither mortality nor cardiovascular morbidity data available (only decided after contact with at least 1 author) |
| Milne 1994 | No appropriate control group (and not low fat vs modified fat) ‐ the high CHO diet was neither 'usual' or 'low fat' to compare with the modified fat diet. |
| Minnesota Coronary 1989 | Although the study proceeded for over 4 years, participants (patients) came and went and mean follow‐up was only 1 year. |
| Minnesota HHP 1990 | No appropriate control group (and not low fat vs modified fat) |
| Mojonnier 1980 | Unable to establish contact with authors to assess whether any relevant events occurred |
| Mokuno 1988 | Intervention and randomised follow‐up less than 6 months |
| Mortensen 1983 | Intervention and randomised follow‐up less than 6 months |
| Mottalib 2018 | Less than 24 months duration |
| MRFIT substudy 1986 | Intervention and randomised follow‐up less than 6 months |
| MSDELTA 1995 | Intervention and randomised follow‐up less than 6 months |
| MSFAT 1997 | Follow‐up less than 24 months |
| Mujeres Felices 2003 | Diet and breast self‐examination vs no intervention |
| Mutanen 1997 | Intervention and randomised follow‐up less than 6 months |
| Muzio 2007 | Intervention and randomised follow‐up less than 6 months |
| Naglak 2000 | Unable to establish contact with authors to assess whether any relevant events occurred |
| NAS 1987 | Intervention and randomised follow‐up less than 6 months |
| National Diet Heart 1968 | Follow‐up less than 24 months |
| NCEP weight 1991 | Neither mortality nor cardiovascular morbidity data available (only decided after contact with at least 1 author) |
| NCT01954472 | Study withdrawn (not completed) |
| NCT03068078 | Less than 24 months duration |
| Neil 1995 | No appropriate control group (and not low fat vs modified fat) |
| Neverov 1997 | Multifactorial intervention |
| Next Step 1995 | Neither mortality nor cardiovascular morbidity data available (only decided after contact with at least 1 author) |
| Nordoy 1971 | Intervention and randomised follow‐up less than 6 months |
| Norway Veg Oil 1968 | No appropriate control group (and not low fat vs modified fat) |
| Nutri‐AGEs 2015 | Less than 24 months duration |
| Nutrition Breast Health | Follow‐up less than 24 months |
| O'Brien 1976 | Intervention and randomised follow‐up less than 6 months |
| ODES 2006 | The study aimed for weight loss in 1 arm and not in the other arm. |
| Oldroyd 2001 | Multifactorial intervention |
| Ole Study 2002 | Follow‐up less than 24 months |
| OLIVE 1997 | Unable to establish contact with authors to assess whether any relevant events occurred |
| ORIGIN 2008 | Intervention was not dietary fat modification or low‐fat diet. |
| Oslo Study 2004 | Multifactorial intervention |
| Pascale 1995 | Multifactorial intervention |
| PEP 2001 | Multifactorial intervention |
| PHYLLIS 1993 | No appropriate control group (and not low fat vs modified fat) |
| Pilkington 1960 | Neither mortality nor cardiovascular morbidity data available (only decided after contact with at least 1 author) |
| Polyp Prevention 1996 | Intervention aim was to reduce total fat and increase dietary fibre, fruit and vegetables (saturated fat not mentioned), and no saturated fat intakes during trial reported. |
| POUNDS LOST 2009 | All study arms (low or high total fat) prescribed low saturated fat intake (8%E); no usual fat comparator. |
| PREDIMED 2008 | Total fat goals in the low‐fat arm were unclear and authors confirmed that aims were nonspecific (if aims < 30%E, this study would be included). |
| PREMIER 2003 | Follow‐up less than 24 months |
| Pritchard 2002 | The study aimed for weight loss in 1 arm and not in the comparison arm. |
| Puget Sound EP 2000 | Neither mortality nor cardiovascular morbidity data available (only decided after contact with at least 1 author) |
| Rabast 1979 | Intervention and randomised follow‐up less than 6 months |
| Rabkin 1981 | Intervention and randomised follow‐up less than 6 months |
| Radack 1990 | Intervention and randomised follow‐up less than 6 months |
| Rasmussen 1995 | Intervention and randomised follow‐up less than 6 months |
| Reaven 2001 | Intervention and randomised follow‐up less than 6 months |
| Reid 2002 | No appropriate control group (and not low fat vs modified fat) |
| Renaud 1986 | Not randomised |
| Rivellese 1994 | Follow‐up less than 24 months |
| Rivellese 2003 | Intervention and randomised follow‐up less than 6 months |
| Roderick 1997 | Neither mortality nor cardiovascular morbidity data available (only decided after contact with at least 1 author) |
| Roman CHD prev 1986 | Multifactorial intervention |
| Rose 1987 | No appropriate control group (and not low fat vs modified fat) |
| Sarkkinen 1995 | Follow‐up less than 24 months |
| Schaefer 1995a | Intervention and randomised follow‐up less than 6 months |
| Schaefer 1995b | Intervention and randomised follow‐up less than 6 months |
| Schectman 1996 | Multifactorial intervention |
| Schlierf 1995 | Multifactorial intervention |
| Seppanen‐Laakso 1992 | Intervention and randomised follow‐up less than 6 months |
| Seppelt 1996 | Follow‐up less than 24 months |
| Singh 1991 | Multifactorial intervention |
| Singh 1992 | No appropriate control group (and not low fat vs modified fat) |
| Sirtori 1992 | Intervention and randomised follow‐up less than 6 months |
| SLIM 2008 | Multifactorial intervention |
| Sopotsinskaia 1992 | The study aimed for weight loss in 1 arm and not in the comparison arm. |
| Soul Food Light | Less than 24 months duration |
| Stanford NAP 1997 | Intervention and randomised follow‐up less than 6 months |
| Stanford Weight 1994 | The study aimed for weight loss in 1 arm and not in the comparison arm. |
| Starmans 1995 | Intervention and randomised follow‐up less than 6 months |
| Steinbach 1996 | Multifactorial intervention |
| Steptoe 2001 | No appropriate control group (and not low fat vs modified fat) |
| Stevens 2002 | Diet plus breast self examination vs no intervention |
| Stevenson 1988 | No appropriate control group (and not low fat vs modified fat) |
| Strychar 2009 | Follow‐up less than 24 months |
| Sweeney 2004 | Intervention was not dietary fat modification or low fat diet. |
| Søndergaard 2003 | Follow‐up less than 24 months |
| TAIM 1992 | Intervention was not dietary fat modification or low fat diet. |
| Tapsell 2004 | Unable to establish contact with authors to assess whether any relevant events occurred |
| THIS DIET 2008 | All study arms prescribed low saturated fat intake, no usual fat comparator |
| TOHP I 1992 | Multifactorial intervention |
| TONE 1997 | Intervention was not dietary fat modification or low‐fat diet. |
| Toobert 2003 | Multifactorial intervention |
| Towle 1994 | Intervention and randomised follow‐up less than 6 months |
| TRANSFACT 2006 | Intervention and randomised follow‐up less than 6 months |
| Treatwell 1992 | Neither mortality nor cardiovascular morbidity data available (only decided after contact with at least 1 author) |
| Tromsø Heart 1989 | Multifactorial intervention |
| Troyer 2010 | Longest duration only 12 months |
| UK PDS 1996 | No appropriate control group (and not low fat vs modified fat) |
| Urbach 1952 | No appropriate control group (and not low fat vs modified fat) |
| Uusitupa 1993 | Multifactorial intervention |
| VASTKOST 2012 | Publications reported than no participants died or experienced CVD during the trial. |
| Vavrikova 1958 | Intervention and randomised follow‐up less than 6 months |
| Verheiden 2003 | Unable to establish contact with authors to assess whether any relevant events occurred |
| WAHA 2016 | 15%E from walnuts vs usual diet (neither arm aimed to reduce saturated fat intake) |
| Wass 1981 | Intervention and randomised follow‐up less than 6 months |
| Wassertheil 1985 | Intervention was not dietary fat modification or low fat diet. |
| WATCH 1999 | Neither mortality nor cardiovascular morbidity data available (only decided after contact with at least 1 author) |
| Watts 1988 | Intervention and randomised follow‐up less than 6 months |
| Weintraub 1992 | No appropriate control group (and not low fat vs modified fat) |
| Westman 2006 | Intervention was not dietary fat modification or low fat diet. |
| Weststrate 1998 | Intervention and randomised follow‐up less than 6 months |
| WHEL 2007 | Study aimed to reduce total fat, but saturated fat goals were not mentioned, and saturated fat intake in the intervention group was more than 80% of that in the control (81%). |
| WHO primary prev 1979 | Multifactorial intervention |
| WHT 1990 | Neither mortality nor cardiovascular morbidity data available as such data were not collected in the study |
| WHT Feasibility 2003 | Neither mortality nor cardiovascular morbidity data available (only decided after contact with at least 1 author) |
| Wilke 1974 | Intervention and randomised follow‐up less than 6 months |
| Williams 1990 | Intervention was not dietary fat modification or low‐fat diet. |
| Williams 1992 | Intervention was not dietary fat modification or low‐fat diet. |
| Williams 1994 | Intervention was not dietary fat modification or low‐fat diet. |
| Wilmot 1952 | No appropriate control group (and not low fat vs modified fat) |
| Wing 1998 | No appropriate control group (and not low fat vs modified fat) |
| WINS UK 2011 | Stated aim was to reduce total fat by 50%; no saturated fat aims |
| WOMAN 2007 | Lifestyle intervention included exercise and weight as well as diet. |
| Wood 1988 | Intervention was not dietary fat modification or low‐fat diet. |
| Woollard 2003 | Multifactorial intervention including smoking, weight, exercise and alcohol components |
| Working Well 1996 | Multifactorial intervention |
| Zock 1995 | Intervention and randomised follow‐up less than 6 months |
CHO: carbohydrate CV: cardiovascular E: energy vs: versus
Characteristics of studies awaiting classification [ordered by study ID]
ICFAMED.
| Methods | A Mediterranean diet for preventing heart failure and atrial fibrillation in hypertensive patients (ICFAMED) RCT, 24 months |
| Participants | People with hypertension aged 55 to 75 years at high cardiovascular risk, but without existing CVD |
| Interventions | MedDiet: Mediterranean‐style diet, dietary advice (individual and group) every three months LFD: Low‐fat diet according to American Heart Association guidelines, dietary advice (individual and group) every three months |
| Outcomes | Primary: heart failure and/or atrial fibrillation Secondary: echocardiographic variables & BP variables Actual outcomes from abstracts: MedDiet: 5 CVD events (atrial fibrillation (AF) 2; ischaemic heart disease (IHD) 2; stroke 1), LFD: 11 CVD events (AF 6, IHD 2, stroke 3). The crude rate for the occurrence of events per 1000 patient‐months of follow‐up was 197 (95% CI: 06–46) for MedDiet, 451 (95% CI: 3–8.1) for LFD. The HR for patients with MedDiet compared to LFD was 044 (95% CI: 015–126, P > 005). |
| Notes | Trials registration: ISRCTN27497769 Enrollment began in 2012; appears to have completed in 2017; abstract and poster publications only to date Awaiting assessment because: Unclear whether one arm was higher in saturated fat than the other, awaiting fuller publication to assess |
AF: atrial fibrillation CVD: cardiovascular disease HR: hazard ratio ICFAMED: A Mediterranean diet for preventing heart failure and atrial fibrillation in hypertensive patients IHD: Ischaemic heart disease LFD: low fat diet MedDiet: Mediterranean style diet RCT: randomised controlled trial
Characteristics of ongoing studies [ordered by study ID]
ENAbLE due unclear.
| Study name | ENAbLE |
| Methods | RCT, 2 x 2 diet and physical activity interventions, duration unclear |
| Participants | Stroke survivors able to walk independently |
| Interventions | AusMed diet, adaptation of the Mediterranean diet to the Australian context, including provision of starter foods, menu plans and regular counselling Comparator unclear Telehealth‐delivered physical activity and diet interventions in both arms |
| Outcomes | Primary: sBP Secondary: lipid profiles and glycaemic control |
| Starting date | Mid 2019, planned completion date unclear |
| Contact information | Coralie English, University of Western Australia (first author of abstract) |
| Notes | Trial registration not found Unclear whether the intervention was truly lower vs higher saturated fat as saturated fat goals not provided, and duration unclear |
NCT02481466 due 2020.
| Study name | Combined Portfolio diet and Exercise study (PortfolioEx) |
| Methods | RCT, 2 x 2 factorial design with exercise intervention, 36 months |
| Participants | Men and postmenopausal women with BMI up to 40 kg/m2 with measurable arterial thickening |
| Interventions | Lower saturated fat: advice on a therapeutic diet appropriate for hypercholesterolemia (ie < 7% of energy from saturated fat, < 200 mg/d cholesterol) PLUS the combination of viscous fibres, soy protein, plant sterols and nuts, 5% extra monounsaturated fat, and selection of low glycemic index foods Higher saturated fat: advice to follow a DASH‐like diet of whole grains, and low‐fat dairy products with fruits and vegetables Both arms with or without instruction on the Laval exercise program — a standardised physical activity/exercise component supervised by trained kinesiologists (exercise physiologists) |
| Outcomes | Primary: maximum vessel wall volume of the carotid arteries Secondary: composite end point of myocardial infarction, revascularization, cardiovascular hospitalisation, cardiovascular mortality and stroke; atrial fibrillation; BP; and vessel outcomes |
| Starting date | Nov 2016, planned completion Dec 2022 |
| Contact information | PI: David J Jenkins, MD, NutritionProject@smh.ca, Risk Factor Modification Centre, St. Michael's Hospital |
| Notes | Trials registration: NCT02481466 Unclear whether the intervention was truly lower vs higher saturated fat as saturated fat goals not provided for both arms |
NCT02938832 due 2023.
| Study name | Does the advice to eat a mediterranean diet with low carbohydrate intake, compared with a low‐fat diet, reduce diabetes and cardiovascular disease (CardioDiet) |
| Methods | RCT, 36 months |
| Participants | Adults with ischaemic heart disease followed up at cardiac rehabilitation units |
| Interventions | Mediterranean diet with an energy content (E%) from carbohydrates between 25‐30% Traditional low‐fat diet with 45‐60 E% from carbohydrates |
| Outcomes | Primary: diabetes incidence Secondary: CVD disease, quality of life |
| Starting date | Oct 2016, planned completion Oct 2023 |
| Contact information | PI: Fredrik H Nystrom, Professor, MD, University Hospital, Linkoeping, fredrik.nystrom@regionostergotland.se |
| Notes | Trials registration NCT02938832 Unclear whether the intervention was truly lower vs higher saturated fat as saturated fat goals not provided. |
NEW Soul Study due 2022.
| Study name | Nutritious Eating With Soul (NEW Soul) study |
| Methods | RCT, 24 months |
| Participants | African‐American adults aged 18‐65 years with BMI 25‐ 49.9 kg/m2 |
| Interventions | Lower saturated fat: plant‐based vegan diet, instructing participants to favour a diet built around whole grains, fruits, vegetables, and legumes, supplemented by the Oldways African Heritage and Health programme, which includes a food pyramid guide. A Taste of African Heritage (ATAH) six‐lesson nutrition and cooking programme has an online course for health professionals and cooking instructors (all research and restaurant team members will complete this course). Interventions include intervention meetings, physical activity, and podcasts/mailings. Higher saturated fat: low‐fat omnivorous diet, supplemented by the Oldways African Heritage and Health programme, which includes a food pyramid guide. A Taste of African Heritage (ATAH) six‐lesson nutrition and cooking programme has an online course for health professionals and cooking instructors (all research and restaurant team members will complete this course). Interventions include intervention meetings, physical activity, and podcasts/mailings. |
| Outcomes | Primary: CVD events Secondary: CVD risk factors (including LDL & BP), body weight |
| Starting date | May 2018, planned completion June 2022 |
| Contact information | PI: Brie Turner‐McGrievy, Associate Professor, University of South Carolina Trial website: https://newsoul.org/ |
| Notes | Trials registration NCT03354377 Unclear whether the intervention was truly lower vs higher saturated fat as saturated fat goals not provided |
ATAH: A Taste of African Heritage AusMed: Australian style Mediterranean diet BMI: body mass index BP: blood pressure CVD: cardiovascular disease DASH: Dietary Approaches to Stop Hypertension E: energy LDL: low density lipoprotein PorffolioEx: Combined Portfolio diet and Exercise study RCT: randomised controlled trial sBP: systolic blood pressure
Differences between protocol and review
This review is the result of updating the searches for Hooper 2015a. The objective and outcomes have been widened since the protocol to address queries by WHO NUGAG and the inclusion criteria have changed to focus on saturated fat and long‐term trials (24 months instead of six months).
Contributions of authors
All authors were active in the design of the review and in providing critical revisions of the manuscript, all authors took part in assessment of the results of the updated search, and assessment of inclusion of potentially relevant studies. All authors edited, proof‐read and agreed the final version of the review.
LH was the principal author of earlier versions (Hooper 2000; Hooper 2001; Hooper 2012; Hooper 2015a), originated and was primarily responsible for planning and carrying out this systematic review, liaising with WHO NUGAG, carrying out the statistical analyses, and writing the first draft of this review.
AA, OFJ, CK, EF and LH were responsible for data extraction and assessment of validity.
Sources of support
Internal sources
-
University of East Anglia, UK
Help with acquiring papers for previous versions of this review, and allowing time for Lee Hooper to work on the review
-
University of Manchester, UK
Support with collection of papers for the first version of this review
External sources
-
Studentship, Systematic Reviews Training Unit, Institute of Child Health, University of London, UK
Funding to support Lee Hooper to carry out the first version of the systematic review
-
World Health Organization, Other
WHO funded the most recent update of this review
Declarations of interest
Lee Hooper: LH is a member of the World Health Organization Nutrition Guidance Expert Advisory Group (NUGAG). WHO paid for her travel, accommodation and expenses to attend NUGAG meetings in Geneva, China and South Korea where the evidence of effects of dietary fats on health was discussed and guidance developed. LH's institution was given grant funding from WHO to carry out the 2019 update of this systematic review, to update a systematic review on the relationship between total fat intake and body weight and a series of systematic reviews on the health effects of polyunsaturated fatty acids.
Nicole Martin: None known
Asmaa Abdelhamid: None known
Oluseyi Florence Jimoh: This review was funded by a grant from the World Health Organization.
Eve Foster: None known
Christian Kirk: None known
Edited (no change to conclusions)
References
References to studies included in this review
Black 1994 {published and unpublished data}
- Black HS, Herd JA, Goldberg LH, Wolf JE Jr, Thornby JI, Rosen T, et al. Effect of a low-fat diet on the incidence of actinic keratosis. New England Journal of Medicine 1994;330(18):1272-5. [DOI] [PubMed] [Google Scholar]
- Black HS, Thornby JI, Wolf JE Jr, Goldberg LH, Herd JA, Rosen T, et al. Evidence that a low-fat diet reduces the occurrence of non-melanoma skin cancer. International Journal of Cancer 1995;62(2):165-9. [DOI] [PubMed] [Google Scholar]
- Jaax S, Scott LW, Wolf JE Jr, Thornby JI, Black HS. General guidelines for a low-fat diet effective in the management and prevention of nonmelanoma skin cancer. Nutrition and Cancer 1997;27(2):150-6. [DOI] [PubMed] [Google Scholar]
DART 1989 {published and unpublished data}
- Burr ML, Fehily AM, Gilbert JF, Rogers S, Holliday RM, Sweetnam PM, et al. Effects of changes in fat, fish, and fibre intakes on death and myocardial reinfarction: diet and reinfarction trial (DART). Lancet 1989;2(8666):757-61. [DOI] [PubMed] [Google Scholar]
- Burr ML, Fehily AM, Rogers S, Welsby E, King S, Sandham S. Diet and reinfarction trial (DART): design, recruitment, and compliance. European Heart Journal 1989;10(6):558-67. [DOI] [PubMed] [Google Scholar]
- Burr ML, Fehily AM. Fish and the heart. Lancet 1989;ii:1450-2. [PubMed] [Google Scholar]
- Burr ML, Holliday RM, Fehily AM, Whitehead PJ. Haematological prognostic indices after myocardial infarction: evidence from the diet and reinfarction trial (DART). European Heart Journal 1992;13(2):166-70. [DOI] [PubMed] [Google Scholar]
- Burr ML, Sweetham PM, Fehily AM. Diet and reinfarction [letter]. European Heart Journal 1994;15(8):1152-3. [DOI] [PubMed] [Google Scholar]
- Fehily AM, Vaughan-Williams E, Shiels K, Williams AH, Horner M, Bingham G, et al. The effect of dietary advice on nutrient intakes: evidence from the diet and reinfarction trial (DART). Journal of Human Nutrition & Dietetics 1989;2(4):225-5. [Google Scholar]
Houtsmuller 1979 {published data only}
- Houtsmuller AJ, Van Hal-Ferwerda J, Zahn KJ, Henkes HE. Favourable influences of linoleic acid on the progression of diabetic micro- and macroangiopathy. Nutrition and Metabolism 1980;24(Suppl 1):105-18. [DOI] [PubMed] [Google Scholar]
- Houtsmuller AJ, Van Hal-Ferwerda J, Zahn KJ, Henkes HE. Influence of different diets on the progression of diabetic retinopathy. Progress in Food Nutritition and Science 1980;4(5):41-6. [PubMed] [Google Scholar]
- Houtsmuller AJ, Zahn KJ, Henkes HE. Unsaturated fats and progression of diabetic retinopathy. Documenta Ophthalmologia 1979;48(2):363-71. [DOI] [PubMed] [Google Scholar]
Ley 2004 {published and unpublished data}
- Ley SJ, Metcalf PA, Scragg RK, Swinburn BA. Long-term effects of a reduced fat diet intervention on cardiovascular disease risk factors in individuals with glucose intolerance. Diabetes Research and Clinical Practice 2004;63(2):103-12. [DOI] [PubMed] [Google Scholar]
- Swinburn BA, Metcalf PA, Ley SJ. Long-term (5-year) effects of a reduced-fat diet intervention in individuals with glucose intolerance. Diabetes Care 2001;24(4):619-24. [DOI] [PubMed] [Google Scholar]
- Swinburn BA, Woollard GA, Chang EC, Wilson MR. Effects of reduced-fat diets consumed ad libitum on intake of nutrients particularly antioxidant vitamins. Journal of the American Dietetic Association 1999;99(11):1400-5. [DOI] [PubMed] [Google Scholar]
Moy 2001 {published and unpublished data}
- Moy TF, Yanek LR, Raqueno JV, Bezirdjian PJ, Blumenthal RS, Wilder LB, et al. Dietary counseling for high blood cholesterol in families at risk of coronary disease. Preventive Cardiology 2001;4(4):158-64. [DOI] [PubMed] [Google Scholar]
MRC 1968 {published and unpublished data}
- Ederer F, Leren P, Turpeinen O, Frantz ID Jr. Cancer among men on cholesterol lowering diets: experience of five clinical trials. Lancet 1971;2(7717):203-6. [DOI] [PubMed] [Google Scholar]
- Heady JA. Are PUFA harmful? British Medical Journal 1974;1(898):115-6. [DOI] [PMC free article] [PubMed] [Google Scholar]
- MRC. Controlled trial of soya-bean oil in myocardial infarction. Lancet 1968;2(570):693-9. [PubMed] [Google Scholar]
Oslo Diet‐Heart 1966 {published and unpublished data}
- Leren P. Prevention of coronary heart disease, some results from the Oslo secondary and primary intervention studies. Journal of the American College of Nutrition 1989;8(5):407-10. [DOI] [PubMed] [Google Scholar]
- Leren P. The Oslo diet-heart study. Eleven year report. Circulation 1970;42(5):935-42. [DOI] [PubMed] [Google Scholar]
- Leren P. The effect of a cholesterol lowering diet in male survivors of myocardial infarction. A controlled clinical trial) [Virkningen av cholesterolsenkende diett hos menn som har gjennomgatt hjerteinfarkt. Et kontrollert klinisk fors/ok]. Nordisk Medicin 1967;77(21):658-61. [PubMed] [Google Scholar]
- Leren P. The effect of plasma cholesterol lowering diet in male survivors of myocardial infarction. A controlled clinical trial. Acta Medica Scandinavia 1966;466 Suppl:1-92. [PubMed] [Google Scholar]
- Leren P. The effect of plasma-cholesterol-lowering diet in male survivors of myocardial infarction. A controlled clinical trial. Bulletin of the New York Academy of Medicine 1968;44(8):1012-20. [PMC free article] [PubMed] [Google Scholar]
Oxford Retinopathy 1978 {published and unpublished data}
- Coppack SW, Doll HA, Pim B, Hockaday TD. Intravenous glucose tolerance and mortality in non-insulin-dependant diabetes mellitus. Quarterly Journal of Medicine 1990;75(277):451-60. [PubMed] [Google Scholar]
- Hillson RM, Hockaday TD, Mann JI, Newton DJ. Hyperinsulinaemia is associated with development of ECG abnormalities in diabetics. Diabetes Research 1984;1(3):143-9. [PubMed] [Google Scholar]
- Hockaday TD, Hockaday JM, Mann JI, Turner RC. Prospective comparison of modified fat-high-carbohydrate with standard low-carbohydrate dietary advice in the treatment of diabetes: one year follow-up study. British Journal of Nutrition 1978;39(2):357-62. [DOI] [PubMed] [Google Scholar]
- Howard-Williams J, Patel P, Jelfs R, Carter RD, Awdry P, Bron A, et al. Polyunsaturated fatty acids and diabetic retinopathy. British Journal of Ophthalmology 1985;69(1):15-8. [DOI] [PMC free article] [PubMed] [Google Scholar]
- Lopez-Espinoza I, Howard WJ, Mann JI, Carter RD, Hockaday TD. Fatty acid composition of platelet phospholipids in non-insulin-dependent diabetics randomized for dietary advice. British Journal of Nutrition 1984;52(1):41-7. [DOI] [PubMed] [Google Scholar]
Rose corn oil 1965 {published data only}
- Rose GA, Thomson WB, Williams RT. Corn oil in treatment of ischaemic heart disease. British Medical Journal 1965;1(5449):1531-3. [DOI] [PMC free article] [PubMed] [Google Scholar]
Rose olive 1965 {published data only}
- Rose GA, Thomson WB, Williams RT. Corn oil in treatment of ischaemic heart disease. British Medical Journal 1965;1(5449):1531-3. [DOI] [PMC free article] [PubMed] [Google Scholar]
Simon 1997 {published and unpublished data}
- Djuric Z, Heilbrun LK, Reading BA, Boomer A, Valeriote FA, Martino S. Effects of a low fat diet on levels of oxidative damage to DNA in human peripheral nucleated blood cells. Journal of the National Cancer Institute 1991;83(11):766-9. [DOI] [PubMed] [Google Scholar]
- Djuric Z, Martino S, Heilbrun LK, Hart RW. Dietary modulation of oxidative DNA damage. Advances In Experimental Medicine and Biology 1994;354:71-83. [DOI] [PubMed] [Google Scholar]
- Kasim SE, Martino S, Kim P-N, Khilnani S, Boomer A, Depper J, et al. Dietary and anthropometric determinants of plasma lipoproteins during a long-term low-fat diet in healthy women. American Journal of Clinical Nutrition 1993;57(2):146-53. [DOI] [PubMed] [Google Scholar]
- Simon MS, Heilbrun LK, Boomer A, Kresge C, Depper J, Kim PN, et al. A randomised trial of a low-fat dietary intervention in women at high risk for breast cancer. Nutrition and Cancer 1997;27(2):136-42. [DOI] [PubMed] [Google Scholar]
STARS 1992 {published and unpublished data}
- Blann AD, Jackson P, Bath PM, Watts GF. Von Willebrand factor, a possible indicator of endothelial cell damage, decreases during long-term compliance with a lipid-lowering diet. Journal of Internal Medicine 1995;237(6):557-61. [DOI] [PubMed] [Google Scholar]
- Watts GF, Brunt JN, Coltart DJ, Lewis B. The St. Thomas Atherosclerosis Regression Study (STARS). Atherosclerosis 1992;97:231. [Google Scholar]
- Watts GF, Jackson P, Burke V, Lewis B. Dietary fatty acids and progression of coronary artery disease in men. American Journal of Clinical Nutrition 1996;64(2):202-9. [DOI] [PubMed] [Google Scholar]
- Watts GF, Jackson P, Mandalia S, Brunt JN, Lewis ES, Coltart DJ, et al. Nutrient intake and progression of coronary artery disease. American Journal of Cardiology 1994;73(5):328-32. [DOI] [PubMed] [Google Scholar]
- Watts GF, Lewis B, Brunt JN, Lewis ES, Coltart DJ, Smith LD, et al. Effects on coronary artery disease of lipid-lowering diet, or diet plus cholestyramine, in the St Thomas' Atherosclerosis Regression Study (STARS). Lancet 1992;339(8793):563-9. [DOI] [PubMed] [Google Scholar]
- Watts GF, Lewis B, Brunt JNH, Swan AV. Coronary atheroma regression trials. Lancet 1992;339(i):1241-3. [PubMed] [Google Scholar]
- Watts GF, Lewis B, Jackson P, Burke V, Lewis ES, Brunt JN, et al. Relationships between nutrient intake and progression/regression of coronary atherosclerosis as assessed by serial quantitative angiography. Canadian Journal of Cardiology 1995;11(Suppl G):110G-4G. [PubMed] [Google Scholar]
- Watts GF, Mandalia S, Brunt JN, Slavin BM, Coltart DJ, Lewis B. Independent associations between plasma lipoprotein subfraction levels and the course of coronary artery disease in the St. Thomas' Atherosclerosis Regression Study (STARS). Metabolism: Clinical and Experimental 1993;42(11):1461-7. [DOI] [PubMed] [Google Scholar]
- Watts GF, Mandalia S, Slavin BM, Brunt JN, Coltart DJ, Lewis B. Metabolic determinants of the course of coronary artery disease in men. Clinical Chemistry 1994;40(12):2240-6. [PubMed] [Google Scholar]
- Watts GF. Nutritional, metabolic, and genetic determinants of the progression of coronary heart disease. STARS Group. Journal of Cardiovascular Pharmacology 1995;25(Suppl 4):S11-9. [PubMed] [Google Scholar]
Sydney Diet‐Heart 1978 {published and unpublished data}
- Blacket RB, Leelarthaepin B, McGilchrist C, Palmer AJ, Woodhill JM. The synergistic effect of weight loss and changes in dietary lipids on the serum cholesterol of obese men with hypercholesterolaemia: implications for prevention of coronary heart disease. Australian and New Zealand Journal of Medicine 1979;9(5):521-9. [DOI] [PubMed] [Google Scholar]
- Ramsden CE, Zamora D, Leelarthaepin B, Majchrzak-Hong SF, Faurot KR, Suchindran CM, et al. Use of dietary linoleic acid for secondary prevention of coronary heart disease and death: evaluation of recovered data from the Sydney Diet Heart Study and updated meta-analysis. BMJ 2013;346:e8707. [DOI: 10.1136/bmj.e8707] [DOI] [PMC free article] [PubMed] [Google Scholar]
- Woodhill JM, Palmer AJ, Leelarthaepin B, McGilchrist C, Blacket RB. Low fat, low cholesterol diet in secondary prevention of coronary heart disease. Advances in Experimental Medicine and Biology 1978;109:317-30. [DOI] [PubMed] [Google Scholar]
Veterans Admin 1969 {published data only}
- Dayton S, Hashimoto S, Dixon W, Pearce ML. Composition of lipids in human serum and adipose tissue during prolonged feeding of a diet high in unsaturated fat. Journal of Lipid Research 1966;7(1):103-11. [PubMed] [Google Scholar]
- Dayton S, Hashimoto S, Pearce ML. Adipose tissue linoleic acid as a criterion of adherence to a modified diet. Journal of Lipid Research 1967;8(5):508-10. [PubMed] [Google Scholar]
- Dayton S, Hashimoto S, Pearce ML. Influence of a diet high in unsaturated fat upon composition of arterial tissue and atheromata in man. Circulation 1965;32(6):911-24. [DOI] [PubMed] [Google Scholar]
- Dayton S, Hashimoto S, Rosenblum D, Pearce M. Vitamin E status of humans during prolonged feeding of unsaturated fats. Journal of Laboratory and Clinical Medicine 1965;65(5):739-47. [PubMed] [Google Scholar]
- Dayton S, Pearce ML, Goldman H, Harnish A, Plotkin D, Shickman M, et al. Controlled trial of a diet high in unsaturated fat for prevention of atherosclerotic complications. Lancet 1968;2(577):1060-2. [DOI] [PubMed] [Google Scholar]
- Dayton S, Pearce ML, Hashimoto S, Dixon WJ, Tomayasu U. A controlled clinical trial of a diet high in unsaturated fat in preventing complications of atherosclerosis. Circulation 1969;15(1, Suppl 2):II-1-63. [Google Scholar]
- Dayton S, Pearce ML, Hashimoto S, Fakler LJ, Hiscock E, Dixon WJ. A controlled clinical trial of a diet high in unsaturated fat. New England Journal of Medicine 1962;266:1017-23. [DOI] [PubMed] [Google Scholar]
- Dayton S, Pearce ML. Diet and atherosclerosis. Lancet 1970;1(644):473-4. [DOI] [PubMed] [Google Scholar]
- Dayton S, Pearce ML. Diet and cardiovascular diseases. Lancet 1969;1(584):51-2. [DOI] [PubMed] [Google Scholar]
- Dayton S, Pearce ML. Diet high in unsaturated fat: a controlled clinical trial. Minnesota Medicine 1969;52(8):1237-42. [DOI] [PubMed] [Google Scholar]
- Dayton S, Pearce ML. Prevention of coronary heart disease and other complications of atherosclerosis by modified diet. American Journal of Medicine 1969;46(5):751-62. [DOI] [PubMed] [Google Scholar]
- Dayton S, Pearce ML. Trial of unsaturated-fat diet. Lancet 1968;2(581):1296-7. [DOI] [PubMed] [Google Scholar]
- Hiscock E, Dayton S, Pearce ML, Hashimoto S. A palatable diet high in unsaturated fat. Journal of the American Dietetic Association 1962;40:427-31. [PubMed] [Google Scholar]
- Pearce ML, Dayton S. Incidence of cancer in men on a diet high in polyunsaturated fat. Lancet 1971;1(697):464-7. [DOI] [PubMed] [Google Scholar]
- Sturdevant RA, Pearce ML, Dayton S. Increased prevalence of cholelithiasis in men ingesting a serum-cholesterol-lowering diet. New England Journal of Medicine 1973;288(1):24-7. [DOI] [PubMed] [Google Scholar]
- Tompkins MJ, Dayton S, Pearce ML. Effect of long-term feeding of various fats on whole blood clotting times in men. Journal of Laboratory and Clinical Medicine 1964;64(5):763-72. [PubMed] [Google Scholar]
WHI 2006 {published data only}
- Anderson G, Cummings S, Freedman LS, Furberg C, Henderson M, Johnson SR, et al. Design of the Women's Health Initiative clinical trial and observational study. Controlled Clinical Trials 1998;19(1):61-109. [DOI] [PubMed] [Google Scholar]
- Anderson GL, Manson J, Wallace R, Lund B, Hall D, Davis S, et al. Implementation of the Women's Health Initiative study design. Annals of Epidemiology 2003;13(9 Suppl):S5-17. [DOI] [PubMed] [Google Scholar]
- Beresford SA, Johnson KC, Ritenbaugh C, Lasser NL, Snetselaar LG, Black HR, et al. Low-fat dietary pattern and risk of colorectal cancer: the Women's Health Initiative Randomized Controlled Dietary Modification Trial. JAMA 2006;295(6):643-54. [DOI] [PubMed] [Google Scholar]
- Bowen D, Ehret C, Pedersen M, Snetselaar L, Johnson M, Tinker L, et al. Results of an adjunct dietary intervention program in the Women's Health Initiative. Journal of the American Dietetic Association 2002;102(11):1631-7. [DOI] [PubMed] [Google Scholar]
- Carty CL, Kooperberg C, Neuhouser ML, Tinker L, Howard B, Wactawski-Wende J, et al. Low-fat dietary pattern and change in body-composition traits in the Women's Health Initiative Dietary Modification Trial. American Journal of Clinical Nutrition 2011;93(3):516-24. [DOI] [PMC free article] [PubMed] [Google Scholar]
- Curb JD, McTiernan A, Heckbert SR, Kooperberg C, Stanford J, Nevitt M, et al. Outcomes ascertainment and adjudication methods in the Women's Health Initiative. Annals of Epidemiology 2003;13(9 Suppl):S122-8. [DOI] [PubMed] [Google Scholar]
- Hays J, Hunt JR, Hubbell FA, Anderson GL, Limacher M, Allen C, et al. The Women's Health Initiative recruitment methods and results. Annals of Epidemiology 2003;13(9 Suppl):S18-77. [DOI] [PubMed] [Google Scholar]
- Hebert JR, Patterson RE, Gorfine M, Ebbeling CB, St Jeor ST, Chlebowski RT, et al. Differences between estimated caloric requirements and self-reported caloric intake in the Women's Health Initiative. Annals of Epidemiology 2003;13(9):629-37. [DOI] [PubMed] [Google Scholar]
- Howard BV, Curb JD, Eaton CB, Kooperberg C, Ockene J, Kostis JB, et al. Low-fat dietary pattern and lipoprotein risk factors: the Women's Health Initiative dietary modification trial. American Journal of Clinical Nutrition 2010;91(4):860-74. [DOI] [PMC free article] [PubMed] [Google Scholar]
- Howard BV, Manson JE, Stefanick ML, Beresford SA, Frank G, Jones B, et al. Low-fat dietary pattern and weight change over 7 years: the Women's Health Initiative Dietary Modification Trial. JAMA 2006;295(1):39-49. [DOI] [PubMed] [Google Scholar]
- Howard BV, Van Horn L, Hsia J, Manson JE, Stefanick ML, Wassertheil-Smoller S, et al. Low-fat dietary pattern and risk of cardiovascular disease: the Women's Health Initiative Randomized Controlled Dietary Modification Trial. JAMA 2006;295(6):655-66. [DOI] [PubMed] [Google Scholar]
- Howard BV. Dietary fat and cardiovascular disease: putting the Women's Health Initiative in perspective. Nutrition Metabolism & Cardiovascular Diseases 2007;17(3):171-4. [DOI] [PubMed] [Google Scholar]
- Neuhouser ML, Tinker L, Shaw PA, Schoeller D, Bingham SA, Horn LV, et al. Use of recovery biomarkers to calibrate nutrient consumption self-reports in the Women's Health Initiative. American Journal of Epidemiology 2008;167(10):1247-59. [DOI] [PubMed] [Google Scholar]
- Patterson RE, Kristal A, Rodabough R, Caan B, Lillington L, Mossavar-Rahmani Y, et al. Changes in food sources of dietary fat in response to an intensive low-fat dietary intervention: early results from the Women's Health Initiative. Journal of the American Dietetic Association 2003;103(4):454-60. [DOI] [PubMed] [Google Scholar]
- Patterson RE, Kristal AR, Tinker LF, Carter RA, Bolton MP, Gurs-Collins T, et al. Measurement characteristics of the Women's Health Initiative food frequency questionnaire. Annals of Epidemiology 1999;9(3):178-87. [DOI] [PubMed] [Google Scholar]
- Prentice RL, Aragaki AK, Howard BV, Chlebowski RT, Thomson CA, Van Horn L, et al. Low-fat dietary pattern among postmenopausal women influences long-term cancer, cardiovascular disease, and diabetes outcomes. Journal of Nutrition 2019;149(9):1565-74. [DOI] [PMC free article] [PubMed] [Google Scholar]
- Prentice RL, Aragaki AK, Van Horn L, Thomson CA, Beresford SAA, Robinson J, et al. Low-fat dietary pattern and cardiovascular disease: results from the Women’s Health Initiative randomized controlled trial. American Journal of Clinical Nutrition 2017;106(1):35-43. [DOI] [PMC free article] [PubMed] [Google Scholar]
- Prentice RL, Caan B, Chlebowski RT, Patterson R, Kuller LH, Ockene JK, et al. Low-fat dietary pattern and risk of invasive breast cancer: the Women's Health Initiative Randomized Controlled Dietary Modification Trial. JAMA 2006;295(6):629-42. [DOI] [PubMed] [Google Scholar]
- Prentice RL, Thomson CA, Caan B, Hubbell FA, Anderson GL, Beresford SA, et al. Low-fat dietary pattern and cancer incidence in the Women's Health Initiative Dietary Modification Randomized Controlled Trial. Journal of the National Cancer Institute 2007;99(20):1534-43. [DOI] [PMC free article] [PubMed] [Google Scholar]
- Ritenbaugh C, Patterson RE, Chlebowski RT, Caan B, Fels-Tinker L, Howard B, et al. The Women's Health Initiative Dietary Modification trial: overview and baseline characteristics of participants. Annals of Epidemiology 2003;13(9 Suppl):S87-97. [DOI] [PubMed] [Google Scholar]
- Robinson JG, Wallace R, Safford MM, Pettinger M, Cochrane B, Ko MG, et al. Another treatment gap: restarting secondary prevention medications: the Women's Health Initiative. Journal of Clinical Lipidology 2010;4(1):36-45. [DOI] [PMC free article] [PubMed] [Google Scholar]
- Rossouw JE, Finnegan LP, Harlan WR, Pinn VW, Clifford C, McGowan JA. The evolution of the Women's Health Initiative: perspectives from the NIH. Journal of the American Medical Women's Association 1995;50(2):50-5. [PubMed] [Google Scholar]
- The Women's Health Initiative Study Group. Design of the Women's Health Initiative clinical trial and observational study. Controlled Clinical Trials 1998;19(1):61-109. [DOI] [PubMed] [Google Scholar]
- Tinker LF, Bonds DE, Margolis KL, Manson JE, Howard BV, Larson J, et al. Low-fat dietary pattern and risk of treated diabetes mellitus in postmenopausal women: the Women's Health Initiative randomized controlled dietary modification trial. Archives of Internal Medicine 2008;168(14):1500-11. [DOI] [PubMed] [Google Scholar]
- Tinker LF, Perri MG, Patterson RE, Bowen DJ, McIntosh M, Parker LM, et al. The effects of physical and emotional status on adherence to a low-fat dietary pattern in the Women's Health Initiative. Journal of the American Dietetic Association 2002;102(6):789-800. [DOI] [PubMed] [Google Scholar]
- Tinker LF, Rosal MC, Young AF, Perri MG, Patterson RE, Van Horn L, et al. Predictors of dietary change and maintenance in the Women's Health Initiative Dietary Modification Trial. Journal of the American Dietetic Association 2007;107(7):1155-66. [DOI] [PubMed] [Google Scholar]
- Women's Health Initiative Study Group. Dietary adherence in the Women's Health Initiative Dietary Modification Trial. Journal of the American Dietetic Association 2004;104(4):654-8. [DOI] [PubMed] [Google Scholar]
WINS 2006 {published and unpublished data}
- Chlebowski RT, Blackburn GL, Buzzard IM, Rose DP, Martino S, Khandekar JD, et al. Adherence to a dietary fat intake reduction program in postmenopausal women receiving therapy for early breast cancer. The Women's Intervention Nutrition Study. Journal of Clinical Oncology 1993;11(11):2072-80. [DOI] [PubMed] [Google Scholar]
- Chlebowski RT, Blackburn GL, Thomson CA, Nixon DW, Shapiro A, Hoy MK, et al. Dietary fat reduction and breast cancer outcome: interim efficacy results from the Women's Intervention Nutrition study. Journal of the National Cancer Institute 2006;98(24):1767-76. [DOI] [PubMed] [Google Scholar]
- Chlebowski RT, Blackburn GL. Final survival analysis from the randomized Womens Intervention Nutrition Study (WINS) evaluating dietary intervention as adjuvant breast cancer therapy. Cancer Research 2015;75(9 Supplement):S5-08. [Google Scholar]
- Chlebowski RT, Rose D, Blackburn G, Buzzard M, Khandekar J, York R, et al. Feasibility of using dietary fat intake reduction in adjuvant breast cancer management. Proceedings of American Society of Clinical Oncology 1991;86:86. [Google Scholar]
- Chlebowski RT, Rose DP, Buzzard IM, Blackburn GL, York M, Insull W Jr, et al. Dietary fat reduction in adjuvant breast cancer therapy: current rationale and feasibility issues. Adjuvant: the Cancer Journal 1990;6:357-63. [Google Scholar]
- Hoy MK, Winters BL, Chlebowski RT, Papoutsakis C, Shapiro A, Lubin MP, et al. Implementing a low-fat eating plan in the Women's Intervention Nutrition Study. Journal of the American Dietetic Association 2009;109(4):688-96. [DOI] [PMC free article] [PubMed] [Google Scholar]
- Rose DP, Chlebowski RT, Connolly JM, Jones LA, Wynder EL. Effects of tamoxifen adjuvant therapy and a low-fat diet on serum binding proteins and estradiol bioavailability in postmenopausal breast cancer patients. Cancer Research 1992;52(19):5386-90. [PubMed] [Google Scholar]
- Rose DP, Connolly JM, Chlebowski RT, Buzzard IM, Wynder EL. The effects of a low-fat dietary intervention and tamoxifen adjuvant therapy on the serum estrogen and sex hormone-binding globulin concentrations of postmenopausal breast cancer patients. Breast Cancer Research & Treatment 1993;27(3):253-62. [DOI] [PubMed] [Google Scholar]
- Wynder EL, Cohen LA, Winters BL. The challenges of assessing fat intake in cancer research investigations. Journal of the American Dietetic Association 1997;97(7 Suppl):S5-8. [DOI] [PubMed] [Google Scholar]
References to studies excluded from this review
Agewall 2001 {published data only}
- Agewall S. Multiple risk intervention trial in high risk hypertensive men: comparison of ultrasound intima-media thickness and clinical outcome during 6 years of follow-up. Journal of Internal Medicine 2001;249(4):305-14. [DOI] [PubMed] [Google Scholar]
Ammerman 2003 {published data only}
- Ammerman AS, Keyserling TC, Atwood JR, Hosking JD, Zayed H, Krasny C. A randomized controlled trial of a public health nurse directed treatment program for rural patients with high blood cholesterol. Preventive Medicine 2003;36(3):340-51. [DOI] [PubMed] [Google Scholar]
Anderson 1990 {published and unpublished data}
- Anderson JW, Garrity TF, Smith BM, Whitis SE. Follow-up on a clinical trial comparing the effects of two lipid lowering diets. Arteriosclerosis 1990;10(5):882a. [Google Scholar]
- Anderson JW, Garrity TF, Wood CL, Whitis SE, Smith BM, Oeltgen PR. Prospective, randomized, controlled comparison of the effects of low-fat and low-fat plus high-fiber diets on serum lipid concentrations. American Journal of Clinical Nutrition 1992;56(5):887-94. [DOI] [PubMed] [Google Scholar]
Aquilani 2000 {published data only}
- Aquilani R, Tramarin R, Pedretti RF, Bertolotti G, Sommaruga M, Mariani P, et al. Can a very-low-fat diet achieve cholesterol goals in CAD? Cardiology Review 2000;17(10):36-40. [Google Scholar]
Arntzenius 1985 {published data only}
- Arntzenius AC, Kromhout D, Barth JD, Reiber JH, Bruschke AV, Buis B, et al. Diet, lipoprotiens and progression of coronary atherosclerosis: the Leiden Intervention Trial. New England Journal of Medicine 1985;312(13):805-8. [DOI] [PubMed] [Google Scholar]
Aro 1990 {published data only}
- Aro A, Ahola I, Jauhiainen M, Mutanen M, Valsta LM. Effects of plasma phospholipid fatty acids of rapeseed oil and sunflower oil diets [Abstract]. Arteriosclerosis 1990;10:877a. [Google Scholar]
ASSIST 2001 {published data only}
- Moher M, Yudkin P, Wright L, Turner R, Fuller A, Schofield T, et al. Cluster randomised controlled trial to compare three methods of promoting secondary prevention of coronary heart disease in primary care. BMJ 2001;322(7298):1338. [DOI] [PMC free article] [PubMed] [Google Scholar]
Australian Polyp Prev 95 {published and unpublished data}
- MacLennan R, Macrae F, Bain C, Battistutta D, Chapuis P, Gratten H, et al. Randomized trial of intake of fat, fiber, and beta carotene to prevent colorectal adenomas. The Australian Polyp Prevention Project. Journal of the National Cancer Institute 1995;87(23):1760-6. [DOI] [PubMed] [Google Scholar]
- MacLennan R. Effect of fat, fibre and beta-carotene on colorectal adenomas after 24 months. Gastroenterology 1991;100:A382. [Google Scholar]
- Macrae FA, Hughes NR, Bhathal PS, Tay D, Selbie L, MacLennan R. Dietary suppression of rectal epthelial cell proliferation. Gastroenterology 1991;100:A383. [Google Scholar]
Azadbakht 2007 {published and unpublished data}
- Azadbakht L, Mirmiran P, Esmaillzadeh A, Azizi F. Better dietary adherence and weight maintenance achieved by a long-term moderate fat diet. British Journal of Nutrition 2007;97(2):399-404. [DOI] [PubMed] [Google Scholar]
Bakx 1997 {published data only}
- Bakx JC, Stafleu A, Van Staveren WA, Van den Hoogen HJ, Van Weel C. Long-term effect of nutritional counseling: a study in family medicine. American Journal of Clinical Nutrition 1997;65(6 Suppl):1946S-50S. [DOI] [PubMed] [Google Scholar]
Ball 1965 {published data only}
- Ball KP, Hanington E, McAllen PM, Pilkington TR, Richards JM, Sharland DE, et al. Low-fat diet in myocardial infarction: a controlled trial. Lancet 1965;2(411):501-4. [PubMed] [Google Scholar]
Barnard 2009 {published data only}
- Barnard ND, Cohen J, Jenkins DJ, Turner-McGrievy G, Gloede L, Green A, et al. A low-fat vegan diet and a conventional diabetes diet in the treatment of type 2 diabetes: a randomized, controlled, 74-wk clinical trial. American Journal of Clinical Nutrition 2009;89(5):1588S-96S. [DOI] [PMC free article] [PubMed] [Google Scholar]
Barndt 1977 {published data only}
- Barndt R, Blankenhorn CH, Crawford DW, Brooks SH. Regression and progression of early femoral atherosclerosis in treated hyperlipidaemic patients. Annals of Internal Medicine 1977;86(2):139-46. [DOI] [PubMed] [Google Scholar]
Baron 1990 {published data only}
- Baron JA, Gleason R, Crowe B, Mann JI. Preliminary trial of the effect of general practice based nutritional advice. British Journal of General Practice 1990;40(333):137-41. [PMC free article] [PubMed] [Google Scholar]
Barr 1990 {published data only}
- Barr SL, Ramakrishnan R, Holleran S. A 30% fat diet high in polyunsaturates and a 30% fat diet high in monounsaturates both lower total and low density lipoprotein cholesterol levels in normal males [Abstract]. Arteriosclerosis 1990;10:872a. [Google Scholar]
Barsotti 1991 {published data only}
- Barsotti A. Modern trends in the therapy of arteriosclerosis in the light of new physiopathological findings [Moderne tendenze della terapia dell'arteriosclerosi alla luce delle nuove acquisizioni fisiopatologiche]. Cardiologia 1991;36(12 Suppl 1):33-48. [PubMed] [Google Scholar]
Baumann 1982 {published data only}
- Baumann J, Martschick R. Therapy of hyperlipidemia with xanthinol nicotinate as opposed to low fat diet [Therapie der hyperlipidämie mit xantinolnicotinat gegenüber fettarmer diät]. Die Medizinische Welt 1982;33(4):139-41. [PubMed] [Google Scholar]
BDIT Pilot Studies 1996 {published and unpublished data}
- Boyd NF, Cousins M, Beaton M, Fishell E, Wright B, Fish E, et al. Clinical trial of low-fat, high-carbohydrate diet in subjects with mammographic dysplasia: report of early outcomes. Journal of the National Cancer Institute 1988;80(15):1244-8. [DOI] [PubMed] [Google Scholar]
- Boyd NF, Cousins M, Beaton M, Han L, McGuire V. Methodological issues in clinical trials of dietary fat reduction in patients with breast dysplasia. Progress in Clinical and Biological Research 1986;222:117-24. [PubMed] [Google Scholar]
- Boyd NF, Cousins M, Beaton M, Kriukov V, Lockwood G, Tritchler D. Quantitative changes in dietary fat intake and serum cholesterol in women: results from a randomized, controlled trial. American Journal of Clinical Nutrition 1990;52(3):470-6. [DOI] [PubMed] [Google Scholar]
- Boyd NF, Cousins M, Kriukov V. A randomised controlled trial of dietary fat reduction: the retention of subjects and characteristics of drop outs. Journal of Clinical Epidemiology 1992;45(1):31-8. [DOI] [PubMed] [Google Scholar]
- Boyd NF, Cousins M, Lockwood G, Tritchler D. Dietary fat and breast cancer risk: the feasibility of a clinical trial of breast cancer prevention. Lipids 1992;27(10):821-6. [DOI] [PubMed] [Google Scholar]
- Boyd NF, Cousins M, Lockwood G, Tritchler D. The feasibility of testing experimentally the dietary fat-breast cancer hypothesis. Progress in Clinical and Biological Research 1990;346:231-41. [PubMed] [Google Scholar]
- Boyd NF, Martin LJ, Beaton M, Cousins M, Kriukov V. Long-term effects of participation in a randomized trial of a low-fat, high-carbohydrate diet. Cancer Epidemiology, Biomarkers & Prevention 1996;5(3):217-22. [PubMed] [Google Scholar]
- Lee-Han H, Cousins M, Beaton M, McGuire V, Kriukov V, Chipman M, et al. Compliance in a randomized clinical trial of dietary fat reduction in patients with breast dysplasia. American Journal of Clinical Nutrition 1988;48(3):575-86. [DOI] [PubMed] [Google Scholar]
Beckmann 1995 {published data only}
- Beckmann SL, Os I, Kjeldsen SE, Eide IK, Westheim AS, Hjermann I. Effect of dietary counselling on blood pressure and arterial plasma catecholamines in primary hypertension. American Journal of Hypertension 1995;8(7):704-11. [DOI] [PubMed] [Google Scholar]
beFIT 1997 {published and unpublished data}
- Retzlaff BM, Walden CE, McNeney WB, Buck BL, McCann BS, Knopp RH. Nutritional intake of women and men on the NCEP Step I and Step II diets. Journal of the American College of Nutrition 1997;16(1):52-61. [DOI] [PubMed] [Google Scholar]
- Walden CE, Retzlaff BM, Buck BL, McCann BS, Knopp RH. Lipoprotein lipid response to the National Cholesterol Education Program Step II diet by hypercholesterolemic and combined hyperlipidemic women and men. Arteriosclerosis, Thrombosis and Vascular Biology 1997;17(2):375-82. [DOI] [PubMed] [Google Scholar]
- Walden CE, Retzlaff BM, Buck BL, Wallick S, McCann BS, Knopp RH. Differential effect of National Cholesterol Education Program (NCEP) Step II Diet on HDL cholesterol, its subfractions, and apoprotein A-1 levels in hypercholesterolemic women and men after 1 year: the beFIT study. Arteriosclerosis, Thrombosis and Vascular Biology 2000;20(6):1580-7. [DOI] [PubMed] [Google Scholar]
Beresford 1992 {published data only}
- Beresford SA, Farmer EM, Feingold L, Graves KL, Sumner SK, Baker RM. Evaluation of a self-help dietary intervention in a primary care setting. American Journal of Public Health 1992;82(1):79-84. [DOI] [PMC free article] [PubMed] [Google Scholar]
Bergstrom 1967 {published data only}
- Bergstrom G, Svanborg A. Dietary treatment of acute myocardial infarction. Acta Medica Scandinavica 1967;181(6):717-21. [DOI] [PubMed] [Google Scholar]
Bierenbaum 1963 {published data only}
- Bierenbaum ML, Fleischman AI, Raichelson RI, Hayton T, Watson P. Ten year experience of modified fat diets on younger men with coronary heart disease. Lancet 1973;1(7817):1404-7. [DOI] [PubMed] [Google Scholar]
- Bierenbaum ML, Green DP, Florin A, Fleischman AI, Caldwell AB. Modified-fat dietary management of the young male with coronary disease. A five-year report. JAMA 1967;202(13):1119-23. [PubMed] [Google Scholar]
- Bierenbaum ML, Green DP, Gherman C, Florin A, Caldwell AB. The effects of two low fat dietary patterns on the blood cholesterol levels of young male coronary patients. Journal of Chronic Diseases 1963;16:1073-83. [DOI] [PubMed] [Google Scholar]
Bloemberg 1991 {published and unpublished data}
- Bloemberg BP, Kromhout D, Goddijn HE, Jansen A, Obermann-de Boer GL. The impact for the guidelines for a healthy diet of the Netherlands Nutrition Council on total and high density lipoprotein cholesterol in hypercholesterolemic free living men. American Journal of Epidemiology 1991;134(1):39-48. [DOI] [PubMed] [Google Scholar]
Bloomgarden 1987 {published data only}
- Bloomgarden ZT, Karmally W, Metzger MJ, Brothers M, Nechemias C, Bookman J, et al. Randomized, controlled trial of diabetic patient education: improved knowledge without improved metabolic status. Diabetes Care 1987;10(3):263-72. [DOI] [PubMed] [Google Scholar]
Bonk 1975 {published data only}
- Bonk S, Hubotter E, Nickel C, Stocksmeier U, Vahey P, Volk I, et al. Myocardial infarct patients with and without intensive nutrition consultation over several years-- comparison of physiological and social variables [Herzinfarktpatienten mit und ohne mehrjährige intensive ernährungsberatung - vergleich von physiologischen und sozialen variablen]. Infusionstherapie und Klinische Ernährung 1975;2(4):290-6. [PubMed] [Google Scholar]
Bonnema 1995 {published data only}
- Bonnema SJ, Jespersen LT, Marving J, Gregersen G. Supplementation with olive oil rather than fish oil increases small arterial compliance in diabetic patients. Diabetes, Nutrition and Metabolism Clinical and Experimental 1995;8:81-7. [Google Scholar]
Bosaeus 1992 {published data only}
- Bosaeus I, Belfrage L, Lindgren C, Andersson H. Olive oil instead of butter increases net cholesterol excretion from the small bowel. European Journal of Clinical Nutrition 1992;46(2):111-5. [PubMed] [Google Scholar]
Boyd 1988 {published and unpublished data}
- Boyd NF, McGuire V, Shannon P, Cousins M, Kriukov V, Mahoney L, et al. Effect of a low-fat high-carbohydrate diet on symptoms of cyclical mastopathy. Lancet 1988;2(8603):128-32. [DOI] [PubMed] [Google Scholar]
BREACPNT {published data only}
- NCT04079270. The breast cancer personalized nutrition study (BREACPNT). clinicaltrials.gov/ct2/show/NCT04079270 (first posted 5 September 2019).
Brehm 2009 {published data only (unpublished sought but not used)}
- Brehm BJ, Lattin BL, Summer SS, Boback JA, Gilchrist GM, Jandacek RJ, et al. One-year comparison of a high-monounsaturated fat diet with a high-carbohydrate diet in type 2 diabetes. Diabetes Care 2009;32(2):215-20. [DOI] [PMC free article] [PubMed] [Google Scholar]
Brensike 1982 {published data only}
- Brensike JF, Kelsey SF, Passamani ER, Fisher MR, Richardson JM, Loh IK, et al. National Heart, Lung, and Blood Institute type II Coronary Intervention Study: design, methods, and baseline characteristics. Controlled Clinical Trials 1982;3(2):91-111. [DOI] [PubMed] [Google Scholar]
BRIDGES 2001 {published and unpublished data}
- Hebert JR, Ebbeling CB, Olendzki BC, Hurley TG, Ma Y, Saal N, et al. Change in women's diet and body mass following intensive intervention for early-stage breast cancer. Journal of the American Dietetic Association 2001;101(4):421-31. [DOI] [PubMed] [Google Scholar]
Broekmans 2003 {published and unpublished data}
- Broekmans WM, Klöpping-Ketelaars IA, Weststrate JA, Tijburg LB, Van Poppel G, Vink AA, et al. Decreased carotenoid concentrations due to dietary sucrose polyesters do not affect possible markers of disease risk in humans. Journal of Nutrition 2003;133(3):720-6. [DOI] [PubMed] [Google Scholar]
Brown 1984 {published data only}
- Brown GD, Whyte L, Gee MI, Crockford PM, Grace M, Oberle K, et al. Effects of two "lipid-lowering" diets on plasma lipid levels of patients with peripheral vascular disease. Journal of the American Dietetic Association 1984;84(5):546-50. [PubMed] [Google Scholar]
Bruce 1994 {published data only}
- Bruce SL, Grove SK. The effect of a coronary artery risk evaluation program on serum lipid values and cardiovascular risk levels. Applied Nursing Research 1994;7(2):67-74. [DOI] [PubMed] [Google Scholar]
Bruno 1983 {published data only}
- Bruno R, Arnold C, Jacobson L, Winick M, Wynder E. Randomized controlled trial of a nonpharmacologic cholesterol reduction program at the worksite. Preventive Medicine 1983;12(4):523-32. [DOI] [PubMed] [Google Scholar]
Butcher 1990 {published data only}
- Butcher LA, O'Dea K, Sinclair AJ, Parkin JD, Smith IL, Blombery P. The effects of very low fat diets enriched with fish or kangaroo meat on cold-induced vasoconstriction and platelet function. Prostaglandins, Leukotrienes, and Essential Fatty Acids 1990;39(3):221-6. [DOI] [PubMed] [Google Scholar]
Byers 1995 {published data only}
- Byers T, Mullis R, Anderson J, Dusenbury L, Gorsky R, Kimber C, et al. The costs and effects of a nutritional education program following work-site cholesterol screening. American Journal of Public Health 1995;85(5):650-5. [DOI] [PMC free article] [PubMed] [Google Scholar]
Caggiula 1996 {published data only}
- Caggiula AW, Watson JE, Kuller LH, Olson MB, Milas NC, Berry M, et al. Cholesterol-lowering intervention program. Effect of the step I diet in community office practices. Archives of Internal Medicine 1996;156(11):1205-13. [DOI] [PubMed] [Google Scholar]
Canadian DBCP 1997 {published data only (unpublished sought but not used)}
- Boyd NF, Greenberg C, Lockwood G, Little L, Martin L, Byng J, et al. Effects at two years of a low-fat, high-carbohydrate diet on radiologic features of the breast: results from a randomized trial. Journal of the Nationl Cancer Institute 1997;89(7):488-96. [DOI] [PubMed] [Google Scholar]
CARMEN 2000 {published and unpublished data}
- Poppitt SD, Keogh GF, Prentice AM, Williams DE, Sonnemans HM, Valk EE, et al. Long-term effects of ad libitum low-fat, high-carbohydrate diets on body weight and serum lipids in overweight subjects with metabolic syndrome. American Journal of Clinical Nutrition 2002;75(1):11-20. [DOI] [PubMed] [Google Scholar]
- Raben A, Astrup A, Vasilaras TH, Prentice AM, Zunft H-JF, Formiguera X, et al. The CARMEN study [CARMEN-studiet]. Ugeskrift für Laeger 2002;164(5):627-31. [PubMed] [Google Scholar]
- Saris WH, Astrup A, Prentice AM, Zunft HJ, Formiguera X, Verboeket-van de Venne WP, et al. Randomized controlled trial of changes in dietary carbohydrate/fat ratio and simple vs complex carbohydrates on body weight and blood lipids: the CARMEN study. International Journal of Obesity 2000;24(10):1310-8. [DOI] [PubMed] [Google Scholar]
- Saris WH, Astrup A, Prentice AM, Zunft HJ, Formiguera X. CARMEN Project: European multicentre study on the impact of dietary fat/CHO ratio and simple/complex CHO changes on long term weight control in overweight subjects. International Journal of Obesity 1997;21(Suppl 2):S71. [Google Scholar]
- Vasilaras TH, Astrup A, Raben A. Micronutrient intake in overweight subjects is not deficient on an ad libitum fat-reduced, high-simple carbohydrate diet. European Journal of Clinical Nutrition 2004;58(2):326-36. [DOI] [PubMed] [Google Scholar]
CARMEN substudy 2002 {published and unpublished data}
- Poppitt SD, Keogh GF, Prentice AM, Williams DEM, Sonnemans HMW, Valk EEJ, et al. Long-term effects of ad libitum low-fat, high-carbohydrate diets on body weight and serum lipids in overweight subjects with metabolic syndrome. American Journal of Clinical Nutrition 2002;75(1):11-20. [DOI] [PubMed] [Google Scholar]
Casas‐Agustench 2013 {published data only}
- Casas-Agustench P, Molina S, Espinosa-Salinas I, Olivares M, Reglero G, Ordovás JM, et al. SELP variant modulates plasma HDL-C responses in subjects with moderate cardiovascular risk after skimmed milk consumption. FASEB Journal 2013;27(1 suppl):640.21. [Google Scholar]
- Loria-Kohen V, Espinosa-Salinas I, Ramirez de Molina A, Casas-Agustench P, Herranz J, Molina S, et al. A genetic variant of PPARA modulates cardiovascular risk biomarkers after milk consumption. Nutrition 2014;30(10):1144-50. [DOI] [PubMed] [Google Scholar]
Cerin 1993 {published data only}
- Cerin A, Collins A, Landgren BM, Eneroth P. Hormonal and biochemical profiles of premenstrual syndrome. Treatment with essential fatty acids. Acta Obstetricia et Gynecologica Scandinavica 1993;72(5):337-43. [DOI] [PubMed] [Google Scholar]
Chan 1993 {published data only}
- Chan JK, McDonald BE, Gerrard JM, Bruce VM, Weaver BJ, Holub BJ. Effect of dietary alpha-linolenic acid and its ratio to linolenic acid on platelet and plasma fatty acids and thrombogenesis. Lipids 1993;28(9):811-7. [DOI] [PubMed] [Google Scholar]
Chapman 1950 {published data only}
- Chapman CB, Gibbons T, Henschel A. The effect of the rice-fruit diet on the composition of the body. New England Journal of Medicine 1950;243(23):899-905. [DOI] [PubMed] [Google Scholar]
Charbonnier 1975 {published data only}
- Charbonnier A, Nepveux P, Fluteau G, Fluteau D. Immediate effects of ingestion of olive oil on the principal lipid constituents of the plasma. Comparison with other edible fats. Médecine & Chirurgie Digestives 1975;4 Suppl 2:73-9. [PubMed] [Google Scholar]
Cheng 2004 {published data only}
- Cheng C, Graziani C, Diamond JJ. Cholesterol-lowering effect of the Food for Heart Nutrition Education Program. Journal of the American Dietetic Association 2004;104(12):1868-72. [DOI] [PubMed] [Google Scholar]
Chiostri 1988 {published data only}
- Chiostri JE, Kwiterovich PO. Effect of American Heart Association Phase 2 diet versus eater's choice based diet on hypercholesterolaemia. Circulation 1988;78(4):II-385. [Google Scholar]
Choudhury 1984 {published data only}
- Choudhury S, Jackson P, Katan MB, Marenah CB, Cortese C, Miller NE, et al. A multifactorial diet in the management of hyperlipidaemia. Atherosclerosis 1984;50(1):93-103. [DOI] [PubMed] [Google Scholar]
Clark 1997 {published data only}
- Clark M, Ghandour G, Miller NH, Taylor CB, Bandura A, DeBusk RF. Development and evaluation of a computer-based system for dietary management of hyperlipidemia. Journal of the American Dietetic Association 1997;97(2):146-50. [DOI] [PubMed] [Google Scholar]
Clifton 1992 {published data only}
- Clifton PM, Wight MB, Nestel PJ. Is fat restriction needed with HMGCoA reductase inhibitor treatment? Atherosclerosis 1992;93(1-2):59-70. [DOI] [PubMed] [Google Scholar]
Cobb 1991 {published data only}
- Cobb MM, Teitelbaum HS, Breslow JL. Lovastatin efficacy in reducing low-density lipoprotein cholesterol levels on high- vs low-fat diets. JAMA 1991;265(8):997-1001. [PubMed] [Google Scholar]
Cohen 1991 {published data only}
- Cohen MD, D'Amico FJ, Merenstein JH. Weight reduction in obese hypertensive patients. Family Medicine 1991;23(1):25-8. [PubMed] [Google Scholar]
Cole 1988 {published data only}
- Cole TG, Schmeisser D, Prewitt TE. AHA phase 3 diet reduces cholesterol in moderately hypercholesterolemic premenopausal women [Abstract]. Circulation 1988;78(4):II-73. [Google Scholar]
Colquhoun 1990 {published data only}
- Colquhoun DM, Moores D, Somerset SM. Comparison of the effects of an avocado enriched and American Heart Association diets on lipid levels [Abstract]. Arteriosclerosis 1990;10:875a. [Google Scholar]
Consolazio 1946 {published data only}
- Consolazio FC, Forbes WH. The effects of high fat diet in a temperate environment. Journal of Nutrition 1946;32:195-204. [DOI] [PubMed] [Google Scholar]
Cox 1996 {published data only}
- Cox RH, Gonzales-Vigilar MC, Novascone MA, Silva-Barbeau I. Impact of a cancer intervention on diet-related cardiovascular disease risks of white and African-American EFNEP clients. Journal of Nutrition Education 1996;28:209-18. [Google Scholar]
Croft 1986 {published data only}
- Croft PR, Brigg D, Smith S, Harrison CB, Branthwaite A, Collins MF. How useful is weight reduction in the management of hypertension? Journal of the Royal College of General Practitioners 1986;36(291):445-8. [PMC free article] [PubMed] [Google Scholar]
Curzio 1989 {published and unpublished data}
- Curzio JL, Kennedy SS, Elliott HL, Farish E, Barnes JF, Howie CA, et al. Hypercholesterolaemia in treated hypertensives: a controlled trial of intensive dietary advice. Journal of Hypertension 1989;7(6 Suppl):S254-5. [DOI] [PubMed] [Google Scholar]
Dalgard 2001 {published data only}
- Dalgard C, Thuroe A, Haastrup B, Haghfelt T, Stender S. Saturated fat intake is reduced in patients with ischemic heart disease 1 year after comprehensive counseling but not after brief counseling. Journal of the American Dietetic Association 2001;101(12):1420-9. [DOI] [PubMed] [Google Scholar]
Da Qing IGT 1997 {published data only}
- Pan XR, Li GW, Hu YH, Wang JX, Yang WY, An ZX, et al. Effects of diet and exercise in preventing NIDDM in people with impaired glucose tolerance. The Da Qing IGT and Diabetes Study. Diabetes Care 1997;20(4):537-44. [DOI] [PubMed] [Google Scholar]
DAS 2000 {published data only}
- Bovbjerg VE, McCann BS, Brief DJ, Follette WC, Retzlaff BM, Dowdy AA, et al. Spouse support and long-term adherence to lipid-lowering diets. American Journal of Epidemiology 1995;141(5):451-60. [DOI] [PubMed] [Google Scholar]
- Knopp RH, Retzlaff B, Walden C, Fish B, Buck B, McCann B. One-year effects of increasingly fat-restricted, carbohydrate-enriched diets on lipoprotein levels in free-living subjects. Proceedings of the Society for Experimental Biology & Medicine 2000;225(3):191-9. [DOI] [PubMed] [Google Scholar]
- Knopp RH, Walden CE, McCann BS, Retzlaff B, Dowdy A, Gey G, et al. Serial changes in lipoprotein cholesterol in hypercholesterolemic men treated with alternative diets [abstract]. Arteriosclerosis 1989;9:745A. [Google Scholar]
- Knopp RH, Walden CE, Retzlaff BM, McCann BS, Dowdy AA, Albers JJ, et al. Long-term cholesterol-lowering effects of 4 fat-restricted diets in hypercholesterolaemic and combined hyperlipidaemic men: the Dietary Alternatives Study. JAMA 1997;278(18):1509-15. [PubMed] [Google Scholar]
- Walden CE, McCann BS, Retzlaff B, Dowdy A, Hanson M, Fish B, et al. Alternative fat-restricted diets for hypercholesterolemia and combined hyperlipidemia: feasibility, design, subject recruitment, and baseline characteristics of the Dietary Alternatives study. Journal of the American College of Nutrition 1991;10(5):429-42. [DOI] [PubMed] [Google Scholar]
DASH 1997 {published data only}
- Appel LJ, Moore TJ, Obarzanek E, Vollmer WM, Svetkey LP, Sacks FM, et al, DASH Collaborative Research Group. A clinical trial of the effects of dietary patterns on blood pressure. New England Journal of Medicine 1997;336(16):1117-24. [DOI] [PubMed] [Google Scholar]
- Blackburn GL. Functional foods in the prevention and treatment of disease: significance of the Dietary Approaches to Stop Hypertension Study. American Journal of Clinical Nutrition 1997;66(5):1067-71. [DOI] [PubMed] [Google Scholar]
Davey Smith 2005 {published data only}
- Davey Smith G, Bracha Y, Svendsen KH, Neaton JD, Haffner SM, Kuller LH, et al. Incidence of type 2 diabetes in the randomized multiple risk factor intervention trial. Annals of Internal Medicine 2005;142(5):313-22. [DOI] [PubMed] [Google Scholar]
De Boer 1983 {published data only}
- De Boer AC, Turek JV, Pannebakker MA, Den Ottolander GJ. The effect of diets high in polyunsaturated and high in saturated fatty acids on blood lipids and platelet tests in patients with coronary artery disease (CAD) [abstract]. Thrombosis and Haemostasis 1983;50:96. [Google Scholar]
De Bont 1981 {published and unpublished data}
- De Bont AJ, Baker IA, St Leger AS, Sweetnam PM, Wragg KG, Stephens SM, et al. A randomised controlled trial of the effect of low fat diet advice on dietary response in insulin independent diabetic women. Diabetologia 1981;21(6):529-33. [DOI] [PubMed] [Google Scholar]
DeBusk 1994 {published data only}
- DeBusk RF, Miller NH, Superko HR, Dennis CA, Thomas RJ, Lew HT, et al. A case-management system for coronary risk factor modification after acute myocardial infarction [see comments]. Annals of Internal Medicine 1994;120(9):721-9. [DOI] [PubMed] [Google Scholar]
DEER 1998 {published data only (unpublished sought but not used)}
- Stefanick ML, Mackey S, Sheehan RD, Ellsworth N, Haskell WL, Wood PD. Effects of diet and exercise in men and postmenopausal women with low levels of HDL cholesterol and high levels of LDL cholesterol. New England Journal of Medicine 1998;339(1):12-20. [DOI] [PubMed] [Google Scholar]
Delahanty 2001 {published data only}
- Delahanty LM, Hayden D, Ammerman A, Nathan DM. Medical nutrition therapy for hypercholesterolemia positively affects patient satisfaction and quality of life outcomes. Annals of Behavioral Medicine 2002;24(4):269-78. [DOI] [PubMed] [Google Scholar]
- Delahanty LM, Sonnenberg LM, Hayden D, Nathan DM. Clinical and cost outcomes of medical nutrition therapy for hypercholesterolemia: a controlled trial. Journal of the American Dietetic Association 2001;101(9):1012-23. [DOI] [PubMed] [Google Scholar]
Delius 1969 {published data only}
- Delius L. Treatment of hypotensive circulatory disorder [Die behandlung der hypotonen kreislaufregulationsstörung]. Deutsche Medizinische Wochenschrift 1969;94(42):2172-3. [DOI] [PubMed] [Google Scholar]
Demark 1990 {published data only}
- Demark WW, Bowering J, Cohen PS. Reduced serum cholesterol with dietary change using fat-modified and oat bran supplemented diets. Journal of the American Dietetic Association 1990;90(2):223-9. [PubMed] [Google Scholar]
Dengel 1995 {published data only}
- Dengel JL, Katzel LI, Goldberg AP. Effect of an American Heart Association diet, with or without weight loss, on lipids in obese middle-aged and older men. American Journal of Clinical Nutrition 1995;62(4):715-21. [DOI] [PubMed] [Google Scholar]
Denke 1994 {published data only}
- Denke MA, Grundy SM. Individual responses to a cholesterol lowering diet in 50 men with moderate hypercholesterolaemia. Archives of Internal Medicine 1994;154(3):17-25. [PubMed] [Google Scholar]
Diabetes CCT 1995 {published data only}
- The Diabetes Control and Complications Trial (DCCT) Research Group. Effect of intensive diabetes management on macrovascular events and risk factors in the Diabetes Control and Complications Trial. American Journal of Cardiology 1995;75(14):894-903. [DOI] [PubMed] [Google Scholar]
Diet & Hormone Study 2003 {published data only (unpublished sought but not used)}
- Gann PH, Chatterton RT, Gapstur SM, Liu K, Garside D, Giovanazzi S, et al. The effects of a low-fat/high-fiber diet on sex hormone levels and menstrual cycling in premenopausal women: a 12-month randomized trial (the Diet and Hormone Study). Cancer 2003;98(9):1870-9. [DOI] [PubMed] [Google Scholar]
DIET 1998 {published data only}
- Dornelas EA, Wylie-Rosett J, Swencionis C. The DIET study: long term outcomes of a cognitive-behavioural weight control intervention in independent-living elders. Journal of the American Dietetic Association 1998;98(11):1276-81. [DOI] [PubMed] [Google Scholar]
Ding 1992 {published data only}
- Ding Q. Clinical study of qianxining in the treatment of 60 cases of yang hyperactivity due to yin deficiency type of hypertension. Chung Kuo Chung Hsi I Chieh Ho Tsa Chih 1992;12(7):409-11, 388-9. [PubMed] [Google Scholar]
DIPI 2018 {published data only}
- Arentoft JL, Hoppe C, Andersen EW, Overvad K, Tetens I. Associations between adherence to the Danish Food-Based Dietary Guidelines and cardiometabolic risk factors in a Danish adult population: the DIPI study. British Journal of Nutrition 2018;119(6):664-73. [DOI] [PubMed] [Google Scholar]
DIRECT 2009 {published data only (unpublished sought but not used)}
- Ben-Avraham S, Harman-Boehm I, Schwarzfuchs D, Shai I. Dietary strategies for patients with type 2 diabetes in the era of multi-approaches; review and results from the Dietary Intervention Randomized Controlled Trial (DIRECT). Diabetes Research and Clinical Practice 2009;86(Suppl 1):S41-8. [DOI] [PubMed] [Google Scholar]
- Resch KL. Dietary Intervention Randomized Controlled Trial (DIRECT) group: weight loss with a low-carbohydrate, Mediterranean, or low-fat diet. Forschende Komplementarmedizin (2006) 2008;15(6):351-2. [PubMed] [Google Scholar]
- Shai I, Gepner Y, Shelef I, Schwarzfuchs D, Zelicha H, Tene L, et al. Precision nutrition. Obesity Facts 2019;12:1. [Google Scholar]
- Shai I, Schwarzfuchs D, Henkin Y, Shahar DR, Witkow S, Greenberg I, et al. Weight loss with a low-carbohydrate, Mediterranean, or low-fat diet. New England Journal of Medicine 2008;359(3):229-41. [DOI] [PubMed] [Google Scholar]
- Shai I, Spence JD, Schwarzfuchs D, Henkin Y, Parraga G, Rudich A, et al. Dietary intervention to reverse carotid atherosclerosis. Circulation 2010;121(10):1200-8. [DOI] [PubMed] [Google Scholar]
- Shai I. The effect of low-carb, Mediterranean and low-fat diets on renal function; a 2-year dietary intervention randomized controlled trial (DIRECT). Obesity Facts 2012;5:19. [Google Scholar]
Dobs 1991 {published data only}
- Dobs AS, Sarma PS, Wilder L. Lipid-lowering diets in patients taking pravastatin, a new HMG-CoA reductase inhibitor: compliance and adequacy. American Journal of Clinical Nutrition 1991;54(4):696-700. [DOI] [PubMed] [Google Scholar]
DO IT 2006 {published and unpublished data}
- Berstad P, Seljeflot I, Veierod MB, Hjerkinn EM, Arnesen H, Pedersen JI, et al. Supplementation with fish oil affects the association between very long-chain n-3 polyunsaturated fatty acids in serum non-esterified fatty acids and soluble vascular cell adhesion molecule-1. Clinical Science 2003;105(1):13-20. [DOI] [PubMed] [Google Scholar]
- Ellingsen I, Hjerkinn EM, Seljeflot I, Arnesen H, Tonstad S, Ellingsen I, et al. Consumption of fruit and berries is inversely associated with carotid atherosclerosis in elderly men. British Journal of Nutrition 2008;99(3):674-81 Erratum in: British Journal of Nutrition 2008; 99(3): 697. [DOI] [PubMed] [Google Scholar]
- Ellingsen I, Seljeflot I, Arnesen H, Tonstad S, Ellingsen Ingrid, Seljeflot Ingebjorg, et al. Vitamin C consumption is associated with less progression in carotid intima media thickness in elderly men: a 3-year intervention study. Nutrition Metabolism & Cardiovascular Diseases 2009;19(1):8-14. [DOI] [PubMed] [Google Scholar]
- Furenes EB, Seljeflot I, Solheim S, Hjerkinn EM, Arnesen H. Long-term influence of diet and/or omega-3 fatty acids on matrix metalloproteinase-9 and pregnancy-associated plasma protein-A in men at high risk of coronary heart disease. Scandinavian Journal of Clinical & Laboratory Investigation 2008;68(3):177-84. [DOI] [PubMed] [Google Scholar]
- Hjerkinn EM, Abdelnoor M, Breivik L, Bergengen L, Ellingsen I, Seljeflot I, et al. Effect of diet or very long chain omega-3 fatty acids on progression of atherosclerosis, evaluated by carotid plaques, intima-media thickness and by pulse wave propagation in elderly men with hypercholesterolaemia. European Journal of Cardiovascular Prevention & Rehabilitation 2006;13(3):325-33. [DOI] [PubMed] [Google Scholar]
- Hjerkinn EM, Seljeflot I, Ellingsen I, Berstad P, Hjermann I, Sandvik L, et al. Influence of long-term intervention with dietary counselling, long-chain n-3 fatty acid supplements, or both on circulating markers of endothelial activation in men with long-standing hyperlipidemia. American Journal of Clinical Nutrition 2005;81(3):583-9. [DOI] [PubMed] [Google Scholar]
- Lindman AS, Pedersen JI, Hjerkinn EM, Arnesen H, Veierod MB, Ellingsen I, et al. The effects of long-term diet and omega-3 fatty acid supplementation on coagulation factor VII and serum phospholipids with special emphasis on the R353Q polymorphism of the FVII gene. Thrombosis & Haemostasis 2004;91(6):1097-104. [DOI] [PubMed] [Google Scholar]
- Troseid M, Arnesen H, Hjerkinn EM, Seljeflot I. Serum levels of interleukin-18 are reduced by diet and n-3 fatty acid intervention in elderly high-risk men. Metabolism: Clinical & Experimental 2009;58(11):1543-9. [DOI] [PubMed] [Google Scholar]
- Troseid M, Seljeflot I, Hjerkinn EM, Arnesen H. Interleukin-18 is a strong predictor of cardiovascular events in elderly men with the metabolic syndrome: synergistic effect of inflammation and hyperglycemia. Diabetes Care 2009;32(3):486-92. [DOI] [PMC free article] [PubMed] [Google Scholar]
Due 2008 {published and unpublished data}
- Bladbjerg EM, Larsen TM, Due A, Jespersen J, Stender S, Astrup A. Postprandial coagulation activation in overweight individuals after weight loss: acute and long-term effects of a high-monounsaturated fat diet and a low-fat diet. Thrombosis Research 2014;133(3):327-33. [DOI] [PubMed] [Google Scholar]
- Due A, Larsen TM, Hermansen K, Stender S, Holst JJ, Toubro S, et al. Comparison of the effects on insulin resistance and glucose tolerance of 6-mo high-monounsaturated-fat, low-fat, and control diets. American Journal of Clinical Nutrition 2008;87(4):855-62. [DOI] [PubMed] [Google Scholar]
- Due A, Larsen TM, Mu H, Hermansen K, Stender S, Astrup A. Comparison of 3 ad libitum diets for weight-loss maintenance, risk of cardiovascular disease, and diabetes: a 6-mo randomized, controlled trial. American Journal of Clinical Nutrition 2008;88(5):1232-41. [DOI] [PubMed] [Google Scholar]
- Rasmussen LG, Larsen TM, Mortensen PK, Due A, Astrup A. Effect on 24-h energy expenditure of a moderate-fat diet high in monounsaturated fatty acids compared with that of a low-fat, carbohydrate-rich diet: a 6-mo controlled dietary intervention trial. American Journal of Clinical Nutrition 2007;85(4):1014-22. [DOI] [PubMed] [Google Scholar]
- Sloth B, Due A, Larsen TM, Holst JJ, Heding A, Astrup A, et al. The effect of a high-MUFA, low-glycaemic index diet and a low-fat diet on appetite and glucose metabolism during a 6-month weight maintenance period. British Journal of Nutrition 2009;101(12):1846-58. [DOI] [PubMed] [Google Scholar]
Duffield 1982 {published data only}
- Duffield RG, Lewis B, Miller NE, Jamieson CW, Brunt JN, Colchester AC. Treatment of hyperlipidaemia retards progression of symptomatic femoral atherosclerosis. A randomised controlled trial. Lancet 1983;2(8351):639-42. [DOI] [PubMed] [Google Scholar]
- Duffield RG, Miller NE, Jamieson CW, Lewis B. A controlled trial of plasma lipid reduction in peripheral atherosclerosis - an interim report. British Journal of Surgery 1982;69(Suppl):S3-S5. [DOI] [PubMed] [Google Scholar]
Dullaart 1992 {published and unpublished data}
- Dullaart RP, Beusekamp BJ, Meijer S, Hoogenberg K, Van Doormaal JJ, Sluiter WJ. Long-term effects of linoleic-acid-enriched diet on albuminuria and lipid levels in type 1 (insulin-dependent) diabetic patients with elevated urinary albumin excretion. Diabetologia 1992;35(2):165-72. [DOI] [PubMed] [Google Scholar]
Eating Patterns 1997 {published and unpublished data}
- Beresford SA, Curry SJ, Kristal AR, Lazovich D, Feng Z, Wagner EH. A dietary intervention in primary care practice: the Eating Patterns Study. American Journal of Public Health 1997;87(4):610-6. [DOI] [PMC free article] [PubMed] [Google Scholar]
Ehnholm 1982 {published data only}
- Ehnholm C, Huttunen JK, Pietinen P, Leino U, Mutanen M, Kostiainen E, et al. Effect of diet on serum lipoproteins in a population with a high risk of coronary heart disease. New England Journal of Medicine 1982;307(14):850-5. [DOI] [PubMed] [Google Scholar]
Ehnholm 1984 {published data only}
- Ehnholm C, Huttunen JK, Pietinen P, Leino U, Mutanen M, Kostiainen E, et al. Effect of a diet low in saturated fatty acids on plasma lipids, lipoproteins, and HDL subfractions. Arteriosclerosis 1984;4(3):265-9. [DOI] [PubMed] [Google Scholar]
Eisenberg 1990 {published data only}
- Eisenberg S. The effect of dietary substitution of monounsaturated fatty acids with carbohydrates on lipoprotein levels, structure, and function in a free-living population [abstract]. Arteriosclerosis 1990;10:872A. [Google Scholar]
Elder 2000 {published data only}
- Elder JP, Candelaria JI, Woodruff SI, Criqui MH, Talavera GA, Rupp JW. Results of language for health: cardiovascular disease nutrition education for Latino English-as-a-second-language students. Health Education & Behavior 2000;27(1):50-63. [DOI] [PubMed] [Google Scholar]
Ellegard 1991 {published data only}
- Ellegard L, Bosaeus I. Sterol and nutrient excretion in ileostomists on prudent diets. European Journal of Clinical Nutrition 1991;45(9):451-7. [PubMed] [Google Scholar]
Esposito 2003 {published data only}
- Esposito K, Pontillo A, Di Palo C, Giugliano G, Masella M, Marfella R, et al. Effect of weight loss and lifestyle changes on vascular inflammatory markers in obese women: a randomized trial. JAMA 2003;289(14):1799-804. [DOI] [PubMed] [Google Scholar]
Esposito 2004 {published data only}
- Esposito K, Marfella R, Ciotola M, Di Palo C, Giugliano F, Giugliano G, et al. Effect of a Mediterranean-style diet on endothelial dysfunction and markers of vascular inflammation in the metabolic syndrome: a randomized trial. JAMA 2004;292(12):1440-6. [DOI] [PubMed] [Google Scholar]
EUROACTION 2008 {published data only}
- Wood DA, Kotseva K, Connolly S, Jennings C, Mead A, Jones J, et al. Nurse-coordinated multidisciplinary, family-based cardiovascular disease prevention programme (EUROACTION) for patients with coronary heart disease and asymptomatic individuals at high risk of cardiovascular disease: a paired, cluster-randomised controlled trial. Lancet 2008;371(9629):1999-2012. [DOI] [PubMed] [Google Scholar]
FARIS 1997 {published data only}
- Goble A, Jackson B, Phillips P, Race E, Oliver RG, Worcester MC. The Family Atherosclerosis Risk Intervention Study (FARIS): risk factor profiles of patients and their relatives following an acute cardiac event. Australian and New Zealand Journal of Medicine 1997;27(5):568-77. [DOI] [PubMed] [Google Scholar]
Fasting HGS 1997 {published data only}
- Dyson PA, Hammersley MS, Morris RJ, Holman RR, Turner RC. The Fasting Hyperglycaemia Study: II. Randomized controlled trial of reinforced healthy-living advice in subjects with increased but not diabetic fasting plasma glucose. Metabolism 1997;46(12 Suppl 1):50-5. [DOI] [PubMed] [Google Scholar]
Ferrara 2000 {published data only}
- Ferrara LA, Raimondi AS, D'Episcopo L, Guida L, Dello Russo A, Marotta T. Olive oil and reduced need for antihypertensive medications. Archives of Internal Medicine 2000;160(6):837-42. [DOI] [PubMed] [Google Scholar]
Fielding 1995 {published data only}
- Fielding CJ, Havel RJ, Todd KM, Yeo KE, Schloetter MC, Weinberg V, et al. Effects of dietary cholesterol and fat saturation on plasma lipoproteins in an ethnically diverse population of healthy young men. Journal of Clinical Investigation 1995;95(2):611-8. [DOI] [PMC free article] [PubMed] [Google Scholar]
Finnish Diabet Prev 2000 {published data only}
- Uusitupa M, Louheranta A, Lindstrom J, Valle T, Sundvall J, Eriksson J, et al. The Finnish Diabetes Prevention Study. British Journal of Nutrition 2000;83(Suppl 1):S137-42. [DOI] [PubMed] [Google Scholar]
Finnish Mental Hosp 1972 {published data only}
- Miettinen M, Turpeinen O, Karvonen MJ, Elosuo R, Paavilainen E. Effect of cholesterol-lowering diet on mortality from coronary heart-disease and other causes: a twelve-year clinical trial in men and women. Lancet 1972;2(782):835-8. [DOI] [PubMed] [Google Scholar]
- Miettinen M, Turpeinen O, Karvonen MJ, Pekkarinen M, Paavilainen E, Elosuo R. Dietary prevention of coronary heart disease in women: the Finnish Mental Hospital study. International Journal of Epidemiology 1983;12(1):17-25. [DOI] [PubMed] [Google Scholar]
- Turpeinen O, Miettinen M, Karvonen M, Roine P, Pekkarinen M, Lehtosuo EJ, et al. Dietary prevention of coronary heart disease: long-term experiment. I. Observations on male subjects. American Journal of Clinical Nutrition 1968;21(4):255-76. [DOI] [PubMed] [Google Scholar]
Fisher 1981 {published data only}
- Fisher EA, Breslow JL, Zannis VI, Shen G, Blum CB. Dietary saturated fat, not cholesterol, affects plasma lipids and Apo E. Arteriosclerosis 1981;1(5):364a. [Google Scholar]
FIT Heart 2011 {published data only}
- Mochari-Greenberger H, Terry MB, Mosca L. Does stage of change modify the effectiveness of an educational intervention to improve diet among family members of hospitalized cardiovascular disease patients? Journal of the American Dietetic Association 2010;110(7):1027-35. [DOI] [PMC free article] [PubMed] [Google Scholar]
- Mochari-Greenberger H, Terry MB, Mosca L. Gender, age and race/ethnicity do not modify the effectiveness of a diet intervention among family members of hospitalized cardiovascular disease patients. Journal of Nutrition Education and Behavior 2011;43(5):366-73. [DOI] [PMC free article] [PubMed] [Google Scholar]
Fleming 2002 {published data only}
- Fleming RM. The effect of high-, moderate-, and low-fat diets on weight loss and cardiovascular disease risk factors. Preventive Cardiology 2002;5(3):110-5. [DOI] [PubMed] [Google Scholar]
Fortmann 1988 {published data only}
- Fortmann SP, Haskell WL, Wood PD. Effects of weight loss on clinic and ambulatory blood pressure in normotensive men. American Journal of Cardiology 1988;62(1):89-93. [DOI] [PubMed] [Google Scholar]
Foster 2003 {published data only}
- Foster GD, Wyatt HR, Hill JO, McGuckin BG, Brill C, Mohammed BS, et al. A randomized trial of a low-carbohydrate diet for obesity. New England Journal of Medicine 2003;348(21):2082-90. [DOI] [PubMed] [Google Scholar]
Frenkiel 1986 {published data only}
- Frenkiel PG, Lee DW, Cohen H, Gilmore CJ, Resser K, Bonorris GG, et al. The effect of diet on bile acid kinetics and biliary lipid secretion in gallstone patients treated with ursodeoxycholic acid. American Journal of Clinical Nutrition 1986;43(2):239-50. [DOI] [PubMed] [Google Scholar]
FRESH START 2007 {published data only}
- Denmark-Wahnefried W, Clipp EC, Lipkus IM, Lobach D, Snyder DC, Sloane R, et al. Main outcomes of the FRESH START trial: a sequentially tailored, diet and exercise mailed print intervention among breast and prostate cancer survivors. Journal of Clinical Oncology 2007;25(19):2709-18. [DOI] [PubMed] [Google Scholar]
Gambera 1995 {published data only}
- Gambera PJ, Schneeman BO, Davis PA. Use of the Food Guide Pyramid and US Dietary Guidelines to improve dietary intake and reduce cardiovascular risk in active-duty Air Force members. Journal of the American Dietetic Association 1995;95(11):1268-73. [DOI] [PubMed] [Google Scholar]
Gaullier 2007 {published data only}
- Gaullier J-M, Halse J, Hoivik HO, Hoye K, Syvertsen C, Nurminiemi M, et al. Six months supplementation with conjugated linoleic acid induces regional-specific fat mass decreases in overweight and obese. British Journal of Nutrition 2007;97:550-60. [DOI] [PubMed] [Google Scholar]
Ginsberg 1988 {published data only}
- Ginsberg H. Both a high monounsaturated fat diet and the step 1 AHA diet significantly reduce plasma cholesterol levels in healthy males [abstract]. Circulation 1988;78:II73. [Google Scholar]
Gjone 1972 {published data only}
- Gjone E, Nordoy A, Blomhoff JP, Wiencke I. The effects of unsaturated and saturated dietary fats on plasma cholesterol, phospholipids and lecithin: cholesterol acyltransferase activity. Acta Medica Scandinavica 1972;191(6):481-4. [PubMed] [Google Scholar]
Glatzel 1966 {published data only}
- Glatzel H. The relationship between postprandial triglyceridemia and the fat content of the basic diet [Die Abhängigkeit der postcenalen triglyceridamie vom fettgehalt der grundkost]. Klinische Wochenschrift 1966;44(5):283-4. [DOI] [PubMed] [Google Scholar]
Goodpaster 1999 {published data only}
- Goodpaster BH, Kelley DE, Wing RR, Meier A, Thaete FL. Effects of weight loss on regional fat distribution and insulin sensitivity in obesity. Diabetes 1999;48(4):839-47. [DOI] [PubMed] [Google Scholar]
Grundy 1986 {published data only}
- Grundy SM, Nix D, Whelan MF, Franklin L. Comparison of three cholesterol-lowering diets in normolipidaemic men. JAMA 1986;256(17):2351-5. [PubMed] [Google Scholar]
Hardcastle 2008 {published data only}
- Hardcastle S, Taylor A, Bailey M, Castle R. A randomised controlled trial on the effectiveness of a primary health care based counselling intervention on physical activity, diet and CHD risk factors. Patient Education & Counseling 2008;70(1):31-9. [DOI] [PubMed] [Google Scholar]
Harris 1990 {published data only}
- Harris WS, Feldman EB. Intensive dietary intervention in hypercholesterolemic patients. Observed versus predicted changes in cholesterol levels [abstract]. Arteriosclerosis 1990;10:853A. [Google Scholar]
Hartman 1993 {published data only}
- Hartman T, McCarthy P, Himes J. Use of eating pattern messages to evaluate changes in eating behaviors in a worksite cholesterol education program. Journal of the American Dietetic Association 1993;93(10):1119-23. [DOI] [PubMed] [Google Scholar]
Hartwell 1986 {published data only}
- Hartwell SL, Kaplan RM, Wallace JP. Comparison of behavioral interventions for control of type II diabetes mellitus. Behavior Therapy 1986;17:447-61. [Google Scholar]
Hashim 1960 {published data only}
- Hashim SA, Arteaga A, Van Itallie TB. Effect of saturated medium-chain triglyceride on serum-lipids in man. Lancet 1960;1(7134):1105-7. [DOI] [PubMed] [Google Scholar]
Haufe 2011 {published and unpublished data}
- Haufe S, Engeli S, Kast P, Böhnke J, Utz W, Haas V, et al. Randomized comparison of reduced fat and reduced carbohydrate hypocaloric diets on intrahepatic fat in overweight and obese human subjects. Hepatology 2011;53(5):1504-14. [DOI] [PubMed] [Google Scholar]
- Haufe S, Utz W, Engeli S, Kast P, Böhnke J, Pofahl M, et al. Left ventricular mass and function with reduced-fat or reduced-carbohydrate hypocaloric diets in overweight and obese subjects. Hypertension 2012;59(1):70-5. [DOI] [PubMed] [Google Scholar]
Haynes 1984 {published data only}
- Haynes RB, Harper AC, Costley SR, Johnston M, Logan AG, Flanagan PT, et al. Failure of weight reduction to reduce mildly elevated blood pressure: a randomized trial. Journal of Hypertension 1984;2(5):535-9. [DOI] [PubMed] [Google Scholar]
Heber 1991 {published data only}
- Heber D, Ashley JM, Leaf DA, Barnard JA. Reduction of serum estradiol in postmenopausal women given free access to low-fat high carbohydrate diet. Nutrition 1991;7(2):137-41. [PubMed] [Google Scholar]
Heine 1989 {published and unpublished data}
- Heine RJ, Mulder C, Popp-Snijders C, Van der Meer J, Van der Veen EA. Linoleic-acid-enriched diet: long-term effects on serum lipoprotein and apolipoprotein concentration and insulin sensitivity in noninsulin-dependent diabetic patients. American Journal of Clinical Nutrition 1989;49(3):448-56. [DOI] [PubMed] [Google Scholar]
Hellenius 1995 {published and unpublished data}
- Hellenius ML, Brismar KE, Berglund BH, De Faire U. Effects on glucose tolerance, insulin secretion, insulin-like growth factor 1 and its binding protein, IGFBP-1, in a randomized controlled diet and exercise study in healthy, middle-aged men. Journal of Internal Medicine 1995;238(2):121-30. [DOI] [PubMed] [Google Scholar]
- Hellenius ML, Dahlof C, Aberg H, Krakau I, De Faire U. Quality of life is not negatively affected by diet and exercise intervention in healthy men with cardiovascular risk factors. Quality of Life Research 1995;4(1):13-20. [DOI] [PubMed] [Google Scholar]
- Hellenius ML, De Faire U, Berglund B, Hamsten A, Krakau I. Diet and exercise are equally effective in reducing risk for cardiovascular disease. Results of a randomized controlled study in men with slightly to moderately raised cardiovascular risk factors. Atherosclerosis 1993;103(1):81-91. [DOI] [PubMed] [Google Scholar]
- Hellenius ML, Krakau I, De Faire U. Favourable long-term effects from advice on diet and exercise given to healthy men with raised cardiovascular risks. Nutrition, Metabolism and Cardiovascular Diseases 1997;7:293-300. [Google Scholar]
- Hellenius, ML. Prevention of Cardiovascular Disease: Studies on the Role of Diet and Exercise in the Prevention of Cardiovascular Disease among Middle-Aged Men [PhD thesis]. Huddinge, Sweden: Karolinska Intitute, 1995. [Google Scholar]
- Naslund GK, Fredrikson M, Hellenius ML, De Faire U. Effect of diet and physical exercise intervention programmes on coronary heart disease risk in smoking and non-smoking men in Sweden. Journal of Epidemiology and Community Health 1996;50(2):131-6. [DOI] [PMC free article] [PubMed] [Google Scholar]
Heller 1993 {published and unpublished data}
- Heller RF, Knapp JC, Valenti LA, Dobson AJ. Secondary prevention after acute myocardial infarction. American Journal of Cardiology 1993;72(11):759-62. [DOI] [PubMed] [Google Scholar]
- Heller RF, Walker RJ, Boyle CA, O'Connell DL, Rusakaniko S, Dobson AJ. A randomised controlled trial of a dietary advice program for relatives of heart attack victims. Medical Journal of Australia 1994;161(9):529-31. [DOI] [PubMed] [Google Scholar]
Hildreth 1951 {published data only}
- Hildreth EA, Mellinkoff SM, Blair GW, Hildreth DM. The effect of vegetable fat ingestion on human serum cholesterol concentration. Circulation 1951;3(5):641-6. [DOI] [PubMed] [Google Scholar]
Holm 1990 {published data only (unpublished sought but not used)}
- Holm LE, Nordevang E, Ikkala E, Hallstrom L, Callmer E. Dietary intervention as adjuvant therapy in breast cancer patients - a feasibility study. Breast Cancer Research and Treatment 1990;16(2):103-9. [DOI] [PubMed] [Google Scholar]
- Nordevang E, Callmer E, Marmur A, Holm LE. Dietary intervention in breast cancer patients: effects on food choice. European Journal of Clinical Nutrition 1992;46(6):387-96. [PubMed] [Google Scholar]
- Nordevang E, Ikkala E, Callmer E, Hallstrom L, Holm LE. Dietary intervention in breast cancer patients: effects on dietary habits and nutrient intake. European Journal of Clinical Nutrition 1990;44(9):681-7. [PubMed] [Google Scholar]
Horlick 1957 {published data only}
- Horlick L, Craig BM. Effect of long-chain polyunsaturated and saturated fatty acids on the serum-lipids of man. Lancet 1957;2:566-9. [DOI] [PubMed] [Google Scholar]
Horlick 1960 {published data only}
- Horlick L, O'Neil JB. Effect of modified egg-yolk fats on blood-cholesterol levels [letter]. Lancet 1960;1:438. [DOI] [PubMed] [Google Scholar]
Howard 1977 {published data only}
- Howard AN, Marks J. Hypocholesterolaemic effect of milk [letter]. Lancet 1977;2(8031):255-6. [DOI] [PubMed] [Google Scholar]
Hunninghake 1990 {published data only}
- Hunninghake DB, Laskarzewski PM. Gender difference in the response to lovastatin administration with and without a cholesterol lowering diet [abstract]. Arteriosclerosis 1990;10:786A. [Google Scholar]
Hutchison 1983 {published data only}
- Hutchison K, Oberle K, Crockford P, Grace M, Whyte L, Gee M, et al. Effects of dietary manipulation on vascular status of patients with peripheral vascular disease. JAMA 1983;249(24):3326-30. [DOI] [PubMed] [Google Scholar]
Hyman 1998 {published and unpublished data}
- Hyman DJ, Ho KS, Dunn K, Simons-Morton D. Dietary intervention for cholesterol reduction in public clinic patients. American Journal of Preventive Medicine 1998;15(2):139-45. [DOI] [PubMed] [Google Scholar]
Iacono 1981 {published data only}
- Iacono JM, Judd JT, Marshall MW, Canary JJ, Dougherty RM, Mackin JF, et al. The role of dietary essential fatty acids and prostaglandins in reducing blood pressure. Progress in Lipid Research 1981;20:349-64. [DOI] [PubMed] [Google Scholar]
IMPACT 1995 {published data only}
- Fielding JE, Mason T, Kinght K, Klesges R, Pelletier KR. A randomized trial of the IMPACT worksite cholesterol reduction program. American Journal of Preventive Medicine 1995;11(2):120-3. [PubMed] [Google Scholar]
Iso 1991 {published data only}
- Iso H, Konishi M, Terao A, Kiyama M, Tanigaki M, Baba M, et al. A community-based education program for serum cholesterol reduction in urban hypercholesterolemic persons: comparison of intensive and usual education groups. Nippon.Koshu.Eisei.Zasshi [Japanese Journal of Public Health] 1991;38(9):751-61. [PubMed] [Google Scholar]
Ives 1993 {published data only}
- Ives DG, Kuller LH, Traven ND. Use and outcomes of a cholesterol-lowering intervention for rural elderly subjects. American Journal of Preventive Medicine 1993;9(5):274-81. [PubMed] [Google Scholar]
Jalkanen 1991 {published data only}
- Jalkanen L. The effect of a weight reduction program on cardiovascular risk factors among overweight hypertensives in primary health care. Scandinavian Journal of Social Medicine 1991;19(1):66-71. [DOI] [PubMed] [Google Scholar]
Jerusalem Nut 1992 {published data only}
- Berry EM, Eisenberg S, Friedlander Y, Harats D, Kaufmann NA, Norman Y, et al. Effects of diets rich in monounsaturated fatty acids on plasma lipoproteins: the Jerusalem Nutrition Study. II. Monounsaturated fatty acids vs carbohydrates. American Journal of Clinical Nutrition 1992;56(2):394-403. [DOI] [PubMed] [Google Scholar]
Jula 1990 {published data only}
- Jula A, Ronnemaa T, Rastas M, Karvetti RL, Maki J. Long-term nonpharmacological treatment for mild to moderate hypertension. Journal of Internal Medicine 1990;227(6):413-21. [DOI] [PubMed] [Google Scholar]
Junker 2001 {published data only}
- Junker R, Pieke B, Schulte H, Nofer R, Neufeld M, Assmann G, et al. Changes in hemostasis during treatment of hypertriglyceridemia with a diet rich in monounsaturated and n-3 polyunsaturated fatty acids in comparison with a low-fat diet. Thrombosis Research 2001;101(5):355-66. [DOI] [PubMed] [Google Scholar]
Karmally 1990 {published data only}
- Karmally W, Carpentiri C, Viscardi T, Cheverez V, Holleran S, Ramakrishnan R, et al. Replacing monounsaturated by polyunsaturated fatty acids within an AHA step I diet does not affect the plasma levels or metabolism of low density and high density lipoproteins in normal men [abstract]. Arteriosclerosis 1990;10:877A. [Google Scholar]
Karvetti 1992 {published data only}
- Karvetti RL, Hakala P. A seven-year follow-up of a weight reduction programme in Finnish primary health care. European Journal of Clinical Nutrition 1992;46(10):743-52. [PubMed] [Google Scholar]
Kastarinen 2002 {published data only}
- Kastarinen MJ, Puska PM, Korhonen MH, Mustonen JN, Salomaa VV, Sundvall JE, et al. Non-pharmacological treatment of hypertension in primary health care: a 2-year open randomized controlled trial of lifestyle intervention against hypertension in eastern Finland. Journal of Hypertension 2002;20(12):01. [DOI] [PubMed] [Google Scholar]
Kather 1985 {published data only}
- Kather H, Wildenberg U, Wieland E. Influence of different dietary conditions in ideal-weight subjects on serum levels of free fatty acids and of glycerol in vivo and on lipid mobilization in vitro [abstract]. European Journal of Clinical Investigation 1985;15(Suppl 1):A. [Google Scholar]
Katzel 1995 {published data only}
- Katzel LI, Bleecker ER, Colman EG, Rogus EM, Sorkin JD, Goldberg AP. Effects of weight loss vs aerobic exercise training on risk factors for coronary disease in healthy, obese, middle-aged and older men. A randomized controlled trial [see comments]. JAMA 1995;274(24):1915-21. [DOI] [PubMed] [Google Scholar]
Kawamura 1993 {published data only}
- Kawamura M, Akasaka T, Kasatsuki T, Nakajima J, Onodera S, Fujiwara T, et al. Blood pressure is reduced by short-time calorie restriction in overweight hypertensive women with a constant intake of sodium and potassium. Journal of Hypertension 1993;11(Suppl 5):S320-1. [PubMed] [Google Scholar]
Keidar 1988 {published data only}
- Keidar S, Krul ES, Goldberg AC, Bateman J, Schonfield G. Fat-free diet modulates epitope expression of LDL-apo [abstract]. Arteriosclerosis 1988;8:565A. [PubMed] [Google Scholar]
Kempner 1948 {published data only}
- Kempner W. Treatment of hypertensive vascular disease with rice diet. American Journal of Medicine 1948;4(4):545-77. [DOI] [PubMed] [Google Scholar]
Keys 1957a {published data only}
- Keys A, Anderson JT, Grande F. Serum-cholesterol response to dietary fat [letter]. Lancet 1957;1:787. [Google Scholar]
Keys 1957b {published data only}
- Keys A, Anderson JT, Grande F. Essential fatty acids, degree of unsaturation, and effect of corn (maize) oil on the serum-cholesterol level in man. Lancet 1957;1(6959):66-8. [DOI] [PubMed] [Google Scholar]
Keys 1957c {published data only}
- Keys A. Prediction of serum-cholesterol responses of man to changes in fats in the diet. Lancet 1957;2:959-66. [DOI] [PubMed] [Google Scholar]
Khan 2003 {published and unpublished data}
- Khan F, Elherik K, Bolton-Smith C, Barr R, Hill A, Murrie I, et al. The effects of dietary fatty acid supplementation on endothelial function and vascular tone in healthy subjects. Cardiovascular Research 2003;59(4):955-62. [DOI] [PubMed] [Google Scholar]
King 2000 {published data only}
- King S, David S, Newton H, Hevey D, Rafferty F, Horgan JH. The effect of dietary modification on the training outcome and body composition in patients undergoing undergoing a cardiac rehabilitation programme. Coronary Health Care 2000;4(2):76-81. [Google Scholar]
Kingsbury 1961 {published data only}
- Kingsbury KJ, Morgan DM, Aylott C, Emmerson R. Effects of ethyl arachidonate, cod-liver oil, and corn oil on the plasma-cholesterol level: a comparison in normal volunteers. Lancet 1961;1(7180):739-41. [DOI] [PubMed] [Google Scholar]
KNOTA {published data only}
- Andersson J, Mellberg C, Otten J, Ryberg M, Rinnstrom D, Larsson C, et al. Left ventricular remodelling changes without concomitant loss of myocardial fat after long-term dietary intervention. International Journal of Cardiology 2016;216:92‐6. [DOI] [PubMed] [Google Scholar]
- Blomquist C, Chorell E, Ryberg M, Mellberg C, Larsson C, Lindahl B, et al. Beneficial effects on fatty acid composition and indices of fatty acid desaturase activity with a paleolithic-type diet during a two-year intervention in obese postmenopausal women. Endocrine Reviews 2016;37(2 Suppl 1):SUN 575. [Google Scholar]
- Blomquist C, Chorell E, Ryberg M, Mellberg C, Worrsjo E, Makoveichuk E, et al. Decreased lipogenesis-promoting factors in adipose tissue in postmenopausal women with overweight on a Paleolithic-type diet. European Journal of Nutrition 2018;57(8):2877-86. [DOI] [PMC free article] [PubMed] [Google Scholar]
- Franklin KA, Eriksson M, Larsson C, Lindahl B, Mellberg C, Sahlin C, et al. Palaeolithic diet and obstructive sleep apnoea in overweight females: a randomised controlled trial. European Respiratory Journal 2016;48:PA2376. [Google Scholar]
- Mellberg C, Sandberg S, Ryberg M, Eriksson M, Brage S, Larsson C, et al. Long-term effects of a Palaeolithic-type diet in obese postmenopausal women: a 2-year randomized trial. European Journal of Clinical Nutrition 2014;68(3):350-7. [DOI] [PMC free article] [PubMed] [Google Scholar]
- Otten J, Mellberg C, Ryberg M, Sandberg S, Kullberg J, Lindahl B, et al. Strong and persistent effect on liver fat with a Paleolithic diet during a two-year intervention. International Journal of Obesity 2016;40(5):747-53. [DOI] [PubMed] [Google Scholar]
- Otten J, Mellberg C, Sandberg S, Hauksson J, Larsson C, Lindahl B, et al. Decrease of visceral adipose tissue and liver fat during diet intervention: a predictor of insulin sensitivity improvement? Diabetes 2014;63:A16‐. [Google Scholar]
- Otten J, Ryberg M, Mellberg C, Andersson T, Chorell E, Lindahl B, et al. Postprandial levels of GLP-1, GIP and glucagon after 2 years of weight loss with a Paleolithic diet: a randomised controlled trial in healthy obese women. European Journal of Endocrinology 2019;180(6):417-27. [DOI] [PMC free article] [PubMed] [Google Scholar]
- Otten J, Ryberg M, Mellberg C, Lindahl B, Larsson C, Juul Holst J, et al. Weight loss by two different diets increases the postprandial response of GLP-1 but only the Paleolithic diet increases the postprandial response of GIP. Diabetologia 2017;60(1):S233‐. [Google Scholar]
- Otten J, Stomby A, Ryberg M, Svensson M, Hauksson J, Olsson T. Effects of a paleolithic diet with and without supervised exercise on liver fat and insulin sensitivity: a randomised controlled trial in individuals with type 2 diabetes. Diabetologia 2016;59(1):S10‐. [Google Scholar]
- Otten J, Stomby A, Waling M, Isaksson A, Soderstrom I, Ryberg M, et al. A heterogeneous response of liver and skeletal muscle fat to the combination of a Paleolithic diet and exercise in obese individuals with type 2 diabetes: a randomised controlled trial. Diabetologia 2018;61(7):1548-59. [DOI] [PMC free article] [PubMed] [Google Scholar]
- Otten J, Stomby A, Waling M, Isaksson A, Tellstrom A, Lundin-Olsson L, et al. Benefits of a Paleolithic diet with and without supervised exercise on fat mass, insulin sensitivity, and glycemic control: a randomized controlled trial in individuals with type 2 diabetes. Diabetes/Metabolism Research and Reviews 2017;33(1):e2828. [DOI: ] [DOI] [PMC free article] [PubMed] [Google Scholar]
- Stomby A, Otten J, Ryberg M, Nyberg L, Olsson T, Boraxbekk CJ. A paleolithic diet with and without combined aerobic and resistance exercise increases functional brain responses and hippocampal volume in subjects with type 2 diabetes. Frontiers in Aging Neuroscience 2017;9(DEC):391. [DOI] [PMC free article] [PubMed] [Google Scholar]
- Stomby A, Simonyte K, Mellberg C, Ryberg M, Stimson RH, Larsson C, et al. Diet-induced weight loss has chronic tissue-specific effects on glucocorticoid metabolism in overweight postmenopausal women. International Journal of Obesity 2015;39(5):814‐9. [DOI] [PubMed] [Google Scholar]
Koopman 1990 {published data only}
- Koopman H, Spreeuwenberg C, Westerman RF, Donker AJ. Dietary treatment of patients with mild to moderate hypertension in a general practice: a pilot intervention study (2). Beyond three months. Journal of Human Hypertension 1990;4(4):372-4. [PubMed] [Google Scholar]
Koranyi 1963 {published data only}
- Koranyi A. Prophylaxis and treatment of the coronary syndrome. Therapia Hungarica 1963;11:17-20. [PubMed] [Google Scholar]
Korhonen 2003 {published data only}
- Korhonen M, Kastarinen M, Uusitupa M, Puska P, Nissinen A. The effect of intensified diet counselling on the diet of hypertensive subjects in primary health care: a 2-year open randomized controlled trial of lifestyle intervention against hypertension in eastern Finland. Preventive Medicine 2003;36(1):8-16. [DOI] [PubMed] [Google Scholar]
Kriketos 2001 {published data only}
- Kriketos AD, Robertson RM, Sharp TA, Drougas H, Reed GW, Storlien LH, et al. Role of weight loss and polyunsaturated fatty acids in improving metabolic fitness in moderately obese, moderately hypertensive subjects. Journal of Hypertension 2001;19(10):1745-54. [DOI] [PubMed] [Google Scholar]
Kris 1994 {published data only}
- Kris EP, Mustad VA. Chocolate feeding studies: a novel approach for evaluating the plasma lipid effects of stearic acid. American Journal of Clinical Nutrition 1994;60(6 Suppl):1029S-36S. [DOI] [PubMed] [Google Scholar]
Kristal 1997 {published data only}
- Kristal AR, Shattuck AL, Bowen DJ, Sponzo RW, Nixon DW. Feasibility of using volunteer research staff to deliver and evaluate a low-fat dietary intervention: the American Cancer Society Breast Cancer Dietary Intervention Project. Cancer Epidemiology, Biomarkers and Prevention 1997;6(6):459-67. [PubMed] [Google Scholar]
Kromhout 1987 {published data only}
- Kromhout D, Arntzenius AC, Kempen-Voogd N, Kempen HJ, Barth JD, Van der Voort HA, et al. Long-term effects of linoleic-acid enriched diet, changes in body weight and alcohol consumption on serum total and HDL-cholesterol. Atherosclerosis 1987;66(1-2):99-105. [DOI] [PubMed] [Google Scholar]
Kummel 2008 {published data only}
- Kummel MV. Effects of an intervention on health behaviors of older coronary artery bypass (CAB) patients. Archives of Gerontology and Geriatrics 2008;2(2):227-44. [DOI] [PubMed] [Google Scholar]
Laitinen 1993 {published data only}
- Laitinen JH, Ahola IE, Sarkkinen ES, Winberg RL, Harmaakorpi IP, Uusitupa MI. Impact of intensified dietary therapy on energy and nutrient intakes and fatty acid composition of serum lipids in patients with recently diagnosed non-insulin-dependent diabetes mellitus. Journal of the American Dietetic Association 1993;93(3):276-83. [DOI] [PubMed] [Google Scholar]
Laitinen 1994 {published data only}
- Laitinen J, Uusitupa M, Ahola I, Siitonen O. Metabolic and dietary determinants of serum lipids in obese patients with recently diagnosed non-insulin-dependent diabetes. Annals of Medicine 1994;26(2):119-24. [DOI] [PubMed] [Google Scholar]
Lean 1997 {published and unpublished data}
- Han TS, Richmond P, Avenell A, Lean ME. Waist circumference reduction and cardiovascular benefits during weight loss in women. International Journal of Obesity and Related Metabolic Disorders 1997;21(2):127-34. [DOI] [PubMed] [Google Scholar]
- Lean ME, Han TS, Prvan T, Richmond PR, Avenell A. Weight loss with high and low carbohydrate 1200 kcal diets in free living women. European Journal of Clinical Nutrition 1997;51(4):243-8. [DOI] [PubMed] [Google Scholar]
Leduc 1994 {published data only}
- Leduc CP, Cherniak D, Faucher J. Effectiveness of a group dietary intervention on hypercholesterolaemia: a randomised controlled clinical trial [poster abstract]. Atherosclerosis 1994;19:149. [Google Scholar]
Lewis 1958 {published data only}
- Lewis B. Effect of certain dietary oils on bile-acid secretion and serum-cholesterol. Lancet 1958;1(7030):1090-2. [DOI] [PubMed] [Google Scholar]
Lewis 1981 {published data only}
- Lewis B, Hammett F, Katan M, Kay RM, Merkx I, Nobels A, et al. Towards an improved lipid-lowering diet: additive effects of changes in nutrient intake. Lancet 1981;2(8259):1310-3. [DOI] [PubMed] [Google Scholar]
Lewis 1985 {published data only}
- Lewis B. Randomised controlled trial of the treatment of hyperlipidaemia on progression of atherosclerosis. Acta Medica Scandinavica 1985;701(Suppl):53-7. [DOI] [PubMed] [Google Scholar]
Lichtenstein 2002 {published data only}
- Lichtenstein AH, Ausman LM, Jalbert SM, Vilella-Bach M, Jauhiainen M, McGladdery S, et al. Efficacy of a therapeutic lifestyle change/step 2 diet in moderately hypercholesterolemic middle-aged and elderly female and male subjects. Journal of Lipid Research 2002;43(2):264-73. [PubMed] [Google Scholar]
Lim 2010 {published data only}
- Lim SS, Noakes M, Keogh JB, Clifton PM. Long-term effects of a low carbohydrate, low fat or high unsaturated fat diet compared to a no-intervention control. Nutrition, Metabolism, and Cardiovascular Diseases 2010;20(8):599-607. [DOI] [PubMed] [Google Scholar]
Linko 1957 {published data only}
- Linko E. Vegetable oils and serum cholesterol: short-term experiments with rapeseed and sunflower oils. Acta Medica Scandinavica 1957;159(6):475-88. [PubMed] [Google Scholar]
Lipid Res Clinic 1984 {published data only}
- Gordon DJ, Salz KM, Roggenkamp KJ. Dietary determinants of plasma cholesterol change in the recruitment phase of the Lipid Research Clinics Coronary Primary Prevention Trial. Arteriosclerosis 1982;2(6):537-48. [DOI] [PubMed] [Google Scholar]
- Lipid Research Clinics. The Lipid Research Clinics Coronary Primary Prevention Trial results. I. Reduction in incidence of coronary heart disease. JAMA 1984;251(3):351-64. [DOI] [PubMed] [Google Scholar]
- Lipid Research Clinics. The Lipid Research Clinics Coronary Primary Prevention Trial results. II. The relationship of reduction in incidence of coronary heart disease to cholesterol lowering. JAMA 1984;251(3):365-74. [PubMed] [Google Scholar]
Little 1990 {published data only}
- Little P, Girling G, Hasler A, Craven A, Trafford A. The effect of a combination low sodium, low fat, high fibre diet on serum lipids in treated hypertensive patients. European Journal of Clinical Nutrition 1990;44(4):293-300. [PubMed] [Google Scholar]
Little 2004 {published data only}
- Little P, Kelly J, Barnett J, Dorward M, Margetts B, Warm D, et al. Randomised controlled factorial trial of dietary advice for patients with a single high blood pressure reading in primary care. BMJ 2004;328(7447):1054. [DOI] [PMC free article] [PubMed] [Google Scholar]
Lottenberg 1996 {published data only}
- Lottenberg AM, Nunes VS, Lottenberg SA, Shimabukuro AF, Carrilho AJ, Malagutti S, et al. Plasma cholesteryl ester synthesis, cholesteryl ester transfer protein concentration and activity in hypercholesterolemic women: effects of the degree of saturation of dietary fatty acids in the fasting and postprandial states. Atherosclerosis 1996;126(2):265-75. [DOI] [PubMed] [Google Scholar]
Luszczynska 2007 {published data only}
- Luszczynska A, Scholz U, Sutton S. Planning to change diet: a controlled trial of an implementation intentions training intervention to reduce saturated fat intake among patients after myocardial infarction. Journal of Psychosomatic Research 2007;63(5):491-7. [DOI] [PubMed] [Google Scholar]
Lyon Diet Heart 1994 {published data only}
- De Lorgeril M, Renaud S, Mamelle N, Salen P, Martin JL, Monjaud I, et al. Mediterranean alpha-linolenic acid-rich diet in secondary prevention of coronary heart disease. Lancet 1994;343(8911):1454-9. [DOI] [PubMed] [Google Scholar]
- De Lorgeril M, Salen P, Caillat-Vallet E, Hanauer M-T, Barthelemy JC, Mamelle N. Control of bias in dietary trial to prevent coronary recurrences: the Lyon Diet Heart study. European Journal of Clinical Nutrition 1997;51(2):116-22. [DOI] [PubMed] [Google Scholar]
- De Lorgeril M, Salen P, Martin J-L, Monjaud I, Delaye J, Mamelle N. Mediterranean diet, traditional risk factors, and the rate of cardiovascular complications after myocardial infarction: final report of the Lyon Diet Heart study. Circulation 1999;99(6):779-85. [DOI] [PubMed] [Google Scholar]
- De Lorgeril M, Salen P, Martin JL, Mamelle N, Monjaud I, Touboul P, et al. Effect of a Mediterranean type of diet on the rate of cardiovascular complications in patients with coronary artery disease. insights into the cardioprotective effect of certain nutriments. Journal of the American College of Cardiology 1996;28(5):1103-8. [DOI] [PubMed] [Google Scholar]
- De Lorgeril M, Salen P, Martin JL, Monjaud I, Boucher P, Mamelle N. Mediterranean dietary pattern in a randomised trial. Archives of Internal Medicine 1998;158(11):1181-7. [DOI] [PubMed] [Google Scholar]
- De Lorgeril M, Salen P. Mediterranean diet in secondary prevention of coronary heart disease. Australian Journal of Nutrition and Dietetics 1998;55(Suppl):s16-s20. [Google Scholar]
- Renaud S, De Lorgeril M, Delaye J, Guidollet J, Jacquard F, Mamelle N, et al. Cretan Mediterranean diet for prevention of coronary heart disease. American Journal of Clinical Nutrition 1995;61(6 Suppl):1360S-7S. [DOI] [PubMed] [Google Scholar]
Lysikova 2003 {published data only}
- Lysikova SL, Pogozheva AV, Akol'zina SE, Vasil'ev AV, Vorob'eva LS. The study of the clinical potency of antiatherogenic diet containing flavonoids in cardiovascular patients. Voprosy Pitaniia 2003;72(3):8-11. [PubMed] [Google Scholar]
Macdonald 1972 {published data only}
- Macdonald I. Relationship between dietary carbohydrates and fats in their influence on serum lipid concentrations. Clinical Science 1972;43(2):265-74. [DOI] [PubMed] [Google Scholar]
Mansel 1990 {published data only}
- Mansel RE, Harrison BJ, Melhuish J, Sheridan W, Pye JK, Pritchard G, et al. A randomized trial of dietary intervention with essential fatty acids in patients with categorized cysts. Annals of the New York Academy of Sciences 1990;586:288-94. [DOI] [PubMed] [Google Scholar]
MARGARIN 2002 {published data only}
- Bemelmans WJ, Broer J, Feskens EJ, Smit AJ, Muskiet FA, Lefrandt JD, et al. Effect of an increased intake of alpha-linolenic acid and group nutritional education on cardiovascular risk factors: the Mediterranean Alpha-linolenic Enriched Groningen Dietary Intervention (MARGARIN) study. American Journal of Clinical Nutrition 2002;75(2):221-7. [DOI] [PubMed] [Google Scholar]
Marniemi 1990 {published and unpublished data}
- Hakala P, Karvetti RL. Weight reduction on lactovegetarian and mixed diets. European Journal of Clinical Nutrition 1989;43(6):421-30. [PubMed] [Google Scholar]
- Marniemi J, Seppanen A, Hakala P. Long-term effects on lipid metabolism of weight reduction on lactovegetarian and mixed diet. International Journal of Obesity 1990;14(2):113-25. [PubMed] [Google Scholar]
Mattson 1985 {published data only}
- Mattson FH, Grundy SM. Comparison of effects of dietary saturated, monounsaturated and polyunsaturated fatty acids on plasma lipids and lipoproteins in man. Journal of Lipid Research 1985;26(2):194-202. [PubMed] [Google Scholar]
McAuley 2005 {published and unpublished data}
- McAuley KA, Hopkins CM, Smith KJ, McLay RT, Williams SM, Taylor RW, et al. Comparison of a high-fat and high-protein diets with a high-carbohydrate diet in insulin-resistant obese women. Diabetologia 2005;48:8-16. [DOI] [PubMed] [Google Scholar]
- McAuley KA, Smith KJ, Taylor RW, McLay RT, Williams SM, Mann JI. Long-term effects of popular dietary approaches on weight loss and features of insulin resistance. International Journal of Obesity 2006;30(2):342-9. [DOI] [PubMed] [Google Scholar]
McCarron 1997 {published data only}
- McCarron DA, Oparil S, Chait A, Haynes RB, Kris EP, Stern JS, et al. Nutritional management of cardiovascular risk factors. A randomized clinical trial. Archives of Internal Medicine 1997;157(2):169-77. [PubMed] [Google Scholar]
McCarron 2001 {published data only}
- McCarron DA, Reusser ME. Reducing cardiovascular disease risk with diet. Obesity Research 2001;9(Suppl 4):335S-40S. [DOI] [PubMed] [Google Scholar]
McKeown‐Eyssen 1994 {published and unpublished data}
- McKeown-Eyssen GE, Bright SE, Bruce WR, Jazmaji V. A randomized trial of a low fat high fibre diet in the recurrence of colorectal polyps. Journal of Clinical Epidemiology 1994;47(5):525-36. [DOI] [PubMed] [Google Scholar]
McManus 2001 {published and unpublished data}
- McManus K, Antinoro L, Sacks F. Randomized controlled trial of a moderate-fat low-energy diet compared with a low fat, low-energy diet for weight loss in overweight adults. International Journal of Obesity and Related Metabolic Disorders 2001;25(10):1503-11. [DOI] [PubMed] [Google Scholar]
McNamara 1981 {published data only}
- McNamara DJ, Kolb R, Parker T, Batwin H, Brown C, Samuel P, et al. Diet and cholesterol homeostasis in men [abstract]. Arteriosclerosis 1981;1:369A. [Google Scholar]
MeDiet 2002 {published and unpublished data}
- Carruba G, Granata OM, Pala V, Campisi I, Agostara B, Cusimano R, et al. A traditional Mediterranean diet decreases endogenous estrogens in healthy postmenopausal women. Nutrition and Cancer 2006;56(2):253-9. [DOI] [PubMed] [Google Scholar]
- Castagnetta L, Granata OM, Cusimano R, Ravazzolo B, Liquori M, Polito L, et al. The Mediet Project. Annals of the New York Academy of Science 2002;963:282-9. [DOI] [PubMed] [Google Scholar]
- Granata OM, Traina A, Ramirez S, Campisi I, Zarcone M, Amodio R, et al. Dietary enterolactone affects androgen and estrogen levels in healthy postmenopausal women. Annals of the New York Academy of Science 2009;1155:232-6. [DOI] [PubMed] [Google Scholar]
MEDINA {published data only}
- Papamiltiadous ES, Roberts SK, Nicoll AJ, Ryan MC, Itsiopoulos C, Salim A, et al. A randomised controlled trial of a Mediterranean Dietary Intervention for Adults with Non Alcoholic Fatty Liver Disease (MEDINA): study protocol. BMC Gastroenterology 2016;16:14. [DOI] [PMC free article] [PubMed] [Google Scholar]
Medi‐RIVAGE 2004 {published and unpublished data}
- Borel P, Moussa M, Reboul E, Lyan B, Defoort C, Vincent-Baudry S, et al. Human fasting plasma concentrations of vitamin E and carotenoids, and their association with genetic variants in apo C-III, cholesteryl ester transfer protein, hepatic lipase, intestinal fatty acid binding protein and microsomal triacylglycerol transfer protein. British Journal of Nutrition 2009;101(5):680-7. [DOI] [PubMed] [Google Scholar]
- Borel P, Moussa M, Reboul E, Lyan B, Defoort C, Vincent-Baudry S, et al. Human plasma levels of vitamin E and carotenoids are associated with genetic polymorphisms in genes involved in lipid metabolism. Journal of Nutrition 2007;137(12):2653-9. [DOI] [PubMed] [Google Scholar]
- Gastaldi M, Diziere S, Defoort C, Portugal H, Lairon D, Darmon M, et al. Sex-specific association of fatty acid binding protein 2 and microsomal triacylglycerol transfer protein variants with response to dietary lipid changes in the 3-mo Medi-RIVAGE primary intervention study. American Journal of Clinical Nutrition 2007;86(6):1633-41. [DOI] [PubMed] [Google Scholar]
- Vincent S, Gerber M, Bernard MC, Defoort C, Loundou A, Portugal H, et al. The Medi-RIVAGE study (Mediterranean Diet, Cardiovascular Risks and Gene Polymorphisms): rationale, recruitment, design, dietary intervention and baseline characteristics of participants. Public Health Nutrition 2004;7(4):531-42. [DOI] [PubMed] [Google Scholar]
- Vincent-Baudry S, Defoort C, Gerber M, Bernard MC, Verger P, Helal O, et al. The Medi-RIVAGE study: reduction of cardiovascular disease risk factors after a 3-mo intervention with a Mediterranean-type diet or a low-fat diet. American Journal of Clinical Nutrition 2005;82(5):964-71. [DOI] [PubMed] [Google Scholar]
Mensink 1987 {published data only}
- Mensink RP, Katan MB. Effect of monounsaturated fatty acids versus complex carbohydrates on high-density lipoproteins in healthy men and women. Lancet 1987;1(8525):122-5. [DOI] [PubMed] [Google Scholar]
Mensink 1989 {published data only}
- Mensink RP, Katan MB. Effect of a diet enriched with monounsaturated or polyunsaturated fatty acids on levels of low density and high density lipoprotein cholesterol in healthy women and men. New England Journal of Medicine 1989;321(7):436-41. [DOI] [PubMed] [Google Scholar]
Mensink 1990a {published data only}
- Mensink RP, Katan MB. Effect of dietary trans fatty acids on high density and low density lipoprotein cholesterol levels in healthy subjects. New England Journal of Medicine 1990;323(7):439-45. [DOI] [PubMed] [Google Scholar]
Mensink 1990b {published and unpublished data}
- Mensink RP. Effect of Monounsaturated Fatty Acids on High-Density and Low-Density Lipoprotein Cholesterol Levels and Blood Pressure in Healthy Men and Women. Wageningen, Netherlands: Wageningen University and Research Centre, 1990. [Google Scholar]
Metroville Health 2003 {published data only (unpublished sought but not used)}
- Aziz KU, Dennis B, Davis CE, Sun K, Burke G, Manolio T, et al. Efficacy of CVD risk factor modification in a lower-middle class community in Pakistan: the Metroville Health Study. Asia Pacific Journal of Public Health 2003;15(1):30-6. [DOI] [PubMed] [Google Scholar]
Michalsen 2006 {published and unpublished data}
- Michalsen A, Lehmann N, Pithan C, Knoblauch NT, Moebus S, Kannenberg F, et al. Mediterranean diet has no effect on markers of inflammation and metabolic risk factors in patients with coronary artery disease. European Journal of Clinical Nutrition 2006;60(4):478-85. [DOI] [PubMed] [Google Scholar]
Miettinen 1994 {published data only}
- Miettinen TA, Vanhanen H. Dietary sitostanol related to absorption, synthesis and serum level of cholesterol in different apolipoprotein E phenotypes. Atherosclerosis 1994;105(2):217-26. [DOI] [PubMed] [Google Scholar]
Millar 1973 {published data only}
- Millar JH, Zilkha KJ, Langman MJ, Payling-Wright H, Smith AD, Belin J, et al. Double-blind trial of linoleate supplementation of the diet in multiple sclerosis. BMJ 1973;1(5856):765-8. [DOI] [PMC free article] [PubMed] [Google Scholar]
Miller 1998 {published data only}
- Miller ER, Appel LJ, Risby TH. Effect of dietary patterns on measures of lipid peroxidation: results from a randomised clinical trial. Circulation 1998;98(22):2390-5. [DOI] [PubMed] [Google Scholar]
Miller 2001 {published and unpublished data}
- Miller SL, Reber RJ, Chapman-Novakofski K. Prevalence of CVD risk factors and impact of a two-year education program for premenopausal women. Women's Health Issues 2001;11(6):486-93. [DOI] [PubMed] [Google Scholar]
Milne 1994 {published data only}
- Milne RM, Mann JI, Chisholm AW, Williams SM. Long-term comparison of three dietary prescriptions in the treatment of NIDDM. Diabetes Care 1994;17(1):74-80. [DOI] [PubMed] [Google Scholar]
Minnesota Coronary 1989 {published data only}
- Brewer ER, Ashman PL, Kuba K. The Minnesota Coronary Survey: composition of diets, adherence and serum lipid response [Abstract]. Circulation 1975;51 and 52(Suppl II):269. [Google Scholar]
- Dawson EA, Gatewood LC. The Minnesota Coronary Survey: methodology and characteristics of the population [Abstract]. Circulation 1975;51 and 52(Suppl II):271. [Google Scholar]
- Frantz ID Jr, Dawson EA, Ashman PL, Gatewood LC, Bartsch GE, Kuba K, et al. Test of effect of lipid lowering by diet on cardiovascular risk. The Minnesota Coronary Survey. Arteriosclerosis 1989;9(1):129-35. [DOI] [PubMed] [Google Scholar]
- Frantz ID Jr, Dawson EA, Kuba K, Brewer ER, Gatewood LC, Bartsch GE. The Minnesota Coronary Survey: effect of diet on cardiovascular events and deaths [abstract]. Circulation 1975;51 and 52(Suppl II):4. [DOI] [PubMed] [Google Scholar]
Minnesota HHP 1990 {published data only}
- Murray DM, Kurth C, Mullis R, Jeffery RW. Cholesterol reduction through low-intensity interventions: results from the Minnesota Heart Health Program. Preventive Medicine 1990;19(2):181-9. [DOI] [PubMed] [Google Scholar]
Mojonnier 1980 {published data only}
- Mojonnier ML, Hall Y, Berkson DM, Robinson E, Wethers B, Pannbacker B, et al. Experience in changing food habits of hyperlipidaemic men and women. Journal of the American Dietetic Association 1980;77(2):140-8. [PubMed] [Google Scholar]
Mokuno 1988 {published data only}
- Mokuno H, Yamada N, Sugimoto T. Cholesterol free diet in heterozygous familial hypercholesterolaemia: significant lowering effect on plasma cholesterol (abstract). Arteriosclerosis 1988;8(5):590a. [DOI] [PubMed] [Google Scholar]
Mortensen 1983 {published data only}
- Mortensen JZ, Schmidt EB, Nielsen AH, Dyerberg J. The effect of N-6 and N-3 polyunsaturated fatty acids on hemostasis, blood lipids and blood pressure. Thrombosis and Haemostasis 1983;50(2):543-6. [PubMed] [Google Scholar]
Mottalib 2018 {published data only}
- Mottalib A, Mitri J, Salsberg V, Ashrafzadeh S, Elseaidy T, Tomah S, et al. Effect of dairy consumption and Its fat content on glycemic control and cardiovascular risk factors in patients with type 2 diabetes — a randomized controlled study. Diabetes 2018;67(Suppl 1):760-P. [DOI] [PMC free article] [PubMed] [Google Scholar]
MRFIT substudy 1986 {published data only}
- Daniel GJ, Dolecek TA, Caggiula AW, Van Horn LV, Epley L, Randall BL. Increasing the use of meatless meals: a nutrition intervention substudy in the Multiple Risk Factor Intervention Trial (MRFIT). Journal of the American Dietetic Association 1986;86(6):778-81. [PubMed] [Google Scholar]
MSDELTA 1995 {published data only}
- Ginsberg HN. New directions in dietary studies and heart disease: the National Heart, Lung and Blood Institute sponsored multicenter study of diet effects on lipoproteins and thrombogenic activity. Advances In Experimental Medicine and Biology 1995;369:241-7. [DOI] [PubMed] [Google Scholar]
MSFAT 1997 {published and unpublished data}
- Van het Hoff K, Weststrate JA, Van den Berg H, Velthuis-te Wierik EJ, De Graaf C, Zimmermanns NJ, et al. A long-term study on the effect of spontaneous consumption of reduced fat products as part of a normal diet on indicators of health. International Journal of Food Sciences and Nutrition 1997;48(1):19-29. [DOI] [PubMed] [Google Scholar]
- Velthuis-te Wierik EJ, Van Leeuwen RE, Hendriks HF, Verhagen H, Loft S, Poulsen HE, et al. Short-term moderate energy restriction does not affect indicators of oxidative stress and genotoxicity in humans. Journal of Nutrition 1995;125(10):2631-9. [DOI] [PubMed] [Google Scholar]
- Velthuis-te Wierik EJ, Van den Berg H, Weststrate JA, Van het Hoff KH, De Graaf C. Consumption of reduced-fat products: effects on parameters of anti-oxidative capacity. European Journal of Clinical Nutrition 1996;50(4):214-9. [PubMed] [Google Scholar]
- Weststrate JA, Van het Hof KH, Van den Berg H, Velthuis-te Wierik EJ, De Graaf C, Zimmermanns NJ, et al. A comparison of the effect of free access to reduced fat products or their full fat equivalents on food intake, body weight, blood lipids and fat-soluble antioxidants levels and haemostasis variables. European Journal of Clinical Nutrition 1998;52(6):389-95. [DOI] [PubMed] [Google Scholar]
Mujeres Felices 2003 {published data only}
- Fitzgibbon ML, Gapstur SM, Knight SJ. Mujeres felices por ser saludables: a breast cancer risk reduction program for Latino women. Preventive Medicine 2003;36(5):536-46. [DOI] [PubMed] [Google Scholar]
- Fitzgibbon ML, Gapstur SM, Knight SJ. Results of Mujeres Felices por ser Saludables: a dietary/breast health randomized clinical trial for Latino women. Annals of Behavioral Medicine 2004;28(2):95-104. [DOI] [PubMed] [Google Scholar]
Mutanen 1997 {published data only}
- Mutanen M. Comparison between dietary monounsaturated and polyunsaturated fatty acids as regards diet-related diseases. Biomedicine and Pharmacotherapy 1997;51(8):314-7. [DOI] [PubMed] [Google Scholar]
Muzio 2007 {published data only}
- Muzio F, Mondazzi L, Harris WS, Sommariva D, Branchi A. Effects of moderate variations in the macronutrient content of the diet on cardiovascular disease risk factors in obese patients with the metabolic syndrome. American Journal of Clinical Nutrition 2007;86(4):946-51. [DOI] [PubMed] [Google Scholar]
Naglak 2000 {published data only (unpublished sought but not used)}
- Naglak MC, Mitchell DC, Shannon BM, Pearson TA, Harkness WL, Kris-Etherton PM. Nutrient adequacy of diets of adults with hypercholesterolemia after a cholesterol-lowering intervention: long term assessment. Journal of the American Dietetic Association 2000;100(11):1385-91. [DOI] [PubMed] [Google Scholar]
NAS 1987 {published data only}
- Chlebowski RT, Nixon DW, Blackburn GL, Jochimsen P, Scanlon EF, Insull W, et al. A breast cancer Nutrition Adjuvant Study (NAS): protocol design and initial patient adherence. Breast Cancer Research and Treatment 1987;10(1):21-9. [DOI] [PubMed] [Google Scholar]
National Diet Heart 1968 {published data only}
- Baker BM, Frantz ID Jr, Keys A, Kinsell LW, Page IH, Stamler J, et al. The National Diet-Heart Study: an initial report. JAMA 1963;185:105-6. [DOI] [PubMed] [Google Scholar]
- Brown HB. The National Diet Heart Study - implications for dietitians and nutritionists. Journal of the American Dietetic Association 1968;52(4):279-87. [PubMed] [Google Scholar]
- Page IH, Brown HB. Some observations on the National Diet-Heart Study. Circulation 1968;37(3):313-5. [DOI] [PubMed] [Google Scholar]
- The National Diet-Heart Study Research Group. The National Diet-Heart Study final report. Circulation 1968;37(II):1-428. [PubMed] [Google Scholar]
- The National Diet-Heart Study Research Group. The National Diet-Heart Study. Nutrition Reviews 1968;26(5):133-6. [DOI] [PubMed] [Google Scholar]
NCEP weight 1991 {published and unpublished data}
- Wood PD, Stefanick ML, Williams PT, Haskell WL. The effects on plasma lipoproteins of a prudent weight-reducing diet, with or without exercise, in overweight men and women. New England Journal of Medicine 1991;325(7):461-6. [DOI] [PubMed] [Google Scholar]
NCT01954472 {published data only}
- NCT01954472. Enhanced multicenter dietary portfolio study (EDP8). clinicaltrials.gov/ct2/show/NCT01954472 (first posted 1 October 2013).
NCT03068078 {published data only}
- NCT03068078. A reduced-carbohydrate diet high in monounsaturated fats in type 2 diabetes (ReDuCtion). clinicaltrials.gov/ct2/show/NCT03068078 (first posted 1 March 2017).
Neil 1995 {published data only}
- Neil HA, Roe L, Godlee RJ, Moore JW, Clark GM, Brown J, et al. Randomised trial of lipid lowering dietary advice in general practice: the effects on serum lipids, lipoproteins, and antioxidants [see comments]. BMJ 1995;310(6979):569-73. [DOI] [PMC free article] [PubMed] [Google Scholar]
Neverov 1997 {published data only}
- Neverov NI, Kaysen GA, Tareyeva IE. Effect of lipid-lowering therapy on the progression of renal disease in nondiabetic nephrotic patients. Contributions to Nephrology 1997;120:68-78. [DOI] [PubMed] [Google Scholar]
Next Step 1995 {published and unpublished data}
- Tilley BC, Vernon SW, Glanz K, Myers R, Sanders K, Lu M, et al. Worksite cancer screening and nutrition intervention for high-risk auto workers: design and baseline findings of the Next Step Trial. Preventive Medicine 1997;26(2):227-35. [DOI] [PubMed] [Google Scholar]
- Tilley BC, Vernon SW, Myers R, Glanz K, Lu M, Sanders K, et al. Planning the next step. A screening promotion and nutrition intervention trial in the work site. Annals of the New York Academy of Sciences 1995;768:296-9. [DOI] [PubMed] [Google Scholar]
Nordoy 1971 {published data only}
- Nordoy A, Rodset JM. The influence of dietary fats on platelets in man. Acta Medica Scandinavica 1971;190(1-2):27-34. [PubMed] [Google Scholar]
Norway Veg Oil 1968 {published data only}
- Natvig H, Borchgrevink CF, Dedichen J, Owren PA, Schiotz EH, Westlund K. A controlled trial of the effect of linolenic acid on incidence of coronary heart disease: the Norwegian Vegetable Oil Experiment of 1965-66. Scandinavian Journal of Clinical and Laboratory Investigation 1968;105(Suppl):1-20. [PubMed] [Google Scholar]
Nutri‐AGEs 2015 {published data only}
- NCT02353416. Effect of low-glycemic index Mediterranean diet on ages (Nutri_AGEs). clinicaltrials.gov/ct2/show/NCT02353416 (first posted 2 February 2015).
Nutrition Breast Health {published and unpublished data}
- Djuric Z, Poore KM, Depper JB, Uhley VE, Lababidi S, Covington C, et al. Methods to increase fruit and vegetable intake with and without a decrease in fat intake: compliance and effects on body weight in the Nutrition and Breast Health Study. Nutrition and Cancer 2002;43(2):141-51. [DOI] [PubMed] [Google Scholar]
O'Brien 1976 {published data only}
- O'Brien JR, Etherington MD, Jamieson S. Effect of a diet of polyunsaturated fats on some platelet-function tests. Lancet 1976;2(7993):995-6. [DOI] [PubMed] [Google Scholar]
ODES 2006 {published data only}
- Anderssen S, Holme I, Urdal P, Hjermann I. Diet and exercise intervention have favourable effects on blood pressure in mild hypertensives: the Oslo Diet and Exercise Study (ODES). Blood Pressure 1995;4(6):343-9. [DOI] [PubMed] [Google Scholar]
- Anderssen SA, Hjermann I, Urdal P, Torjesen PA, Holme I. Improved carbohydrate metabolism after physical training and dietary intervention in individuals with the "atherothrombogenic syndrome". Oslo Diet and Exercise Study (ODES). A randomized trial. Journal of Internal Medicine 1996;240(4):203-9. [DOI] [PubMed] [Google Scholar]
- Holme I, Haaheim LL, Tonstad S, Hjermann I, Holme I, Haaheim LL, et al. Effect of dietary and antismoking advice on the incidence of myocardial infarction: a 16-year follow-up of the Oslo Diet and Antismoking Study after its close. Nutrition Metabolism & Cardiovascular Diseases 2006;16(5):330-8. [DOI] [PubMed] [Google Scholar]
- ODES Investigators. The Oslo Diet and Exercise Study (ODES): design and objectives. Controlled Clinical Trials 1993;14(3):229-43. [DOI] [PubMed] [Google Scholar]
- Rokling-Andersen MH, Reseland JE, Veierod MB, Anderssen SA, Jacobs DR Jr, Urdal P, et al. Effects of long-term exercise and diet intervention on plasma adipokine concentrations. American Journal of Clinical Nutrition 2007;86(5):1293-301. [DOI] [PubMed] [Google Scholar]
- Torjesen PA, Birkeland KI, Anderssen SA, Hjermann I, Holme I, Urdal P. Lifestyle changes may reverse development of the insulin resistance syndrome. The Oslo Diet and Exercise Study: a randomized trial. Diabetes Care 1997;20(1):26-31. [DOI] [PubMed] [Google Scholar]
Oldroyd 2001 {published data only}
- Oldroyd JC, Unwin NC, White M, Mathers JC, Alberti KG. Randomised controlled trial evaluating lifestyle interventions in people with impaired glucose tolerance. Diabetes Research & Clinical Practice 2006;72(2):117-27. [DOI] [PubMed] [Google Scholar]
- Oldroyd JC. Randomised controlled trial evaluating the effectiveness of behavioural interventions to modify cardiovascular risk factors in men and women with impaired glucose tolerance: outcomes at 6 months. Diabetes Research and Clinical Practice 2001;52(1):29-43. [DOI] [PubMed] [Google Scholar]
Ole Study 2002 {published and unpublished data}
- Bray GA, Lovejoy JC, Most-Windhauser M, Smith SR, Volaufova J, Denkins Y, et al. A 9-mo randomized clinical trial comparing fat-substituted and fat-reduced diets in healthy obese men: the Ole Study. American Journal of Clinical Nutrition 2002;76(5):928-34. [DOI] [PubMed] [Google Scholar]
- Lovejoy JC, Bray GA, Lefevre M, Smith SR, Most MM, Denkins YM, et al. Consumption of a controlled low-fat diet containing olestra for 9 months improves health risk factors in conjunction with weight loss in obese men: the Ole Study. International Journal of Obesity and Related Metabolic Disorders 2003;27(10):1242-9. [DOI] [PubMed] [Google Scholar]
OLIVE 1997 {published data only (unpublished sought but not used)}
- Colquhoun DM, Somerset S, Glasziou PP, Richards D, Weyers J. Comparison of an olive oil enriched diet to a low fat diet intervention study using vascular endpoints: assessed by repeat quantitative angiography (OLIVE study). Australian Journal of Nutrition and Dietetics 1998;55(Suppl 4):S24-9. [Google Scholar]
- Colquhoun DM. Rationale and design of the "OLIVE" study (Comparison of an Olive oil enriched to a low fat diet intervention study using vascular endpoints) [Abstract]. In: 11th International Symposium on Atherosclerosis; 1997 October; Paris. 1997:326.
ORIGIN 2008 {published data only}
- Gerstein H, Yusuf S, Riddle MC, Ryden L, Bosch J. Rationale, design, and baseline characteristics for a large international trial of cardiovascular disease prevention in people with dysglycemia: the ORIGIN Trial (Outcome Reduction with an Initial Glargine Intervention). American Heart Journal 2008;155(1):26-32. [DOI] [PubMed] [Google Scholar]
Oslo Study 2004 {published data only}
- Hjerkinn EM, Sandvik L, Hjermann I, Arnesen H. Effect of diet intervention on long-term mortality in healthy middle-aged men with combined hyperlipidaemia. Journal of Internal Medicine 2004;255(1):68-73. [DOI] [PubMed] [Google Scholar]
- Hjermann I, Leren P, Norman N, Helgeland A, Holme I. Serum insulin response to oral glucose load during a dietary intervention trial in healthy coronary high risk men: the Oslo study. Scandinavian Journal of Clinical and Laboratory Investigation 1980;40(1):89-94. [DOI] [PubMed] [Google Scholar]
- Hjermann I, Velve BK, Holme I, Leren P. Effect of diet and smoking intervention on the incidence of coronary heart disease. Report from the Oslo Study Group of a randomised trial in healthy men. Lancet 1981;2(8259):1303-10. [DOI] [PubMed] [Google Scholar]
- Hjermann I. Intervention of smoking and eating habits in healthy men carrying high risk for coronary heart disease. The Oslo Study. Acta Medica Scandinavica 1981;651(Suppl):281-4. [DOI] [PubMed] [Google Scholar]
- Hjermann I. Smoking and diet intervention in healthy coronary high risk men. Methods and 5-year follow-up of risk factors in a randomized trial. The Oslo study. Journal of the Oslo City Hospitals 1980;30(1):3-17. [PubMed] [Google Scholar]
Pascale 1995 {published data only}
- Pascale RW, Wing RR, Butler BA, Mullen M, Bononi P. Effects of a behavioral weight loss program stressing calorie restriction versus calorie plus fat restriction in obese individuals with NIDDM or a family history of diabetes. Diabetes Care 1995;18(9):1241-8. [DOI] [PubMed] [Google Scholar]
PEP 2001 {published data only}
- Ohrig E, Geib HC, Haas G-M, Schwandt P. The prevention education program (PEP) Nuremberg: design and baseline data of a family oriented intervention study. International Journal of Obesity 2001;25(Suppl 1):S89-92. [DOI] [PubMed] [Google Scholar]
PHYLLIS 1993 {published data only}
- Bond GM, Crepaldi G, Zanchetti A, Avogaro P, Marubini E, Maseri A, et al. Plaque hypertension lipid-lowering Italian study (PHYLLIS): a protocol for non-invasive evaluation of carotid atherosclerosis in hypercholesterolaemic hypertensive subjects. Journal of Hypertension 1993;11(Suppl 5):S314-5. [PubMed] [Google Scholar]
Pilkington 1960 {published and unpublished data}
- Pilkington TR, Stafford JL, Hankin VS, Simmonds FM, Koerselman HB. Practical diets for lowering serum lipids. British Medical Journal 1960;1(5165):23-5. [DOI] [PMC free article] [PubMed] [Google Scholar]
Polyp Prevention 1996 {published and unpublished data}
- Lanza E, Schatzkin A, Ballard BR, Clifford DC, Paskett E, Hayes D, et al. The polyp prevention trial II: dietary intervention program and participant baseline dietary characteristics. Cancer Epidemiology, Biomarkers and Prevention 1996;5(5):385-92. [PubMed] [Google Scholar]
- Schatzkin A, Lanza E, Freedman LS, Tangrea J, Cooper MR, Marshall JR, et al. The polyp prevention trial I: rationale, design, recruitment, and baseline participant characteristics. Cancer Epidemiology, Biomarkers and Prevention 1996;5(5):375-83. [PubMed] [Google Scholar]
POUNDS LOST 2009 {published and unpublished data}
- Anton SD, Gallagher J, Carey VJ, Laranjo N, Cheng J, Champagne CM, et al. Diet type and changes in food cravings following weight loss: findings from the POUNDS LOST Trial. Eating & Weight Disorders 2012;17(2):e101-8. [DOI] [PMC free article] [PubMed] [Google Scholar]
- Anton SD, LeBlanc E, Allen HR, Karabetian C, Sacks F, Bray G, et al. Use of a computerized tracking system to monitor and provide feedback on dietary goals for calorie-restricted diets: the POUNDS LOST study. Journal of Diabetes Science & Technology 2012;6(5):1216-25. [DOI] [PMC free article] [PubMed] [Google Scholar]
- Bray GA, Smith SR, DeJonge L, De Souza R, Rood J, Champagne CM, et al. Effect of diet composition on energy expenditure during weight loss: the POUNDS LOST Study. International Journal of Obesity 2012;36(3):448-55. [DOI] [PMC free article] [PubMed] [Google Scholar]
- De Jonge L, Bray GA, Smith SR, Ryan DH, De Souza RJ, Loria CM, et al. Effect of diet composition and weight loss on resting energy expenditure in the POUNDS LOST study. Obesity 2012;20(12):2384-9. [DOI] [PMC free article] [PubMed] [Google Scholar]
- De Souza RJ, Bray GA, Carey VJ, Hall KD, LeBoff MS, Loria CM, et al. Effects of 4 weight-loss diets differing in fat, protein, and carbohydrate on fat mass, lean mass, visceral adipose tissue, and hepatic fat: results from the POUNDS LOST trial. American Journal of Clinical Nutrition 2012;95(3):614-25. [DOI] [PMC free article] [PubMed] [Google Scholar]
- Mattei J, Qi Q, Hu FB, Sacks FM, Qi L, Mattei J, et al. TCF7L2 genetic variants modulate the effect of dietary fat intake on changes in body composition during a weight-loss intervention. American Journal of Clinical Nutrition 2012;96(5):1129-36. [DOI] [PMC free article] [PubMed] [Google Scholar]
- Mirzaei K, Xu M, Qi Q, De Jonge L, Bray GA, Sacks F, et al. Variants in glucose- and circadian rhythm-related genes affect the response of energy expenditure to weight-loss diets: the POUNDS LOST Trial. American Journal of Clinical Nutrition 2014;99(2):392-9. [DOI] [PMC free article] [PubMed] [Google Scholar]
- Nicklas JM, Sacks FM, Smith SR, LeBoff MS, Rood JC, Bray GA, et al. Effect of dietary composition of weight loss diets on high-sensitivity c-reactive protein: the randomized POUNDS LOST trial. Obesity 2013;21(4):681-9. [DOI] [PMC free article] [PubMed] [Google Scholar]
- Qi Q, Bray GA, Hu FB, Sacks FM, Qi L, Qi Q, et al. Weight-loss diets modify glucose-dependent insulinotropic polypeptide receptor rs2287019 genotype effects on changes in body weight, fasting glucose, and insulin resistance: the Preventing Overweight Using Novel Dietary Strategies trial. American Journal of Clinical Nutrition 2012;95(2):506-13. [DOI] [PMC free article] [PubMed] [Google Scholar]
- Qi Q, Bray GA, Smith SR, Hu FB, Sacks FM, Qi L, et al. Insulin receptor substrate 1 gene variation modifies insulin resistance response to weight-loss diets in a 2-year randomized trial: the Preventing Overweight Using Novel Dietary Strategies (POUNDS LOST) trial. Circulation 2011;124(5):563-71. [DOI] [PMC free article] [PubMed] [Google Scholar]
- Qi Q, Xu M, Wu H, Liang L, Champagne CM, Bray GA, et al. IRS1 genotype modulates metabolic syndrome reversion in response to 2-year weight-loss diet intervention: the POUNDS LOST trial. Diabetes Care 2013;36(11):3442-7. [DOI] [PMC free article] [PubMed] [Google Scholar]
- Sacks FM, Bray GA, Carey VJ, Smith SR, Ryan DH, Anton SD, et al. Comparison of weight-loss diets with different compositions of fat, protein, and carbohydrates. New England Journal of Medicine 2009;360(9):859-73. [DOI] [PMC free article] [PubMed] [Google Scholar]
- Williamson DA, Anton SD, Han H, Champagne CM, Allen R, LeBlanc E, et al. Adherence is a multi-dimensional construct in the POUNDS LOST trial. Journal of Behavioral Medicine 2010;33(1):35-46. [DOI] [PMC free article] [PubMed] [Google Scholar]
- Williamson DA, Anton SD, Han H, Champagne CM, Allen R, LeBlanc E, et al. Early behavioral adherence predicts short and long-term weight loss in the POUNDS LOST study. Journal of Behavioral Medicine 2010;33(4):305-14. [DOI] [PMC free article] [PubMed] [Google Scholar]
- Xu M, Qi Q, Liang J, Bray GA, Hu FB, Sacks FM, et al. Genetic determinant for amino acid metabolites and changes in body weight and insulin resistance in response to weight-loss diets: the Preventing Overweight Using Novel Dietary Strategies (POUNDS LOST) trial. Circulation 2013;127(12):1283-9. [DOI] [PMC free article] [PubMed] [Google Scholar]
- Zhang X, Qi Q, Bray GA, Hu FB, Sacks FM, Qi L, et al. APOA5 genotype modulates 2-y changes in lipid profile in response to weight-loss diet intervention: the Pounds Lost Trial. American Journal of Clinical Nutrition 2012;96(4):917-22. [DOI] [PMC free article] [PubMed] [Google Scholar]
- Zhang X, Qi Q, Zhang C, Smith SR, Hu FB, Sacks FM, et al. FTO genotype and 2-year change in body composition and fat distribution in response to weight-loss diets: the POUNDS LOST trial. Diabetes 2012;61(11):3005-11 Erratum in: Diabetes. 2013 Feb;62(2):662; Note: Smith, SR [added]; Bray, GA [added]. [DOI] [PMC free article] [PubMed] [Google Scholar]
PREDIMED 2008 {published data only (unpublished sought but not used)}
- Buil-Cosiales P, Irimia P, Ros E, Riverol M, Gilabert R, Martinez-Vila E, et al. Dietary fibre intake is inversely associated with carotid intima-media thickness: a cross-sectional assessment in the PREDIMED study. European Journal of Clinical Nutrition 2009;63(10):1213-9. [DOI] [PubMed] [Google Scholar]
- Castañer O, Corella D, Covas MI, Sorlí JV, Subirana I, Flores-Mateo G, et al. In vivo transcriptomic profile after a Mediterranean diet in high-cardiovascular risk patients: a randomized controlled trial. American Journal of Clinical Nutrition 2013;98(3):845-53. [DOI] [PubMed] [Google Scholar]
- Díaz-López A, Bulló M, Martínez-González MÁ, Guasch-Ferré M, Ros E, Basora J, et al. Effects of mediterranean diets on kidney function: a report from the PREDIMED trial. American Journal of Kidney Diseases 2012;60(3):380-9. [DOI] [PubMed] [Google Scholar]
- Damasceno NRT, Sala-Vila A, Cofán M, Pérez-Heras AM, Fitó M, Ruiz-Gutiérrez V, et al. Mediterranean diet supplemented with nuts reduces waist circumference and shifts lipoprotein subfractions to a less atherogenic pattern in subjects at high cardiovascular risk. Atherosclerosis 2013;230(2):347-53. [DOI] [PubMed] [Google Scholar]
- Estruch R, Martínez-González MA, Corella D, Salas-Salvadó J, Ruiz-Gutiérrez V, Covas MI, et al. Effects of a Mediterranean-style diet on cardiovascular risk factors: a randomized trial. Annals of Internal Medicine 2006;145(1):1-11. [DOI] [PubMed] [Google Scholar]
- Estruch R, Ros E, Salas-Salvadó J, Corvas M-I, Corella D, Arós F, et al, PREDIMED Study Investigators. Primary prevention of cardiovascular disease with a Mediterranean diet. New England Journal of Medicine 2013;368(14):1279-90. [DOI: 10.1056/NEJMoa1200303] [DOI] [PubMed] [Google Scholar]
- Fernández-Real JM, Bulló M, Moreno-Navarrete JM, Ricart W, Ros E, Estruch R, et al. A Mediterranean diet enriched with olive oil is associated with higher serum total osteocalcin levels in elderly men at high cardiovascular risk. Journal of Clinical Endocrinology & Metabolism 2012;97(10):3792-8. [DOI] [PMC free article] [PubMed] [Google Scholar]
- Guasch-Ferré M, Bulló M, Babio N, Martínez-González MA, Estruch R, Covas MI, et al. Mediterranean diet and risk of hyperuricemia in elderly participants at high cardiovascular risk. Journals of Gerontology Series A - Biological Sciences & Medical Sciences 2013;68(10):1263-70. [DOI] [PubMed] [Google Scholar]
- Hu EA, Toledo E, Diez-Espino J, Estruch R, Corella D, Salas-Salvado J, et al. Lifestyles and risk factors associated with adherence to the Mediterranean diet: a baseline assessment of the PREDIMED trial. PlOS One 2013;8(4):e60166. [DOI] [PMC free article] [PubMed] [Google Scholar]
- Martínez-Lapiscina EH, Clavero P, Toledo E, Estruch R, Salas-Salvadó J, San Julián B, et al. Mediterranean diet improves cognition: the PREDIMED-NAVARRA randomised trial. Journal of Neurology, Neurosurgery, and Psychiatry 2013;84(12):1318-25. [DOI] [PubMed] [Google Scholar]
- Martínez-Lapiscina EH, Clavero P, Toledo E, San Julián B, Sanchez-Tainta A, Corella D, et al. Virgin olive oil supplementation and long-term cognition: the Predimed-Navarra randomized, trial. Journal of Nutrition, Health and Aging 2013;17(6):544-52. [DOI] [PubMed] [Google Scholar]
- Mitjavila MT, Fandos M, Salas-Salvadó J, Covas MI, Borrego S, Estruch R, et al. The Mediterranean diet improves the systemic lipid and DNA oxidative damage in metabolic syndrome individuals. A randomized, controlled, trial. Clinical Nutrition 2013;32(2):172-8. [DOI] [PubMed] [Google Scholar]
- Nordmann AJ, Suter-Zimmermann K, Bucher HC, Shai I, Tuttle KR, Estruch R, et al. Meta-analysis comparing Mediterranean to low-fat diets for modification of cardiovascular risk factors. American Journal of Medicine 2011;124(9):841-51. [DOI] [PubMed] [Google Scholar]
- Prieto RM, Fiol M, Perello J, Estruch R, Ros E, Sanchis P, et al. Effects of Mediterranean diets with low and high proportions of phytate-rich foods on the urinary phytate excretion. European Journal of Nutrition 2010;49(6):321-6. [DOI] [PubMed] [Google Scholar]
- Razquin C, Martinez JA, Martinez-Gonzalez MA, Bes-Rastrollo M, Fernández-Crehuet J, Marti A. A 3-year intervention with a Mediterranean diet modified the association between the rs9939609 gene variant in FTO and body weight changes. International Journal of Obesity 2010;34(2):266-72. [DOI] [PubMed] [Google Scholar]
- Razquin C, Martinez JA, Martinez-Gonzalez MA, Fernández-Crehuet J, Santos JM, Marti A. A Mediterranean diet rich in virgin olive oil may reverse the effects of the -174G/C IL6 gene variant on 3-year body weight change. Molecular Nutrition & Food Research 2010;54 Suppl 1:S75-82. [DOI] [PubMed] [Google Scholar]
- Razquin C, Martinez JA, Martinez-Gonzalez MA, Mitjavila MT, Estruch R, Marti A, et al. A 3 years follow-up of a Mediterranean diet rich in virgin olive oil is associated with high plasma antioxidant capacity and reduced body weight gain. European Journal of Clinical Nutrition 2009;63(12):1387-93. [DOI] [PubMed] [Google Scholar]
- Razquin C, Martinez JA, Martinez-Gonzalez MA, Salas-Salvado J, Estruch R, Marti A. A 3-year Mediterranean-style dietary intervention may modulate the association between adiponectin gene variants and body weight change. European Journal of Nutrition 2010;49:311-9. [DOI] [PubMed] [Google Scholar]
- Ruiz-Canela M, Estruch R, Corella D, Salas-Salvadó J, Martínez-González MA. Association of Mediterranean diet with peripheral artery disease: the PREDIMED randomized trial. JAMA 2014;311(4):415-7. [DOI] [PubMed] [Google Scholar]
- Sánchez-Taínta A, Estruch R, Bulló M, Corella D, Gómez-Gracia E, Fiol M, et al. Adherence to a Mediterranean-type diet and reduced prevalence of clustered cardiovascular risk factors in a cohort of 3,204 high-risk patients. European Journal of Cardiovascular Prevention & Rehabilitation 2008;15(5):589-93. [DOI] [PubMed] [Google Scholar]
- Sánchez-Villegas A, Galbete C, Martínez-González MA, Martinez JA, Razquin C, Salas-Salvadó J, et al. The effect of the Mediterranean diet on plasma brain-derived neurotrophic factor (BDNF) levels: the PREDIMED-NAVARRA randomized trial. Nutritional Neuroscience 2011;14(5):195-201. [DOI] [PubMed] [Google Scholar]
- Sánchez-Villegas A, Martínez-González MA, Estruch R, Salas-Salvadó J, Corella D, Covas MI, et al. Mediterranean dietary pattern and depression: the PREDIMED randomized trial. BMC Medicine 2013;11:208. [DOI] [PMC free article] [PubMed] [Google Scholar]
- Sala-Vila A, Romero-Mamani ES, Gilabert R, Núñez I, De la Torre R, Corella D, et al. Changes in ultrasound-assessed carotid intima-media thickness and plaque with a mediterranean diet: a substudy of the PREDIMED trial. Arteriosclerosis, Thrombosis, and Vascular Biology 2014;34(2):439-45. [DOI] [PubMed] [Google Scholar]
- Salas-Salvadó J, Bulló M, Babio N, Martínez-González MÇ, Ibarrola-Jurado N, Basora J, et al. Reduction in the incidence of type 2 diabetes with the Mediterranean diet: results of the PREDIMED-Reus nutrition intervention randomized trial. Diabetes Care 2011;34:14-9. [DOI] [PMC free article] [PubMed] [Google Scholar]
- Salas-Salvadó J, Bulló M, Estruch R, Ros E, Covas MI, Ibarrola-Jurado N, et al. Prevention of diabetes with Mediterranean diets: a subgroup analysis of a randomized trial. Annals of Internal Medicine 2014;160(1):1-10. [DOI] [PubMed] [Google Scholar]
- Salas-Salvadó J, Fernandez-Ballart J, Ros E, Martínez-González MA, Fito M, Estruch R, et al. Effect of a Mediterranean diet supplemented with nuts on metabolic syndrome status: one-year results of the PREDIMED randomized trial. Archives of Internal Medicine 2008;168(22):2449-58. [DOI] [PubMed] [Google Scholar]
- Salas-Salvado J, Garcia-Arellano A, Estruch R, Marquez-Sandoval F, Corella D, Fiol M, et al. Components of the Mediterranean-type food pattern and serum inflammatory markers among patients at high risk for cardiovascular disease. European Journal of Clinical Nutrition 2008;62(5):651-9. [DOI] [PubMed] [Google Scholar]
- Schröder H, De la Torre R, Estruch R, Corella D, Martínez-González MA, Salas-Salvadó J, et al. Alcohol consumption is associated with high concentrations of urinary hydroxytyrosol. American Journal of Clinical Nutrition 2009;90(5):1329-35. [DOI] [PubMed] [Google Scholar]
- Schröder H, Fitó M, Estruch R, Martínez-González MA, Corella D, Salas-Salvadó J, et al. A short screener is valid for assessing Mediterranean diet adherence among older Spanish men and women. Journal of Nutrition 2011;141(6):1140-5. [DOI] [PubMed] [Google Scholar]
- Solá R, Fitó M, Estruch R, Salas-Salvadó J, Corella D, De La Torre R, et al. Effect of a traditional Mediterranean diet on apolipoproteins B, A-I, and their ratio: a randomized, controlled trial. Atherosclerosis 2011;218(1):174-80. [DOI] [PubMed] [Google Scholar]
- Toledo E, Delgado-Rodríguez M, Estruch R, Salas-Salvadó J, Corella D, Gomez-Gracia E, et al. Low-fat dairy products and blood pressure: follow-up of 2290 older persons at high cardiovascular risk participating in the PREDIMED study. British Journal of Nutrition 2009;101(1):59-67. [DOI] [PubMed] [Google Scholar]
- Toledo E, Hu FB, Estruch R, Buil-Cosiales P, Corella D, Salas-Salvadó J, et al. Effect of the Mediterranean diet on blood pressure in the PREDIMED trial: results from a randomized controlled trial. BMC Medicine 2013;11:207. [DOI] [PMC free article] [PubMed] [Google Scholar]
- Urpi-Sarda M, Casas R, Chiva-Blanch G, Romero-Mamani ES, Valderas-Martínez P, Arranz S, et al. Virgin olive oil and nuts as key foods of the Mediterranean diet effects on inflammatory biomakers related to atherosclerosis. Pharmacological Research 2012;65(6):577-83. [DOI] [PubMed] [Google Scholar]
- Waterhouse AL. Resveratrol metabolites in urine as biomarker of wine intake in free-living subjects: the PREDIMED Study. Free Radical Biology & Medicine 2009;46(12):1561. [DOI] [PubMed] [Google Scholar]
- Zamora-Ros R, Urpi-Sarda M, Lamuela-Raventos RM, Estruch R, Martínez-González MA, Bulló M, et al. Resveratrol metabolites in urine as a biomarker of wine intake in free-living subjects: the PREDIMED Study. Free Radical Biology & Medicine 2009;46(12):1562-6. [DOI] [PubMed] [Google Scholar]
- Zazpe I, Estruch R, Toledo E, Sánchez-Taínta A, Corella D, Bulló M, et al. Predictors of adherence to a Mediterranean-type diet in the PREDIMED trial. European Journal of Nutrition 2010;49(2):91-9. [DOI] [PubMed] [Google Scholar]
- Zazpe I, Sánchez-Taínta A, Estruch R, Lamuela-Raventos RM, Schröder H, Salas-Salvadó J, et al. A large randomized individual and group intervention conducted by registered dietitians increased adherence to Mediterranean-type diets: the PREDIMED study. Journal of the American Dietetic Association 2008;108(7):1134-44. [DOI] [PubMed] [Google Scholar]
PREMIER 2003 {published and unpublished data}
- Appel LJ, Champagne CM, Harsha DW, Cooper LS, Obarzanek E, Elmer PJ, et al. Effects of comprehensive lifestyle modification on blood pressure control: main results of the PREMIER clinical trial. JAMA 2003;289(16):2083-93. [DOI] [PubMed] [Google Scholar]
- Elmer PJ, Obarzanek E, Vollmer WM, Simons-Morton D, Stevens VJ, Young DR, et al. Effects of comprehensive lifestyle modification on diet, weight, physical fitness, and blood pressure control: 18-month results of a randomized trial. Annals of Internal Medicine 2006;144(7):485-95. [DOI] [PubMed] [Google Scholar]
- Ledikwe JH, Rolls BJ, Smiciklas-Wright H, Mitchell DC, Ard JD, Champagne C, et al. Reductions in dietary energy density are associated with weight loss in overweight and obese participants in the PREMIER trial. American Journal of Clinical Nutrition 2007;85(5):1212-21. [DOI] [PubMed] [Google Scholar]
- Lien LF, Brown AJ, Ard JD, Loria C, Erlinger TP, Feldstein AC, et al. Effects of PREMIER lifestyle modifications on participants with and without the metabolic syndrome. Hypertension 2007;50(4):609-16. [DOI] [PubMed] [Google Scholar]
- Lin PH, Appel LJ, Funk K, Craddick S, Chen C, Elmer P, et al. The PREMIER intervention helps participants follow the Dietary Approaches to Stop Hypertension dietary pattern and the current Dietary Reference Intakes recommendations. Journal of the American Dietetic Association 2007;107(9):1541-51. [DOI] [PubMed] [Google Scholar]
- Lin PH, Miwa S, Li YJ, Wang Y, Levy E, Lastor K, et al. Factors influencing dietary protein sources in the PREMIER trial population. Journal of the American Dietetic Association 2010;110(2):291-5. [DOI] [PMC free article] [PubMed] [Google Scholar]
- Maruthur NM, Wang NY, Appel LJ. Lifestyle interventions reduce coronary heart disease risk: results from the PREMIER Trial. Circulation 2009;119(15):2026-31. [DOI] [PMC free article] [PubMed] [Google Scholar]
- McGuire HL, Svetkey LP, Harsha DW, Elmer PJ, Appel LJ, Ard JD. Comprehensive lifestyle modification and blood pressure control: a review of the PREMIER trial. Journal of Clinical Hypertension 2004;6(7):383-90. [DOI] [PMC free article] [PubMed] [Google Scholar]
- Obarzanek E, Vollmer WM, Lin PH, Cooper LS, Young DR, Ard JD, et al. Effects of individual components of multiple behavior changes: the PREMIER trial. American Journal of Health Behavior 2007;31(5):545-60. [DOI] [PubMed] [Google Scholar]
- Svetkey LP, Erlinger TP, Vollmer WM, Feldstein A, Cooper LS, Appel LJ, et al. Effect of lifestyle modifications on blood pressure by race, sex, hypertension status, and age. Journal of Human Hypertension 2005;19(1):21-31. [DOI] [PubMed] [Google Scholar]
- Svetkey LP, Harsha DW, Vollmer WM, Stevens VJ, Obarzanek E, Elmer PJ, et al. Premier: a clinical trial of comprehensive lifestyle modification for blood pressure control: rationale, design and baseline characteristics. Annals of Epidemiology 2003;13(6):462-71. [DOI] [PubMed] [Google Scholar]
- Young DR, Coughlin J, Jerome GJ, Myers V, Chae SE, Brantley PJ. Effects of the PREMIER interventions on health-related quality of life. Annals of Behavioral Medicine 2010;40(3):302-12. [DOI] [PMC free article] [PubMed] [Google Scholar]
Pritchard 2002 {published data only}
- Pritchard JE, Nowson CA, Billington T, Wark JD. Benefits of a year-long workplace weight loss program on cardiovascular risk factors. Nutrition and Dietetics 2002;59(2):87-96. [Google Scholar]
Puget Sound EP 2000 {published and unpublished data}
- Kristal AR, Curry SJ, Shattuck AL, Feng Z, Li S. A randomized trial of a tailored, self-help dietary intervention: the Puget Sound Eating Patterns Study. Preventive Medicine 2000;31(4):380-9. [DOI] [PubMed] [Google Scholar]
Rabast 1979 {published data only}
- Rabast U, Schonborn J, Kasper H. Dietetic treatment of obesity with low and high-carbohydrate diets: comparative studies and clinical results. International Journal of Obesity 1979;3(3):201-11. [PubMed] [Google Scholar]
Rabkin 1981 {published data only}
- Rabkin SW, Boyko E, Streja DA. Relationship of weight loss and cigarette smoking to changes in high-density lipoprotein cholesterol. American Journal of Clinical Nutrition 1981;34(9):1764-8. [DOI] [PubMed] [Google Scholar]
Radack 1990 {published data only}
- Radack K, Deck C, Huster G. The comparative effects of n-3 and n-6 polyunsaturated fatty acids on plasma fibrinogen levels: a controlled clinical trial in hypertriglyceridemic subjects. Journal of the American College of Nutrition 1990;9(4):352-7. [DOI] [PubMed] [Google Scholar]
Rasmussen 1995 {published data only}
- Rasmussen OW, Thomsen CH, Hansen KW, Vesterlund M, Winther E, Hermansen K. Favourable effect of olive oil in patients with non-insulin-dependent diabetes. The effect on blood pressure, blood glucose and lipid levels of a high-fat diet rich in monounsaturated fat compared with a carbohydrate-rich diet [Gunstig virkning af olivenolie hos ikkeinsulinkraevende diabetikere. Virkningen pa blodtryk, blodglukose og lipidniveauer af en dioet med et hojt indhold af monoumoettet fedt sammenlignet med en kulhydratrig dioet]. Ugeskrift for Laeger 1995;157(8):1028-32. [PubMed] [Google Scholar]
Reaven 2001 {published data only}
- Reaven GM, Abbasi F, Bernhart S, Coulston A, Darnell B, Dashti N, et al. Insulin resistance, dietary cholesterol, and cholesterol concentration in postmenopausal women. Metabolism: Clinical & Experimental 2001;50(5):594-7. [DOI] [PubMed] [Google Scholar]
Reid 2002 {published data only}
- Reid R, Fodor G, Lydon-Hassen K, D'Angelo MS, McCrea J, Bowlby M, et al. Dietary counselling for dyslipidemia in primary care: results of a randomized trial. Canadian Journal of Dietetic Practice & Research 2002;63(4):169-75. [DOI] [PubMed] [Google Scholar]
Renaud 1986 {published data only}
- Renaud S, Godsey F, Dumont E, Thevenon C, Ortchanian E, Martin JL. Influence of long-term diet modification on platelet function and composition in Moselle farmers. American Journal of Clinical Nutrition 1986;43(1):136-50. [DOI] [PubMed] [Google Scholar]
Rivellese 1994 {published and unpublished data}
- Rivellese AA, Auletta P, Marotta G, Saldalamacchia G, Giacco A, Mastrilli V, et al. Long term metabolic effects of two dietary methods of treating hyperlipidaemia. BMJ 1994;308(6923):227-31. [DOI] [PMC free article] [PubMed] [Google Scholar]
Rivellese 2003 {published data only}
- Rivellese AA, Maffettone A, Vessby B, Uusitupa M, Hermansen K, Berglund L, et al. Effects of dietary saturated, monounsaturated and n-3 fatty acids on fasting lipoproteins, LDL size and post-prandial lipid metabolism in healthy subjects. Atherosclerosis 2003;167(1):149-58. [DOI] [PubMed] [Google Scholar]
Roderick 1997 {published and unpublished data}
- Roderick P, Ruddock V, Hunt P, Miller G. A randomized trial to evaluate the effectiveness of dietary advice by practice nurses in lowering diet-related coronary heart disease risk. British Journal of General Practice 1997;47(414):7-12. [PMC free article] [PubMed] [Google Scholar]
Roman CHD prev 1986 {published data only}
- Research Group of the Rome Project of Coronary Heart Disease Prevention. Eight-year follow-up results from the Rome Project of Coronary Heart Disease Prevention. Preventive Medicine 1986;15(2):176-91. [DOI] [PubMed] [Google Scholar]
- Research Group of the Rome Project of Coronary Heart Disease Prevention. The Roman Coronary Disease Prevention Project: effectiveness of intervention and reduction of mortality over a 10-year period [II Progetto Romano di Prevenzione della Cardiopatia Coronarica: efficacia dell'intervento e riduzione della mortalita in 10 anni]. Giornale Italiano di Cardiologia 1986;16(3):196-202. [PubMed] [Google Scholar]
Rose 1987 {published data only}
- Rose DP, Boyar AP, Cohen C, Strong LE. Effect of a low fat diet on hormone levels in women with cystic breast disease. I. Serum steroids and gonadotropins. Journal of the National Cancer Institute 1987;78(4):623-6. [PubMed] [Google Scholar]
Sarkkinen 1995 {published and unpublished data}
- Makinen E, Uusitupa MI, Pietinen P, Aro A, Penttila I. Long term effects of three fat modified diets on serum lipids in free living hypercholesterolaemic subjects (abstract). European Heart Journal 1991;12:162. [Google Scholar]
- Sarkkinen E. Long-Term Feasibility and Effects of Three Different Fat-Modified Diets in Free-Living Hypercholesterolemic Subjects [PhD thesis]. Kuopio, Finland: University of Kuopio, 1995. [Google Scholar]
- Sarkkinen ES, Agren JJ, Ahola I, Ovaskainen ML, Uusitupa MI. Fatty acid composition of serum cholesterol esters, and erythrocyte and platelet membranes as indicators of long-term adherence to fat-modified diets. American Journal of Clinical Nutrition 1994;59(2):364-70. [DOI] [PubMed] [Google Scholar]
- Sarkkinen ES, Uusitupa MI, Nyyssonen K, Parviainen M, Penttila I, Salonen JT. Effects of two low-fat diets, high and low in polyunsaturated fatty acids, on plasma lipid peroxides and serum vitamin E levels in free-living hypercholesterolaemic men. European Journal of Clinical Nutrition 1993;47(9):623-30. [PubMed] [Google Scholar]
- Sarkkinen ES, Uusitupa MI, Pietinen P, Aro A, Ahola I, Penttila I, et al. Long-term effects of three fat-modified diets in hypercholesterolemic subjects. Atherosclerosis 1994;105(1):9-23. [DOI] [PubMed] [Google Scholar]
- Uusitupa MI, Sarkkinen ES, Torpstrom J, Pietinen P, Aro A. Long-term effects of four fat-modified diets on blood pressure. Journal of Human Hypertension 1994;8(3):209-18. [PubMed] [Google Scholar]
Schaefer 1995a {published data only}
- Schaefer EJ, Lichtenstein AH, Lamon-Fava S, McNamara JR, Schaefer MM, Rasmussen H, et al. Body weight and low density lipoprotein cholesterol changes after consumption of a low fat ad libitum diet. JAMA 1995;274(18):1450-5. [DOI] [PubMed] [Google Scholar]
Schaefer 1995b {published data only}
- Schaefer EJ, Lichtenstein AH, Lamon-Fava S, Contois JH, Li Z, Rasmussen H, et al. Efficacy of a National Cholesterol Education Program Step 2 diet in normolipidaemic and hypercholesterolaemic middle-aged and elderly men and women. Arteriosclerosis, Thrombosis, and Vascular Biology 1995;15(8):1079-85. [DOI] [PubMed] [Google Scholar]
Schectman 1996 {published data only}
- Schectman G, Wolff N, Byrd JC, Hiatt JG, Hartz A. Physician extenders for cost-effective management of hypercholesterolemia. Journal of General Internal Medicine 1996;11(5):277-86. [DOI] [PubMed] [Google Scholar]
Schlierf 1995 {published data only}
- Schlierf G, Schuler G, Hambrecht R, Niebauer J, Hauer K, Vogel G, et al. Treatment of coronary heart disease by diet and exercise. Journal of Cardiovascular Pharmacology 1995;25(Suppl 4):S32-4. [PubMed] [Google Scholar]
Seppanen‐Laakso 1992 {published data only}
- Seppanen-Laakso T, Vanhanen H, Laakso I, Kohtamaki H, Viikari J. Replacement of butter on bread by rapeseed oil and rapeseed oil-containing margarine: effects on plasma fatty acid composition and serum cholesterol. British Journal of Nutrition 1992;68:639-54. [DOI] [PubMed] [Google Scholar]
Seppelt 1996 {published and unpublished data}
- Seppelt B, Weststrate JA, Reinert A, Johnson D, Luder W, Zunft HJ. Long-term effects of nutrition with fat-reduced foods on energy consumption and body weight [Langzeiteffekte einer ernährung mit fettreduzierten lebensmitteln auf die energieaufnahme und das körpergewicht]. Zeitschrift für Ernährungswissenschaft 1996;35(4):369-77. [DOI] [PubMed] [Google Scholar]
Singh 1991 {published data only}
- Singh RB, Rastogi SS, Sircar AR. Dietary strategies for risk-factor modification to prevent cardiovascular diseases. Nutrition 1991;7(3):210-4. [PubMed] [Google Scholar]
Singh 1992 {published data only}
- Singh RB, Niaz MA, Agarwal P, Begom R, Rastogi SS. Effect of antioxidant-rich foods on plasma ascorbic acid, cardiac enzyme, and lipid peroxide levels in patients hospitalized with acute myocardial infarction. Journal of the American Dietetic Association 1995;95(7):775-80. [DOI] [PubMed] [Google Scholar]
- Singh RB, Niaz MA, Ghosh S. Effect on central obesity and associated disturbances of low-energy, fruit- and vegetable-enriched prudent diet in north Indians. Postgraduate Medical Journal 1994;70(830):895-900. [DOI] [PMC free article] [PubMed] [Google Scholar]
- Singh RB, Rastogi SS, Verma R, Bolaki L, Singh R. An Indian experiment with nutritional modulation in acute myocardial infarction. American Journal of Cardiology 1992;69(9):879-85. [DOI] [PubMed] [Google Scholar]
- Singh RB, Rastogi SS, Verma R, Laxmi B, Singh R, Ghosh S, et al. Randomised controlled trial of cardioprotective diet in patients with recent acute myocardial infarction: results of one year follow up. BMJ 1992;304(6833):1015-9. [DOI] [PMC free article] [PubMed] [Google Scholar]
Sirtori 1992 {published data only}
- Sirtori CR, Gatti E, Tremoli E, Galli C, Gianfranceschi G, Franceschini G, et al. Olive oil, corn oil, and n-3 fatty acids differently affect lipids, lipoproteins, platelets, and superoxide formation in type II hypercholesterolemia. American Journal of Clinical Nutrition 1992;56(1):113-22. [DOI] [PubMed] [Google Scholar]
SLIM 2008 {published data only}
- Roumen C, Corpeleijn E, Feskens EJ, Mensink M, Saris WH, Blaak EE, et al. Impact of 3-year lifestyle intervention on postprandial glucose metabolism: the SLIM study. Diabetic Medicine 2008;25(5):597-605. [DOI] [PubMed] [Google Scholar]
Sopotsinskaia 1992 {published data only}
- Sopotsinskaia EB, Balitskii KP, Tarutinov VI, Zhukova VM, Semenchuk DD, Kozlovskaia SG, et al. Experience with the use of a low-calorie diet in breast cancer patients to prevent metastasis [Opyt primeneniia nizkokaloriinoi diety u bol'nykh rakom molochnoi zhelezy s tsel'iu profilaktiki metastazi]. Voprosy Onkologii 1992;38(5):592-9. [PubMed] [Google Scholar]
Soul Food Light {published data only}
- Anderson-Loftin W, Barnett S, Bunn P, Sullivan P, Hussey J, Tavakoli A. Soul Food Light: culturally competent diabetes education. Diabetes Educator 2005;31(4):555-63. [DOI] [PubMed] [Google Scholar]
Stanford NAP 1997 {published data only}
- Howard PB, Winkleby MA, Albright CL, Bruce B, Fortmann SP. The Stanford Nutrition Action Program: a dietary fat intervention for low-literacy adults. American Journal of Public Health 1997;87(12):1971-6. [DOI] [PMC free article] [PubMed] [Google Scholar]
Stanford Weight 1994 {published and unpublished data}
- Williams PT, Krauss RM, Stefanick ML, Vranizan KM, Wood PD. Effects of low-fat diet, calorie restriction, and running on lipoprotein subfraction concentrations in moderately overweight men. Metabolism 1994;43(5):655-63. [DOI] [PMC free article] [PubMed] [Google Scholar]
Starmans 1995 {published data only}
- Starmans KM, Lustermans FT, Kragten HA, Struijker BH, Rilla H. Lowering cholesterol in patients with mild hypercholesterolaemia does not improve functional properties of large arteries [abstract]. Netherlands Journal Of Medicine 1995;46:A70. [Google Scholar]
Steinbach 1996 {published data only}
- Steinbach M. A Romanian contribution to the epidemiology and prevention of cardiovascular diseases. Romanian Journal of Internal Medicine 1996;34(1-2):137-48. [PubMed] [Google Scholar]
Steptoe 2001 {published data only}
- Steptoe A, Kerry S, Rink E, Hilton S. The impact of behavioral counselling on stage of change in fat intake, physical activity, and cigarette smoking in adults at increased risk of coronary heart disease. American Journal of Public Health 2001;91(2):265-9. [DOI] [PMC free article] [PubMed] [Google Scholar]
Stevens 2002 {published and unpublished data}
- Stevens VJ, Glasgow RE, Toobert DJ, Karanja N, Smith KS. One-year results from a brief, computer-assisted intervention to decrease consumption of fat and increase consumption of fruits and vegetables. Preventive Medicine 2003;36(5):594-600. [DOI] [PubMed] [Google Scholar]
- Stevens VJ, Glasgow RE, Toobert DJ, Karanja N, Smith KS. Randomized trial of a brief dietary intervention to decrease consumption of fat and increase consumption of fruits and vegetables. American Journal of Health Promotion 2002;16(3):129-34. [DOI] [PubMed] [Google Scholar]
Stevenson 1988 {published data only}
- Stevenson DW, Darga LL, Spafford TR, Ahmad N, Lucas CP. Variable effects of weight loss on serum lipids and lipoproteins in obese patients. International Journal of Obesity 1988;12(6):495-502. [PubMed] [Google Scholar]
Strychar 2009 {published and unpublished data}
- Strychar I, Cohn JS, Renier G, Rivard M, Aris-Jilwan N, Beauregard H, et al. Effects of a diet higher in carbohydrate/lower in fat versus lower in carbohydrate/higher in monounsaturated fat on postmeal triglyceride concentrations and other cardiovascular risk factors in type 1 diabetes. Diabetes Care 2009;32(9):1597-9. [DOI] [PMC free article] [PubMed] [Google Scholar]
Sweeney 2004 {published data only}
- Sweeney M. Effects of very low-fat diets on anginal symptoms. Medical Hypotheses 2004;63(3):553. [DOI] [PubMed] [Google Scholar]
Søndergaard 2003 {published and unpublished data}
- Søndergaard E, Møller JE, Egstrup K. Effect of dietary intervention and lipid-lowering treatment on brachial vasoreactivity in patients with ischemic heart disease and hypercholesterolemia. American Heart Journal 2003;145(5):E19. [DOI] [PubMed] [Google Scholar]
TAIM 1992 {published data only}
- Davis BR, Blaufox MD, Hawkins CM, Langford HG, Oberman A, Swencionis C, et al. Trial of antihypertensive interventions and management. Design, methods, and selected baseline results. Controlled Clinical Trials 1989;10(1):11-30. [DOI] [PubMed] [Google Scholar]
- Davis BR, Blaufox MD, Oberman A, Wassertheil SS, Zimbaldi N, Cutler JA, et al. Reduction in long-term antihypertensive medication requirements. Effects of weight reduction by dietary intervention in overweight persons with mild hypertension. Archives of Internal Medicine 1993;153(15):1773-82. [DOI] [PubMed] [Google Scholar]
- Davis BR, Oberman A, Blaufox MD, Wassertheil SS, Hawkins CM, Cutler JA, et al. Effect of antihypertensive therapy on weight loss. The Trial of Antihypertensive Interventions and Management Research Group. Hypertension 1992;19(4):393-9. [DOI] [PubMed] [Google Scholar]
- Langford HG, Davis BR, Blaufox D, Oberman A, Wassertheil-Smoller S, Hawkins M, et al. Effect of drug and diet treatment of mild hypertension on diastolic blood pressure. The TAIM Research. Hypertension 1991;17(2):210-7. [DOI] [PubMed] [Google Scholar]
- Oberman A, Wassertheil-Smoller S, Langford HG, Blaufox MD, Davis BR, Blaszkowski T, et al. Pharmacologic and nutritional treatment of mild hypertension: changes in cardiovascular risk status. Annals of Internal Medicine 1990;112(2):89-95. [DOI] [PubMed] [Google Scholar]
- Wassertheil-Smoller S, Davis BR, Breuer B, Chee JC, Oberman A, Blaufox MD. Differences in precision of dietary estimates among different population subgroups. Annals of Epidemiology 1993;3(6):619-28. [DOI] [PubMed] [Google Scholar]
- Wassertheil-Smoller S, Oberman A, Blaufox MD, Davis B, Langford H. The Trial of Antihypertensive Interventions and Management (TAIM) study. Final results with regard to blood pressure, cardiovascular risk, and quality of life. American Journal of Hypertension 1992;5(1):37-44. [DOI] [PubMed] [Google Scholar]
- Wylie-Rosett J, Wassertheil-Smoller S, Blaufox MD, Davis BR, Langford HG, Oberman A, et al. Trial of antihypertensive intervention and management: greater efficacy with weight reduction than with a sodium-potassium intervention. Journal of the American Dietetic Association 1993;93(4):408-15. [DOI] [PubMed] [Google Scholar]
Tapsell 2004 {published data only (unpublished sought but not used)}
- Tapsell LC, Hokman A, Sebastiao A, Denmeade S, Martin G, Calvert GD, et al. The impact of usual dietary patterns, selection of significant foods and cuisine choices on changing dietary fat under 'free living' conditions. Asia Pacific Journal of Clinical Nutrition 2004;13(1):86-91. [PubMed] [Google Scholar]
THIS DIET 2008 {published data only}
- Tuttle KR, Shuler LA, Packard DP, Milton JE, Daratha KB, Bibus DM, et al. Comparison of low-fat versus Mediterranean-style dietary intervention after first myocardial infarction (from the Heart Institute of Spokane Diet Intervention and Evaluation Trial). American Journal of Cardiology 2008;101(11):1523-30. [DOI] [PubMed] [Google Scholar]
TOHP I 1992 {published data only}
- Kumanyika SK, Hebert PR, Cutler JA, Lasser VI, Sugars CP, Steffen Batey L, et al. Feasibility and efficacy of sodium reduction in the Trials of Hypertension Prevention, phase I. Hypertension 1993;22(4):502-12. [DOI] [PubMed] [Google Scholar]
- Satterfield S, Cutler JA, Langford HG, Applegate WB, Borhani NO, Brittain E, et al. Trials of hypertension prevention. Annals of Epidemiology 1991;1(5):455-71. [DOI] [PubMed] [Google Scholar]
- Stevens VJ, Corrigan SA, Obarzanek E, Bernauer E, Cook NR, Hebert P, et al, the TOHP Collaborative Research Group. Weight loss intervention in phase I of the trials of hypertension prevention. Archives of Internal Medicine 1993;153(7):849-58. [PubMed] [Google Scholar]
- The Trials of Hypertension Prevention Collaborative Research Group. The effects of nonpharmacologic interventions on blood pressure of persons with high normal levels. Results of the Trials of Hypertension Prevention, Phase I. JAMA 1992;267(9):1213-20. [DOI] [PubMed] [Google Scholar]
- Whelton PK, Hebert PR, Cutler J, Applegate WB, Eberlein KA, Klag MJ, et al. Baseline characteristics of participants in phase I of the Trials of Hypertension Prevention. Annals of Epidemiology 1992;2(3):295-310. [DOI] [PubMed] [Google Scholar]
- Whelton PK, Kumanyika SK, Cook NR, Cutler JA, Borhani NO, Hennekens CH, et al. Efficacy of nonpharmacologic interventions in adults with high-normal blood pressure: results from phase 1 of the Trials of Hypertension Prevention. American Journal of Clinical Nutrition 1997;65(2 Suppl):652S-60S. [DOI] [PubMed] [Google Scholar]
TONE 1997 {published data only}
- Whelton PK, Appel LJ, Espeland MA, Applegate WB, Ettinger-WH J, Kostis JB, et al. Sodium reduction and weight loss in the treatment of hypertension in older persons: a randomized controlled trial of nonpharmacologic interventions in the elderly (TONE). JAMA 1998;279(11):839-46. [DOI] [PubMed] [Google Scholar]
- Whelton PK, Babnson J, Appel LJ, Charleston J, Cosgrove N, Espeland MA, et al. Recruitment in the Trial of NOnpharmacologic intervention in the Elderly (TONE). Journal of the American Geriatrics Society 1997;45(2):185-93. [DOI] [PubMed] [Google Scholar]
Toobert 2003 {published data only}
- Toobert DJ, Glasgow RE, Strycker LA, Barrera M Jr, Radcliffe JL, Wander RC, et al. Biologic and quality-of-life outcomes from the Mediterranean Lifestyle Program: a randomized clinical trial. Diabetes Care 2003;26(8):2288-93. [DOI] [PubMed] [Google Scholar]
Towle 1994 {published data only}
- Towle LA, Bergman EA, Joseph E. Low-fat bison-hybrid ground meat has no effects on serum lipid levels in a study of 12 men. Journal of the American Dietetic Association 1994;94(5):546-8. [DOI] [PubMed] [Google Scholar]
TRANSFACT 2006 {published data only}
- Chardigny JM, Malpuech-Brugere C, Dionisi F, Bauman DE, German B, Mensink RP, et al. Rationale and design of the TRANSFACT project phase I: a study to assess the effect of the two different dietary sources of trans fatty acids on cardiovascular risk factors in humans. Contemporary Clinical Trials 2006;27(4):364-73. [DOI] [PubMed] [Google Scholar]
- Chardigny JM. Do trans fatty acids from industrially produced sources and from natural sources have the same effect on cardiovascular disease risk factors in healthy subjects? Results of the Trans Fatty Acids Collaboration (TRANSFACT) study. American Journal of Clinical Nutrition 2008;108(3):558-66. [DOI] [PubMed] [Google Scholar]
Treatwell 1992 {published and unpublished data}
- Sorensen G, Morris DM, Hunt MK, Hebert JR, Harris DR, Stoddard A, et al. Work-site nutrition intervention and employees' dietary habits: the Treatwell program. American Journal of Public Health 1992;82(6):877-80. [DOI] [PMC free article] [PubMed] [Google Scholar]
Tromsø Heart 1989 {published data only}
- Knutsen SF, Knutsen R. The Tromsø Heart Study: family approach to intervention on CHD. Feasibility of risk factor reduction in high-risk persons--project description. Scandinavian Journal of Social Medicine 1989;17(1):109-19. [DOI] [PubMed] [Google Scholar]
Troyer 2010 {published and unpublished data}
- Racine EF, Lyerly J, Troyer JL, Warren-Findlow J, McAuley WJ. The influence of home-delivered dietary approaches to stop hypertension meals on body mass index, energy intake, and percent of energy needs consumed among older adults with hypertension and/or hyperlipidemia. Journal of the Academy of Nutrition & Dietetics 2012;112(11):1755-62. [DOI] [PubMed] [Google Scholar]
- Troyer JL, Racine EF, Ngugi GW, McAuley WJ. The effect of home-delivered Dietary Approach to Stop Hypertension (DASH) meals on the diets of older adults with cardiovascular disease. American Journal of Clinical Nutrition 2010;91(5):1204-12. [DOI] [PubMed] [Google Scholar]
UK PDS 1996 {published data only}
- Turner R, Cull C, Holman R. United Kingdom Prospective Diabetes Study 17: a 9-year update of a randomized, controlled trial on the effect of improved metabolic control on complications in non-insulin-dependent diabetes mellitus. Annals of Internal Medicine 1996;124(1 Pt 2):136-45. [DOI] [PubMed] [Google Scholar]
- Turner RC, Holman RR. Lessons from UK prospective diabetes study. Diabetes Research and Clinical Practice 1995;28(Suppl):S151-7. [DOI] [PubMed] [Google Scholar]
Urbach 1952 {published data only}
- Urbach R, Hildreth EA, Wackerman MT. The therapeutic uses of low fat, low cholesterol diets: I. Treatment of essential familial xanthomatosis. Journal of Clinical Nutrition 1952;1(1):52-6. [DOI] [PubMed] [Google Scholar]
Uusitupa 1993 {published data only}
- Uusitupa M, Laitinen J, Siitonen O, Vanninen E, Pyorala K. The maintenance of improved metabolic control after intensified diet therapy in recent type 2 diabetes. Diabetes Research and Clinical Practice 1993;19(3):227-38. [DOI] [PubMed] [Google Scholar]
VASTKOST 2012 {published data only}
- Guldbrand H, Dizdar B, Bunjaku B, Lindstrom T, Bachrach-Lindstrom M, Fredrikson M, et al. In type 2 diabetes, randomisation to advice to follow a low-carbohydrate diet transiently improves glycaemic control compared with advice to follow a low-fat diet producing a similar weight loss. Diabetologia 2012;55(8):2118-27. [DOI] [PMC free article] [PubMed] [Google Scholar]
- Guldbrand H, Lindstrom T, Dizdar B, Bunjaku B, Ostgren CJ, Nystrom FH, et al. Randomization to a low-carbohydrate diet advice improves health related quality of life compared with a low-fat diet at similar weight-loss in type 2 diabetes mellitus. Diabetes Research & Clinical Practice 2014;106(2):221-7. [DOI] [PubMed] [Google Scholar]
- Jonasson L, Guldbrand H, Lundberg AK, Nystrom FH. Advice to follow a low-carbohydrate diet has a favourable impact on low-grade inflammation in type 2 diabetes compared with advice to follow a low-fat diet. Annals of Medicine 2014;46(3):182‐7. [DOI] [PMC free article] [PubMed] [Google Scholar]
Vavrikova 1958 {published data only}
- Vavrikova J. Essential fatty acids, lipid metabolism, and atherosclerosis [letter]. Lancet 1958;1:1337. [DOI] [PubMed] [Google Scholar]
Verheiden 2003 {published data only (unpublished sought but not used)}
- Verheiden MW, Van der Veen JE, Van Zadelhoff WM, Bakx C, Koelen MA, Van den Hoogen HJ, et al. Nutrition guidance in Dutch family practice: behavioural determinants of reduction in fat consumption. American Journal of Clinical Nutrition 2003;77(Suppl):1058S-64S. [DOI] [PubMed] [Google Scholar]
WAHA 2016 {published and unpublished data}
- Bitok E, Jaceldo-Siegl K, Rajaram S, Serra-Mir M, Roth I, Feitas-Simoes T, et al. Favourable nutrient intake and displacement with long-term walnut supplementation among elderly: results of a randomised trial. British Journal of Nutrition 2017;118(3):201-9. [DOI: 10.1017/S0007114517001957] [DOI] [PubMed] [Google Scholar]
- Bitok E, Rajaram S, Ros E. Does a daily walnut supplement given for a year result in body weight gain? FASEB Journal 2016;30:1157.5.
- Huey L, Bitok E, Kazzi N. Dietary compliance of walnut or no walnut intake in a 1-year randomized intervention trial among free-living elderly in the Walnuts and Healthy Aging Study (WAHA). FASEB Journal 2016;30:1157.10.
- Rajaram S, Valls-Pedret C, Cofan M, Sabate J, Serra-Mir M, Perez-Heras AM, et al. The Walnuts and Healthy Aging Study (WAHA): protocol for a nutritional intervention trial with walnuts on brain aging. Frontiers in Aging Neuroscience 2016;8:333. [PMID: ] [DOI] [PMC free article] [PubMed] [Google Scholar]
- Ros E, Rajaram S, Sala-Vila A, Serra-Mir M, Valls-Pedret C, Cofán M, et al. Effect of a 1-year walnut supplementation on blood lipids among older individuals: findings from the Walnuts and Healthy Aging (WAHA) study. FASEB Journal 2016;30(1 Suppl):293.4.
Wass 1981 {published data only}
- Wass VJ, Jarrett RJ, Meilton V, Start MK, Mattock M, Ogg CS, et al. Effect of a long-term fat-modified diet on serum lipoprotein levels of cholesterol and triglyceride in patients. Clinical Science 1981;60(1):81-6. [DOI] [PubMed] [Google Scholar]
Wassertheil 1985 {published data only}
- Wassertheil SS, Blaufox MD, Langford HG, Oberman A, Cutter G, Pressel S. Prediction of response to sodium intervention for blood pressure control. Journal of Hypertension 1986;4(5 Suppl):S343-6. [PubMed] [Google Scholar]
- Wassertheil SS, Langford HG, Blaufox MD, Oberman A, Hawkins M, Levine B, et al. Effective dietary intervention in hypertensives: sodium restriction and weight reduction. Journal of the American Dietetic Association 1985;85(4):423-30. [PubMed] [Google Scholar]
WATCH 1999 {published and unpublished data}
- Ockene IS, Hebert JR, Ockene JK, Saperia GM, Stanek E, Nicolosi R, et al. Effect of a physician-delivered nutrition counselling training and an office-support program on saturated fat intake, weight, and serum lipid measurements in a hyperlipidemic population: Worcester Area Trial for Counseling in Hyperlipidemia. Archives of Internal Medicine 1999;159(7):725-31. [DOI] [PubMed] [Google Scholar]
Watts 1988 {published data only}
- Watts GF, Ahmed W, Quiney J, Houlston R, Jackson P, Iles C, et al. Effective lipid lowering diets including lean meat. BMJ (Clinical Research Ed) 1988;296(6617):235-7. [DOI] [PMC free article] [PubMed] [Google Scholar]
Weintraub 1992 {published data only}
- Weintraub M, Sundaresan PR, Schuster B. Long-term weight control study. VII (weeks 0 to 210). Serum lipid changes. Clinical Pharmacology and Therapeutics 1992;51(5):634-41. [DOI] [PubMed] [Google Scholar]
Westman 2006 {published data only}
- Westman EC, Yancy WS Jr, Olsen MK, Dudley T, Guyton JR. Effect of a low-carbohydrate, ketogenic diet program compared to a low-fat diet on fasting lipoprotein subclasses. International Journal of Cardiology 2006;110(2):212-6. [DOI] [PubMed] [Google Scholar]
Weststrate 1998 {published data only}
- Weststrate JA, Meijer GW. Plant sterol enriched margarines and reduction of plasma total-and LDL-cholesterol concentrations in normocholesterolaemic and mildly hypercholesterolaemic subjects. European Journal of Clinical Nutrition 1998;52(5):334-43. [DOI] [PubMed] [Google Scholar]
WHEL 2007 {published data only}
- Bardwell WA, Profant J, Casden DR, Dimsdale JE, Ancoli-Israel S, Natarajan L, et al. The relative importance of specific risk factors for insomnia in women treated for early-stage breast cancer. Psycho-Oncology 2008;17(1):9-18. [DOI] [PMC free article] [PubMed] [Google Scholar]
- Caan BJ, Flatt SW, Rock CL, Ritenbaugh C, Newman V, Pierce JP, et al, Women's Healthy Eating and Living Group. Low-energy reporting in women at risk for breast cancer recurrence. Cancer Epidemiology, Biomarkers & Prevention 2000;9(10):1091-7. [PubMed] [Google Scholar]
- Gold EB, Flatt SW, Pierce JP, Bardwell WA, Hajek RA, Newman VA, et al. Dietary factors and vasomotor symptoms in breast cancer survivors: the WHEL Study. Menopause 2006;13(3):423-33. [DOI] [PubMed] [Google Scholar]
- Gold EB, Pierce JP, Natarajan L, Stefanick ML, Laughlin GA, Caan BJ, et al. Dietary pattern influences breast cancer prognosis in women without hot flashes: the Women's Healthy Eating and Living trial. Journal of Clinical Oncology 2009;27(3):352-9. [DOI] [PMC free article] [PubMed] [Google Scholar]
- Hernandez-Valero MA, Thomson CA, Hernandez M, Tran T, Detry MA, Theriault RL, et al. Comparison of baseline dietary intake of Hispanic and matched non-Hispanic white breast cancer survivors enrolled in the Women's Healthy Eating and Living study. Journal of the American Dietetic Association 2008;108(8):1323-9. [DOI] [PMC free article] [PubMed] [Google Scholar]
- Hong S, Bardwell WA, Natarajan L, Flatt SW, Rock CL, Newman VA, et al. Correlates of physical activity level in breast cancer survivors participating in the Women's Healthy Eating and Living (WHEL) study. Breast Cancer Research & Treatment 2007;101(2):225-32. [DOI] [PubMed] [Google Scholar]
- Hyder JA, Thomson CA, Natarajan L, Madlensky L, Pu M, Emond J, et al. Adopting a plant-based diet minimally increased food costs in WHEL Study. American Journal of Health Behavior 2009;33(5):530-9. [DOI] [PMC free article] [PubMed] [Google Scholar]
- Madlensky L, Natarajan L, Flatt SW, Faerber S, Newman VA, Pierce JP, et al. Timing of dietary change in response to a telephone counseling intervention: evidence from the WHEL study. Health Psychology 2008;27(5):539-47. [DOI] [PMC free article] [PubMed] [Google Scholar]
- Mortimer JE, Flatt SW, Parker BA, Gold EB, Wasserman L, Natarajan L, et al. Tamoxifen, hot flashes and recurrence in breast cancer. Breast Cancer Research & Treatment 2008;108(3):421-6. [DOI] [PMC free article] [PubMed] [Google Scholar]
- Newman VA, Thomson CA, Rock CL, Flatt SW, Kealey S, Bardwell WA, et al. Achieving substantial changes in eating behavior among women previously treated for breast cancer: an overview of the intervention. Journal of the American Dietetic Association 2005;105(3):382-91. [DOI] [PubMed] [Google Scholar]
- Paxton RJ, Jones LA, Chang S, Hernandez M, Hajek RA, Flatt SW, et al. Was race a factor in the outcomes of the Women's Health Eating and Living Study? Cancer 2011;117(16):3805-13. [DOI] [PMC free article] [PubMed] [Google Scholar]
- Pierce JP, Faerber S, Wright FA, Rock CL, Newman V, Flatt SW, et al. A randomized trial of the effect of a plant-based dietary pattern on additional breast cancer events and survival: the Women's Healthy Eating and Living (WHEL) Study. Controlled Clinical Trials 2002;23(6):728-56. [DOI] [PubMed] [Google Scholar]
- Pierce JP, Natarajan L, Caan BJ, Flatt SW, Kealey S, Gold EB, et al. Dietary change and reduced breast cancer events among women without hot flashes after treatment of early-stage breast cancer: subgroup analysis of the Women's Healthy Eating and Living Study. American Journal of Clinical Nutrition 2009;89(5):1565S-71S. [DOI] [PMC free article] [PubMed] [Google Scholar]
- Pierce JP, Natarajan L, Caan BJ, Parker BA, Greenberg ER, Flatt SW, et al. Influence of a diet very high in vegetables, fruit, and fiber and low in fat on prognosis following treatment for breast cancer: the Women's Healthy Eating and Living (WHEL) randomized trial. JAMA 2007;298(3):289-98. [DOI] [PMC free article] [PubMed] [Google Scholar]
- Pierce JP, Natarajan L, Sun S, Al-Delaimy W, Flatt SW, Kealey S, et al. Increases in plasma carotenoid concentrations in response to a major dietary change in the Women's Healthy Eating and Living study. Cancer Epidemiology, Biomarkers & Prevention 2006;15(10):1886-92. [DOI] [PubMed] [Google Scholar]
- Pierce JP, Newman VA, Flatt SW, Faerber S, Rock CL, Natarajan L, et al. Telephone counseling intervention increases intakes of micronutrient- and phytochemical-rich vegetables, fruit and fiber in breast cancer survivors. Journal of Nutrition 2004;134(2):452-8. [DOI] [PubMed] [Google Scholar]
- Pierce JP. A randomized trial of the effect of a plant-based dietary pattern on additional breast cancer events and survival: the Women's Healthy Eating and Living (WHEL) Study. Controlled Clinical Trials 2002;23(6):728-56. [DOI] [PubMed] [Google Scholar]
- Pierce JP. Diet and breast cancer prognosis: making sense of the Women's Healthy Eating and Living and Women's Intervention Nutrition Study trials. Current Opinion in Obstetrics & Gynecology 2009;21(1):86-91. [DOI] [PMC free article] [PubMed] [Google Scholar]
- Rock CL, Flatt SW, Laughlin GA, Gold EB, Thomson CA, Natarajan L, et al. Reproductive steroid hormones and recurrence-free survival in women with a history of breast cancer. Cancer Epidemiology, Biomarkers & Prevention 2008;17(3):614-20. [DOI] [PMC free article] [PubMed] [Google Scholar]
- Rock CL, Flatt SW, Newman V, Caan BJ, Haan MN, Stefanick ML, et al. Factors associated with weight gain in women after diagnosis of breast cancer. Women's Healthy Eating and Living Study Group. Journal of the American Dietetic Association 1999;99(10):1212-21. [DOI] [PubMed] [Google Scholar]
- Rock CL, Flatt SW, Thomson CA, Stefanick ML, Newman VA, Jones L, et al. Plasma triacylglycerol and HDL cholesterol concentrations confirm self-reported changes in carbohydrate and fat intakes in women in a diet intervention trial. Journal of Nutrition 2004;134(2):342-7. [DOI] [PubMed] [Google Scholar]
- Rock CL, Natarajan L, Pu M, Thomson CA, Flatt SW, Caan BJ, et al. Longitudinal biological exposure to carotenoids is associated with breast cancer-free survival in the Women's Healthy Eating and Living Study. Cancer Epidemiology, Biomarkers & Prevention 2009;18(2):486-94. [DOI] [PMC free article] [PubMed] [Google Scholar]
- Saquib N, Flatt SW, Natarajan L, Thomson CA, Bardwell WA, Caan B, et al. Weight gain and recovery of pre-cancer weight after breast cancer treatments: evidence from the Women's Healthy Eating and Living (WHEL) study. Breast Cancer Research & Treatment 2007;105(2):177-86. [DOI] [PubMed] [Google Scholar]
- Saxe GA, Madlensky L, Kealey S, Wu DP, Freeman KL, Pierce JP, et al. Disclosure to physicians of CAM use by breast cancer patients: findings from the Women's Healthy Eating and Living Study. Integrative Cancer Therapies 2008;7(3):122-9. [DOI] [PMC free article] [PubMed] [Google Scholar]
WHO primary prev 1979 {published data only}
- WHO Primary prevention trial. Primary prevention of ischaemic heart disease: WHO coordinated cooperative trial. A summary report. Bulletin Of The World Health Organization 1979;57(5):801-5. [PMC free article] [PubMed] [Google Scholar]
WHT 1990 {published and unpublished data}
- Bowen D, Clifford CK, Coates R, Evans M, Feng Z, Fouad M, et al. The Women's Health Trial feasibility study in minority populations: design and baseline descriptions. Annals of Epidemiology 1996;6(6):507-19. [DOI] [PubMed] [Google Scholar]
- Bowen D. The role of participation in the Women's Health trial: feasibility study in minority populations. Preventive Medicine 2000;31(5):474-80. [DOI] [PubMed] [Google Scholar]
- Bowen DJ, Kestin M, McTiernan A, Carrell D, Green P. Effects of dietary fat intervention on mental health in women. Cancer Epidemiology, Biomarkers and Prevention 1995;4(5):555-9. [PubMed] [Google Scholar]
- Gorbach SL, Morrill LA, Woods MN, Dwyer JT, Selles WD, Henderson M, et al. Changes in food patterns during a low-fat dietary intervention in women. Journal of the American Dietetic Association 1990;90(6):802-9. [PubMed] [Google Scholar]
- Henderson MM, Kushi LH, Thompson DJ, Gorbach SL, Clifford CK, Insull W, et al. Feasibility of a randomized trial of a low-fat diet for the prevention of breast cancer: dietary compliance in the Women's Health Trial Vanguard Study. Preventive Medicine 1990;19(2):115-33. [DOI] [PubMed] [Google Scholar]
- Insull W, Henderson MM, Prentice RL, Thompson DJ, Clifford C, Goldman S, et al. Results of a randomized feasibility study of a low-fat diet. Archives of Internal Medicine 1990;150(2):421-7. [PubMed] [Google Scholar]
- Kristal AR, White E, Shattuck AL, Curry S, Anderson GL, Fowler A, et al. Long-term maintenance of a low-fat diet: durability of fat-related dietary habits in the Women's Health Trial. Journal of the American Dietetic Association 1992;92(5):553-9. [PubMed] [Google Scholar]
- Prentice RL, Kakar F, Hursting S, Sheppard L, Klein R, Kushi LH. Aspects of the rationale for the Women's Health Trial. Journal of the National Cancer Institute 1988;80(11):802-14. [DOI] [PubMed] [Google Scholar]
- Self S, Prentice R, Iverson D, Henderson M, Thompson D, Byar D, et al. Statistical design of the Women's Health Trial. Controlled Clininical Trials 1988;9(2):119-36. [DOI] [PubMed] [Google Scholar]
- Sheppard L, Kristal AR, Kushi LH. Weight loss in women participating in a randomised trial of low-fat diets. American Journal of Clinical Nutrition 1991;54(5):821-8. [DOI] [PubMed] [Google Scholar]
- Urban N, Baker M. The Women's Health Trial as an investment. Medical Decision Making 1989;9(1):59-64. [DOI] [PubMed] [Google Scholar]
- White E, Shattuck AL, Kristal AR, Urban N, Prentice RL, Henderson MM, et al. Maintenance of a low-fat diet: follow-up of the Women's Health Trial. Cancer Epidemiology, Biomarkers and Prevention 1992;1(4):315-23. [PubMed] [Google Scholar]
WHT Feasibility 2003 {published and unpublished data}
- Bowen D, Clifford CK, Coates R, Evans M, Feng Z, Fouad M, et al. The Women's Health Trial Feasibility Study in Minority Populations: design and baseline descriptions. Annals of Epidemiology 1996;6(6):507-19. [DOI] [PubMed] [Google Scholar]
- Hall WD, Feng Z, George VA, Lewis CE, Oberman A, Huber M, et al. Low-fat diet: effect on anthropometrics, blood pressure, glucose, and insulin in older women. Ethnicity and Disease 2003;13(3):337-43. [PubMed] [Google Scholar]
Wilke 1974 {published data only}
- Wilke H, Frahm H. Influence of low-caloric-diet and d-triiodothyronine on serum lipids and body weight (author's trans) [Verhalten der serumlipide und des körpergewichts unter reduktionsdiät und medikamentöser behandlung mit d-trijodthyronin]. Medizinische Klinik 1974;69(48):1986-9. [PubMed] [Google Scholar]
Williams 1990 {published data only}
- Williams PT, Krauss RM, Vranizan KM, Wood PS. Changes in lipoprotein subfractions during diet-induced and exercise-induced weight loss in moderately overweight men. Circulation 1990;81(4):1293-304. [DOI] [PubMed] [Google Scholar]
Williams 1992 {published data only}
- Williams PT, Krauss RM, Vranizan KM, Albers JJ, Wood PD. Effects of weight-loss by exercise and by diet on apolipoproteins A-I and A-II and the particle-size distribution of high-density lipoproteins in men. Metabolism: Clinical and Experimental 1992;41(4):441-9. [DOI] [PMC free article] [PubMed] [Google Scholar]
Williams 1994 {published data only}
- Williams PT, Stefanick ML, Vranizan KM, Wood PD. The effects of weight loss by exercise or by dieting on plasma high-density lipoprotein (HDL) levels in men with low, intermediate, and normal-to-high HDL at baseline. Metabolism 1994;43(7):917-24. [DOI] [PMC free article] [PubMed] [Google Scholar]
Wilmot 1952 {published data only}
- Wilmot VA, Swank RL. The influence of low fat diet on blood lipid levels in health and in multiple sclerosis. American Journal of the Medical Sciences 1952;223(1):25-34. [DOI] [PubMed] [Google Scholar]
Wing 1998 {published data only}
- Wing RR, Venditti E, Jakicic JM, Polley BA, Lang W. Lifestyle intervention in overweight individuals with a family history of diabetes. Diabetes Care 1998;21(3):350-9. [DOI] [PubMed] [Google Scholar]
WINS UK 2011 {published and unpublished data}
- Parry BM, Milne JM, Yadegarfar G, Rainsbury RM. Dramatic dietary fat reduction is feasible for breast cancer patients: results of the randomised study, WINS (UK) - stage 1. European Journal of Surgical Oncology 2011;37(10):848-55. [DOI] [PubMed] [Google Scholar]
WOMAN 2007 {published data only}
- Kuller LH, Kriska AM, Kinzel LS, Simkin-Silverman LR, Sutton-Tyrrell K, Johnson BD, et al. The clinical trial of Women On the Move through Activity and Nutrition (WOMAN) study. Contemporary Clinical Trials 2007;28(4):370-81. [DOI] [PMC free article] [PubMed] [Google Scholar]
Wood 1988 {published data only}
- Wood PD, Stefanick ML, Dreon DM, Frey HB, Garay SC, Williams PT, et al. Changes in plasma lipids and lipoproteins in overweight men during weight loss through dieting as compared with exercise. New England Journal of Medicine 1988;319(18):1173-9. [DOI] [PubMed] [Google Scholar]
Woollard 2003 {published data only}
- Woollard J, Burke V, Beilin LJ, Verheijden M, Bulsara MK. Effects of a general practice-based intervention on diet, body mass index and blood lipids in patients at cardiovascular risk. Journal of Cardiovascular Risk 2003;10(1):31-40. [DOI] [PubMed] [Google Scholar]
Working Well 1996 {published data only}
- Sorensen G, Thompson B, Glanz K, Feng Z, Kinne S, DiClemente C, et al. Work site-based cancer prevention: primary results from the Working Well Trial. American Journal of Public Health 1996;86(7):939-47. [DOI] [PMC free article] [PubMed] [Google Scholar]
Zock 1995 {published and unpublished data}
- Zock PL, Mensink RP, Harryvan J, De Vries JH, Katan MB. Fatty acids in serum cholesteryl esters as quantitative biomarkers of dietary intake in humans. American Journal of Epidemiology 1997;145(12):1114-22. [DOI] [PubMed] [Google Scholar]
- Zock PL. Dietary Fatty Acids and Risk Factors for Coronary Heart Disease: Controlled Studies in Healthy Volunteers [PhD thesis]. Wageningen, Netherlands: Landbouwuniversiteit te Wageningen, 1995. [Google Scholar]
References to studies awaiting assessment
ICFAMED {published data only}ISRCTN27497769
- Lapetra J, Lozano-Rodríguez JM, Caballero-Valderrama MR, Santos-Lozano JM, Ortega-Calvo M, García de la Corte FJ, et al. Effect of a Mediterranean diet on the primary prevention of atrial fibrillation and major cardiovascular events in hypertensive patients with high cardiovascular risk: results of ICFAMED study. In: Obesity and Nutrition in the 21st Century. VIII Symposium Ciber Fisiopatología de la Obesidad y Nutrición; 2017; Madrid. Madrid: Ciber Fisiopatología de la Obesidad y Nutrición, 2017:71.
- Lapetra J, Lozano-Rodriguez JM, Miro-Moriano L, Ortega-Calvo M, Santos-Lozano JM, Garcia-Corte FJ, et al. Effect of a Mediterranean diet on the primary prevention of atrial fibrillation and major cardiovascular events in hypertensive patients with high cardiovascular risk: results of ICFAMED randomized trial. European Journal of Clinical Investigation 2018;48:182‐3. [Google Scholar]
References to ongoing studies
ENAbLE due unclear {published data only}
- English C, Patterson A, MacDonald-Wicks L, Attia J, Callister R, Hillier S, et al. ENAbLE: Secondary prevention of stroke. A physical activity and diet trial protocol. Abstracts Presented at the SMART STROKES 2019 Conference, 8–9 August 2019, Hunter Valley, NSW. International Journal of Stroke 2019;14(1 Suppl):12. [DOI: 10.1177/1747493019858233] [DOI] [Google Scholar]
NCT02481466 due 2020 {published data only}
- NCT02481466. The combined portfolio diet and exercise study (PortfolioEx). clinicaltrials.gov/ct2/show/NCT02481466 (first posted 25 June 2015).
NCT02938832 due 2023 {published data only}
- NCT02938832. Does the advice to eat a Mediterranean diet with low carbohydrate intake, compared with a low-fat diet, reduce diabetes and cardiovascular disease? clinicaltrials.gov/ct2/show/NCT02938832 (first posted 19 October 2016).
NEW Soul Study due 2022 {published data only}
- NCT03354377. Nutritious Eating With Soul (The NEW Soul Study). https://clinicaltrials.gov/ct2/show/NCT03354377 (first posted 27 November 2017).
- Turner-McGrievy G, Wilcox S, Frongillo EA, Murphy A, Hutto B, Williams K, et al. The Nutritious Eating with Soul (NEW Soul) Study: Study design and methods of a two-year randomized trial comparing culturally adapted soul food vegan vs. omnivorous diets among African American adults at risk for heart disease. Contemporary Clinical Trials 2020;88:105897. [DOI] [PMC free article] [PubMed] [Google Scholar]
Additional references
4S 1994
- Scandinavian Simvastatin Survival Study Group. Randomised trial of cholesterol lowering in 4444 patients with coronary heart disease: the Scandinavian Simvastatin Survival Study (4S). Lancet 1994;344(8934):1383-9. [PubMed] [Google Scholar]
Abdelhamid 2018
- Abdelhamid AS, Martin N, Bridges C, Brainard JS, Wang X, Brown TJ, et al. Polyunsaturated fatty acids for the primary and secondary prevention of cardiovascular disease. Cochrane Database of Systematic Reviews 2018, Issue 11. Art. No: CD012345. [DOI: 10.1002/14651858.CD012345.pub2] [CD012345] [DOI] [PMC free article] [PubMed] [Google Scholar]
Abdelhamid 2019
- Abdelhamid AS, Hooper L, Sivakaran R, Hayhoe R, Welch AA, PUFAH Group. The relationship between omega-3, omega-6 and total polyunsaturated fat and musculoskeletal health and functional status in adults: a systematic review and meta-analysis of RCTs. Calcified Tissue International 2019;105(4):353-72. [DOI: 10.1007/s00223-019-00584-3] [DOI] [PubMed] [Google Scholar]
Abdelhamid 2020
- Abdelhamid AS, Brown TJ, Brainard JS, Biswas P, Thorpe GC, Moore HJ, Deane KHO, Summerbell CD, Worthington HV, Song F, Hooper L. Omega-3 fatty acids for the primary and secondary prevention of cardiovascular disease. Cochrane Database of Systematic Reviews 2020, Issue 3. Art. No: CD003177. [DOI: 10.1002/14651858.CD003177.pub5] [CD003177] [DOI] [PMC free article] [PubMed] [Google Scholar]
Alonso 2006
- Alonso Á, Ruiz-Gutierrez V, Martínez-González MÁ. Monounsaturated fatty acids, olive oil and blood pressure: epidemiological, clinical and experimental evidence. Public Health Nutrition 2006;9(2):251-7. [DOI] [PubMed] [Google Scholar]
Astrup 2000
- Astrup A, Ryan L, Grunwald GK, Storgaard M, Saris W, Melanson E, et al. The role of dietary fat in body fatness: evidence from a preliminary meta-analysis of ad libitum low-fat dietary intervention studies. British Journal of Nutrition 2000;83(Suppl 1):S25-32. [DOI] [PubMed] [Google Scholar]
Astrup 2011
- Astrup A, Dyerberg J, Elwood P, Hermansen K, Hu FB, Jakobsen MU, et al. The role of reducing intakes of saturated fat in the prevention of cardiovascular disease: where does the evidence stand in 2010? American Journal of Clinical Nutrition 2011;93(4):684–8. [DOI] [PMC free article] [PubMed] [Google Scholar]
Berkley 1995
- Berkley CS, Hoaglin DC, Mosteller F, Colditz GA. A random-effects regression model for meta-analysis. Statistics in Medicine 1995;14(4):395-411. [DOI] [PubMed] [Google Scholar]
Blann 1995
- Blann AD, Jackson P, Bath PM, Watts GF. Von Willebrand factor, a possible indicator of endothelial cell damage, decreases during long-term compliance with a lipid-lowering diet. Journal of Internal Medicine 1995;237(6):557-61. [DOI] [PubMed] [Google Scholar]
Brainard 2020
- Brainard J, Jimoh OF, Deane K, Biswas P, Donaldson D, Maas K, et al. Omega-3, omega-6, and polyunsaturated fat for cognition: systematic review and meta-analysis of randomized trials. Journal of the American Medical Directors Association 2020;15 April 2020 [Epub ahead of print]. [DOI: 10.1016/j.jamda.2020.02.022] [DOI] [PubMed]
Briel 2009
- Briel M, Ferreira-Gonzalez I, You JJ, Karanicolas PJ, Akl EA, Wu P, et al. Association between change in high density lipoprotein cholesterol and cardiovascular disease morbidity and mortality: systematic review and meta-regression analysis. BMJ 2009;338:b92. [DOI: 10.1136/bmj.b92] [DOI] [PMC free article] [PubMed] [Google Scholar]
Brown 2019
- Brown TJ, Brainard J, Song F, Wang X, Abdelhamid A, Hooper L. Omega-3, omega-6, and total dietary polyunsaturated fat for prevention and treatment of type 2 diabetes mellitus: systematic review and meta-analysis of randomised controlled trials. BMJ 2019;366:l4697. [DOI] [PMC free article] [PubMed] [Google Scholar]
Brunner 1997
- Brunner E, White I, Thorogood M, Bristow A, Curle D, Marmot M. Can dietary interventions change diet and cardiovascular risk factors? A meta-analysis of randomized controlled trials. American Journal of Public Health 1997;87(9):1415-22. [DOI] [PMC free article] [PubMed] [Google Scholar]
Bucher 1996
- Bucher HC, Cook RJ, Guyatt GH, Lang JD, Cook DJ, Hatala R, et al. Effects of dietary calcium supplementation on blood pressure: a meta-analysis of randomised controlled trials. JAMA 1996;275(13):1016-22. [DOI] [PubMed] [Google Scholar]
Chalmers 1990
- Chalmers I, Adams M, Dickersin K, Hetherington J, Tarnow-Mordi W, Meinert C, et al. A cohort study of summary reports of controlled trials. JAMA 1990;263(10):1401-5. [PubMed] [Google Scholar]
Clarke 1997
- Clarke R, Frost C, Collins R, Appleby P, Peto R. Dietary lipids and blood cholesterol: quantitative meta-analysis of metabolic ward studies. BMJ 1997;314(7074):112-7. [DOI] [PMC free article] [PubMed] [Google Scholar]
Davey Smith 1993
- Davey Smith G, Song F, Sheldon TA. Cholesterol lowering and mortality: the importance of considering initial level of risk. BMJ 1993;306(6889):1367-73. [DOI] [PMC free article] [PubMed] [Google Scholar]
Dayton 1965
- Dayton S, Hashimoto S, Rosenblum D, Pearce M. Vitamin E status of humans during prolonged feeding of unsaturated fats. Journal of Laboratory and Clinical Medicine 1965;65(5):739-47. [PubMed] [Google Scholar]
De Caterina 2010
- De Caterina R, Scarano M, Marfisi RM, Lucisano G, Palma F, Tatasciore A, et al. Cholesterol-lowering interventions and stroke. Journal of the American College of Cardiology 2010;55(3):198-211. [DOI] [PubMed] [Google Scholar]
Deane 2019
- Deane KHO, Jimoh OF, Biswas P, O'Brien A, Hanson S, Abdelhamid AS, et al. Omega-3 and polyunsaturated fat for prevention of depression and anxiety symptoms: systematic review and meta-analysis of randomised trials. British Journal of Psychiatry 2019 Oct 24 [E-pub ahead of print]. [DOI: 10.1192/bjp.2019.234] [DOI] [PubMed]
Denke 1995
- Denke MA. Cholesterol-lowering diets. A review of the evidence. Archives of Internal Medicine 1995;155(1):17-26. [PubMed] [Google Scholar]
Ebrahim 1997
- Ebrahim S, Davey Smith G. Systematic review of randomised controlled trials of multiple risk factor interventions for preventing coronary heart disease. BMJ 1997;314(7095):1666. [DOI] [PMC free article] [PubMed] [Google Scholar]
Eckel 2013
- Eckel RH, Jakicic JM, Ard JD, De Jesus JM, Houston Miller N, Hubbard VS, et al. 2013 AHA/ACC guideline on lifestyle management to reduce cardiovascular risk: a report of the American College of Cardiology/American Heart Association Task Force on Practice Guidelines. Circulation 2013;129(25 suppl 2):S76-99. [DOI: 10.1161/01.cir.0000437740.48606.d1] [DOI] [PubMed] [Google Scholar]
Egger 1997
- Egger M, Davey Smith G, Schneider M, Minder C. Bias in meta-analysis detected by a simple graphical test. BMJ 1997;315(7109):629-34. [DOI] [PMC free article] [PubMed] [Google Scholar]
ESC/EAS 2011
- Task Force for the management of dyslipidaemias of the European Society of Cardiology (ESC) and the European Atherosclerosis Society (EAS). ESC/EAS Guidelines for the management of dyslipidaemias. European Heart Journal 2011;32(14):1769-1818. [DOI: 10.1093/eurheartj/ehr158] [DOI] [PubMed] [Google Scholar]
Gofman 1949
- Gofman JW, Lindgren FT, Elliott HA. Ultracentrifugal studies of lipoproteins of human serum. Journal of Biological Chemistry 1949;179(2):973-9. [PubMed] [Google Scholar]
GRADE 2004
- Atkins D, Best D, Briss PA, Eccles M, Falck-Ytter Y, Flottorp S, et al. Grading quality of evidence and strength of recommendations. BMJ 2004;328(7454):1490. [DOI] [PMC free article] [PubMed] [Google Scholar]
GRADEpro 2015 [Computer program]
- GRADEpro GDT. https://gradepro.org/: McMaster University and Evidence Prime Inc, 2015.
Grundy 2019
- Grundy SM, Stone NJ, Bailey AL, Beam C, Birtcher KK, Blumenthal RS, et al. 2018 AHA/ACC/AACVPR/AAPA/ABC/ACPM/ADA/AGS/APhA/ASPC/NLA/PCNA Guideline on the Management of Blood Cholesterol. Journal of the American College of Cardiology 2019;73(24):e285-350. [DOI] [PubMed] [Google Scholar]
Hanson 2020
- Hanson S, Thorpe G, Winstanley L, Abdelhamid AS, Hooper L, PUFAH Group. Omega-3, omega-6 and total dietary polyunsaturated fat on cancer incidence: systematic review and meta-analysis of randomised trials. British Journal of Cancer 2020;122:1260-70. [DOI: 10.1038/s41416-020-0761-6] [DOI] [PMC free article] [PubMed]
Harcombe 2015
- Harcombe Z, Baker JS, Cooper SM, Davies B, Sculthorpe N, DiNicolantonio JJ, et al. Evidence from randomised controlled trials did not support the introduction of dietary fat guidelines in 1977and 1983: a systematic review and meta-analysis. Open Heart 2015;2(1):e000196. [DOI: 10.1136/openhrt-2014-000196] [DOI] [PMC free article] [PubMed] [Google Scholar]
Hauck 1991
- Hauck WW, Gilliss CL, Donner A, Gortner S. Randomisation by cluster. Nursing Research 1991;40(6):356-8. [PubMed] [Google Scholar]
Hegsted 1965
- Hegsted DM, McGandy RB, Myers ML, Stare FJ. Quantitative effects of dietary fat on serum cholesterol in man. American Journal of Clinical Nutrition 1965;17(5):281-95. [DOI] [PubMed] [Google Scholar]
Hegsted 2000
- Hegsted DM. From chick nutrition to nutrition policy. Annual Review of Nutrition 2000;20:1-19. [DOI] [PubMed] [Google Scholar]
Hession 2009
- Hession M, Rolland C, Kulkarni U, Wise A, Broom J. Systematic review of randomized controlled trials of low-carbohydrate vs. low-fat/low-calorie diets in the management of obesity and its comorbidities. Obesity Reviews 2009;10(1):36-50. [DOI] [PubMed] [Google Scholar]
Higgins 2003
- Higgins JPT, Thompson SG, Deeks JJ, Altman DG. Measuring inconsistency in meta-analyses. BMJ 2003;327(7414):557-60. [DOI] [PMC free article] [PubMed] [Google Scholar]
Higgins 2011
- Higgins JPT, Green S (editors). Cochrane Handbook for Systematic Reviews of Interventions Version 5.1.0 [updated March 2011]. The Cochrane Collaboration, 2011. Available from handbook.cochrane.org.
Hooper 2015b
- Hooper L, Abdelhamid A, Bunn D, Brown T, Summerbell CD, Skeaff CM. Effects of total fat intake on body weight. Cochrane Database of Systematic Reviews 2015, Issue 8. Art. No: CD011834. [DOI: 10.1002/14651858.CD011834] [DOI] [PMC free article] [PubMed] [Google Scholar]
Hooper 2018
- Hooper L, Al-Khudairy L, Abdelhamid AS, Rees K, Brainard JS, Brown TJ, et al. Omega-6 fats for the primary and secondary prevention of cardiovascular disease. Cochrane Database of Systematic Reviews 2018, Issue 11. Art. No: CD011094. [DOI: 10.1002/14651858.CD011094.pub3] [CD011094] [DOI] [PMC free article] [PubMed] [Google Scholar]
Hooper 2019
- Hooper L, Abdelhamid A, Brainard J, Deane KHO, Song F. Creation of a database to assess effects of omega-3, omega-6 and total polyunsaturated fats on health: database and methodology for a set of reviews. BMJ Open 2019;9(5):e029554. [DOI: 10.1136/bmjopen-2019-029554] [DOI] [PMC free article] [PubMed] [Google Scholar]
Howard 2010
- Howard BV, Curb JD, Eaton CB, Kooperberg C, Ockene J, Kostis JB, et al. Low-fat dietary pattern and lipoprotein risk factors: the Women's Health Initiative dietary modification trial. American Journal of Clinical Nutrition 2010;91(4):860-74. [DOI] [PMC free article] [PubMed] [Google Scholar]
Kagan 1974
- Kagan A, Harris BR, Winkelstein W Jr, Johnson KG, Kato H, Syme SL, et al. Epidemiologic studies of coronary heart disease and stroke in Japanese men living in Japan, Hawaii and California: demographic, physical, dietary and biochemical characteristics. Journal of Chronic Disease 1974;27(7-8):345-64. [DOI] [PubMed] [Google Scholar]
Kasim 1993
- Kasim SE, Martino S, Kim P-N, Khilnani S, Boomer A, Depper J, et al. Dietary and anthropometric determinants of plasma lipoproteins during a long-term low-fat diet in healthy women. American Journal of Clinical Nutrition 1993;57(2):146-53. [DOI] [PubMed] [Google Scholar]
Katan 2010
- Katan MB, Brouwer IA, Clarke R, Geleijnse JM, Mensink RP. Saturated fat and heart disease. American Journal of Clinical Nutrition 2010;92(2):459-60; author reply 460-1. [DOI] [PMC free article] [PubMed] [Google Scholar]
Keys 1950
- Keys A, Mickelsen O, Miller EV, Carleton B. The relation in man between cholesterol levels in the diet and in the blood. Science 1950;112(2899):79-81. [DOI] [PubMed] [Google Scholar]
Keys 1986
- Keys A, Menotti A, Karvonen MJ, Aravanis C, Blackburn H, Buzina RM, et al. The diet and 15-year death rate in the seven countries study. American Journal of Epidemiology 1986;124(6):903-15. [DOI] [PubMed] [Google Scholar]
Kodama 2009
- Kodama S, Saito K, Tanaka S, Maki M, Yachi Y, Sato M, et al. Influence of fat and carbohydrate proportions on the metabolic profile in patients with type 2 diabetes: a meta-analysis. Diabetes Care 2009;32(5):959-65. [DOI] [PMC free article] [PubMed] [Google Scholar]
Kristal 2005
- Kristal AR, Peters U, Potter JD. Is it time to abandon the food frequency questionnaire? Cancer Epidemiology, Biomarkers and Prevention 2005;14(12):2826-8. [DOI] [PubMed] [Google Scholar]
Law 1991
- Law MR, Frost CD, Wald NJ. By how much does dietary salt restriction lower blood pressure? BMJ 1991;302(6780):811-24. [DOI] [PMC free article] [PubMed] [Google Scholar]
Law 1994
- Law MR, Wald NJ, Thompson SG. By how much and how quickly does reduction in serum cholesterol concentration lower risk of ischaemic heart disease? BMJ 1994;308(6925):367-73. [DOI] [PMC free article] [PubMed] [Google Scholar]
Lefebvre 2011
- Lefebvre C, Manheimer E, Glanville J. Chapter 6: Searching for studies. In: Higgins JPT, Green S (editors). Cochrane Handbook for Systematic Reviews of Interventions Version 5.1.0 [updated March 2011]. The Cochrane Collaboration, 2011. Available from handbook.cochrane.org.
Lenz 2007
- Lenz M, Steckelberg A, Richter B, Mühlhauser I. Meta-analysis does not allow appraisal of complex interventions in diabetes and hypertension self-management: a methodological review. Diabetologia 2007;50(7):1375–83. [DOI] [PubMed] [Google Scholar]
Lichtenstein 2006
- Lichtenstein AH, Appel LJ, Brands M, Carnethon M, Daniels S, Franch HA, et al. Diet and lifestyle recommendations revision 2006: a scientific statement from the American Heart Association Nutrition Committee. Circulation 2006;114(1):82-96. [DOI] [PubMed] [Google Scholar]
Lopez‐Espinoza 1984
- Lopez-Espinoza I, Howard WJ, Mann JI, Carter RD, Hockaday TD. Fatty acid composition of platelet phospholipids in non-insulin-dependent diabetics randomized for dietary advice. British Journal of Nutrition 1984;52(1):41-7. [DOI] [PubMed] [Google Scholar]
Mach 2019
- Mach F, Baigent C, Catapano AL, Koskinas KC, Casula M, Badimon L, et al. 2019 ESC/EAS guidelines for the management of dyslipidaemias: lipid modification to reduce cardiovascular risk. Atherosclerosis 2019;290:140-205. [DOI] [PubMed] [Google Scholar]
Malhotra 2014
- Malhotra A, Shafiq N, Arora A, Singh M, Kumar R, Malhotra S. Dietary interventions (plant sterols, stanols, omega-3 fatty acids, soy protein and dietary fibers) for familial hypercholesterolaemia. Cochrane Database of Systematic Reviews 2014, Issue 6. Art. No: CD001918. [DOI: 10.1002/14651858.CD001918.pub3] [DOI] [PMC free article] [PubMed] [Google Scholar]
Marchioli 1994
- Marchioli R, Prieto JC, Tognoni G. Surrogate end-points: the case of trials on coronary atherosclerotic plaque regression. Clinical Trials and Meta-Analyses 1994;29(2-3):139-76. [PubMed] [Google Scholar]
Mensink 1992
- Mensink RP, Katan MB. Effect of dietary fatty acids on serum lipids and lipoproteins: a meta-analysis of 27 trials. Arteriosclerosis and Thrombosis 1992;12(8):911-9. [DOI] [PubMed] [Google Scholar]
Mensink 2003
- Mensink RP, Zock PL, Kester ADM, Katan MB. Effects of dietary fatty acids and carbohydrates on the ratio of serum total to HDL cholesterol and on serum lipids and apolipoproteins: a meta-analysis of 60 controlled trials. American Journal of Clinical Nutrition 2003;77(5):1146-55. [DOI] [PubMed] [Google Scholar]
Michels 2009
- Michels KB, Willett WC. The Women's Health Initiative randomized controlled dietary modification trial: a post-mortem. Breast Cancer Research and Treatment 2009;114(1):1-6. [DOI] [PubMed] [Google Scholar]
Mozaffarian 2010
- Mozaffarian D, Micha R, Wallace S. Effects of coronary heart disease of increasing polyunsaturated fat in place of saturated fat: a systematic review and meta-analysis of randomized controlled trials. PLOS Medicine 2010;7(3):e1000252. [DOI] [PMC free article] [PubMed] [Google Scholar]
Ness 1997
- Ness AR, Powles JW. Fruit and vegetables, and cardiovascular disease: a review. International Journal of Epidemiology 1997;26(1):1-13. [DOI] [PubMed] [Google Scholar]
NHS 2020
- NHS. How to eat less saturated fat. www.nhs.uk/live-well/eat-well/eat-less-saturated-fat/ (accessed 11 Feb 2020).
NICE 2014
- National Institute of Health and Care Excellence. Lipid modification: cardiovascular risk assessment and the modification of blood lipids for the primary and secondary prevention of cardiovascular disease. www.nice.org.uk/guidance/cg181/resources/guidance-lipid-modification-cardiovascular-risk-assessment-and-the-modification-of-blood-lipids-for-the-primary-and-secondary-prevention-of-cardiovascular-disease-pdf (accessed 29th Dec 2019). [PubMed]
O'Gara 2014
- O'Gara PT, Kushner FG, Ascheim DD, Casey DE Jr, Chung MK, De Lemos JA, et al. 2013 ACCF/AHA guideline for the management of ST-elevation myocardial infarction: a report of the American College of Cardiology Foundation/American Heart Association Task Force on Practice Guidelines. Circulation 2013;127(4):e362-e425. [DOI: 10.1161/CIR.0b013e3182742cf6 ] [DOI] [PubMed] [Google Scholar]
Oliver 1953
- Oliver MF, Boyd GS. The plasma lipids in coronary artery disease. British Heart Journal 1953;15(4):387-90. [DOI] [PMC free article] [PubMed] [Google Scholar]
Oliver 2000
- Oliver MF. Pioneer research in Britain into atherosclerosis and coronary heart disease - an historical review. Atherosclerosis 2000;150(1):1-12. [DOI] [PubMed] [Google Scholar]
Page 2019
- Page MJ, Higgins JPT, Sterne JAC. Chapter 13: Assessing risk of bias due to missing results in a synthesis. In: Higgins JPT, Thomas J, Chandler J, Cumpston M, Li T, Page MJ, Welch VA (editors). Cochrane Handbook for Systematic Reviews of Interventions Version 6.0 (updated July 2019). Cochrane 2019. Available from www.training.cochrane.org/handbook.
Patterson 2003
- Patterson RE, Kristal A, Rodabough R, Caan B, Lillington L, Mossavar-Rahmani Y, et al. Changes in food sources of dietary fat in response to an intensive low-fat dietary intervention: early results from the Women's Health Initiative. Journal of the American Dietetic Association 2003;103(4):454-60. [DOI] [PubMed] [Google Scholar]
Prentice 2007
- Prentice RL. Observational studies, clinical trials, and the Women's Health Initiative. Lifetime Data Analysis 2007;13(4):449-62. [DOI] [PubMed] [Google Scholar]
Rees 2013
- Rees K, Dyakova M, Wilson N, Ward K, Thorogood M, Brunner E. Dietary advice for reducing cardiovascular risk. Cochrane Database of Systematic Reviews 2013, Issue 12. Art. No: CD002128. [DOI: 10.1002/14651858.CD002128.pub5] [DOI] [PMC free article] [PubMed] [Google Scholar]
Rimm 1996
- Rimm EB, Klatsky A, Grobbee D, Stampfer MJ. Review of moderate alcohol consumption and reduced risk of coronary heart disease: is the effect due to beer, wine or spirits? BMJ 1996;312(7033):731-6. [DOI] [PMC free article] [PubMed] [Google Scholar]
Robertson 1977
- Robertson TL, Kato H, Rhoads GG, Kagan A, Marmot M, Syme SL, et al. Epidemiologic studies of coronary heart disease and stroke in Japanese men living in Japan, Hawaii and California. Incidence of myocardial infarction and death from coronary heart disease. American Journal of Cardiology 1977;39(2):239-43. [DOI] [PubMed] [Google Scholar]
Robinson 2009
- Robinson JG, Wang S, Smith BJ, Jacobson TA. Meta-analysis of the relationship between non-high-density lipoprotein cholesterol reduction and coronary heart disease risk. Journal of the American College of Cardiology 2009;53(4):316-22. [DOI] [PubMed] [Google Scholar]
Rubins 1995
- Rubins HB. Cholesterol in patients with coronary heart disease: how low should we go? Journal of General Internal Medicine 1995;10(8):464-71. [DOI] [PubMed] [Google Scholar]
Ryle 1949
- Ryle JA, Russell WT. The natural history of coronary disease. A clinical and epidemiological study. British Heart Journal 1949;11(4):370. [DOI] [PMC free article] [PubMed] [Google Scholar]
SACN 2019
- Scientific Advisory Committee on Nutrition. Saturated fat and health. www.gov.uk/government/publications/saturated-fats-and-health-sacn-report (accessed prior to 30 April 2020).
Savovic 2012
- Savovic J, Jones H, Altman D, Harris R, Jüni P, Pildal J, et al. Influence of reported study design characteristics on intervention effect estimates from randomised controlled trials: combined analysis of meta-epidemiological studies. Health Technology Assessment 2012;16:1-82. [DOI] [PubMed] [Google Scholar]
Scarborough 2010
- Scarborough P, Rayner M, Van Dis I, Norum K. Meta-analysis of effect of saturated fat intake on cardiovascular disease: overadjustment obscures true associations. American Journal of Clinical Nutrition 2010;92(2):458-9; author reply 459. [DOI] [PubMed] [Google Scholar]
Schatzkin 2003
- Schatzkin A, Kipnis V, Carroll RJ, Midthune D, Subar AF, Bingham S, et al. A comparison of a food frequency questionnaire with a 24-hour recall for use in an epidemiological cohort study: results from the biomarker-based Observing Protein and Energy Nutrition (OPEN) Study. International Journal of Epidemiology 2003;32(6):1054-62. [DOI] [PubMed] [Google Scholar]
Schulz 1995
- Schulz KF, Chalmers I, Hayes RJ, Altman DG. Empirical evidence of bias. Dimensions of methodological quality associated with estimates of treatment effects in controlled trials. JAMA 1995;273(5):408-12. [DOI] [PubMed] [Google Scholar]
Schwab 2014
- Schwab U, Lauritzen L, Tholstrup T, Haldorssoni T, Riserus U, Uusitupa M, et al. Effect of the amount and type of dietary fat on cardiometabolic risk factors and risk of developing type-2 diabetes, cardiovascular disease, and cancer: a systematic review. Food & Nutrition Research 2014;58:25145. [DOI: 10.3402/fnr.v58.25145] [DOI] [PMC free article] [PubMed]
Shah 2007
- Shah M, Adams-Huet B, Garg A. Effect of high-carbohydrate or high-cis-monounsaturated fat diets on blood pressure: a meta-analysis of intervention trials. American Journal of Clinical Nutrition 2007;85(5):1251-6. [DOI] [PubMed] [Google Scholar]
Sharp 1998
- Sharp S. Meta-analysis regression. Stata Technical Bulletin 1998;42:16-22. [Google Scholar]
Sheppherd 2009
- Shepperd S, Lewin S, Straus S, Clarke M, Eccles MP, Fitzpatrick R, et al. Can we systematically review studies that evaluate complex interventions? PLOS Medicine 2009;6(8):e1000086. [DOI] [PMC free article] [PubMed] [Google Scholar]
SIGN 1996
- Scottish Intercollegiate Guidelines Network. Management of obesity (national guideline). https://www.sign.ac.uk/sign-115-management-of-obesity (accessed prior to 30 April 2020);115.
Siri‐Tarino 2010
- Siri-Tarino PW, Sun Q, Hu FB, Krauss RM. Meta-analysis of prospective cohort studies evaluating the association of saturated fat with cardiovascular disease. American Journal of Clinical Nutrition 2010;91(3):535-46. [DOI] [PMC free article] [PubMed] [Google Scholar]
Skeaff 2009
- Skeaff CM, Miller J. Dietary fat and coronary heart disease: summary of evidence from prospective cohort and randomised controlled trials. Annals of Nutrition and Metabolism 2009;55(1-3):173-201. [DOI] [PubMed] [Google Scholar]
Stamler 2010
- Stamler J. Diet-heart: a problematic revisit. American Journal of Clinical Nutrition 2010;91(3):497-9. [DOI] [PubMed] [Google Scholar]
Stein 2006
- Stein K. After the media feeding frenzy: whither the Women's Health Initiative Dietary Modification Trial? Journal of the American Dietetic Association 2006;106(6):794-800. [DOI] [PubMed] [Google Scholar]
Sterne 2001
- Sterne JA, Bradburn MJ, Egger M. Meta-analysis in STATA. In: Egger M, Davey Smith G, Altman DG, editors(s). Systematic Reviews in Health Care: Meta-analysis in Context. London: BMJ Books, 2001. [Google Scholar]
Sterne 2009
- Sterne JA. Meta-Analysis in Stata: an Updated Collection from the Stata Journal. Texas, USA: STATA Press, 2009. [Google Scholar]
Thorogood 1996
- Thorogood M. Nutrition. In: Lawrence M, Neil A, Mant D, Fowler G, editors(s). Prevention of Cardiovascular Disease: an Evidence-Based Approach. Kings Lynn: Oxford University Press, 1996:54-66. [Google Scholar]
Walsh 1995
- Walsh JME, Grady D. Treatment of hyperlipidaemia in women. JAMA 1995;274(14):1152-8. [PubMed] [Google Scholar]
Weggemans 2001
- Weggemans RM, Zock PL, Katan MB. Dietary cholesterol from eggs increases the ratio of total cholesterol to high-density lipoprotein cholesterol in humans: a meta-analysis. American Journal of Clinical Nutrition 2001;73(5):885-91. [DOI] [PubMed] [Google Scholar]
Wood 2008
- Wood L, Egger M, Gluud LL, Schulz K, Jüni P, Altman DG, et al. Empirical evidence of bias in treatment effect estimates in controlled trials with different interventions and outcomes: meta-epidemiological study. British Medical Journal 2008;336:601-5. [DOI] [PMC free article] [PubMed] [Google Scholar]
Yngve 2006
- Yngve A, Hambraeus L, Lissner L, Serra Majem L, Vaz de Almeida MD, Berg C, et al. Invited Commentary. The Women's Health Initiative. What is on trial: nutrition and chronic disease? Or misinterpreted science, media havoc and the sound of silence from peers. Public Health Nutrition 2006;9(2):269-72. [DOI] [PubMed] [Google Scholar]
Yu‐Poth 1999
- Yu-Poth S, Zhao G, Etherton T, Naglak M, Jonnalagadda S, Kris-Etherton PM. Effects of the National Cholesterol Education Program's Step I and Step II dietary intervention programs on cardiovascular disease risk factors: a meta-analysis. American Journal of Clinical Nutrition 1999;69(4):632-46. [DOI] [PubMed] [Google Scholar]
References to other published versions of this review
Hooper 2000
- Hooper L, Summerbell CD, Higgins JPT, Thompson RL, Clements G, Capps N, et al. Reduced or modified dietary fat for preventing of cardiovascular disease. Cochrane Database of Systematic Reviews 2000, Issue 2. Art. No: CD002137. [DOI: 10.1002/14651858.CD002137] [DOI] [PubMed] [Google Scholar]
Hooper 2001
- Hooper L, Summerbell CD, Higgins JPT, Thompson RL, Capps N, Davey Smith G, et al. Dietary fat intake and prevention of cardiovascular disease: systematic review. BMJ 2001;322(7289):757-63. [DOI] [PMC free article] [PubMed] [Google Scholar]
Hooper 2011
- Hooper L, Summerbell CD, Thompson R, Sills D, Roberts FG, Moore HJ, et al. Reduced or modified dietary fat for preventing cardiovascular disease. Cochrane Database of Systematic Reviews 2011, Issue 7. Art. No: CD002137. [DOI: 10.1002/14651858.CD002137.pub2] [DOI] [PMC free article] [PubMed] [Google Scholar]
Hooper 2012
- Hooper L, Summerbell CD, Thompson R, Sills D, Roberts FG, Moore HJ, et al. Reduced or modified dietary fat for preventing cardiovascular disease. Cochrane Database of Systematic Reviews 2012, Issue 5. Art. No: CD002137. [DOI: 10.1002/14651858.CD002137.pub3] [DOI] [PMC free article] [PubMed] [Google Scholar]
Hooper 2015a
- Hooper L, Martin N, Jimoh OF, Abdelhamid AS. Reduction in saturated fat intake for cardiovascular disease. Cochrane Database of Systematic Reviews 2015, Issue 6. Art. No: CD011737. [DOI: 10.1002/14651858.CD011737] [DOI] [PubMed] [Google Scholar]