

Artemisinin-based combination therapies (ACTs) have proven to be effective in helping to combat the global malaria epidemic. To optimally apply these drugs, information about their tissue-specific disposition is required, and one approach to predict these pharmacokinetic characteristics is physiologically based pharmacokinetic (PBPK) modeling.
KEYWORDS: antimalarial agents, artemisinin, malaria, modeling, PBPK
ABSTRACT
Artemisinin-based combination therapies (ACTs) have proven to be effective in helping to combat the global malaria epidemic. To optimally apply these drugs, information about their tissue-specific disposition is required, and one approach to predict these pharmacokinetic characteristics is physiologically based pharmacokinetic (PBPK) modeling. In this study, a whole-body PBPK model was developed to simulate the time-dependent tissue concentrations of artesunate (AS) and its active metabolite, dihydroartemisinin (DHA). The model was developed for both rats and humans and incorporated drug metabolism of the parent compound and major metabolite. Model calibration was conducted using data from the literature in a Bayesian framework, and model verification was assessed using separate sets of data. Results showed good agreement between model predictions and the validation data, demonstrating the capability of the model in predicting the blood, plasma, and tissue pharmacokinetics of AS and DHA. It is expected that such a tool will be useful in characterizing the disposition of these chemicals and ultimately improve dosing regimens by enabling a quantitative assessment of the tissue-specific drug levels critical in the evaluation of efficacy and toxicity.
TEXT
Malaria is a global health epidemic resulting in the deaths of nearly half a million people per year (1). The World Health Organization (WHO) recommends artemisinin-based combination therapies (ACTs) as a first-line treatment against uncomplicated Plasmodium falciparum malaria. In countries where malaria is endemic, treatment policies have been progressively updated with the implementation of ACTs in lieu of monotherapies such as chloroquine, amodiaquine, and sulfadoxine-pyrimethamine, leading to a substantial reduction in global morbidity and mortality (1). Artemisinin and semisynthetic derivatives, such as artesunate (AS), artemether (AM), and dihydroartemisinin (DHA), are short-acting antimalarial agents that kill the parasites more rapidly than conventional antimalarial drugs and are active against asexual and some sexual forms of the parasite (2).
Artemisinin is a sesquiterpene lactone endoperoxide. Though the mechanism of action is not completely understood, it has been shown that antimalarial activity results from cleavage of the peroxide bridge in the presence of ferrous iron (Fe2+), producing reactive oxygen species, which are thought to mediate the cytotoxic effect (3). The chemical compounds resulting from metabolism of artemisinins generally fall into one of two categories: (i) hydroxylated compounds with the peroxide bridge intact, which are biologically active, and (ii) deoxy compounds with a reduced peroxide bridge, forming biologically inactive compounds. All biologically active metabolites undergo further metabolism via glucuronidation and/or other conjugation and eventual excretion through the urine and feces (4). Following intravenous (i.v.) administration of the semisynthetic AS, the parent compound is rapidly converted to its active metabolite, DHA (2). Both compounds are available through various routes of administration, but i.v. AS is the WHO’s recommended treatment option for severe malaria because it is the only artemisinin derivative with sufficient water solubility (5). Unfortunately, despite the overall effectiveness of ACTs, concerns have been raised about their potential for toxicity in numerous vital organs, including the brain, heart, and kidneys, as well as a potential for embryotoxicity, genotoxicity, and hemato-immunotoxicity (6). AS has demonstrated cytotoxicity in mammalian cells via apoptosis as the main route of cell death, indicating a potential for adverse side effects (6).
Characterizing drug ADME (absorption, distribution, metabolism, and excretion) is critical in developing appropriate dosing strategies to ensure safety and efficacy. As a result, both experimental and mathematical modeling studies have been conducted to elucidate the pharmacokinetic (PK) characteristics of both AS and DHA. Though most of the experimental pharmacokinetic studies for these compounds have focused on acquiring drug concentrations in plasma over time (7–13), a few investigators have collected data in other tissues (10, 11, 13). The latter studies were all conducted in rats by utilizing radiolabeled doses of the drug and determining concentration with respect to time through measurement of total radioactivity (TR). Complementing this research has been the development of noncompartmental or simple compartmental models based on the acquired data with the intent of estimating various PK metrics of interest, such as maximum concentration in serum (Cmax) and area under the concentration-time curve (AUC). A more mechanistically detailed model was created by Gordi et al. (14), who included in their representation the effects of autoinduction in the liver and were able to accurately predict the PK behavior of artemisinin in healthy human subjects. More recently, Olafuyi and coworkers (15) utilized the advanced dissolution, absorption, and metabolism (ADAM) model (16) to predict the pharmacokinetics of artemether-lumefantrine combination therapies in both adult and pediatric populations, including potential drug-drug interactions of lumefantrine and the tuberculosis chemotherapy rifampicin.
Overall, though informative experiments and modeling studies have been conducted to characterize the disposition of AS, there remain significant questions. In particular, from the perspective of both efficacy and safety, what are the concentrations of AS and its active metabolites over time in tissues relevant to humans? To help address this key question, the aims of the current study were to develop a whole-body physiologically based pharmacokinetic (PBPK) model capable of describing the kinetics involved in the ADME of AS and its active metabolite, DHA (Fig. 1). To this end, the overall strategy was to first develop and validate a model for rats, to extrapolate the model to humans, and to conduct verification based on available data.
FIG 1.

Schematic detailing the generic whole-body structure of the PBPK model.
RESULTS
Model parameters.
Using the procedure outlined in Materials and Methods, influential model parameters were estimated via Bayesian inference from their respective prior distributions. All computed prior and posterior distributions are listed in Table 1. For the case of the rat-specific PBPK (R-PBPK) model, the posterior distributions correspond to MCMC simulations in which the potential scale reduction factor (PSRF) was computed as an R value of 1.0 for each of the estimated model parameters, suggesting that each of the posteriors had converged to a stationary distribution (47). With the human-specific (H-PBPK) model, convergence was observed for most of the estimated parameters by the PSRF obtained as an R value between 1.0 and 1.05 with the exception of four parameters, namely, two of the Michaelis constants for the metabolism of AS in the liver (Km3A4ASand Km3A5AS), the scaling coefficient of AS metabolism in the blood (Cm1), and the scaling coefficient of DHA conjugation in the extrahepatic tissues (Cm3). The nonconverging parameters returned R values corresponding to PSRFs of 1.5, 1.4, 4.41, and 9.76, respectively, indicating that a stationary distribution had not been reached. The reasons behind this lack of convergence for certain parameter distributions are unclear at present.
TABLE 1.
Probability distributions of model parameters for the purposes of model calibration (priors) and model validation (posteriors and the assumed distributions of other relevant parameters)
| Estimated model parameter | Priora | Referenceb | Posteriorc | Other parameter sampled for model validation | Assumed distribution | Referenceb |
|---|---|---|---|---|---|---|
| R-PBPK | ||||||
| Cm1 | TN(0.5, 0.3) | * | N(0.4918, 0.0165) | BW | TN(0.25, 0.16) | 31 |
| Cm2 | TN(5, 0.3) | * | N(8.615, 0.6468) | PBRAS | TN(1.5, 0.2) | 36 |
| Cm3 | TN(5, 0.3) | * | N(5.667, 1.793) | PHAS | TN(3.2, 0.2) | 36 |
| PRESTAS | TN(3.6, 0.2) | 36 | N(5.046, 0.4477) | PKAS | TN(11, 0.2) | 36 |
| PRBCAS | TN(1.4, 0.2) | 36 | N(1.683, 0.08) | PLAS | TN(9.7, 0.2) | 36 |
| PKAS-C | TN(18.6, 0.2) | 10 | N(18.82, 3.681) | PBRDHA | TN(6.1, 0.2) | 36 |
| PRBCAS-C | TN(1.9, 0.2) | 10 | N(1.915, 0.084) | PHDHA | TN(6.2, 0.2) | 36 |
| PRBCDHA | TN(1.9, 0.2) | 36 | N(2.118, 0.1233) | PLDHA | TN(18, 0.2) | 36 |
| PKDHA | TN(16, 0.2) | 36 | ||||
| PBRAS-C, DHA-C | TN(1.6, 0.2) | 10 | ||||
| PHDAS-C, DHA-C | TN(6.1, 0.2) | 10 | ||||
| PKDHA-C | TN(9.3, 0.2) | 10 | ||||
| PLAS-C, DHA-C | TN(18.6, 0.2) | 10 | ||||
| PRBCDHA-C | TN(1.9, 0.2) | 10 | ||||
| H-PBPK | ||||||
| CLCTB | TN(0.0846, 0.2) | 10 | N(0.0847, 0.0002) | BW | TN(65, 0.16) | 31 |
| KGut | TN(2.1, 0.2) | 34 | N(2.138, 0.1673) | PRESTAS | 5.046 | * |
| Vmax3A4AS | TN(0.0464, 0.3) | 19 | N(0.0477, 0.0002) | PRBCAS | 1.683 | * |
| Km3A4AS | TN(42.7, 0.3) | 19 | N(37.99, 17.29) | PKASC | 18.82 | * |
| Vmax3A5AS | TN(0.0857, 0.3) | 19 | N(0.0887, 0.0005) | PRBCASC | 1.915 | * |
| Km3A5AS | TN(79.1, 0.3) | 19 | N(63.49, 167.2) | PRBCDHA | 2.118 | * |
| Vmax2B6AS | TN(0.1148, 0.3) | 20 | N(0.1196, 0.001) | |||
| Km2b6AS | TN(0.75, 0.3) | 20 | N(0.7732, 0.0391) | |||
| VmaxDHA | TN(0.08756, 0.3) | 21 | N(0.0889, 0.0005) | |||
| KmDHA | TN(25.59, 0.3) | 21 | N(24.31, 4.705) | |||
| Cm1 | TN(150, 0.3) | * | N(83.53, 10.53) | |||
| Cm2 | TN(10, 0.3) | * | N(10.43, 6.606) | |||
| Cm3 | TN(200, 0.3) | * | N(264.5, 17.77) | |||
Prior distributions of estimated parameters included a conjugate prior distribution of the variance term for the truncated normal distribution at the lower level. The conjugate prior was assigned an inverse gamma distribution with a shape parameter of 3.0 and a scale parameter of 0.5. TN(a, b) represents a truncated normal distribution with a mean of a and a fractional coefficient of variation (CV), b, truncated between a lower bound (calculated as 0.5a) and an upper bound (calculated as 2a). Single values are listed for parameters that were held constant in the calibration step of H-PBPK.
*, estimated from the present study.
N(c, d) represents a normal distribution with a mean of c and variance d.
Testing and validation of the R-PBPK model.
The R-PBPK model was evaluated by sampling (i) the influential parameters from their corresponding posterior distributions and (ii) relevant partition coefficients from distributions of their computed mean values (Table 1). The simulation results produced a range of R-PBPK model outputs for comparison to the in vivo concentration-time data selected for model validation (8, 13). Data selected for model comparison included AS and DHA concentrations in plasma, as well as TR concentrations in blood, plasma, brain, heart, liver, and kidney tissues (Fig. 2). This comparison is illustrated in Fig. 3 and 4, which shows the validation data (points) coplotted with the mean concentration-time curve (solid line) and 95% prediction intervals (grey area) of the R-PBPK model. For comparison of these data, i.v. doses of AS and DHA were simulated as a short bolus over a duration of less than 1 min.
FIG 2.

Diagram of the metabolic pathways of AS and DHA listed with the corresponding hypothesized tissue site of metabolism, where VB, MU, L, G, and K represent venous blood, muscle, liver, gut, and kidney tissues, respectively. Biologically active compounds are encircled by a solid line, while biologically inactive compounds are encircled with a dotted line.
FIG 3.

Model-predicted pharmacokinetics for unchanged AS (A) and unchanged DHA (B) in rat plasma following i.v. administration of AS at 10 mg/kg. Simulations are coplotted with data taken from the literature (8) for the purposes of model validation. Error bars were digitized from the sourced data set.
FIG 4.

Model-predicted pharmacokinetics of TR concentrations in blood (A), plasma (B), brain (C), heart (D), liver (E), and kidney tissues (F) in rats following an intravenous dose of DHA at 3 mg/kg. Simulations are coplotted with data from the literature (13) for the purposes of model validation. Error bars for blood and plasma were digitized from the sourced dataset.
Testing and validation of the H-PBPK model.
Predictions from the H-PBPK model were assessed using the same method, through sampling of the estimated human model parameters to produce a range of model outputs for comparison to the corresponding in vivo concentration-time data (9). The data selected for model comparison included AS and DHA concentrations in plasma resulting from i.v. administration of AS. This comparison is illustrated in Fig. 5, which uses the same format as the plots described above. Further validation of the human model included simulations wherein AS was administered intravenously once every 24 h for the span of 72 h at 2 mg/kg, 4 mg/kg, and 8 mg/kg. Concentration-time curves for plasma DHA concentration were compared to the validation data (12), represented in Fig. 6, which shows data (points) coplotted with the mean PK profile of DHA (solid line) with 95% prediction intervals (grey area) produced under this particular dosing scenario. Intravenous doses of AS were simulated as a short bolus over the span of 2 min, and all validation data came from studies not used in the calibration step of the H-PBPK model.
FIG 5.

Model-predicted plasma pharmacokinetics of unchanged AS (A) and unchanged DHA (B) in patients with uncomplicated Plasmodium falciparum malaria following i.v. administration of AS at 2.4 mg/kg. Simulations are coplotted with data extracted from the literature (9) for model validation. Error bars were calculated from digitized points extracted from the sourced data set.
FIG 6.
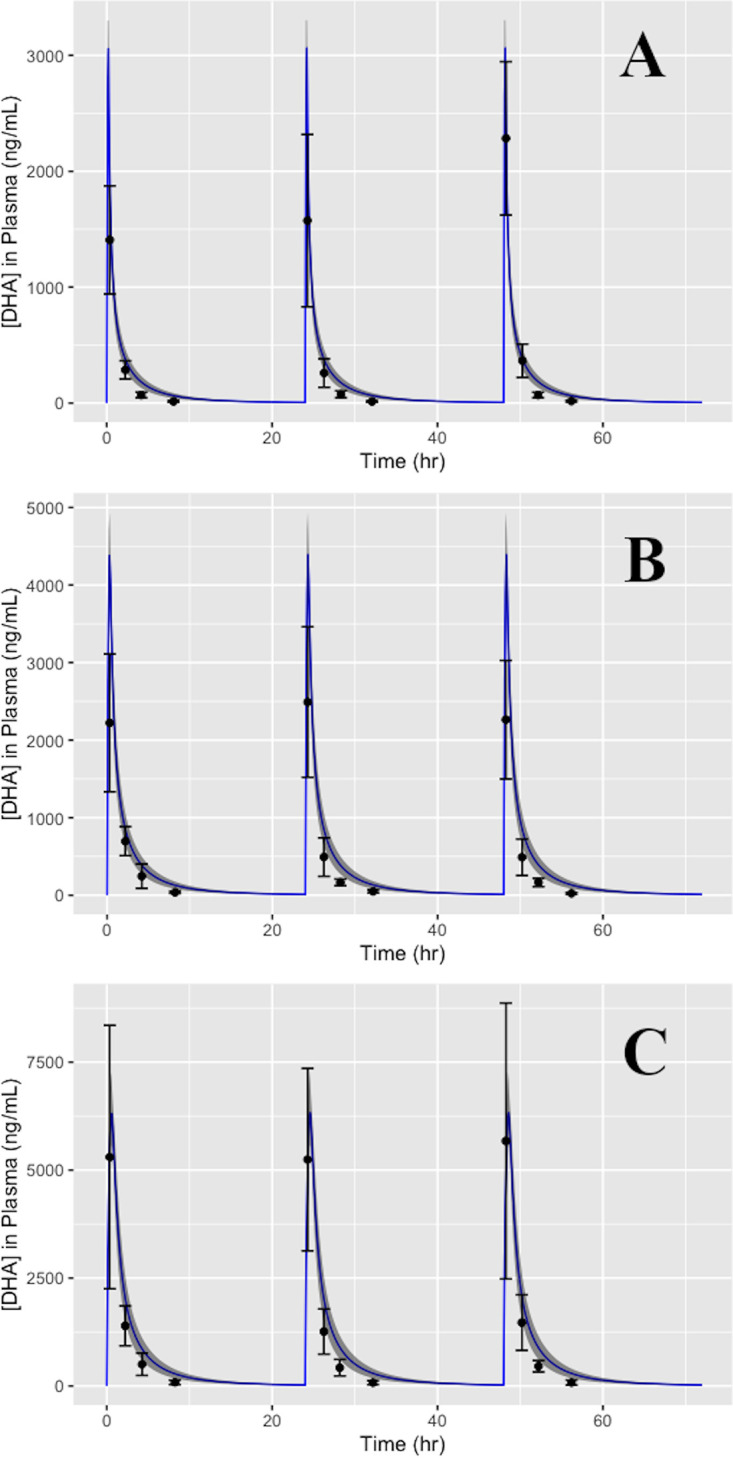
Simulations of the plasma pharmacokinetics of DHA in humans following a repeated dosing schedule of i.v. AS at 2 mg/kg (A), 4 mg/kg (B), and 8 mg/kg (C) once every 24 h for the span of 72 h. Model predictions are coplotted with data pulled from the literature (12) for the purposes of model validation. Error bars were calculated from digitized points extracted from the sourced dataset.
As a final model characterization, PK parameters were calculated from a single simulation of the H-PBPK model utilizing the mean values for all estimated parameters calculated from their corresponding posterior distributions. PK parameters selected for model comparison were Cmax, half-life (t1/2), AUC, and mean residence time (MRT), as these measures were reported in the literature (9) and deemed important for consideration. This comparison can be seen in Table 2.
TABLE 2.
Computed pharmacokinetic parameters of AS and DHA for model comparisona
| Source | Cmax (ng/ml) | t1/2 (h) | AUCinf (ng·h/ml) | MRT (h) |
|---|---|---|---|---|
| Reference 9 | ||||
| Plasma AS | 28,558 ± 28,531 | 0.17 ± 0.08 | 1,879 ± 1,190 | 0.07 ± 0.02 |
| Plasma DHA | 2,932 ± 850 | 1.30 ± 0.34 | 3,543 ± 989 | 1.61 ± 0.44 |
| H-PBPK model | ||||
| Plasma AS | 22,474 | 0.76 | 1,894.28 | 0.11 |
| Plasma DHA | 3,114 | 2.86 | 4,087.19 | 1.85 |
Pharmacokinetic parameters were derived from a single simulation of H-PBPK, computed from an intravenous dose of AS at 2.4 mg/kg. Data pulled for comparison (9) represent the mean PK parameters resulting from i.v. AS at 2.4 mg/kg administered to patients with uncomplicated P. falciparum malaria.
DISCUSSION
Methodology.
The PBPK models detailed herein utilized a system of physiological and biochemical descriptions, along with species mass balance equations, to make tissue-specific pharmacokinetic predictions for AS and its active metabolite, DHA, in relevant organs/tissues of both rats and humans. Data uncertainties and interstudy variability were incorporated into the results by estimating unknown parameter values within a hierarchical Bayesian framework. Simulations of both models were conducted using the posterior distributions resulting from model calibration and distributions of the mean value of other relevant parameters in order to quantify their effect on pharmacokinetic predictions.
Testing and verification. (i) PBPK model for rats.
Model predictions were generally in reasonable to very good agreement with the validation data. As shown in Fig. 3 and 4, most of the data from multiple PK studies fell within the 95% prediction intervals produced by the model for blood, plasma, and tissue concentrations of both AS and DHA. Interestingly, the total radioactivity measures for blood and plasma species concentrations (10, 11, 13) indicated the presence of multiple concentration peaks, suggesting that these features are likely due, at least in part, to enterohepatic recirculation (EHR) of conjugated metabolites. This is consistent with findings from previous work on the metabolites of AS and DHA (10, 18). Though the model does include this biological mechanism, with the parameters estimated, the model does not recapitulate these PK features.
(ii) PBPK model for humans.
In the process of H-PBPK model assessment, predictions were compared to single- and repeated-dose data. Figures 5 and 6 show that data from studies with various dosing regimens fell within the 95% prediction intervals produced by the H-PBPK model, demonstrating the model’s capacity to reasonably predict the plasma concentration-time profile of both AS and DHA. Likewise, as indicated in Table 2, the model-predicted PK parameters were found to fall within a single standard deviation of literature data, with the exception of t1/2 and MRT. Discrepancies between model predictions and PK experimental data could be attributed to simplified model assumptions on the metabolism of AS and DHA and/or the use of parameters involved in AS metabolism taken from studies of other artemisinin derivatives (19, 20). Deficiencies in agreement between model predictions of t1/2 and MRT may also result from assumptions made about drug conjugation for both active compounds in the extrahepatic tissues listed previously (21, 22). Consideration of such processes would likely lead to an underprediction of t1/2 and an overprediction of MRT. Regarding convergence of the H-PBPK estimated parameters to a stationary distribution, the high R values pertaining to the PSRF of the posterior distributions of specific model parameters, namely, Km3A4AS, Km3A5AS, Cm1, and Cm3 seem to indicate nonconvergence. These results demonstrate a need for further refinement of the parameterization of the H-PBPK model, as described in Results.
Features and advantages of the present model.
Unlike other PK models for AS and DHA (7–13), the present model provides information about tissue-specific drug concentrations and clearance characteristics. Predictions of drug levels close to the site of action are expected to aid investigators interested in both enhancing drug efficacy (15, 23, 24) and limiting the potential toxicity of artemisinin derivatives (6). Although information about the dose response of artemisinins with respect to toxicity has not been established, it has been suggested that the risk lies in long-term availability rather than short-term peak concentrations (6). The current model addresses this concern by providing robust pharmacokinetic predictions for various key organs/tissues in the human body. Moreover, as with PBPK models in general, the present approach can facilitate a systematic examination of the anticipated pharmacokinetic effect of changes to dosing regimens and routes of administration. Finally, through the use of Bayesian inference, model parameters were estimated as distributions, allowing quantitation of the effects of data and model uncertainty and intrasubject variability. With the listed advantages, the present model has the potential to aid in human dose optimization and help determine the extent to which pharmacokinetic endpoints depend on alterations to, and variability in, anatomical, physiological, and biochemical characteristics.
Limitations of the present model.
There are several limitations and deficiencies associated with the PBPK model described in this paper: (i) the present model does not recapitulate the presence of multiple concentration peaks that have been observed in experiments (10, 11, 13), though data uncertainty is relatively large in the data sets used; (ii) the model is not currently applicable to the analysis of drug combination therapies, which are are common; (iii) in the context of personalized medicine, as with almost all current PBPK models, the pharmacokinetic predictions contain too much uncertainty; and (iv) assumptions made about the metabolism of each active compound were based on in vitro data (19, 20, 21, 22), which may not be reflective of in vivo metabolic characteristics.
Future directions.
Using the present model as a foundation, future work will be focused on adding additional antimalaria agents (e.g., chloroquine, amodiaquine, and mefloquine) to simulate combination therapies and quantify pharmacokinetic drug-drug interactions. Other enhancements will include integration of pharmacodynamic descriptions that encompass the growth and drug-induced killing kinetics of the malaria parasite, as well as descriptions of AS-induced toxicity in the relevant organs. Some of this work is already under way.
MATERIALS AND METHODS
Approach.
To achieve the study aims, two generic whole-body PBPK models were developed, parameterized, and validated: (i) a rat-specific PBPK model (R-PBPK) and (ii) a human-specific PBPK model (H-PBPK). Both models shared the same compartmental structure and governing equations, with the only difference being values of parameters related to the anatomy, physiology, and metabolism of drugs by each biological species. The models were parameterized within a Bayesian framework for both species by utilizing sets of training data mined from the literature. Models were validated using separate data sets. Here, the term “validation” refers to confirmation of the plausibility of the proposed model in representing the underlying real system, as described by Tomlin and Axelrod (25). In this paper, the terms “validation” and “verification” are used interchangeably to describe the process of determining if the model, as constructed accurately, represents the underlying real system being modeled by comparing the simulation output with experimental data from the real system that were not used in the parameterization process.
Training and validation data.
A summary of the data used in this study is shown in Table 3. In more specific terms, pharmacokinetic data for calibration of the R-PBPK model were obtained from various papers (10, 11) that provided (i) drug concentrations in tissues relevant to the efficacy or toxicity of the drug in the human body and (ii) information on the fraction of drug bound to plasma proteins for both AS and DHA. These data were compiled to generate a training set for parameterization of the rat model. For training of the human model, a thorough literature search was conducted to identify studies (7, 26) that provided plasma drug concentrations of AS or DHA, with emphasis placed on studies that utilized an i.v. route of administration. These data constituted the training set for the calibration of the human model. For model validation, additional data were utilized (8, 9, 12, 13) with the same selection criteria as above and set aside for testing and verification of model predictions.
TABLE 3.
Data used for training (calibration) and validation of both models
| Data available for model comparison (ng/ml)a | Dose type | Training set | Validation set | Reference |
|---|---|---|---|---|
| R-PBPK | ||||
| Blood [TR], plasma [TR] | i.v. AS | ✓ | 11 | |
| Blood [TR], plasma [TR], plasma [AS], plasma [DHA], brain [TR], heart [TR], kidney [TR], liver [TR] | i.v. AS | ✓ | 10 | |
| Plasma [AS], plasma [DHA] | i.v. AS | ✓ | 8 | |
| Blood [TR], plasma [TR], brain [TR], heart [TR], kidney [TR], liver [TR] | i.v. DHA | ✓ | 13 | |
| H-PBPK | ||||
| Plasma [DHA] | i.v. AS | ✓ | 26 | |
| Plasma [AS], plasma [DHA] | i.v. AS | ✓ | 7 | |
| plasma [DHA] | i.v. AS | ✓ | 12 | |
| plasma [AS], plasma [DHA] | i.v. AS | ✓ | 9 | |
Experimental data collected by the corresponding study.
PBPK model.
As shown in Fig. 1, the structural model comprised compartments for arterial and venous blood, lung, heart, brain, muscle, fat, bone, spleen, and pancreas (single compartment), liver, kidney, and the gut, as well as a compartment for the rest of the body containing tissues not accounted for in other compartments. All compartments were assumed to be perfusion limited, and as noted above, this structure was identical for both the rat and human models. Components related to the metabolism of AS are described below. Enterohepatic recirculation (EHR) of drugs was modeled by biliary excretion of conjugated metabolites (18) to a subcompartment of the gut, representing the lumen of the small intestine. The governing equations embodying these biological features form a system of mass-balanced ordinary differential equations (ODEs), dependent on model parameters and time. These equations dictate the rate of change in the amount of drug in each compartment. See the appendix for a description of the model equations.
Drug metabolism.
The drug AS is subjected to both phase 1 and phase 2 reactions, where the phase 1 reactions yield DHA and the phase 2 reactions yield a conjugated product of AS or DHA (10). In this work, we refer to the conjugated product of AS as AS-C and the conjugated product of DHA as DHA-C.
The metabolism of AS and DHA was assumed to occur in the liver and a variety of extrahepatic tissues, namely, blood, muscle, gut, and kidneys. Specifically, it was assumed that AS was metabolized immediately upon entering the blood, being hydrolyzed to DHA in the venous compartment, as well as being metabolized in the liver compartment, as was observed in the literature (21, 27–30). Drug conjugation of both active chemical species (AS and DHA) was assumed to occur in muscle, gut, kidney, and liver tissues. This assumption was supported by findings from a study by Ilett et al. (21), which demonstrated that conjugation of DHA occurs via specific isoforms of UDP glucuronosyltransferases (UGTs), namely, UGT1A9 and UGT2B7, to form DHA-glucuronide (21), along with data supporting the assumptions that these specific UGT isoforms are present in muscle, gut, kidney, and liver tissue (22). We further assumed that AS was conjugated in the same tissues as DHA and that the conjugated products of both species (AS-C and DHA-C) represent a nonspecific, lumped term accounting for all drug conjugates of that particular chemical compound. An overall schematic of the assumed metabolic scheme is shown in Fig. 2.
Based on results from the literature (19–21), all equations pertaining to the metabolism of AS and DHA were assumed to follow Michaelis-Menten (M-M) reaction kinetics, modeled as
where the rate of product formation () relies upon the maximum velocity of the reaction rate (Vmax), the Michaelis constant (Km), and drug concentration at the tissue site of metabolism (Ctissue).
Specification of parameter values.
Anatomical and physiological parameters were obtained from Brown et al. (31) and Delp et al. (32). Organ/tissue volumes were scaled linearly with body weight, while blood flow rates were allometrically scaled with body weight to the 0.75 power (31–33). Tissue density was assumed to be equal to that of water (∼1 g/ml). Fraction-bound parameters and clearance parameters were taken from the literature, where clearance via renal and biliary excretion was scaled by apportioning a fraction of total blood clearance to the kidneys, with the remaining fraction being that for the liver (10). M-M parameters for the metabolism of AS and DHA in the liver compartment were taken from in vitro experimental results (19–21) derived using human liver microsomes and recombinant UGTs. These values were then scaled to in vivo conditions for model simulation using information from other studies (34, 35). Metabolic rates for blood, muscle, gut, and kidney compartments were determined from a nonlinear least-square fit of model-simulated data following M-M reaction kinetics in each extrahepatic tissue. Moreover, metabolism in these tissues was assumed to be proportional to the known metabolic rates of each compound in the liver. This assumption was incorporated by estimating coefficients assigned to the metabolic equations in each of the extrahepatic tissues (Table 4). First-order rate constants for absorption and excretion of drugs from the gut lumen were calculated from information found in the literature (27, 34). Values for the tissue/plasma partition coefficients of AS and DHA were computed using the httk (v2.0.1) package for the statistical software R (v3.6.1) (36), while partition coefficients for the lumped, conjugated terms (AS-C and DHA-C) were estimated from tissue concentration-time data (10). Specifically, the conjugated partition coefficients (P) were computed as Ctissue/Cplasma, where Ctissue is drug concentration (TR) in tissue and Cplasma is drug concentration (TR) in plasma. The mean values were computed using time points during the elimination phase at which equilibrium in drug concentration was assumed between the tissues and venous blood. For the conjugated terms, partition coefficients of the “REST” compartment (rest of the body) were set equal to the weighted mean of all other partition coefficients. All model parameters are listed with their values and corresponding sources in Table 4.
TABLE 4.
All model parameters listed with their corresponding values pulled from the literaturea
| Parameter description (units) | Parameter symbol | AS value | DHA value | Referenceb |
|---|---|---|---|---|
| Mol wt (mg/mmol) | MW | 384.4 | 284.9 | 8 |
| Logarithm of octonol:water partitioning | logP | 2.05 | 2.19 | 36, 50 |
| Dissociation constant (acid, base) | pKa | 3.77, −4.2 | 12.11, −4.1 | 36, 51 |
| Plasma binding components | AAG | α1-Acid-glycoprotein | α1-Acid-glycoprotein | 2 |
| Anatomical and physiological parameters | R-PBPK value | H-PBPK value | ||
| Body wt (kg) | BW | 0.25 | 70 | 31 |
| Coefficient for calculation of cardiac output | QCC | 0.235 | 0.215 | 32 |
| Fractional volumes (fraction of BW) | ||||
| Lung | FVLU | 0.005 | 0.008 | 31 |
| Brain | FVBR | 0.006 | 0.02 | 31 |
| Heart | FVH | 0.003 | 0.005 | 31 |
| Muscle | FVMU | 0.404 | 0.4 | 31 |
| Fat | FVF | 0.07 | 0.214 | 31 |
| Bone | FVB | 0.073 | 0.143 | 31 |
| Pancreas and spleen | FVPS | 0.0052 | 0.004 | 31 |
| Liver | FVL | 0.034 | 0.026 | 31 |
| Gut | FVG | 0.077 | 0.031 | 31 |
| Kidney | FVK | 0.007 | 0.004 | 31 |
| Total Blood | FVBL | 0.074 | 0.079 | 31 |
| Venous blood | FVVB | 0.65 × FV_BL | 0.65 × FV_BL | 33 |
| Arterial blood | FVAB | 0.35 × FV_BL | 0.35 × FV_BL | 33 |
| Rest of the body | FVREST | 1 − (all other tissues) | 1 − (all other tissues) | * |
| Fractional flow rates (fraction of QCC) | ||||
| Brain | FQBR | 0.02 | 0.114 | 31 |
| Heart | FQH | 0.049 | 0.04 | 31 |
| Muscle | FQMU | 0.278 | 0.191 | 31 |
| Fat | FQF | 0.07 | 0.052 | 31 |
| Bone | FQB | 0.122 | 0.042 | 31 |
| Hepatic artery | FQHA | 0.024 | 0.046 | 31 |
| Portal vein | FQPV | 0.151 | 0.181 | 31 |
| Gut | FQG | 0.14 | 0.14 | 32 |
| Kidney | FQK | 0.141 | 0.175 | 31 |
| Rest of the body | FQREST | 1 − (all other tissues) | 1 − (all other tissues) | * |
| Fraction bound in plasma (dimensionless) | ||||
| AS | fbAS | 0.82 | 0.75 | 10 |
| DHA | fbDHA | 0.82 | 0.75 | 10 |
| Fraction unbound in plasma (dimensionless) | ||||
| AS | fubAS | 1 − fbAS | 1 − fbAS | 10 |
| DHA | fubDHA | 1 − fbDHA | 1 − fbDHA | 10 |
| Total blood clearance (ml/h/kg) | CLCTB | 0.0815 | 0.0815 | 10 |
| Fractional renal clearance (dimensionless) | fr | 0.6 | 0.6 | 10 |
| Renal clearance (ml/h/kg) | CLCrenal | fr × CLC_TB | fr × CLC_TB | 10 |
| Biliary clearance (ml/h/kg) | CLCbile | (1 − fr) × CLC_TB | (1 − fr) × CLC_TB | 10 |
| Michaelis-Menten metabolic parameters | ||||
| AS | ||||
| (mg/h/g of liver) | Vmax2B6AS | 0.1782 | 0.1148 | 20 |
| (mg/liter) | Km2b6AS | 0.75 | 0.75 | 20 |
| (mg/liter) | Vmax3A4AS | 0.072 | 0.0464 | 19 |
| (mg/liter) | Km3A4AS | 42.7 | 42.7 | 19 |
| (mg/liter) | Vmax3A5AS | 0.133 | 0.0857 | 19 |
| (mg/liter) | Km3A5AS | 79.1 | 79.1 | 19 |
| DHA | ||||
| (mg/h/g of liver) | Vmax1A9DHA | 0.0068 | 0.0044 | 21 |
| (mg/liter) | Km1A9DHA | 9.1 | 9.1 | 21 |
| (mg/liter) | Vmax2B7DHA | 0.0084 | 0.0054 | 21 |
| (mg/liter) | Km2B7DHA | 125 | 125 | 21 |
| (mg/liter) | VmaxDHA | 0.1359 | 0.08758 | 21 |
| (mg/liter) | KmDHA | 25.59 | 25.59 | 21 |
| Estimated metabolic rates in extrahepatic tissues | ||||
| (mg/h) | VmaxeffAS | 1.6 | 1.6 | * |
| (mg/liter) | KmeffAS | 0.78 | 0.78 | * |
| (mg/liter) | VmaxeffDHA | 1.2 | 1.2 | * |
| (mg/liter) | KmeffDHA | 26 | 26 | * |
| Coefficients of unknown metabolic rates | ||||
| AS metabolism (venous blood) | Cm1 | 2 | 150 | * |
| AS conjugation (muscle, liver, kidney, gut) | Cm2 | 30 | 10 | * |
| DHA conjugation (muscle, liver, kidney, gut) | Cm3 | 1 | 200 | * |
| Apparent permeability coefficient (cm/s) | Papp | 4.00E−06 | 4.00E−06 | 27 |
| Radius of small intestine (cm) | Radius | 0.18 | 1.0 | 34 |
| Gut lumen to gut absorption rate (1/h) | KGLG | (Papp/radius) × 602 | (Papp/radius) × 602 | 27, 34 |
| Gut excretion rate (1/h) | KGut | 2.1 | 2.1 | 34 |
| Partition coefficients: (dimensionless) | ||||
| AS | PLUAS | 2.5 | 2.5 | 36 |
| PBRAS | 1.5 | 1.5 | 36 | |
| PFAS | 0.65 | 0.65 | 36 | |
| PMUAS | 1.9 | 1.9 | 36 | |
| PBAS | 1.3 | 1.3 | 36 | |
| PHAS | 3.2 | 3.2 | 36 | |
| PPSAS | 2.7 | 2.7 | 36 | |
| PKAS | 9.7 | 9.7 | 36 | |
| PLAS | 11 | 11 | 36 | |
| PGAS | 3.3 | 3.3 | 36 | |
| PRESTAS | 3.6 | 3.6 | 36 | |
| Represents blood-to-plasma ratio | PRBCAS | 1.4 | 1.4 | 36 |
| DHA | PLUDHA | 9.7 | 9.7 | 36 |
| PBRDHA | 6.1 | 6.1 | 36 | |
| PFDHA | 14 | 14 | 36 | |
| PMUDHA | 3.9 | 3.9 | 36 | |
| PBDHA | 4 | 4 | 36 | |
| PHDHA | 6.2 | 6.2 | 36 | |
| PPSDHA | 5.2 | 5.2 | 36 | |
| PKDHA | 16 | 16 | 36 | |
| PLDHA | 18 | 18 | 36 | |
| PGDHA | 11 | 11 | 36 | |
| PRESTDHA | 9.1 | 9.1 | 36 | |
| Represents blood-to-plasma ratio | PRBCDHA | 1.9 | 1.9 | 36 |
| AS-C and DHA-C | PLUAS-C, DHA-C | 4 | 4 | 10 |
| PBRAS-C, DHA-C | 1.6 | 1.6 | 10 | |
| PFAS-C, DHA-C | 0.7 | 0.7 | 10 | |
| PMUAS-C, DHA-C | 1.5 | 1.5 | 10 | |
| PBAS-C, DHA-C | 2.1 | 2.1 | 10 | |
| PHDAS-C, DHA-C | 6.1 | 6.1 | 10 | |
| PPSAS-C, DHA-C | 24.5 | 24.5 | 10 | |
| PKAS-C, DHA-C | 18.6 | 18.6 | 10 | |
| PLAS-C, DHA-C | 9.3 | 9.3 | 10 | |
| PGAS-C, DHA-C | 84.5 | 84.5 | 10 | |
| PRESTAS-C, DHA-C | 8.2 | 8.2 | 10 | |
| Represents blood-to-plasma ratio | PRBCAS-C, DHA-C | 1.9 | 1.9 | 36 |
Values displayed here represent the values of each parameter before scaling to in vivo conditions for simulation.
*, estimated from the present study.
Sensitivity analysis.
A local sensitivity analysis was performed utilizing a method reported in previous PBPK research (37). This task was accomplished by using a Monte Carlo (MC) approach, wherein each model parameter was uniformly distributed between a lower bound (half the mean parameter value) and an upper bound (double the mean parameter value) for 15,000 MC draws. All model parameters were sampled simultaneously to produce a distribution of model outputs. Mean PK parameters, namely, maximum concentration (Cmax), time to maximum concentration (Tmax), and area under the concentration-time curve (AUC), were then calculated from the distributed time course concentration data in the MC output. Pearson correlation coefficients were calculated between model parameters and mean PK parameters, and those returning an absolute value of ≥0.2 were considered influential.
Simulation method and computing platform.
Parameter estimation was carried out in a Bayesian hierarchical context using Markov chain Monte Carlo (MCMC) simulations applying the Metropolis-within-Gibbs algorithm. Calibration of the R-PBPK model was conducted first from prior distributions of the influential parameters constructed around their respective source values over the course of 200,000 iterations. Convergence was assessed by the potential scale reduction factor (38) by producing three separate chains from a two-level, hierarchical MCMC simulation. The model equations were then computed by sampling the influential parameters from their corresponding posterior distributions at the last 10,000 iterations, along with the distribution of other relevant partition coefficients for comparison to the validation data pulled from the literature. For calibration of the H-PBPK model, all parameters associated with the metabolism or excretion of drugs were estimated in the same Bayesian context over the same number of iterations. Influential parameters were held at constant values set equal to the mean of the posterior resulting from the calibration step of the R-PBPK model. The estimated human parameters were then sampled from their corresponding posterior distributions at the last 10,000 iterations, resulting from the calibration step of the H-PBPK model, for comparison to the validation data set extracted from the literature (Table 1).
Data from the literature were digitized using Engauge Digitizer (v12.1) (39). Simulations of the PBPK governing equations, including MC and MCMC simulations, were conducted in MCSim (v6.1.0) (40). Data processing, analysis, and visualization of data were carried out in Python (v3.6.8) (41) utilizing the pandas (42), numpy (43), scipy (44), and matplotlib (45) packages, the statistical software R (v3.6.1) (46) utilizing the httk (36), coda (47), and ggplot2 (48) packages, and finally Microsoft Excel (v16.34) (49). All computations were performed on general compute nodes running the Red Hat Enterprise Linux 7 operating system, each containing Intel Xeon E5-2680 v3 processors at 2.5 GHz with 4.84 GB of RAM per core, with a total of 24 cores per node.
APPENDIX
The equations listed below serve as the governing relationships for the PBPK model, which mathematically specify mass balance for each chemical species for each compartment, along with relevant biological phenomena involved in the disposition of AS and DHA. Rates of blood flow to each tissue (QT) were computed as FQT × QC/QTC, where QC symbolizes cardiac output, scaled by QCC × BW0.75 (where QCC represents the coefficient for calculating cardiac output and BW0.75 is the body weight raised to the 0.75 power), FQT represents the fractional flow rate (fraction of cardiac output), and QTC represents the sum of all fractional flow rates. Organ/tissue volumes (VT) were scaled in a similar manner, as FVT × BW/VTC, where FVT symbolizes the fractional volume of the given tissue and VTC represents the sum of all fractional tissue volumes. Furthermore, arterial blood concentrations entering each compartment, indicated as CABu, represent the fraction of drug unbound to plasma proteins, while concentrations leaving each compartment in venous blood (CTVB) are calculated from tissue concentrations and tissue/plasma partition coefficients as follows:
| (A1) |
Here, i symbolizes any of the four the chemical species tracked by the model. and represent drug concentration and drug amount, respectively. PRBCi is the blood/plasma partition coefficient, and represents the partition coefficient of the given tissue. The differential equations for all noneliminating organs, such as brain and heart, took the following form:
| (A2) |
where the derivative represents changes in the amount of drug with respect to time.
All other compartments involved in the metabolism or excretion of drugs are described by the equations listed below. For reference, j represents the various coefficients of metabolism, with Cm1 pertaining to AS metabolism in venous blood, Cm2 corresponding to AS conjugation in the liver and extrahepatic tissues, and Cm3 being used to scale DHA conjugation in extrahepatic tissues.
Muscle compartment.
Equations for both active compounds (AS and DHA) in the muscle compartment took the following form:
| (A3) |
| (A4) |
where the derivative represents the amount of drug conjugated with respect to time, while the equations for both inactive compounds (AS-C and DHA-C) were computed with equation
| (A5) |
Gut compartment.
Equations for AS and DHA took the following form in the gut compartment:
| (A6) |
| (A7) |
where was used to compute the amount of drug conjugated with respect to time.
The equations for AS-C and DHA-C were computed as follows:
| (A8) |
| (A9) |
| (A10) |
where symbolizes the amount of metabolite entering the intestinal lumen via biliary excretion, is the amount of drug being excreted from the gut lumen, represents the rate of change in drug amount in the gut lumen, and dictates the rate of change in drug amounts in the whole gut with respect to time.
Kidney compartment.
Equations for AS and DHA took the following form in the kidney compartment:
| (A11) |
| (A12) |
where represents the amount of drug metabolized with respect to time.
Equations for AS-C and DHA-C were as follows:
| (A13) |
| (A14) |
where represents the amount excreted from the kidneys and represents changes in the amount of drug with respect to time.
Liver compartment.
The equation for the conversion of AS to DHA in the liver was computed as the summation of all metabolic rates owing to the enzymes responsible for the metabolism of other artemisinin derivatives as follows:
| (A15) |
while conjugation of AS in the liver was computed with
| (A16) |
and changes in the amount of AS with respect to time were computed as
| (A17) |
where is equivalent to the flow of blood from the portal vein.
The conjugation of DHA in the liver compartment was represented by
| (A18) |
while changes in the amount of DHA with respect to time were computed as
| (A19) |
Biliary excretion of the conjugated metabolites was modeled by
| (A20) |
with changes in AS-C amounts computed as
| (A21) |
and changes in DHA-C amounts as
| (A22) |
Venous blood compartment.
Changes in the amount of drug in the venous compartment were accounted for in the following equations:
| (A23) |
| (A24) |
| (A25) |
where represents the i.v. dose calculation, symbolizes the i.v. dose (mg/kg), and symbolizes the duration of i.v. infusion. represents the metabolism of AS in venous blood, and it was applied only to the appropriate equations.
Calculation of total radioactivity (TR) concentrations in the various tissues was accomplished by summing the concentrations of every chemical compound in the given tissue. This computation was carried out for the span of each model simulation as
| (A26) |
All drug amounts were computed in milligrams, while drug concentrations were computed in milligrams per liter. Model outputs used for comparison to the validation data set were converted to the necessary units before being coplotted with the data.
REFERENCES
- 1.World Health Organization. 2015. Guidelines for the treatment of malaria. World Health Organization, Geneva, Switzerland. [Google Scholar]
- 2.Aweeka FT, German PI. 2008. Clinical pharmacology of artemisinin-based combination therapies. Clin Pharmacokinet 47:91–102. doi: 10.2165/00003088-200847020-00002. [DOI] [PubMed] [Google Scholar]
- 3.Gopalakrishnan AM, Kumar N. 2015. Antimalarial action of artesunate involves DNA damage mediated by reactive oxygen species. Antimicrob Agents Chemother 59:317–325. doi: 10.1128/AAC.03663-14. [DOI] [PMC free article] [PubMed] [Google Scholar]
- 4.Navaratnam V, Mansor SM, Sit N, Grace J, Li Q, Olliaro P. 2000. Pharmacokinetics of artemisinin-type compounds. Clin Pharmacokinet 39:255–270. doi: 10.2165/00003088-200039040-00002. [DOI] [PubMed] [Google Scholar]
- 5.Morris CA, Duparc S, Borghini-Fuhrer I, Jung D, Shin CS, Fleckenstein L. 2011. Review of the clinical pharmacokinetics of artesunate and its active metabolite dihydroartemisinin following intravenous, intramuscular, oral or rectal administration. Malar J 10:263. doi: 10.1186/1475-2875-10-263. [DOI] [PMC free article] [PubMed] [Google Scholar]
- 6.Efferth T, Kaina B. 2010. Toxicity of the antimalarial artemisinin and its dervatives. Crit Rev Toxicol 40:405–421. doi: 10.3109/10408441003610571. [DOI] [PubMed] [Google Scholar]
- 7.Li Q, Cantilena LR, Leary KJ, Saviolakis GA, Miller RS, Melendez V, Weina PJ. 2009. Pharmacokinetic profiles of artesunate after single intravenous doses at 0.5,1,2,4, and 8 mg/kg in healthy volunteers: a phase I study. Am J Trop Med Hyg 81:615–621. doi: 10.4269/ajtmh.2009.09-0150. [DOI] [PubMed] [Google Scholar]
- 8.Li QG, Peggins JO, Fleckenstein LL, Masonic K, Heiffer MH, Brewer TG. 1998. The pharmacokinetics and bioavailability of dihydroartemisinin, arteether, artemether, artesunic acid and artelinic acid in rats. J Pharm Pharmacol 50:173–182. doi: 10.1111/j.2042-7158.1998.tb06173.x. [DOI] [PubMed] [Google Scholar]
- 9.Li Q, Remich S, Miller SR, Ogutu B, Otieno W, Melendez V, Teja-Isavadharm P, Weina PJ, Hickman MR, Smith B, Polhemus M. 2014. Pharmacokinetic evaluation of intravenous artesunate in adults with uncomplicated falciparum malaria in Kenya: a phase II study. Malar J 13:281. doi: 10.1186/1475-2875-13-281. [DOI] [PMC free article] [PubMed] [Google Scholar]
- 10.Li Q, Xie LH, Haeberle A, Zhang J, Weina P. 2006. The evaluation of radiolabeled artesunate on tissue distribution in rats and protein binding in humans. Am J Trop Med Hyg 75:817–826. doi: 10.4269/ajtmh.2006.75.817. [DOI] [PubMed] [Google Scholar]
- 11.Li Q, Xie L, Zhang J, Weina PJ. 2008. The distribution pattern of intravenous [14C] artesunate in rat tissues by quantitative whole-body autoradiography and tissue dissection techniques. J Pharm Biomed Anal 48:876–884. doi: 10.1016/j.jpba.2008.07.015. [DOI] [PubMed] [Google Scholar]
- 12.Miller RS, Li Q, Cantilena LR, Leary KJ, Saviolakis GA, Melendez V, Smith B, Weina PJ. 2012. Pharmacokinetic profiles of artesunate following multiple intravenous doses of 2, 4, and 8mg/kg in healthy volunteers: phase 1b study. Malar J 11:255. doi: 10.1186/1475-2875-11-255. [DOI] [PMC free article] [PubMed] [Google Scholar]
- 13.Xie LH, Li Q, Zhang J, Weina PJ. 2009. Pharmacokinetics, tissue distribution and mass balance of radiolabeled dihydroartemisinin in male rats. Malar J 8:112–114. doi: 10.1186/1475-2875-8-112. [DOI] [PMC free article] [PubMed] [Google Scholar]
- 14.Gordi T, Xie R, Huong NV, Huong DX, Karlsson MO, Ashton M. 2005. A semiphysiological pharmacokinetic model for artemisinin in healthy subjects incorporating autoinduction of metabolism and saturable first-pass hepatic extraction. Br J Clin Pharmacol 59:189–198. doi: 10.1111/j.1365-2125.2004.02321.x. [DOI] [PMC free article] [PubMed] [Google Scholar]
- 15.Olafuyi O, Coleman M, Badhan RKS. 2017. Development of a paediatric physiologically based pharmacokinetic model to assess the impact of drug-drug interactions in tuberculosis co-infected malaria subjects: a case study with artemether-lumefantrine and the CYP3A4-inducer rifampicin. Eur J Pharm Sci 106:20–33. doi: 10.1016/j.ejps.2017.05.043. [DOI] [PubMed] [Google Scholar]
- 16.Jamei M, Yang J, Turner D, Yeo KR, Tucker GT, Rostami-Hodjegan A. 2007. A novel physiologically-based mechanistic model for predicting oral drug absorption: the advanced dissolution, absorption, and metabolism (ADAM) model. The 4th World Conference on Drug Absorption, Transport and Delivery. [Google Scholar]
- 17.Sohlenius-Sternbeck AK. 2006. Determination of the hepatocellularity number for human, dog, rabbit, rat and mouse livers from protein concentration measurements. Toxicol In Vitro 20:1582–1586. doi: 10.1016/j.tiv.2006.06.003. [DOI] [PubMed] [Google Scholar]
- 18.Maggs JL, Madden S, Bishop LP, O'Neill PM, Park BK. 1997. The rat biliary metabolites of dihydroartemisinin, an antimalarial endoperoxide. Drug Metab Dispos 25:1200–1204. [PubMed] [Google Scholar]
- 19.Grace JM, Skanchy DJ, Aguilar AJ. 1999. Metabolism of artelinic acid to dihydroqinghaosu by human liver cytochrome P4503A. Xenobiotica 29:703–717. doi: 10.1080/004982599238335. [DOI] [PubMed] [Google Scholar]
- 20.Honda M, Muroi Y, Tamaki Y, Saigusa D, Suzuki N, Tomioka Y, Matsubara Y, Oda A, Hirasawa N, Hiratsuka M. 2011. Functional characterization of CYP2B6 allelic variants in demethylation of antimalarial artemether. Drug Metab Dispos 39:1860–1865. doi: 10.1124/dmd.111.040352. [DOI] [PubMed] [Google Scholar]
- 21.Ilett KF, Ethell BT, Maggs JL, Davis TME, Batty KT, Burchell B, Binh TQ, Thu LTA, Hung NC, Pirmohamed M, Kevin Park B, Edwards G. 2002. Glucuronidation of dihydroartemisinin in vivo and by human liver microsomes and expressed UDP-glucuronosyltransferases. Drug Metab Dispos 30:1005–1012. doi: 10.1124/dmd.30.9.1005. [DOI] [PubMed] [Google Scholar]
- 22.Albert C, Vallée M, Beaudry G, Bélanger A, Hum DW. 1999. The monkey and human uridine diphosphate-glucuronosyltransferase UGT1A9, expressed in steroid target tissues, are estrogen-conjugating enzymes. Endocrinology 140:3292–3302. doi: 10.1210/endo.140.7.6853. [DOI] [PubMed] [Google Scholar]
- 23.Phyo AP, Ashley EA, Anderson TJC, Bozdech Z, Carrara VI, Sriprawat K, Nair S, White MMD, Dziekan J, Ling C, Proux S, Konghahong K, Jeeyapant A, Woodrow CJ, Imwong M, McGready R, Lwin KM, Day NPJ, White NJ, Nosten F. 2016. Declining efficacy of artemisinin combination therapy against P. falciparum malaria on the Thai-Myanmar border (2003–2013): the role of parasite genetic factors. Clin Infect Dis 63:784–791. doi: 10.1093/cid/ciw388. [DOI] [PMC free article] [PubMed] [Google Scholar]
- 24.Amaratunga C, Witkowski B, Khim N, Menard D, Fairhurst RM. 2014. Artemisinin resistance in Plasmodium falciparum. Lancet Infect Dis 14:449–450. doi: 10.1016/S1473-3099(14)70777-7. [DOI] [PMC free article] [PubMed] [Google Scholar]
- 25.Tomlin CJ, Axelrod JD. 2007. Biology by numbers: mathematical modelling in developmental biology. Nat Rev Genet 8:331–340. doi: 10.1038/nrg2098. [DOI] [PubMed] [Google Scholar]
- 26.Binh TQ, Ilett KF, Batty KT, Davis TM, Hung NC, Powell SM, Thu LT, Thien HV, Phuöng HL, Phuong VD. 2001. Oral bioavailability of dihydroartemisinin in vietnamese volunteers and in patients with falciparum malaria. Br J Clin Pharmacol 51:541–546. doi: 10.1046/j.1365-2125.2001.01395.x. [DOI] [PMC free article] [PubMed] [Google Scholar]
- 27.Augustijns P, D'Hulst A, Van Daele J, Kinget R. 1996. Transport of artemisinin and sodium artesunate in Caco-2 intestinal epithelial cells. J Pharm Sci 85:577–579. doi: 10.1021/js960001i. [DOI] [PubMed] [Google Scholar]
- 28.Lindegardh N, Hanpithakpong W, Kamanikom B, Singhasivanon P, Socheat D, Yi P, Dondorp AM, McGready R, Nosten F, White NJ, Day NPJ. 2008. Major pitfalls in the measurement of artemisinin derivatives in plasma in clinical studies. J Chromatogr B Analyt Technol Biomed Life Sci 876:54–60. doi: 10.1016/j.jchromb.2008.10.021. [DOI] [PubMed] [Google Scholar]
- 29.Olliaro PL, Nair NK, Sathasivam K, Mansor SM, Navaratnam V. 2001. Pharmacokinetics of artesunate after single oral administration to rats. BMC Pharmacol 1:12. doi: 10.1186/1471-2210-1-12. [DOI] [PMC free article] [PubMed] [Google Scholar]
- 30.Zhou ZM, Anders JC, Chung H, Theoharides AD. 1987. Analysis of artesunic acid and dihydroqinghaosu in blood by high-performance liquid chromatography with reductive electrochemical detection. J Chromatogr B Biomed Sci Appl 414:77–90. doi: 10.1016/0378-4347(87)80026-9. [DOI] [PubMed] [Google Scholar]
- 31.Brown RP, Delp MD, Lindstedt SL, Rhomberg LR, Beliles RP. 1997. Physiological parameter values for physiologically based pharmacokinetic models. Toxicol Ind Health 13:407–484. doi: 10.1177/074823379701300401. [DOI] [PubMed] [Google Scholar]
- 32.Delp MD, Manning RO, Bruckner JV, Armstrong RB. 1991. Distribution of cardiac output during diurnal changes of activity in rats. Am J Physiol 261:H1487–H1493. . doi: 10.1152/ajpheart.1991.261.5.H1487. [DOI] [PubMed] [Google Scholar]
- 33.Leggett RW, Williams LR. 1991. Suggested reference values for regional blood volumes in humans. Health Phys 60:139–154. doi: 10.1097/00004032-199102000-00001. [DOI] [PubMed] [Google Scholar]
- 34.Peters SA. 2008. Evaluation of a generic physiologically based pharmacokinetic model for lineshape analysis. Clin Pharmacokinet 47:261–275. doi: 10.2165/00003088-200847040-00004. [DOI] [PubMed] [Google Scholar]
- 35.Gröer C, Busch D, Patrzyk M, Beyer K, Busemann A, Heidecke CD, Drozdzik M, Siegmund W, Oswald S. 2014. Absolute protein quantification of clinically relevant cytochrome P450 enzymes and UDP-glucuronosyltransferases by mass spectrometry-based targeted proteomics. J Pharm Biomed Anal 100:393–401. doi: 10.1016/j.jpba.2014.08.016. [DOI] [PubMed] [Google Scholar]
- 36.Pearce RG, Setzer RW, Strope CL, Sipes NS, Wambaugh JF. 2017. Httk: R package for high-throughput toxicokinetics. J Stat Softw 79:1–26. doi: 10.18637/jss.v079.i04. [DOI] [PMC free article] [PubMed] [Google Scholar]
- 37.Lyons MA, Reisfeld B, Yang RSH, Lenaerts AJ. 2013. A physiologically based pharmacokinetic model of rifampin in mice. Antimicrob Agents Chemother 57:1763–1771. doi: 10.1128/AAC.01567-12. [DOI] [PMC free article] [PubMed] [Google Scholar]
- 38.Brooks SP, Gelman A. 1998. General methods for monitoring convergence of iterative simulations? J Comput Graph Stat 7:434–455. doi: 10.2307/1390675. [DOI] [Google Scholar]
- 39.Mitchell M, Muftakhidinov B, Winchen T, Trande A, Weingrill J, Langer S, Lane D, Sower K. Engauge digitizer. http://markummitchell.github.io/engauge-digitizer. Accessed 11 March 2020.
- 40.Bois FY. 2009. GNU MCSim: Bayesian statistical inference for SBML-coded systems biology models. Bioinformatics 25:1453–1454. doi: 10.1093/bioinformatics/btp162. [DOI] [PubMed] [Google Scholar]
- 41.Van Rossum G, Drake FL, Jr.. 1995. Python reference manual. Centrum Wiskunde & Informatica, Amsterdam, Netherlands. [Google Scholar]
- 42.McKinney W. 2010. Data structures for statistical computing in python, p 51–56. In Proceedings of the 9th Python in Science Conference, vol 445. doi: 10.25080/Majora-92bf1922-00a. [DOI] [Google Scholar]
- 43.Oliphant TE. 2006. A guide to NumPy 1. Trelgol Publishing, New York, NY. [Google Scholar]
- 44.Jones E, Oliphant TE, Peterson P. 2001. SciPy: open source scientific tools for Python. http://www.scipy.org/.
- 45.Hunter JD. 2007. Matplotlib: a 2D graphics environment. Comput Sci Eng 9:90–95. doi: 10.1109/MCSE.2007.55. [DOI] [Google Scholar]
- 46.R Core Team. 2019. R: a language and environment for statistical computing. R Foundation for Statistical Computing, Vienna, Austria. https://www.R-project.org/. [Google Scholar]
- 47.Plummer M, Best N, Cowles K, Vines K. 2006. CODA: Convergence Diagnosis and Output Analysis for MCMC. R News 6:7–11. [Google Scholar]
- 48.Wickham H. 2016. ggplot2: elegant graphics for data analysis. Springer-Verlag, New York, NY. [Google Scholar]
- 49.Microsoft Corporation. 2018. Microsoft Excel.
- 50.Sangster JA. 1994. Databank of evaluated octanol-water partition coefficients. Sangster Research Laboratories, Montreal, Canada. [Google Scholar]
- 51.DrugBank. Metabolite dihydroartemisinin (DHA). https://www.drugbank.ca/metabolites/DBMET00443. Accessed 2 November 2020.