

Abstract
Haematopoietic stem and progenitor cells (HSPCs) have been the focus of developmental and regenerative studies, yet our understanding of the signalling events regulating their specification remains incomplete. We demonstrate that supt16h, a component of the Facilitates chromatin transcription (FACT) complex, is required for HSPC formation. Zebrafish supt16h mutants express reduced levels of Notch-signalling components, genes essential for HSPC development, due to abrogated transcription. Whereas global chromatin accessibility in supt16h mutants is not substantially altered, we observe a specific increase in p53 accessibility, causing an accumulation of p53. We further demonstrate that p53 influences expression of the Polycomb-group protein PHC1, which functions as a transcriptional repressor of Notch genes. Suppression of phc1 or its upstream regulator, p53, rescues the loss of both Notch and HSPC phenotypes in supt16h mutants. Our results highlight a relationship between supt16h, p53 and phc1 to specify HSPCs via modulation of Notch signalling.
Haematopoiesis is an evolutionarily conserved process that allows for a small population of haematopoietic stem and progenitor cells (HSPCs) to generate trillions of blood cells over a lifetime. Despite being one of the best characterized stem-cell systems, the ontogeny of HSPCs is not completely understood1. Many studies have focused on events required for HSPC emergence, whereby HSPCs bud from the dorsal aorta into circulation, but little is known about the previous signals needed to determine HSPC fate2,3. To fill these gaps in our understanding, we employed a forward genetic screen in zebrafish to detect genes required for HSPC specification and identified supt16h, a component of the Facilitates chromatin transcription (FACT) complex that forms a heterodimer with SSRP1. The FACT complex has been described in two roles: (1) a histone chaperone that promotes H2A-H2B dimer dissociation from the nucleosome, allowing RNA polymerase II (RNAP2) to access chromatin templates4 and (2) an initiation and elongation factor that colocalizes with RNAP2 to allow for transcriptional activity5,6.
Despite what might be considered a globally essential function in genome regulation, we found supt16h primarily affects the expression of Notch-pathway components essential for HSPC specification. An absence of Notch receptors (notch1 and notch3) and ligands (jagged1, deltaC and deltaD) results in a loss of HSPCs in mouse and zebrafish7–10. Moreover, we demonstrated that these ‘Notch genes’, defined here as Notch receptors and ligands, are transcriptionally affected by the levels of polyhomeotic homologue 1 (PHC1), a Polycomb-group protein whose expression is controlled by p53. Although canonically described in the induction of apoptosis, cell-cycle arrest and senescence, recent findings show p53 involvement in genomic stability, transcriptional regulation and epigenetic modifications11–13. We demonstrate that p53 controls phc1 expression through direct binding at the phc1 locus, which influences transcriptional repression of Notch genes. This work highlights a previously uncharacterized method of Notch-gene regulation and elucidates an unrecognized relationship between Polycomb-group proteins, p53 and FACT in modulating Notch-gene transcription during HSPC development.
Results
A forward genetic screen identifies supt16h−/− mutants lacking HSPCs.
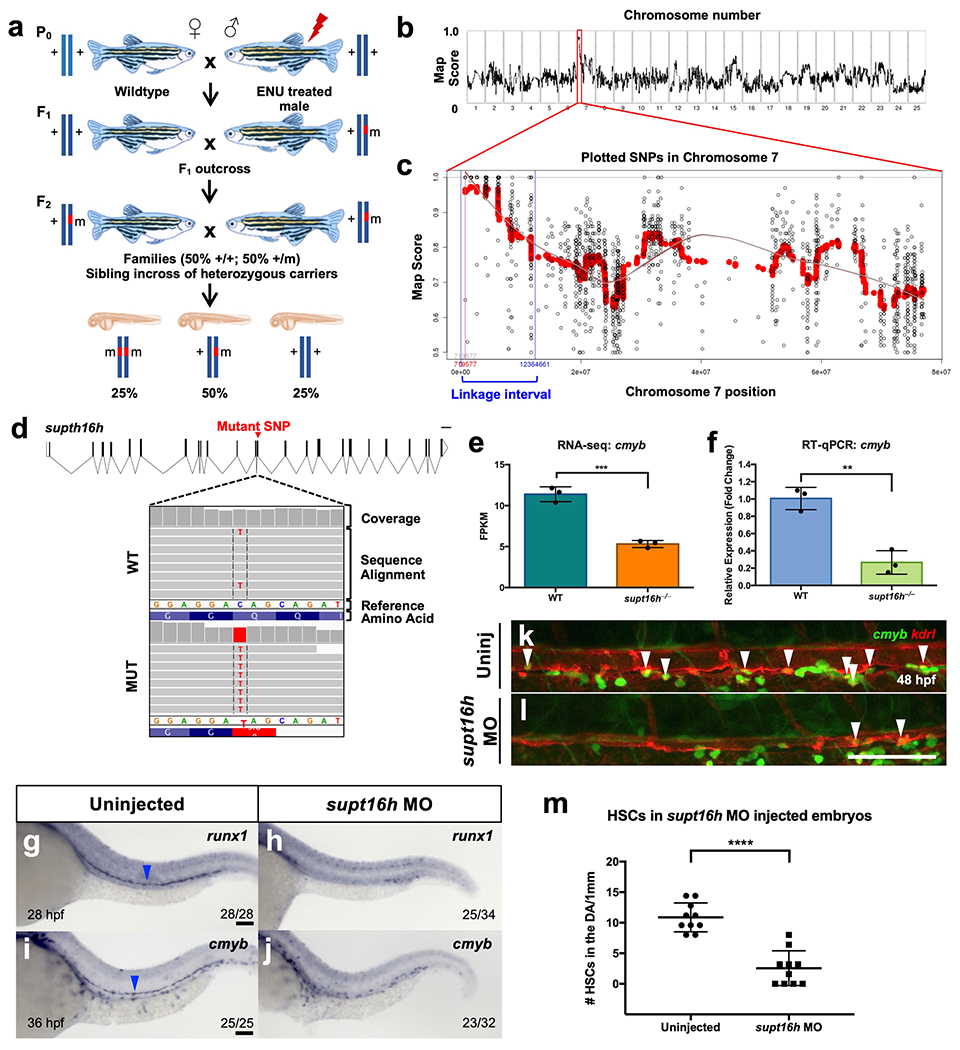
Zebrafish supt16h mutants (supt16h−/−) were obtained through a forward genetic screen for animals defective in HSPC specification (Extended Data Fig. 1a) and identified using RNA sequencing (RNA-seq)-based single nucleotide polymorphism (SNP) linkage mapping14. Our candidate gene mapped to Chromosome 7 and corresponded to a premature stop codon in supt16h (Extended Data Fig. 1b–d and Supplementary Table 1). Mutants exhibited enlarged hindbrains and curved tails beginning at 32 h post fertilization (h.p.f.), leading to lethality at 3 d post fertilization (Fig. 1a,b). These traits were linked to a complete loss of HSPCs, as assessed by whole-mount in situ hybridization (WISH) for runx1 and cmyb HSPC markers along the aortic floor at 28 and 36 h.p.f., respectively, as well as RNA-seq and quantitative reverse transcription PCR (RT-qPCR) analyses (Fig. 1c–f and Extended Data Fig. 1e,f). In addition, supt16h−/− mutants on a Tg(cmyb:eGFP; kdrl;mCherry) background, where double-positive cells along the aortic floor represent HSPCs, exhibited a significantly reduced number of HSPCs compared with their wild-type (WT) siblings (Fig. 1g–i)2. Moreover, injection of WT supt16h messenger RNA into mutant embryos rescued the hindbrain, tail and HSPC phenotypes (Fig. 1j–q), and injecting supt16h antisense Morpholino oligonucleotide (MO) phenocopied the reduced HSPCs in supt16h−/− mutants (Extended Data Fig. 1g–m)2. Together, these data indicate that Supt16h is required for HSPC formation.
Fig. 1 |. A forward genetic screen identifies supt16h−/− mutants that specifically lack HSPCs.
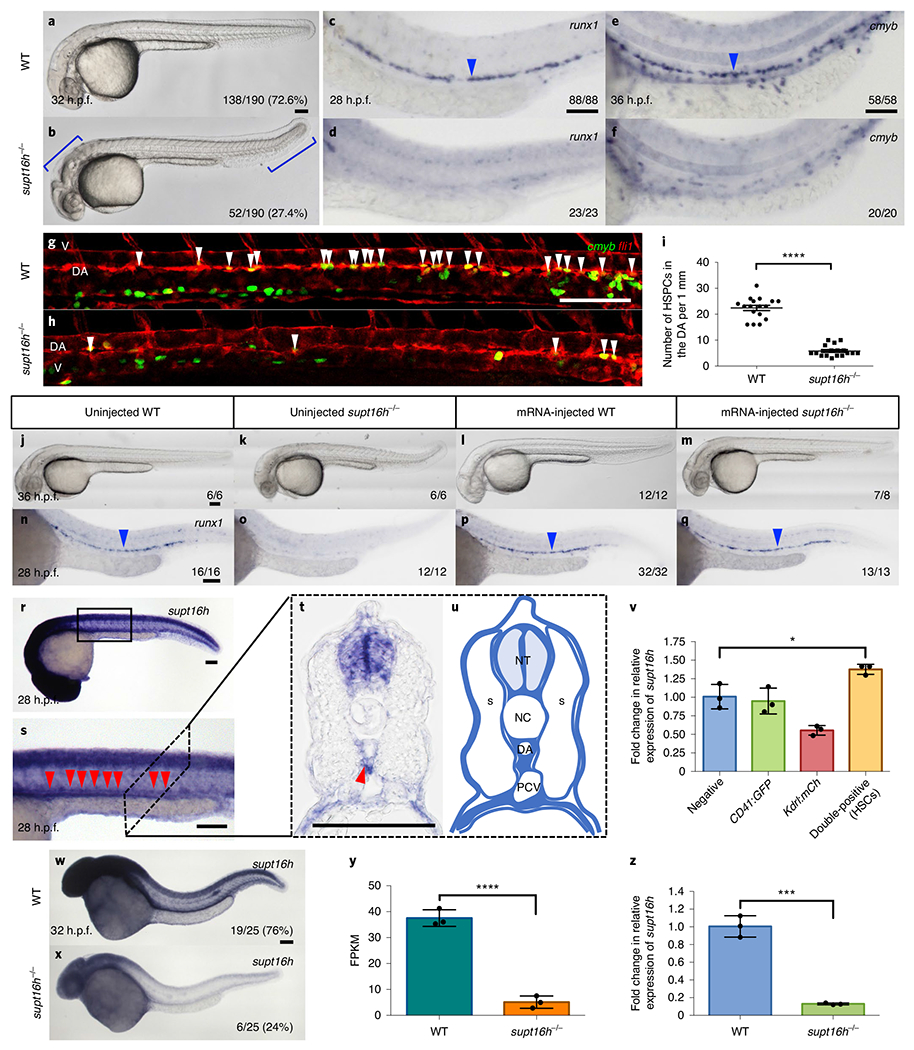
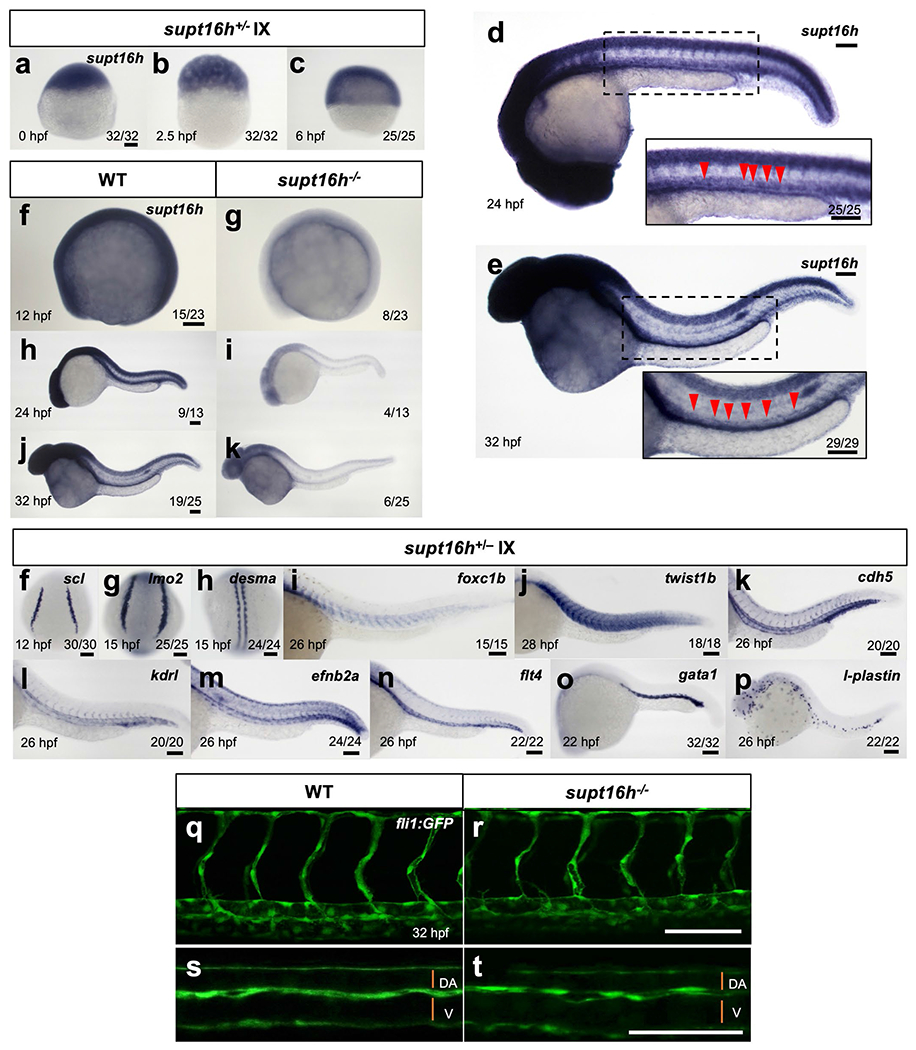
a,b, Images of WT (a) and supt16h−/− (b) siblings at 32 h.p.f. The blue brackets highlight the morphological defects of the heads and tails of the mutants. c-f, WISH of the HSPC markers runx1 at 28 h.p.f. (c,d) and cmyb at 36 h.p.f. (e,f) of WT (c,e) and supt16h−/− (d,f) siblings. g,h, Representative confocal images of WT (g) and supt16h−/− (h) siblings crossed with Tg(cmyb:GFP; fli1:DsRed) embryos. Double-positive HSPCs (yellow fluorescence) at 48 h.p.f. are indicated by white arrowheads. DA, dorsal aorta; V, vein. i, Number of double-positive HSPCs from g,h. Data are represented as the mean ± s.e.m.; n = 17. Two-tailed Student’s t-test, ****P< 0.0001. j-q, Injection of WT supt16h mRNA in WT and supt16h−/− sibling embryos. Bright-field images at 36 h.p.f. show morphological rescue of injected supt16h−/− embryos (j-m) and WISH of runx1 at 28 h.p.f. (n-q). r-u, WISH of supt16h at 28 h.p.f. (r), with a magnified view of the boxed region in r along the dorsal aorta (s), a cross-sectional view (t) and a representative cartoon of t with the regions of expression coloured (u). NT, neural tube; S, somites; NC, notochord; DA, dorsal aorta; and PCV, post cardinal vein. The red arrowheads indicate the DA; n = 4. v, RT-qPCR analysis of supt16h in FACS-purified cells-double-positive (HSPCs), single-positive and negative cells-from Tg(CD41:GFP; kdrl:mCherry) embryos at 48 h.p.f. Data are represented as the mean ± s.d.; n = 3. One-way analysis of variance (ANOVA) with Tukey’s post-hoc test, *P = 0.0331. w,x, WISH of supt16h on WT (w) and supt16h−/− (x) sibling embryos at 32 h.p.f. The percentages correlate with Mendelian segregation. y,z, Expression of supt16h in WT and supt16h−/− (pooled) sibling embryos at 32 h.p.f. determined through RNA-seq (y) and RT-qPCR (z). Data are represented as the mean ± s.d.; n = 3. Two-tailed Student’s t-test, ****P = 0.0001 (y) and ***P = 0.0002 (z). FPKM, fragments per kilobase of transcript per million mapped reads. For RT-qPCR, the expression values are relative to those of the WT siblings. The blue arrowheads indicate HSPCs. Scale bars, 100 μm. For a,b,w,x the fractions represent the number of genotypic embryos over the clutch total. For c-f, j-q the fractions are the representative outcome for each genotyped group. Source data are provided.
The supt16h gene was broadly expressed throughout development (Extended Data Fig. 2a–c and Fig. 1r). Higher-magnification and cross-sectional views of supt16h WISH embryos showed its expression along the dorsal aorta floor, where HSPCs emerge (Fig. 1s–u and Extended Data Fig. 2d,e). Moreover, RT-qPCR of HSPCs purified using fluorescence-activated cell sorting (FACS) demonstrated enrichment of supt16h, providing further evidence of expression in HSPCs. In addition, the transcription of supt16h was substantially reduced in our mutant line—as observed by WISH, RNA-seq and RT-qPCR—due to nonsense-mediated decay (Fig. 1v–z and Extended Data Fig. 2f–k). To further characterize the specific requirement of supt16h on HSPC formation, we examined tissues essential for HSPC specification. The expression of markers of the posterior lateral mesoderm, somites, sclerotome, vascular endothelium, dorsal aorta, vein, primitive erythrocytes and primitive leukocytes was normal in mutants (Extended Data Fig. 2f–t). Overall, these results indicate that the specific loss of HSPCs in supt16h−/− is not due to improper formation of upstream or adjacent tissues.
The Notch pathway is downregulated in supt16h−/−.
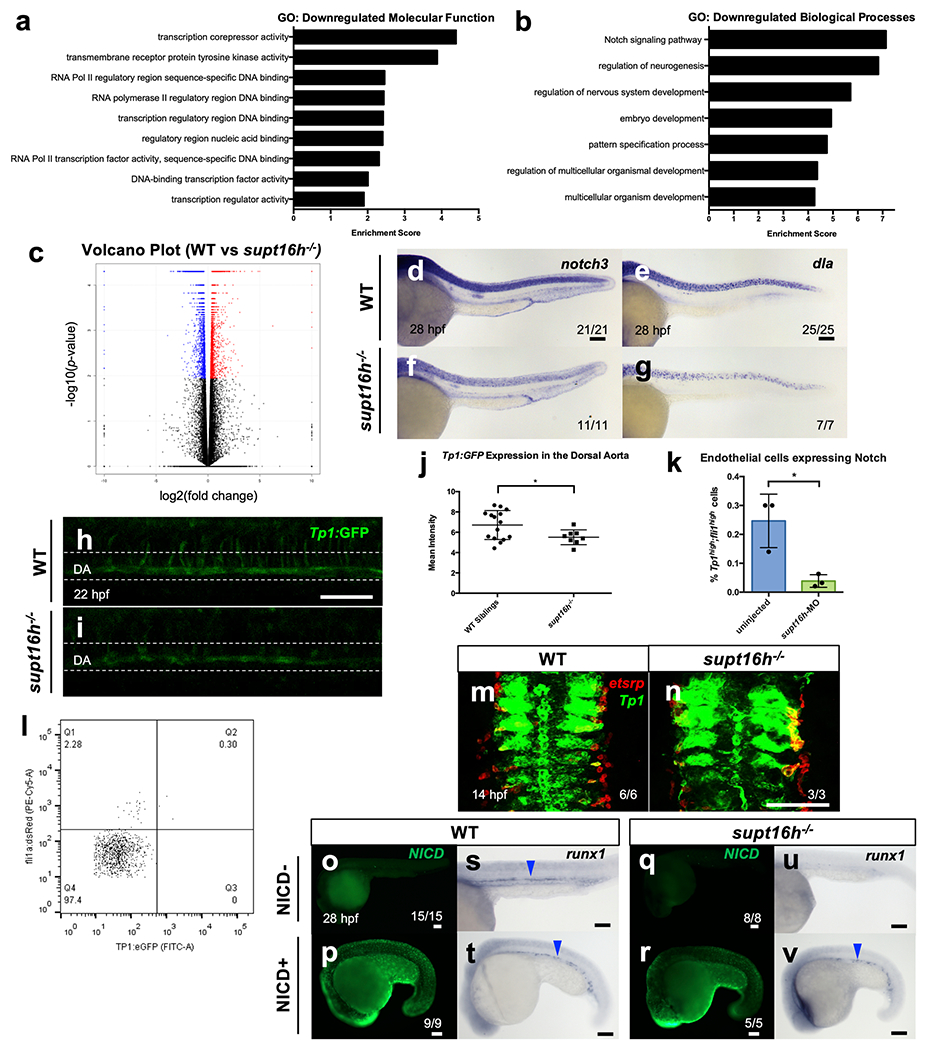
To explore the contribution of supt16h during haematopoiesis, we performed Gene Ontology (GO) analysis using transcripts that were significantly downregulated in mutants (Extended Data Fig. 3a,b)15,16. Although the molecular processes that were most affected were associated with transcriptional regulation and binding of RNAP2 to DNA, we observed no bias in the number of upregulated and downregulated genes in supt16h−/− (Extended Data Fig. 3c). We did observe that the only affected signalling pathway and top downregulated biological process was Notch (Fig. 2a and Extended Data Fig. 3b), which has been associated with HSPC specification and emergence7–9,17–21. The transcriptional levels of Notch genes were reduced in mutant embryos at 28–32 h.p.f., based on RNA-seq, RT-qPCR and WISH analyses (Fig. 2b–g and Extended Data Fig. 3d–g). The notch2 gene was reduced to a lesser extent, but it is known to be dispensable for HSPC formation7,22. Furthermore, mutants harbouring the Notch reporter line Tp1:GFP displayed significantly downregulated Notch activity in the dorsal aorta at 22 and 28 h.p.f. (Fig. 2h–j and Extended Data Fig. 3h–j). Sorted Tp1:GFP+;fli1:DsRed+ cells, which have been shown to have high runx1 expression, were present at lower levels in supt16h morphants21 (Extended Data Fig. 3k,l). Interestingly, there was no alteration on Notch-gene activity in mutants during early somitogenesis at 14 h.p.f. (Extended Data Fig. 3m,n). Therefore, supt16h−/− mutants have impaired late (28 h.p.f.), but not early (14 h.p.f.), Notch-gene expression. To determine whether the reduction in Notch-gene transcripts in supt16h−/− mutants led to HSPC loss, we forced global expression of Notch intracellular domain 1 (NICD) using a Tg(hsp70) driver and endothelial expression using a Tg(cdh5:gal4ff) driver23. Restoration of Notch activity using these transgenes in supt16h−/− mutants rescued HSPC development (Fig. 2k–r and Extended Data Fig. 3o–v). Together, these data indicate that Notch signalling is downstream of supt16h function during HSPC specification.
Fig. 2 |. The Notch pathway is downregulated in supt16h−/− mutants.
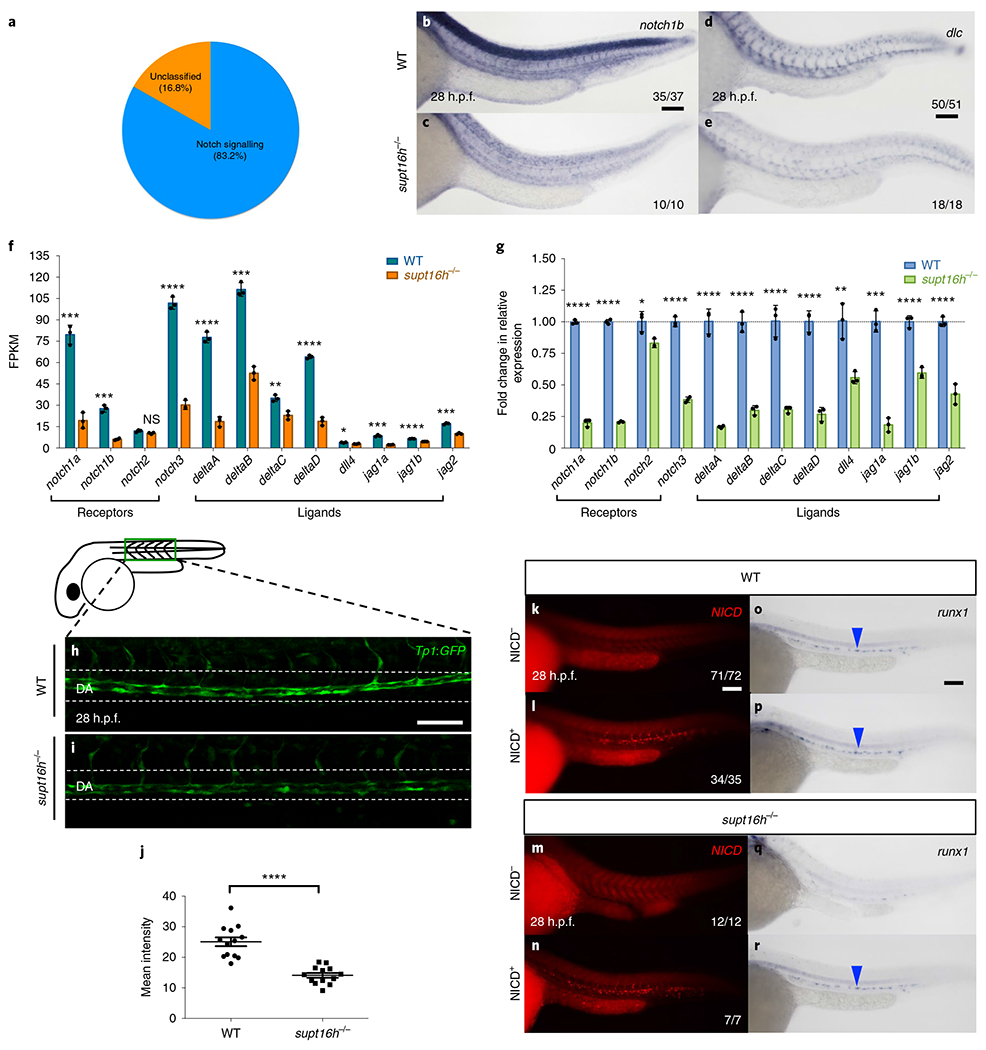
a, Pie chart of the downregulated pathways in supt16h−/− mutants based on Gene Ontology analysis (log2[fold change] > −1) of RNA-seq data. Fisher’s exact test with Bonferroni correction, P = 0.0334. b-e, WISH of notch1b (b,c) and dlc (d,e) in WT (b,d) and supt16h−/− (c,e) sibling embryos. f, Expression levels of Notch genes based on RNA-seq. g, Expression levels, determined using RT-qPCR, of Notch genes in pooled embryos at 32 h.p.f. where expression is relative to the WT siblings (horizontal dotted line). FPKM, fragments per kilobase of transcript per million mapped reads. f,g, Data are represented as the mean ± s.d.; n = 3. Two-tailed Student’s t-test with Holm-Sidak correction for multiple comparisons; ****P< 0.0001, ***P< 0.001, **P<0.01, *P<0.05 and NS, not significant. h,i, Representative confocal images along the dorsal aorta (DA) of supt16h−/− (i) and WT (h) sibling embryos on a Tg(Tp1 :GFP) background at 28 h.p.f. j, Mean fluorescence intensity of Tp1:GFP along the DA from h,i calculated using ImageJ. Data are represented as the mean ± s.e.m.; n = 13. Two-tailed Student’s t-test; ****P<0.0001. k-r, Vascular-specific expression of NICD+ (l,n,p,r) and NICD− (k,m,o,q) WT (k,l,o,p) and supt16h−/− (m,n,q,r; supt16h+/−; cdh5:gal4ff×supt16h+/−; UAS-myc:NICD) sibling embryos analysed at 28 h.p.f. by NICD immunohistochemistry (k-n) and runx1 WISH (o-r). Representative images from two independent experiments. The blue arrowheads indicate HSPCs. For b-e, k-r the fractions are the representative outcome for each genotyped group. Scale bars, 100 μm. Source data are provided.
Induction of p53 in supt16h−/− mutants perturbs HSPC formation.
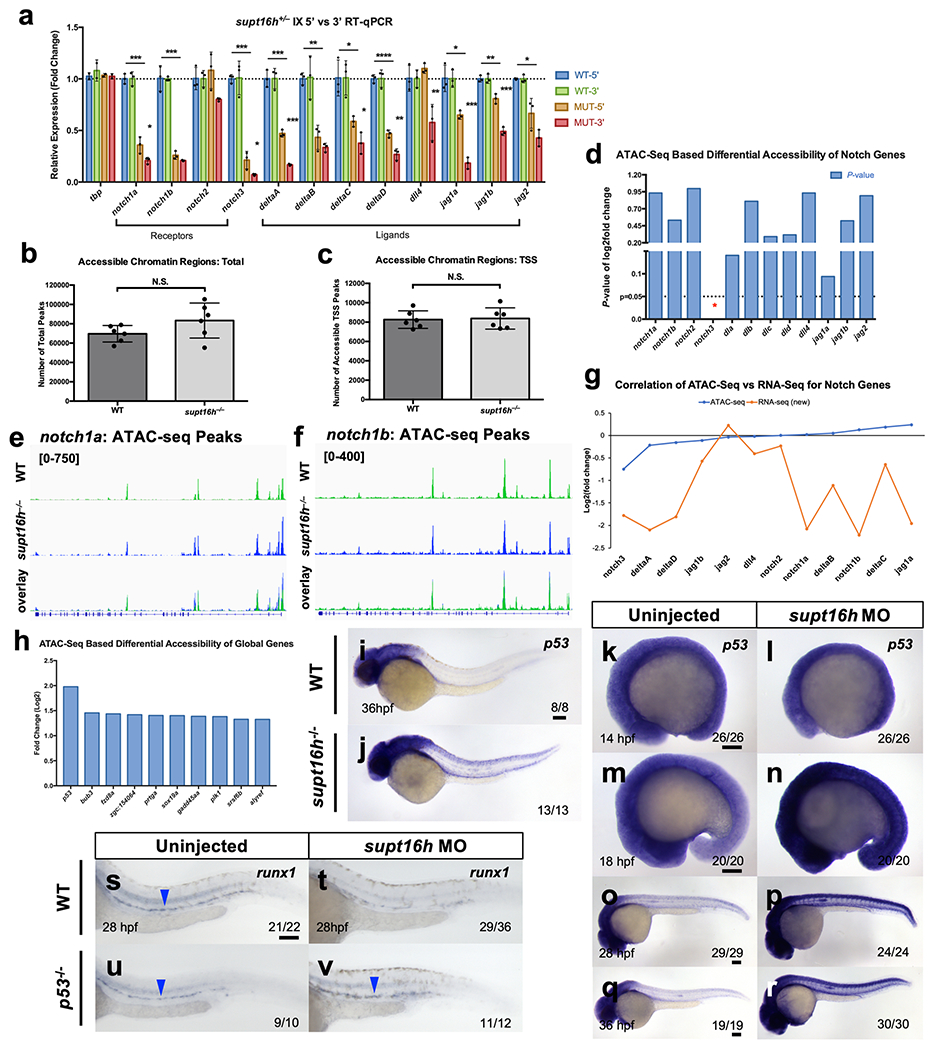
The FACT complex colocalizes with RNAP2 to initiate transcription and can associate with Tif1γ to promote transcriptional elongation of erythroid genes24. We therefore examined the connection between Supt16h and initiation and elongation of Notch-gene transcripts using RT-qPCR, assaying for changes between the 3’-and 5’-end transcript levels. We found that, although transcriptional initiation was substantially altered in all but three Notch genes, elongation of supt16h−/− transcripts was unaffected in most genes, which suggests that the Notch genes are inefficiently transcribed as a result of aberrant Supt16h activity as part of the transcriptional initiation complex (Extended Data Fig. 4a).
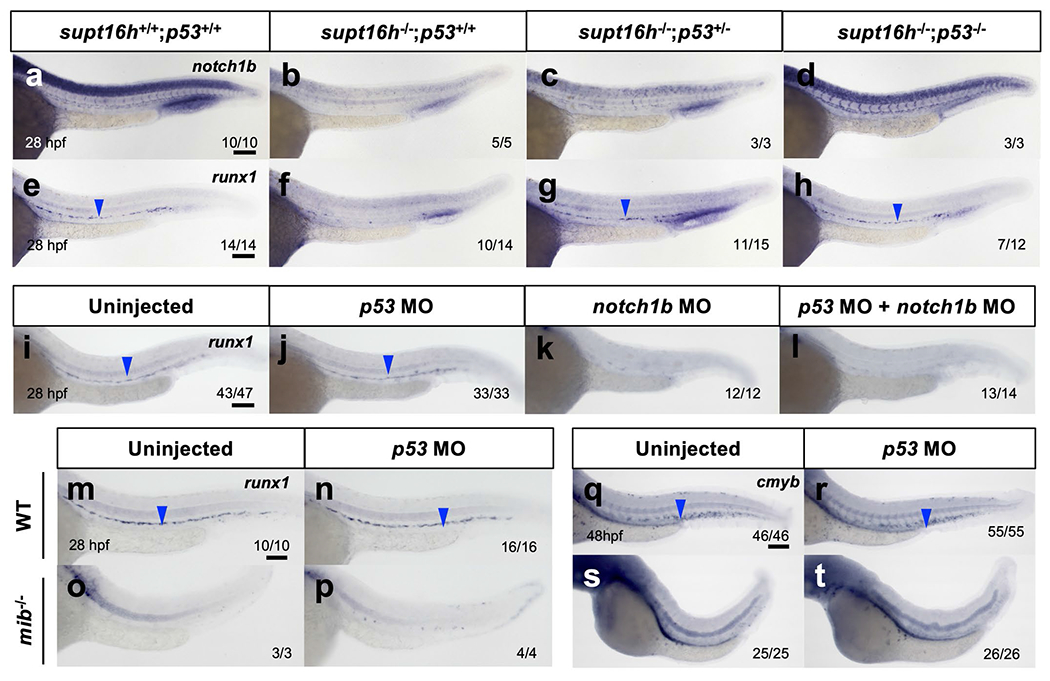
Due to the role of Supt16h as a histone chaperone to remodel chromatin, we conducted an assay for transposases accessible chromatin with sequencing (ATAC-seq) to determine whether chromatin accessibility of the Notch-gene coding sequences was affected in the supt16h−/− mutants. We observed no difference in accessibility at transcriptional start sites or on Notch genes globally, and no correlation between DNA accessibility and Notch transcription (Extended Data Fig. 4b–g). As there was no obvious connection between Notch-gene transcription levels and accessibility, we evaluated genes with the most differentially accessible peaks in the supt16h−/− mutants and found p53 to be the most accessible gene (Fig. 3a and Extended Data Fig. 4h). We observed notable increases in both p53 transcript and protein expression in mutants (Fig. 3b–d and Extended Data Fig. 4i,j). WISH analyses demonstrated p53 increases throughout supt16h−/− embryos, including the dorsal aorta, commencing at 18 h.p.f. (Fig. 3e–j and Extended Data Fig. 4k–r). To determine whether there is a specific haematopoietic consequence of reducing the levels ofp53 in the absence of Supt16h, we examined supt16h−/− crossed with p53 mutants (tp53zdf1/zdf1)25. The supt16h;p53 double mutants rescued HSPC formation, probably due to an inability of p53 to activate the downstream targets (Fig. 3k–m)25. Morpholino oligonucleotide knockdown of supt16h in the p53 mutants or p53 in the supt16h−/− mutants similarly rescued HSpCs (Fig. 3n–q and Extended Data Fig. 3s–v). This was further highlighted by RT-qPCR, where we detected a significant increase in runx1 transcripts in the p53-MO-injected mutants (Fig. 3r).
Fig. 3 |. Induction of p53 in supt16h−/− mutants perturbs HSPC formation.
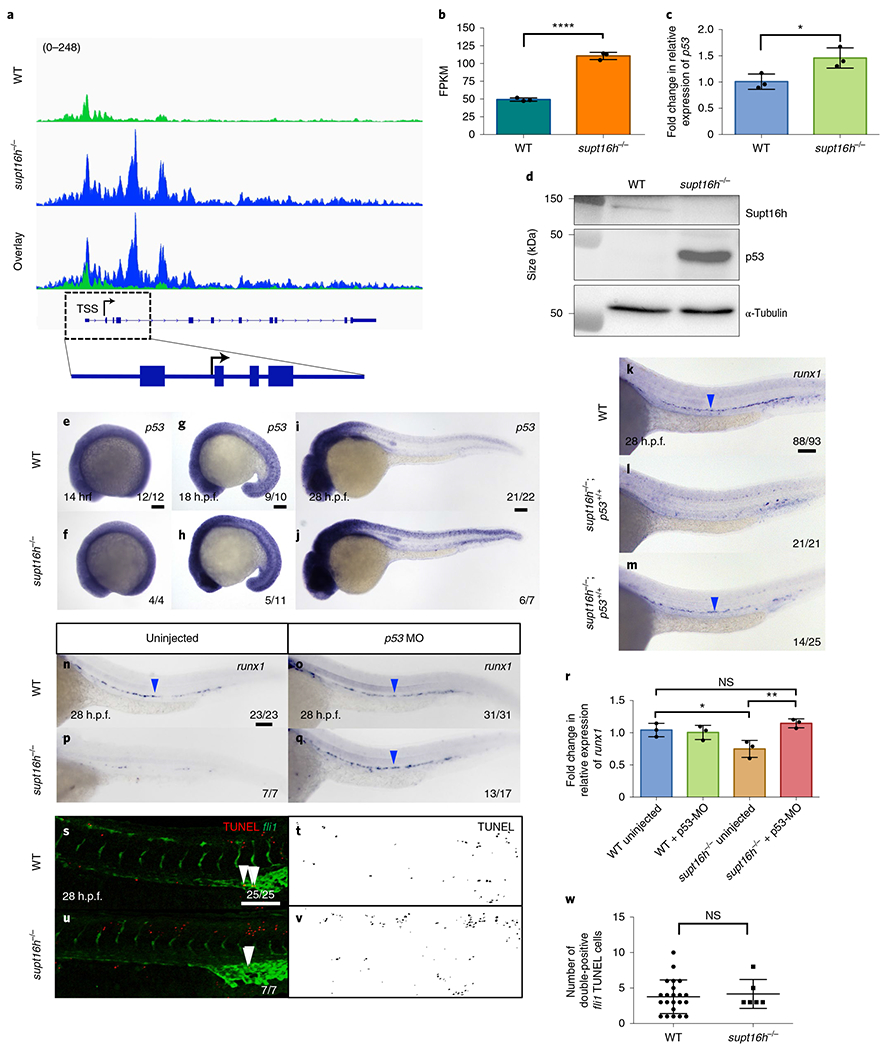
a, Peaks of WT and supt16h−/− sibling embryos for p53 ATAC-seq. The transcriptional start site (TSS), introns (blue lines) and exons (blue boxes) are shown (bottom). Value in parenthesis represents track height in pixels. b,c, Expression levels of p53 in supt16h−/− and WT sibling embryos at 32 h.p.f. based on RNA-seq (b) and RT-qPCR (c). Data are represented as the mean ± s.d.; n = 3. Two-tailed Student’s t-test, ****P<0.0001 (b) and *P = 0.0317 (c). d, Supt16h, p53 and α-tubulin western blots of supt16h−/− and WT sibling embryos at 32 h.p.f. Representative images from three biological replicates. Raw unprocessed blots are available in the source data. e-j, WISH for p53 expression in WT and supt16h−/− sibling embryos at 14 (e,f), 18 (g,h) and 28 h.p.f. (i,j). k-m, WISH for runx1 of WT (k), supt16h−/−;p53+/+ (l) and supt16h−/−;p53−/− (m) sibling embryos at 28 h.p.f. Representative of four biological replicates. n-q, WISH for runx1 of WT (n,o) and supt16h−/− (p,q) sibling embryos injected with p53-MO (o,q) as well as uninjected controls (n,p). r, Expression levels of runx1, determined using RT-qPCR, in pooled embryos from n-q at 28 h.p.f. Data are represented as the mean ± s.d.; n = 3. One-way ANOVA with Tukey’s post-hoc test; *P = 0.039, **P = 0.0078 and NS, not significant. s-v, TUNEL analysis of WT and supt16h−/− siblings crossed with Tg(fli1i:GFP) at 28 h.p.f. Confocal images of TUNEL, fli1 and double-positive TUNEL+fli1+ (yellow; indicated by white arrowheads; left), and TUNEL-only cells are shown (right). w, Number of double-positive TUNEL+fli1+ cells at 28 h.p.f. from s-v. Data are represented as the mean ± s.e.m.; n = 22 (WT) and 6 (supt16h−/−). Two-tailed Student’s t-test; NS, not significant. For the RT-qPCR, the expression values are relative to those of the WT siblings. The blue arrowheads indicate HSPCs. For e-q, s and u the fractions are the representative outcome for each genotyped group. Scale bars, 100 μm. Source data are provided.
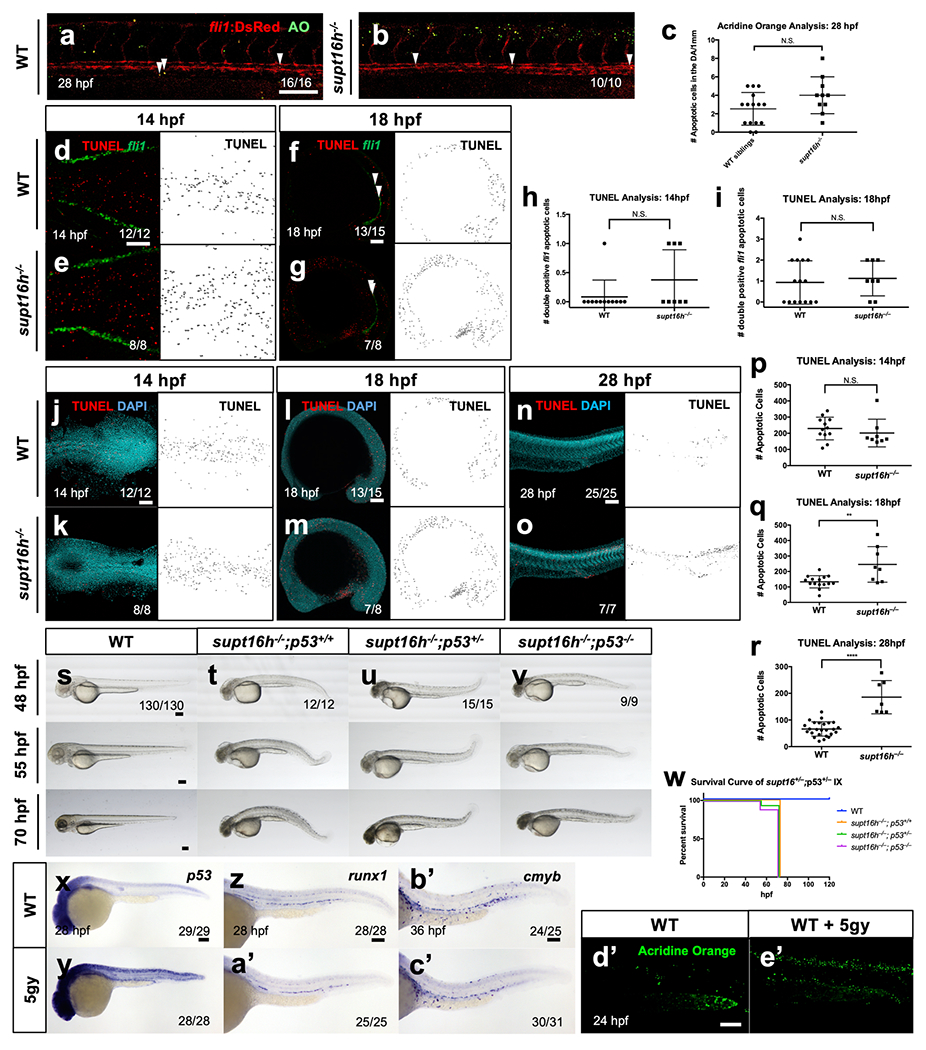
To examine whether a reduction in p53 prevents HSPC death to rescue specification in supt16h−/− mutants, we conducted terminal deoxynucleotidyl transferase dUTP nick-end labelling (TUNEL) assays and acridine orange staining on supt16h−/− embryos harbouring a fli1:GFP endothelial reporter that marks the shared vascular precursors of HSPCs. We discerned no difference in the number of double-positive TUNEL+fli1+ cells at 14, 18 and 28 h.p.f., despite being able to distinguish between global apoptotic events in WT and mutants from 18 h.p.f. (Fig. 3s–w and Extended Data Fig. 5a–r). This demonstrates that a loss of HSPCs in supt16h−/− mutants is not a result of their death in the endothelium. We further characterized the role of p53-independent apoptosis and found that p53 loss in the supt16h−/− mutants did not resolve their abnormal morphologies or extend survival (Extended Data Fig. 5s–w). In addition, we observed that although general genotoxic stress through ionizing radiation increased p53 expression and cell death, it did not affect HSPC specification (Extended Data Fig. 5x–e’). Overall, these results suggest that elevated p53, caused by a global loss of supt16h, perturbs HSPC formation independent of cell-mediated apoptosis.
The transcription levels of the Notch genes are influenced by p53 abundance.
It is known that p53 is a transcriptional regulator of numerous genes by direct stimulation of the transcription of RNAP2-transcribed genes or activation of the associated pathways13. To address whether ectopically elevated p53 is related to the reduced transcript levels of Notch genes in supt16h−/− mutants, we examined the effect ofp53 downregulation on Notch-pathway activation using the Tp1:GFP Notch reporter line and found that p53-MO injection into supt16h−/− mutants restored Notch activity (Fig. 4a–e). Both double mutants and double morphants of supt16h;p53 also rescued notch1b, which we previously demonstrated is required for HSPC specification, and runx1 expression (Fig. 4f–m and Extended Data Fig. 6a–h)8. We next tested the effect of differences in p53 levels on Notch-gene transcription, given that previous studies have linked p53 abundance to impaired RNAP2 activity and suppressed mRNA synthesis26,27. We observed reduced expression of p21 —a downstream target of p53—in supt16h−/− mutants (WT, heterozygous and homozygous for p53), which was relative to the genetic dosing of the p53 mutants (Fig. 4n). Remarkably, we observed the converse trend with runx1 and Notch genes, where the transcript levels increased following p53 reduction (Fig. 4o,p). These data indicate that p53 and Supt16h coordinate to activate the transcription of Notch genes during HSPC specification.
Fig. 4 |. The transcription levels of the Notch genes are influenced by p53 abundance.
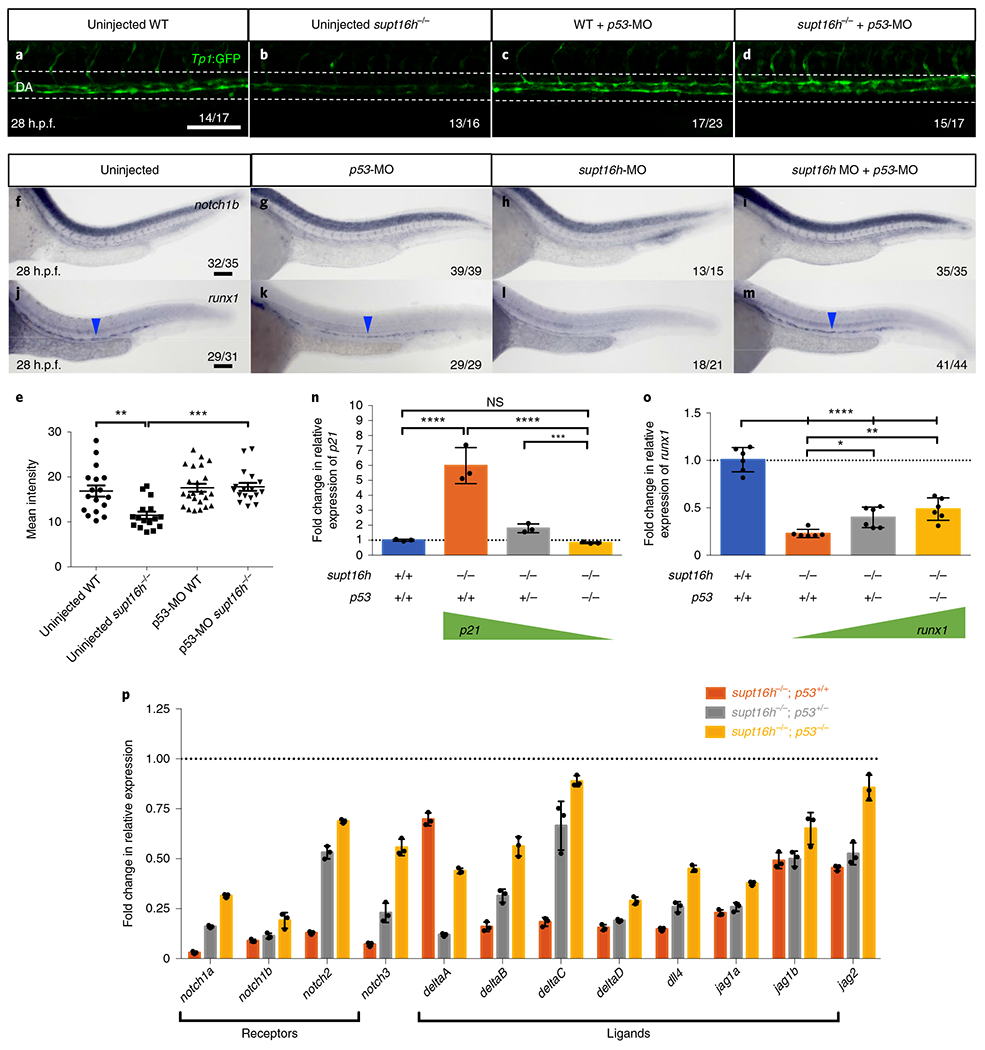
a-d, Representative confocal images of the dorsal aorta (DA) of supt16h−/− and WT sibling embryos on a Tg(Tp1:GFP) background injected with p53-MO (c,d) at 28 h.p.f. as well as uninjected controls (a,b). The white dotted lines represent the location of DA; n> 16. Scale bar, 25 μm. e, Mean fluorescence intensity of Tp1:GFP of the DA from a-d calculated in ImageJ based on Integrated Density. Data are represented as the mean ± s.e.m.; n = 17 (uninjected WT and p53-MO supt16h−/−), 16 (uninjected supt16h−/−) and 23 (p53-MO WT). One-way ANOVA with Tukey’s post-hoc test, **P = 0.0021 and ***P = 0.0002. f-m, WISH for notch1b (f-i) and runx1 (j-m) at 28 h.p.f. of uninjected embryos (f,j) and embryos injected with p53-MO (g,k), supt16h-MO (h,l) and supt16h-MO + p53-MO (i,m). The blue arrowheads indicate HSPCs. n,o, Expression levels at 32 h.p.f. of p21 (n) and runx1 (o), determined by RT-qPCR, in WT and supt16h−/− sibling embryos that are p53+/+p53+/− or p53−/−. Data are represented as the mean ± s.d.; n = 3 (n) and 6 (o). One-way ANOVA with Tukey’s post-hoc test; ****P< 0.0001, ***P = 0.0002, **P = 0.0021, *P = 0.0492 and NS, not significant. p, Expression levels at 32 h.p.f., determined by RT-qPCR (3′ ends), of Notch receptors and ligands in supt16h−/− embryos that are p53+/+, p53+/− or p53−/−. Data are represented as the mean ± s.d.; n = 3). n-p, The expression values are relative to those of the WT siblings (horizontal dotted line). Scale bar, 100 μm. Source data are provided.
To further examine the epistasis between p53 and Notch signalling during HSPC formation, we co-injected notch1b- and p53-MOs to determine whether p53 regulation of Notch genes is confined to supt16h−/−. We observed an absence of HSPCs in notch1b morphants and, notably, a lack of HSPC rescue in double notch1b; p53 morphants (Extended Data Fig. 6i–l). In addition, p53 knockdown in mindbomb (mib) mutants with defective Notch-pathway signalling and HSPC formation resulted in continued aberrant HSPCs (Extended Data Fig. 6m–t)28. These data indicate that a reduction of p53 alone is not sufficient to restore HSPCs in embryos when Notch genes are downregulated and further suggests that Notch signalling is downstream of p53 function.
HSPC specification is unaffected by ssrp1.
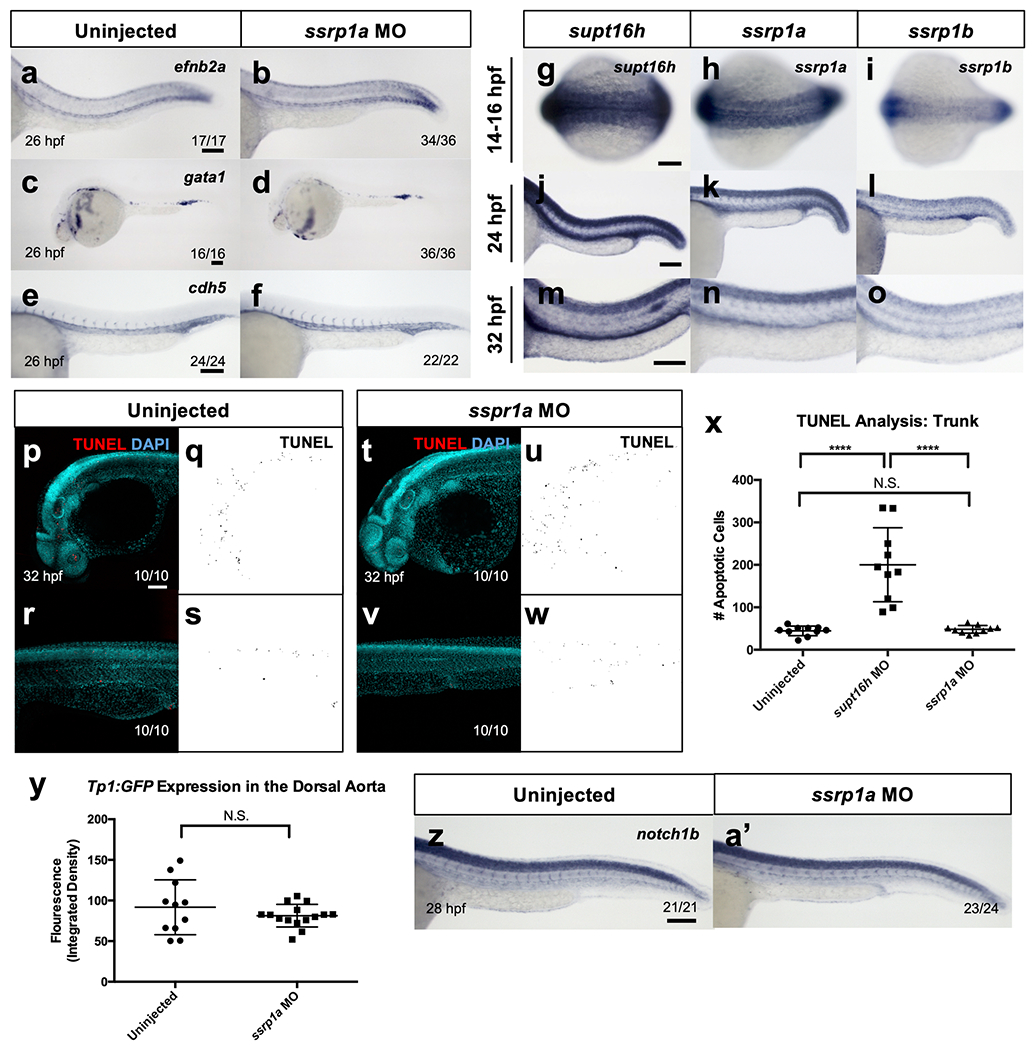
As part of the larger FACT complex, Supt16h forms a heterodimer with SSRP1 to effectively alter chromatin accessibility29. We examined the consequences of ssrp1 knockdown on HSPC formation to address whether the effect of Supt16h on HSPC development was independent of the FACT complex or associated with the role of FACT as a transcriptional regulator. Given that the zebrafish paralogue ssrp1a can compensate for the role of ssrp1b30,31, we mainly focused on ssrp1a in future experiments. HSPC development was normal in both single sspr1a and double ssrp1a; ssrp1b morphants (Fig. 5a–h). Similar results were observed for ssrp1a−/−, characterized by a premature stop codon on exon 11 and reduced ssrp1a transcripts (Fig. 5i–k)32. In addition, we observed no effect on the dorsal aorta, early red blood cell or vasculature in morphants (Extended Data Fig. 7a–f). WISH analysis showed both ssrp1a and ssrp1b maintained a similar global expression pattern to supt16h from 14 to 32 h.p.f., and that these genes are present along the floor of the dorsal aorta, which corresponded to their detectable upregulation in HSPCs (Fig. 5l–p and Extended Data Fig. 8g–o).
Fig. 5 |. HSPC specification is unaffected by ssrp1.
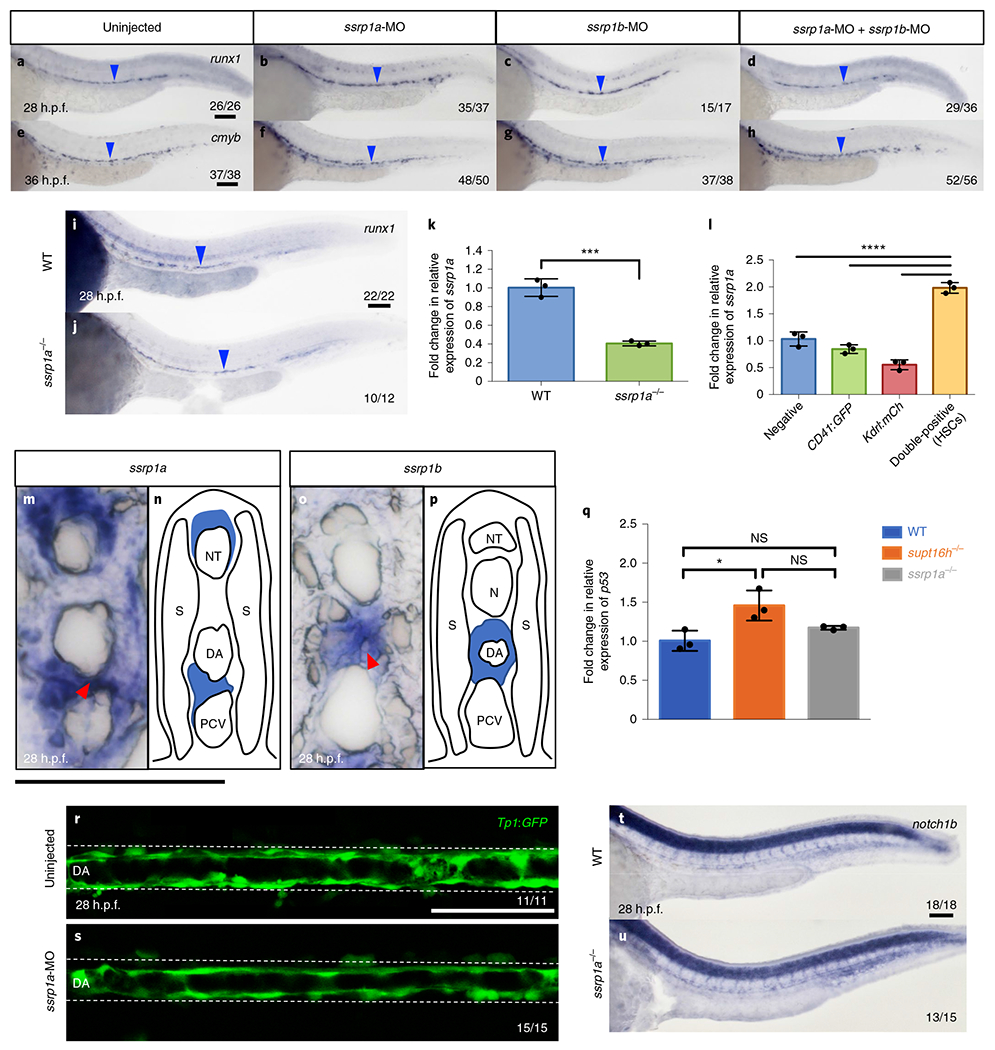
a-h, WISH for runx1 (a-d) and cmyb (e-h) at 28 and 36 h.p.f., respectively, of embryos injected with ssrp1a-MO, ssrp1b-MO or both. i,j, WISH for runx1 of WT (i) and ssrp1a−/− (j) sibling embryos at 28 h.p.f. a-j, The blue arrowheads indicate HSPCs. k, Expression of ssrp1a in WT and ssrp1a−/− sibling embryos at 32 h.p.f. based RT-qPCR. Data are represented as the mean ± s.d.; n = 3. Two-tailed Student’s t-test, ***P = 0.0004. l, Expression of ssrp1a in FACS-purified cells (double-positive (HSPCs), single-positive and negative cells) from Tg(CD41:GFP;kdrl:mCherry) embryos at 48 h.p.f. determined by RT-qPCR. Data are represented as the mean ± s.d.; n = 3. One-way ANOVA with Tukey’s post-hoc test; ****P < 0.0001, **P = 0.0019 and *P = 0.0328. m-p, Cross section of ssrp1a (m,n) and ssrp1b (o,p) WISH at 28 h.p.f. The red arrowheads indicate expression at the floor of the dorsal aorta. n,p, Representative cartoons showing expression from m and o, respectively. NT, neural tube; S, somites; DA, dorsal aorta; and PCV, post cardinal vein. q, Expression of p53 in WT, supf16h−/− and ssrp1a−/− embryos at 32 h.p.f. determined by RT-qPCR. Data are represented as the mean ± s.d.; n = 3. One-way ANOVA with Tukey’s post-hoc test; *P = 0.0147; and NS, not significant. r,s, Representative confocal images along the dorsal aorta (DA) of Tg(Tp1:GFP) embryos injected with ssrp1a-MO (s), as well as uninjected controls (r), at 28 h.p.f. based on one independent experiment. t,u, WISH for nofch1b expression in WT (t) and ssrp1a−/− sibling (u) embryos at 28 h.p.f. k,l,q, The expression values are relative to those of the WT siblings. For a-j, r-u the fractions are the representative outcome for each genotyped group. Scale bars, 100 μm. Source data are provided.
To further understand of the disparate effect of SSRP1 and Supt16h on HSPC development, we examined the influence of SSRP1 on p53 and Notch abundance. We saw no discernable difference in p53 expression or cell-death events in the ssrp1a mutants or morphants (Fig. 5q and Extended Data Fig. 8p–x). Furthermore, we observed no altered Notch signalling activity in our morphants following ssrp1a knockdown in the Tp1:GFP reporter line (Fig. 5r,s and Extended Data Fig. 8y). Consistent with these findings, notch1b expression was unchanged in both ssrp1a mutants and morphants based on WISH (Fig. 5t,u and Extended Data Fig. 8z,a’). Overall, these results demonstrate that, despite sharing similar expression profiles to supt16h, ssrp1a is dispensable for proper Notch activity, p53 activation and HSPC formation, thereby suggesting that Supt16h and SSRP1 maintain independent roles during HSPC specification.
p53 regulates phc1 expression to control Notch-gene transcription and HSPC specification.
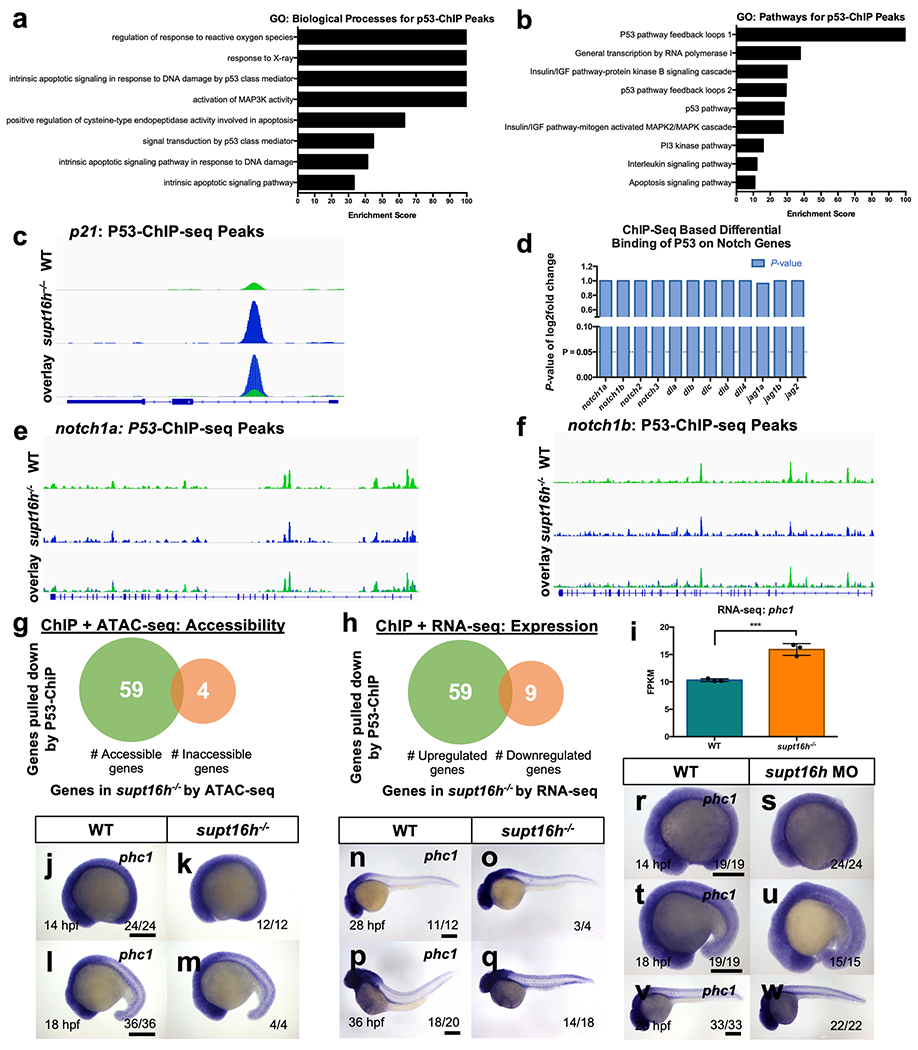
To assess the mechanism by which p53 regulates Notch-gene expression in supt16h−/− mutants, we conducted chromatin immunoprecipitation-sequencing (ChIP-seq) to investigate whether p53 binds directly to Notch genes to influence their activity or to known transcriptional regulators to indirectly affect Notch expression. Following p53-based ChIP-seq, we observed through GO analysis that the most highly expressed genes were associated with apoptotic processes and p53 signalling, including p21 expression (Extended Data Fig. 8a–c). We then examined the direct interaction between p53 and Notch genes, and found no substantial increase in binding in supt16h−/− mutants (Extended Data Fig. 8d–f), indicating that p53 does not mediate Notch-gene expression directly.
We thus explored the option that p53 indirectly influences Notch signalling by increasing the expression of a Notch transcriptional repressor, given that correlative analysis of our ChIP-seq results with our RNA- and ATAC-seq datasets showed a majority of the ChIP genes that were differentially expressed were upregulated and highly accessible (Extended Data Fig. 8g,h). We discovered a known Notch transcriptional repressor, phc1, had elevated p53 binding and increased accessibility in supt16h−/− mutants (Fig. 6a,b). In addition, we observed elevated phc1 expression in supt16h mutants and morphants, paralleling the upregulation of p53 levels to suggest p53 enhances the expression of phc1 in these embryos (Fig. 6c–f and Extended Data Fig. 8i–w). To further determine transcriptional regulation of phc1 by p53, we performed a luciferase enhancer assay33 in HCT116 p53-knockout cells using a 611-base pair intronic sequence of zebrafish phc1 based on p53 ChIP binding and a deletion of the 20-base pair p53 responsive element34 (Δp53 RE) found in this sequence (Fig. 6g). We observed a notable increase in luciferase activity at the phc1 intron sequence compared with the controls and Δp53 RE mutants, whereas no change in luciferase activity was observed in the absence of p53 (Fig. 6h,i), suggesting that p53 has the ability to regulate phc1 transcription.
Fig. 6 |. p53 augments phc1 expression in supt16h mutants.
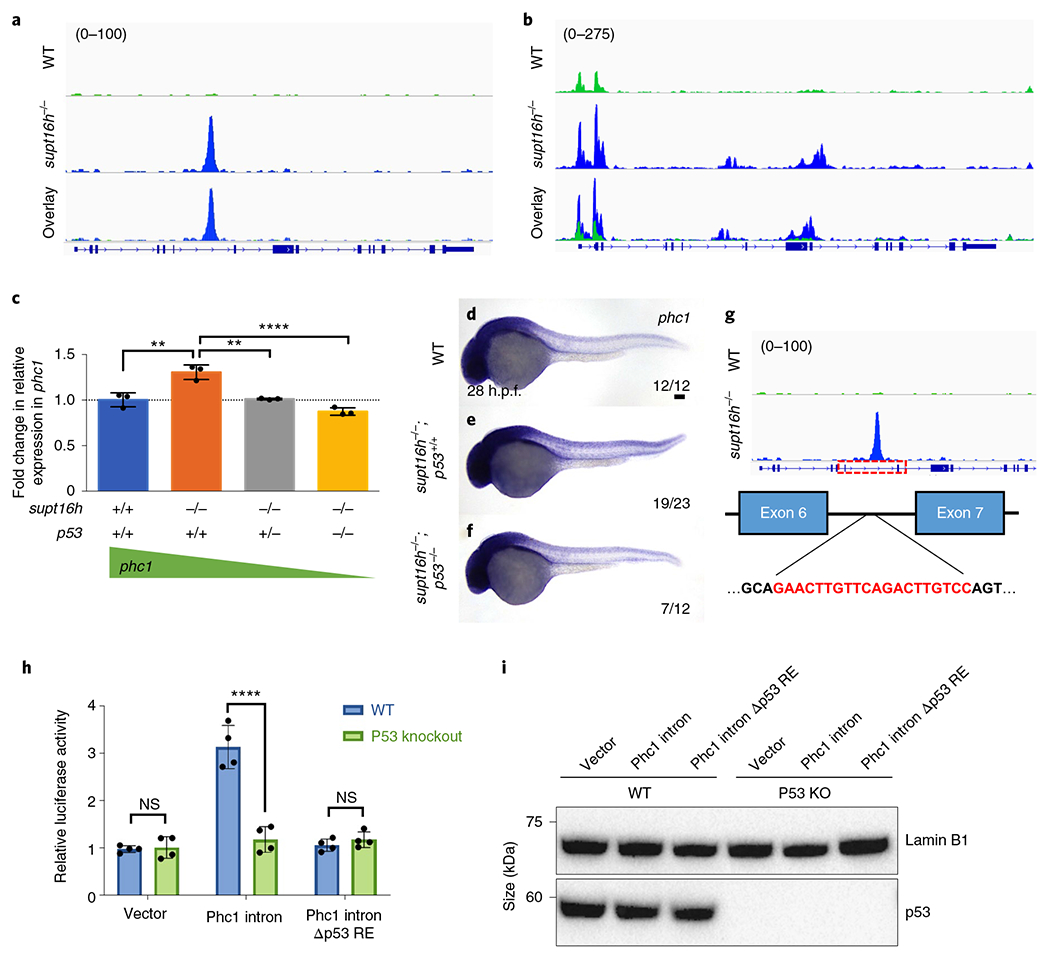
a, Image of phc1 peaks in WT (top) and supt16h−/− (middle) siblings based on p53 ChIP-seq, with the location of the introns (blue lines) and exons (blue boxes) indicated (bottom). b, ATAC-seq peaks for phc1 in WT and supt16h−/− sibling embryos. c, Expression of phc1, determined by RT-qPCR, at 32 h.p.f. in WT and supt16h−/− sibling embryos that are p53+/+, p53+/− or p53−/−. The expression values are relative to those of the WT siblings (horizontal dotted line). Data are represented as the mean ± s.d.; n = 3. One-way ANOVA with Tukey’s post-hoc test, ****P 0.0001 and **P = 0.001. d-f, WISH analysis of phc1 in WT (d), supt16h−/− ;p53+/+ (e) and supt16h−/− ;p53−/− (f) sibling embryos at 28 h.p.f. Scale bar, 100 μm. g, Predicted p53 responsive element in the phc1 allele of Danio rerio. The schematic has been overlaid with p53 ChIP-seq peaks of phc1. h, Relative luciferase activity of a HCT116 p53-knockout (Δp53 RE) cell line to assess the p53-dependent transactivation of the predicted responsive element in phc1. Data are represented as the mean ± s.d.; n = 4. Two-way ANOVA with Holm-Sidak correction for multiple comparisons; ****P < 0.00001 and NS, not significant. i, Western blot of the whole-cell lysates of Δp53 RE and WT HCT116 cell lines probed for p53. Raw unprocessed blots and quantification data are available. For a-c value in parenthesis represents track height in pixels.
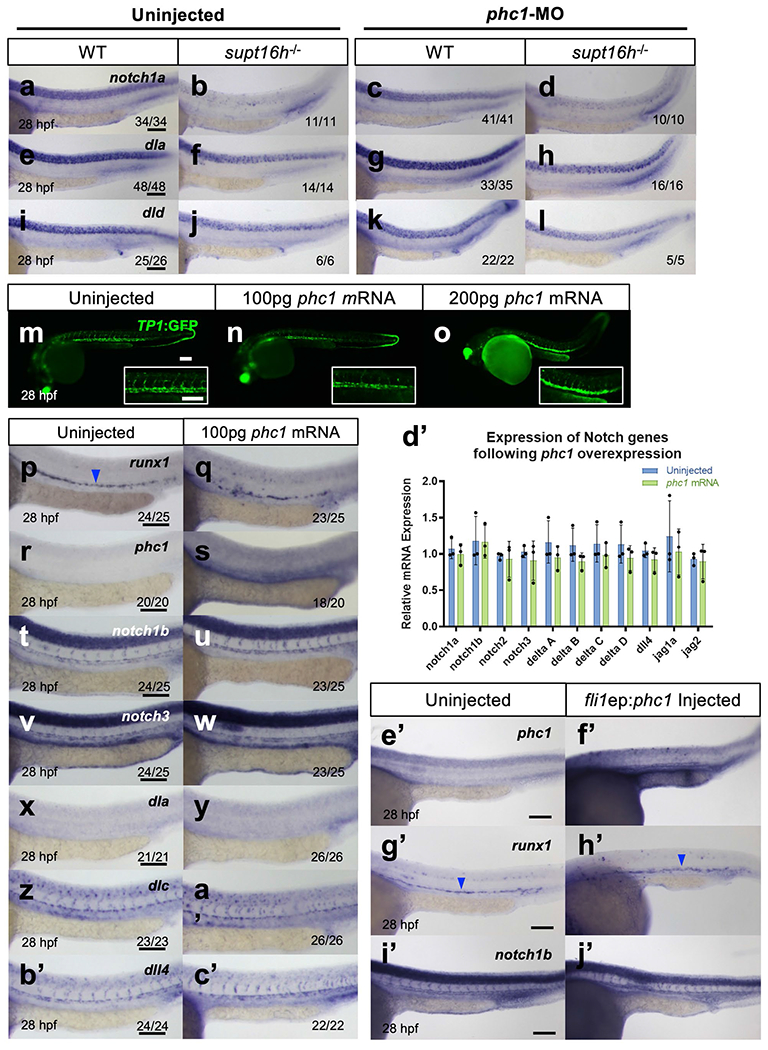
We knocked down phc1 in supt16h−/−; Tp1:GFP mutants to determine the effect of phc1 on Notch expression and HSPC formation, and observed a detectable elevation in Notch activity at 28 h.p.f. (Fig. 7a–d). We obtained similar results through WISH, where notch1b, notch3, dlc and dll4 expression along with the HSPC maker runx1 were rescued specifically within the dorsal aorta in supt16h/−/− mutants injected with phc1-MO (Fig. 7e–x). However, the rescue was not as pronounced in notch1a, dla and dld, whose expression pattern was contained mostly to neural tissues (Extended Data Fig. 9a–l). In addition, we performed complementary experiments overexpressing phc1 via injection of mRNA or plasmid containing endothelial-specific fli1a promoter driving phc1 and found no pronounced decrease in Notch transcripts or effect on HSPC formation with sole induction of phc1 expression in WT embryos (Extended Data Fig. 9m–j’). These data highlight the ability of p53 to modulate phc1 expression and suggest PHC1 influences specific Notch genes, notably those expressed along the dorsal aorta—such as notch1b, notch3, dlc and dll4—to affect HSPC formation.
Fig. 7 |. Expression of phc1 influences Notch-gene transcription and HSPC specification.
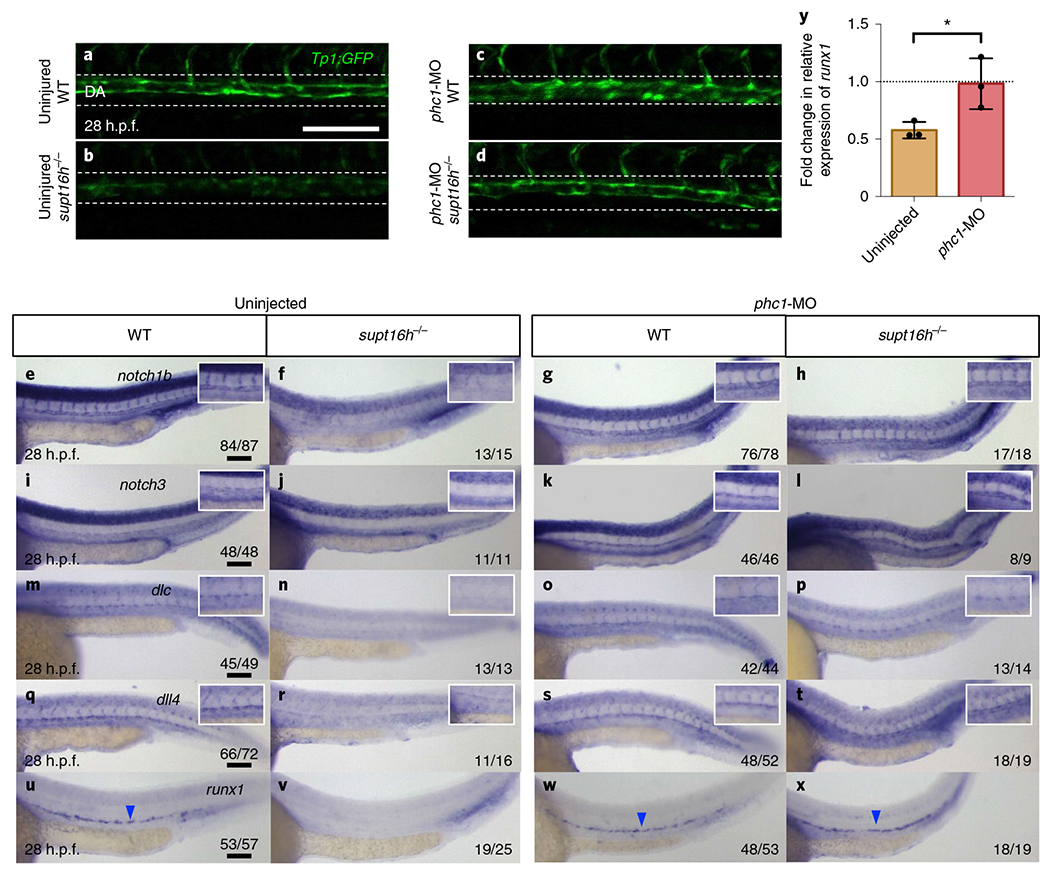
a-d, Representative confocal images, at 28 h.p.f., along the dorsal aorta (DA) of Tg(Tp1:GFP) embryos on WT (a,c) and supt16h−/− (b,d) sibling backgrounds injected with phc1-MO (c,d) as well as uninjected controls (a,b). n = 15 (WT), 5 (supt16h−/−), 16 (WT+phc1-MO) and 4 (supt16h−/− + phc1-MO). e-x, WISH of WT and supt16h−/− sibling uninjected controls (e,f,i,j,m,n,q,r,u,v) and embryos injected with phc1-MO (g,h,k,l,o,p,s,t,w,x) probed for notch1b (e-h), notch3 (i-l), dlc (m-p), dll4 (q-t) and runx1 (u-x) at 28 h.p.f. Insets: magnified views of the dorsal aorta and intersomitic vessels. The blue arrowheads indicate HSPCs. y, Expression of runx1, determined by RT-qPCR, of supt16h−/− embryos injected with phc1-MO at 28 h.p.f. Data are represented as the mean ± s.d.; n = 3. Two-tailed Student’s t-test, P = 0.0393. The expression values are relative to those of the WT siblings (horizontal dotted line). For e-x the fractions are the representative outcome for each genotyped group. Scale bars, 100 μm. Source data provided.
Discussion
We report the characterization of a supt16h vertebrate mutant, highlighting the complex mechanism by which the Notch pathway is regulated to control HSPC development. Our findings have several implications, notably: (1) a histone chaperone plays an essential role in haematopoietic development, (2) vertebrate Supt16h functions as a transcriptional regulator but not as a global chromatin remodeller, (3) Supt16h has independent roles from SSRP1 and the FACT complex, (4) p53 can mediate cell differentiation and stem-cell fate through specific gene activation, and (5) PHC1 influences the transcription of Notch genes to allow HSPC formation. Ultimately, our study has elucidated a highly precise and complex mechanism for the regulation of the expression of Notch gene components.
We suggest a model to describe this complex regulation where in a WT setting, p53 and phc1 exhibit baseline levels of accessibility and expression that result in normal transcription of Notch genes and proper HSPC specification (Extended Data Fig. 10). In the absence of supt16h, the p53 locus becomes highly accessible, resulting in elevated p53 levels. Subsequently, p53 binds to phc1 chromatin to allow for enhanced phc1 expression. PHC1, as part of the Polycomb repressive complex 1 (PRC1), then inhibits Notch signalling by acting as a transcriptional repressor or co-repressor of Notch genes. Due to the absence of Notch expression, HSPCs fail to specify.
Notch has multiple iterative roles during HSPC development3,7–9,17,21,35. Here, we propose that the levels of p53, through Supt16h-mediated accessibility, influence the transcriptional abundance of Notch genes by activating phc1 expression. PHC1 influences Notch-gene expression as part of PRC1, possibly as a co-factor with another protein based on our knockdown and overexpression studies. Research by Martinez and colleagues support the role of the Ph locus as a direct Notch transcriptional regulator with their studies in Drosophila showing that knockout of the Ph locus (ph-p and pd-d) upregulates Notch genes (notch, serrate and eyegone), whereas overexpression reduces expression36. Similar work by Boyer and colleagues demonstrate Phc1 binds to dll4 and dll1 along with 920 other genes in mouse ES cells to influence differentiation through dynamic repression37. Additional studies, both in Drosophila and human cell lines, have shown that many target genes of Polycomb-group proteins are components of the Notch signal-transduction pathway38–40.
An alternative possibility is that PHC1, as part of PRC1, regulates HSPC formation independently of Notch signalling by instead binding to core transcription factors that affect HSPC expression. Yu and colleagues demonstrated two core PRC1 components, Bmi1 and Ring1b, directly bind to the Runx1-CBFβ transcription factor complex, which is highly involved in haematopoietic development. Following knockdown of Bmi1 or Ring1b, zebrafish HSPC formation was markedly impaired, highlighting the necessary recruitment of PRC1 by Runx1-CBFβ to affect haematopoiesis. Moreover, studies of phc1-deficient mice show impaired haematopoietic activity in the fetal liver due to its role in maintaining HSPC self-renewal and proliferation capabilities41,42. Cumulatively, these data implicate a role of PRC1 regulation during HSPC formation.
The influence of Supt16h on p53 expression has been highlighted in several studies that link FACT to p53 activation in response to DNA damage43,44. On forming a complex with FACT, the protein kinase CK2 undergoes a conformational change that allows it to preferentially recognize and activate p53 (ref. 44). In addition, drug-induced ‘chromatin trapping’ of the FACT complex by curaxin in tumour lines results in p53 pathway activation, NF-κB suppression and tumour-cell death45. Further work is required to determine the mechanism by which Supt16h influences p53 expression, whether it is through transcriptional regulation, as we have suggested based on p53 chromatin accessibility, or through a direct protein interaction with FACT, based on the work of Keller and colleagues43,44.
Despite being characterized as a histone chaperone, global chromatin accessibility was not substantially affected in supt16h−/− embryos. This could be attributed to the heterogeneity of using whole embryos, which makes it difficult to accurately assess global impacts, especially when transcriptional changes may be more subtle in certain tissues. Kolundzic and colleagues have compelling studies on FACT in more homogenous systems, suggesting accessibility correlates with gene expression46. In addition, they have shown in C. elegans and human fibroblasts that FACT can both positively and negatively influence gene regulation and it does not notably alter chromatin accessibility genome wide, which provides support for our observation in zebrafish. Other studies have shown FACT increases chromatin accessibility in certain regions or only changes DNA shape in a weak and transient manner, which parallels the minor changes we observed in the chromatin accessibility and tissue-specific alteration of Notch transcription in supt16h−/− animals47. Further research on the temporal and tissue-specific function of Supt16h, using our vertebrate animal model, can expand our understanding of the highly complex and tightly regulated role of the FACT complex during gene regulation.
Online content
Any methods, additional references, Nature Research reporting summaries, source data, extended data, supplementary information, acknowledgements, peer review information; details of author contributions and competing interests; and statements of data and code availability are available at https://doi.org/10.1038/s41556-020-00604-7.
Methods
Zebrafish strains.
Zebrafish were maintained and propagated as previously described48 in accordance with the guidelines of the University of California, San Diego Institutional Animal Care and Use Committee (IACUC). Embryos and adult fish were raised in a circulating aquarium system (Aquaneering) at 28 °C. The following lines were used: WT AB*, WT WIK, Tg(cmyb:GFP)zf169 (ref. 49), Tg(kdrl:mCherry) (ref. 18), Tg(fli1:DsRed)um13 (ref. 50), Tg(CD41:GFP) (ref. 51), Tg(Tp1:GFP)um14 (ref. 52), UAS:NICD-myc Tg(5×UAE-E1b:6×MYC-notch1a)kca3 (ref. 17), TgBAC(cdh:gal4ff)mu101 (ref. 53), Tg(hsp70l:gal4)1.5kca4 (ref. 54), Tg(fli1a:GFP)Y1 (ref. 55), tp53zdf1/zdf1 (ref. 25) and ssrp1asa31984 (ref. 32). Mutant supt16h animals were generated through a forward genetic screen described in the ‘ Forward genetic screen’ section of Methods. The allele number for supt16h−/− zebrafish is SD45. Heat shock was performed at 14 h.p.f. for 45 min at 37 °C as previously described17. Details on the strains and ages are noted for each experiment. Gender was not selected in any of the studies conducted.
Forward genetic screen.
Wild-type AB* strain males were mutagenized through treatment with 3.3 mM ENU (Sigma) weekly for three weeks. The mutagenized males were crossed to WT WIK females to produce the F1 generation. These were outcrossed to WIK or AB animals and the resulting F2 siblings were subjected to random sibling incrosses. The F3 embryos were screened using WISH at 26–30 h.p.f. with the runx1 HSPC marker.
Mutant mapping and differential expression analysis by RNA-seq.
Approximately 40 supt16h−/− and 40 WT embryos were collected at 32 h.p.f. and RNA was extracted using TRIzol (Ambion). RNA libraries were generated using a TruSeq stranded mRNA kit and run on an Illumina HiSeq2500 PE50 system. The RNA-seq data underwent quality assessments using FastQC 0.11.2 and MultiQC 1.5 and were trimmed using Trimmomatic 0.32 (refs. 56,57). Reads were aligned to the zebrafish genome Zv9.69 and the assembled transcripts were inputted into the RNAmapper pipeline to map the mutants through linkage analysis of SNP haplotype blocks. Candidate mutations were identified using the Ensembl Variant Effect Predictor14. A list of candidate SNPs causal for the mutation was then generated using the RNAidentifie.R custom R script14.
Three additional biological replicates to assess differential expression were sequenced on the Illumina NovaSeq PE100 system. Quality-control checks were performed using RSeQC58 and FastQC56. The reads were aligned using the Burrows-Wheeler transform59, and aligned with TopHat60. Cufflinks was used to determine differential expression and the DEGseq R package was used to identify genes that were differentially expressed61.
WISH.
Embryos were fixed overnight in 4% paraformaldehyde (PFA) in PBS at 4 °C, washed with PBS containing 0.1% Tween-20 (PBST) and transferred stepwise into methanol in PBST (25, 50, 75 and 100%). The embryos were hydrated stepwise into PBST (25, 50, 75 and 100%) and incubated with 100% acetone at −20 °C for 10 min for embryos at 10–32 h.p.f. and 15 min for older embryos. The samples were washed with PBST, prehybridized at 65 °C for 1 h in hybridization buffer (Hyb; 50% formamide, 5×SSC, 500 μg ml−1 torula (yeast) tRNA, 50 μg ml−1 heparin, 0.1% Tween-20 and 9 mM citric acid (pH 6.5)) and hybridized overnight with digoxigenin (DIG)- or fluorescein-labelled RNA probe in Hyb. The samples were washed stepwise at 65 °C for 15 min in Hyb containing a 2×SSC mix (75, 50 and 25%), followed by two washes with 0.2×SSC for 30 min at 65 °C. Subsequent washes were performed at room temperature for 5 min with 0.2×SSC in PBST (75%, 50%, 25%). The embryos were placed in PBST containing WISH block solution (2% heat-inactivated goat serum and 2 mg ml−1 BSA) for 1 h and incubated overnight at 4 °C in anti-DIG-AP (1:5,000; Roche) diluted in WISH block solution. To visualize, the samples were washed 3× in AP (alkaline phosphatase) reaction buffer (100 mM Tris, pH 9.5, 50 mM MgCl2, 100 mM NaCl, 0.1% Tween-20 and 1 mM tetramisole hydrochloride) for 5 min and incubated in AP reaction buffer with NBT/BCIP substrate (Promega).
Antisense RNA probes for the following genes were prepared using DIG- or FITC-labelled UTP (Roche) as previously described: cdh5, cmyb, dla, dlb, dlc, dld, dll4, efnb2a, etsrp, flt4, foxc1b, gata1, jag1a, kdrl, l-plastin, lmo2, notch1a, notch1b, notch2, notch3, rag1, runx1, scl and twist1b62,63. The probes for phc1, sspr1a, ssrp1b and supt16h were generated from the full-length complementary DNA.
Immunohistochemistry.
For staining of Myc in UAS:NICD-myc after WISH, the samples were placed in block solution (150 mM maleic acid, pH 7.5, 100 mM NaCl and 2% Boehringer blocking reagent) for 1 h at room temperature and incubated with anti-c-myc antibody (1:1,000; BioLegend) in block solution overnight at 4°C. These were washed 4× with block solution at room temperature for 30 min, incubated with secondary donkey anti-mouse AlexaFlour-488 antibody (1:1,000; ThermoFisher) at 4 °C overnight and washed 4× with blocking solution at room temperature for 30 min.
Double fluorescence in situ hybridization.
Double fluorescence in situ hybridization embryos were fixed with 4% PFA, dehydrated and rehydrated as described earlier for WISH. The embryos were then washed twice with PBST for 5 min, fixed again with 4% PFA for 20 min at room temperature, digested with Proteinase K (Sigma) for 3 min at room temperature, rinsed with PBST and fixed again with 4% PFA for 20 min at room temperature. These were then washed twice with PBST, incubated in Hyb buffer at 65 °C for 1 h, and incubated with anti-DIG gfp and anti-FITC etsrp probes diluted in Hyb at 65 °C for 2 d. After incubation, the following washes were performed at 65 °C: twice with Hyb for 30 min, twice with SSC for 15 min and once with 0.2×SSC for 30 min. The embryos were incubated in block solution (150 mM maleic acid, pH 7.5, 100 mM NaCl and 2% Boehringer blocking reagent) for 1 h at room temperature. Diluted anti-flourescein-POD (1:500; Roche) in block solution was then added overnight at 4 °C. The following washes were performed at room temperature: 4× with maleic acid buffer (150 mM maleic acid, pH 7.5 and 100 mM NaCl) for 20 min and 2× with PBS for 5 min. The samples were incubated for 1 h in TSA plus flourescein solution (PerkinElmer), dehydrated stepwise into methanol in PBS (30, 50, 75 and 100%), incubated in 2% H2O2 in methanol for 30 min and rehydrated into methanol in PBS (75, 50 and 30%). The embryos were washed 2× with PBS, fixed with 4% PFA for 20 min, washed 2× with PBS, blocked for 1 h at room temperature with blocking solution and incubated with anti-DIG-POD (1:1,000; Roche) overnight at 4 °C. The following washes were then done at room temperature: 4× with maleic acid buffer for 20 min and 2× with PBS for 5 min. The samples were incubated for 1 h in TSA plus Cy5 solution (PerkinElmer), washed 3X with PBST, fixed with 4% PFA at room temperature and placed stepwise in glycerol (25 and 50%).
Western blotting.
Approximately 400 WT and 400 supt16h-mutant sibling embryos were deyolked (manual pipetting) at 32 h.p.f. in Ginzburg fish Ringer solution (55 mM NaCl, 1.8 mM KCl and 1.25 mM NaHCO3). Whole-cell lysates were prepared by lysing the cells with Buffer X (100 mM Tris-HCl, pH 8.5, 250 mM NaCl, 1 mM EDTA, 1% Nonidet P-40 and 5 mM MgCl2) with PhosSTOP phosphatase inhibitor (Roche), complete EDTA-free protease inhibitor cocktail (Roche) and 500 units of benzonase for 1 h at 4 °C. The digested lysates were sonicated at 80% amplitude for 3 min (3 s on, 3 s off) and centrifuged at 13,000g for 5 min at 4 °C. The collected supernatant was measured using a Bradford assay. Approximately 20 μg of protein was boiled for 3 min at 100 °C, loaded onto a 7.5% SDS-PAGE gel and transferred onto a nitrocellulose membrane. The membrane was blocked (5% milk) and probed with anti-Supt16h (1:500; Cell Signaling Technology), anti-P53 (1:500; GeneTex), anti-α-tubulin (1:20,000; Sigma Aldrich) or anti-Lamin B1 antibody (1:2,000; Abcam) in TBST. Amersham ECL anti-mouse IgG (horseradish peroxidase-linked; 1:5,000; GE Healthcare) and Amersham ECL anti-rabbit IgG (horseradish peroxidase-linked; 1:5,000; GE Healthcare) secondary antibody was used. Protein was detected using Supersignal west pico luminol/enhancer solution (ThermoFisher) and Supersignal west femto maximum sensitivity substrate (ThermoFisher). Images were taken on a ChemiDoc XRS+ system using Image Lab (Bio-Rad).
GO analysis.
The Gene Ontology Consortium’s GO enrichment analysis (PANTHER classification system)15,16 was used to perform GO analysis. Downregulated genes with a log2[fold change] > 1.0 based on Cufflinks were used for analysis of the RNA-seq data. Significant (adjusted P > 0.05) p53 ChIP peaks based on DESeq2 were used to analyse the ChIP-seq data.
Microscopy and image analysis.
An SP5 inverted confocal microscope (Leica Microsystems) was used to image fluorescent transgenic embryos, double fluorescence in situ hybridization and TUNEL assays. Fluorescein and GFP were excited by a 488-nm laser, DsRed and Cy3 by a 543-nm laser, Strepavidin-647 by a 633-nm laser and 4,6-diamidino-2-phenylindole (DAPI) by a 405-nm laser. Sequential images were overlaid using ImageJ (NIH) or Imaris (Bitplane). A Zeiss AxioZoom.V16 microscope was used to image the immunohistochemistry samples using the AxioVision software 4.8. Visible-light imaging for sections or WISH was performed on a BX-51 Olympus or Leica MZ16 microscope (Leica FireCam Software 3.4.1).
Microinjections of mRNA, Morpholino and plasmid.
Embryos were injected at the one-cell stage with 1 nl of antisense MOs (GeneTools) and/or mRNA. The MOs were diluted from 25 mM stocks in DEPC-treated H2O and were used at concentrations of 2.5 ng supt16h-MO24, 3.75 ng p53-MO64, 2.5 ng ssrp1a-MO31, 2.5 ng ssrp1b-MO31 and 2.5 ng phc1-MO-5′-GGCTTTCTGACCCACCTGAACAG-3′. Capped mRNAs were synthesized from linearized pCS2+ constructs using an mMessage mMachine SP6 transcription kit (Ambion). Full-length supt16h or phc1 mRNA was injected into embryos at 200 ng μl−1 and 100 ng μl−1, respectively. Transient phc1 expression was conducted using the 478 p5Efli1ep plasmid (Addgene, 31160), described here as fliep:phc1. A PM1000 cell microinjector (MicroData Instrument) was used to inject the embryos using borosilicate glass needles (Sutter Instrument) made on the PMP102 micropipette puller (MicroData Instrument).
Cell preparation and flow cytometry.
Tg(CD41:GFP; kdrl:mCherry) embryos (n = 100–200) were collected at 48 h.p.f., dissociated and digested with 1×Liberase TM (Roche) in PBS at 32 °C for 30 min. Cells were centrifuged at 300xg at 4 °C for 10 min and resuspended in PBSF (1% heat-inactivated fetal bovine serum). The cells were filtered through a 40-μm filter by centrifugation and washed with PBSF. SYTOX red (ThermoFisher) was added to exclude the non-viable cells. Sorting was performed on a FACSAria II (BD Biosciences).
Tg(fli1a:dsRed; TP1:eGFP) embryos (n = 100–200) were dissociated at 22 h.p.f., with shaking at 120 r.p.m. in dissociation buffer (0.9×PBS, Liberase TM (1:50; Roche) and 10 μM EDTA) at 37 °C for 1–2 h. Cells were pelleted at 500g for 5 min, resuspended in buffer (0.9×PBS, 1% FBS, 1 mM EDTA and 0.1 μg ml−1 DAPI) and filtered through an 80-μm filter. The cells were quantified using a BD LSR Fortessa and analysed using FlowJo. DAPI was used for dead-cell discrimination; 3–5 × 10⁶ cells were analysed per biological replicate.
RT-qPCR.
RNA was extracted from whole embryos using TRIzol (Ambion) or an RNeasy mini kit (Qiagen). Complementary DNA was synthesized using an iScript gDNA clear cDNA synthesis kit (Bio-Rad). RT-qPCR was performed on a Bio-Rad CFX96 system according to the manufacturer's instructions. Tbp expression was used to normalize the amount of the investigated transcripts using ΔΔCt. The primers are listed in Supplementary Table 2.
ATAC-seq.
Embryos were collected at 32 h.p.f. and deyolked in Ginzburg fish Ringer solution. Cells (n = 50,000) were collected, washed with PBS and pelleted at 500 × g for 5 min at 4 °C. Nuclei were extracted by adding 50 μl of cold lysis buffer (10 mM Tris-HCl, pH 7.4, 10 mM NaCl, 3 mM MgCl2 and 0.1% (vol/vol) Igepal CA-630) and centrifuging at 500 × g for 10 min at 4 °C. The pellets were resuspended in 50 μl transposition reaction (Nextera Tn5 transposase kit). The nuclei were incubated at 37 °C for 30 min and DNA was purified using an Omega MicroElute DNA cleanup kit. The DNA was PCR amplified and barcoded with NEBNext high-fidelity 2XPCR master mix using the following protocol: (1) 72 °C for 5 min, (2) 98 °C for 30 s, (3) 98 °C for 10 s, (4) 63 °C for 30 s, (5) 72 °C for 1 min, (6) five repeats of steps (3)-(5), and (6) hold at 4 °C (ref. 65). RT-qPCR was performed to determine additional cycles. Libraries were size selected using Mag-Bind RxnPure plus (Omega), with the first selection eliminating the small products (0.4:1 ratio) and the second selection (1.4:1 ratio) to select the desired products. The samples were quantified using a BioAnalyzer and KAPA library quantification kit before sequencing at PE100 on a HiSeq4000 system (Illumina).
Two technical and three biological replicates were performed for the WT and supt16h−/− embryos. OLego 1.1.5 was used for sequence alignment66 on the zebrafish genome GRCz10 and HOMER 4.9.1 was used to call and analyse the peaks67. The peaks were visualized using Integrative Genomics Viewer (IGV) 2.3.65 (ref. 68).
Genotyping.
DNA was extracted from embryos or fin clips by digesting with DNA extraction buffer (25 mM NaOH and 0.2 mM EDTA) for 1 h at 95 °C and stopped with Neutralization buffer (40 mM Tris-HCl). Genomic DNA was amplified by PCR using the primers: Supt16h-F, 5′-ATGAAGACGAGGACGAGGAA-3′ and Supt16h-R, 5′-TTATGTGGGTCGGGAACACT-3′ or Ssrp1a-F, 5′-TTGTCTGCAGCACCTTGTCA-3′ and Ssrp1a-R, 5′-TTTGGCTGCTGGGAATTTGT-3′. The amplified products were submitted for sequencing for SNP detection.
Cryosection.
Following WISH, the embryos were washed with PBST and placed overnight in 30% sucrose at 4 °C. The samples were equilibrated 1:1 with Tissue Tek O.C.T. medium (Sakura) for 30 min at room temperature, mounted on cryoblocks containing O.C.T., and frozen on dry ice. Sections (7 μM) were cut on a Leica CM1860 Cryostat.
Detection of apoptotic cell death by TUNEL labelling.
TUNEL was performed on rehydrated, fixed embryos that were permeabilized with PBSTx + dimethylsulfoxide (1×PBS, 0.5% Triton-X100 and 1% dimethylsulfoxide) for 3 h at room temperature. The samples were washed with PBSTw (1×PBS and 0.1% Tween-20), post-fixed with ethanol:acetic acid (2:1) at −20 °C for 20 min and washed with PBSTw. The embryos were blocked overnight at 4 °C with 5% BSA, washed with PBSTw, blocked with Avidin D solution (Vector Laboratories) for 30 min at room temperature, and washed with PBSTw. They were then blocked with Biotin solution (Vector Laboratories) for 30 min at room temperature, washed with PBSTw and incubated with equilibration buffer (1×TdT reaction buffer, 1×CoCl2 and 1×PBS; Roche) for 1 h at room temperature. The samples were incubated in TdT reaction mix (600 units of Terminal Transferase, Biotin-16 UTP, Equilibration Buffer; Roche) at 37 °C for 4 h and washed 6 × 15 min with PBSTw. Tg(fli1:GFP) embryos were incubated overnight with anti-GFP antibody (1:500; Aves Lab) at 4 °C. These were washed 6 X 15 min with PBSTw and incubated with anti-strepavidin-Alexa647 antibody (1:500; ThermoFisher), goat anti-chicken Alexa Flour 488 secondary antibody (1:500; ThermoFisher) and DAPI (1:1,000; Life Technologies) at room temperature for 3 h. The embryos were washed 6 × 15 min with PBSTw and mounted in Vectashield (Vector Laboratories).
Detection of apoptotic cell death by acridine orange staining.
Dechorionated embryos were incubated in 50 μg ml−1 acridine orange solution (Sigma) in E3 water for 1 h, protected from light. After three washes in 1×E3 water, the embryos were imaged by confocal microscopy.
ChIP-seq.
Approximately 2,000 WT or mutant supt16h embryos were collected for two technical replicates and deyolked in Ginzburg fish Ringer solution. The embryos were resuspended in 1 ml PBS with 1 mM PMSF, 1×cOmplete EDTA-free protease inhibitor cocktail tablet (Roche) and 1×phosSTOP phosphatase inhibitor tablet (Roche), and pushed through a 21 G needle. The embryos were crosslinked with 4 mM DSG (ProteoChem) for 30 min, followed by 1% PFA for 8 min and stopped with 0.125 M glycine. The fixed embryos were resuspended in 1 ml Lysis buffer 1 (0.05 M HEPES, 140 mM NaCl, 1 mM EDTA, 1% glycerol, 0.5% NP40 and 0.25% Triton-X100) and lysed on the TissueRuptorII (Qiagen) for 20 s, low. The tissues were rocked for 10 min at 4 °C, pelleted and resuspended in 1 ml Lysis buffer 2 (10 mM Tris, pH 8, 200 mM NaCl, 1 mM EDTA and 0.5 mM EGTA). They were rocked again for 10 min at room temperature, pelleted and resuspended in 1.5 ml Lysis buffer 3 (10 mM Tris, pH 8, 100 mM NaCl, 1 mM EDTA, 0.5 mM EGTA, 0.1% sodium deoxycholate and 0.05% SDS). The tissues were sonicated using a Diagenode Bioruptor 300 (30 s on, 30 s off; high; 34 cycles). Triton-X100 (0.8%) was added and the cells were spun down. An aliquot of the lysate (20 μl) was saved to be used as an input control and the remainder was incubated overnight with Dynabeads bound with 10 μg p53 antibody (GeneTex) at 4 °C with rotation. The beads were collected on a magnet and washed 1× with Wash buffer 1 (20 mM Tris, pH 8, 150 mM NaCl, 2 mM EDTA, 0.1% SDS and 1% Triton-X100), 1× with Wash buffer 2 (20 mM Tris, pH 8, 500 mM NaCl, 2 mM EDTA, 0.1% SDS and 1% Triton-X100), 1× with Wash buffer 3 (10 mM Tris, pH 8, 250 mM LiCl, 1 mM EDTA, 1% sodium deoxycholate and 1% NP40), 3× with TET buffer (1×TE and 0.2% Tween-20) and 1× with TE-NaCl (1×TE and 50 mM NaCl). The beads were resuspended in 500 μl Elution buffer (50 mM NaHCO3 and 1% SDS) and incubated overnight with 0.2 M NaCl at 65 °C. The lysate was incubated for 2 h at 37 °C with 5 μl RNase A (10 mg ml−1) and 2 h at 55 °C with 5 μl proteinase K (20 mg mlμ1). DNA was purified using phenol-chloroform-isoamyl alcohol and resuspended in 50 μl TE (10 mM Tris, pH 8 and 1 mM EDTA). A TruSeq ChIP library preparation kit (Illumina) was used to construct SR75 libraries run on an Illumina HiSeq4000.
ChIP-seq data underwent quality assessments using FastQC 0.11.2 and MultiQC 1.5, and subsequent trimming of Illumina adaptors using Trimmomatic. STAR was used for sequence alignment using GRCz10 (ref. 69) and HOMER was used to call and analyse the peaks67. Differential gene expression was analysed using DESeq2 1.18.1. The peaks were visualized using Integrative Genomics Viewer (IGV) 2.3.65 (ref. 68).
p53 Transactivation luciferase assay.
HCT116 (ATCC CCL-247) cells knocked out for p53 were maintained at 37 °C in McCoy’s 5a medium modified with 10% heat-inactivated FBS. The Danio rerio phc1 intron was cloned into pGL4.23 (5′-GAGACGGATCCATAACCATACATCAGTGGAAAGC-3′ and 5′-GTCTCGTCGACTGCTAGGAATGCACCGATAA-3′) and the 20-bp responsive element was deleted by Gibson assembly (5′-GCGTCGCACTTGCGTGGGCAAGTGCACTATAATGGAGCTTTC-3′ and 5′-AAGCTCCATTATAGTGCACTTGCCCACGCAAGTGCGACGC-3′). The HCT116 cells were transiently transfected with pGL4.23 constructs by X-tremeGENE HP DNA transfection reagent (Roche). The cells were harvested after 48 h and the luciferase activity was measured using a Dual-luciferase reporter assay system (Promega) and SYNERGY Neo2 multi-mode reader (BioTek).
Statistics and reproducibility.
In all figures: NS, not significant (P > 0.05); *P < 0.05; **P < 0.01; ***P < 0.001 and ****P < 0.0001. Data were analysed using Prism 6 and 7 (GraphPad). A two-tailed Student’s t-test was conducted to compare two sample groups. To test for significance in larger groups, one-way or two-way ANOVAs, corrected for multiple comparisons using Tukey’s or Sidak’s statistical hypothesis testing, respectively, were used. In addition, comparisons for multiple t-tests were corrected for using the Holm-Sidak method. All tests used a confidence interval of 0.05. P values less than 0.05 were considered significant. Sample sizes were chosen based on the number of independent experiments required for statistical significance and technical feasibility. The statistical methods used for comparisons are indicated in the relevant figure legends.
Reporting Summary.
Further information on research design is available in the Nature Research Reporting Summary linked to this article.
Data availability
Raw and processed RNA-seq (linkage mapping), RNA-seq (differential expression), ATAC-seq and ChIP-seq data have been deposited into the public functional genomics data repository Gene Expression Omnibus. The accession numbers for these data are GSE106342, GSE127555, GSE106341and GSE116088for RNA-seq (linkage mapping), RNA-seq (differential expression), ATAC-seq and ChIP-seq, respectively. All other data supporting the findings of this study are available from the corresponding author on reasonable request. Source data are provided with this paper.
Extended Data
Extended Data Fig. 1 |. Characterizing the causal mutation from our forward genetic screen.
a, Diagram of the forward genetic screen strategy. b,c, Mapping of RNA-seq using RNAmapper with whole genome view (b) and specifically looking at the linked interval on Chr 7 (c). d, Position and RNA-seq coverage of SNP on supt16h resulting in a premature stop codon. e,f, Expression of supt16h−/− based on RNA-seq (e) (Represented as mean ± s.d., two-tailed Student’s t-test, n = 3, P = 0.0005) and RT-qPCR (f) (Represented as mean ± s.d., two-tailed Student’s t-test, n = 3, P = 0.0024) for cmyb. For RT-qPCR, expressions are relative to WT sibling. g-j, WISH of WT embryos injected with supt16h-MO for runx1 (blue arrowheads) at 28 hpf and cmyb at 36 hpf. k,l, Representative confocal of Tg(cmyb:GFP;kdrl:mCherry) embryos injected with supt16h-MO from one independent experiment. Double positive HSPCs indicated by white arrowheads at 48 hpf. DA = dorsal aorta; V = vein. m, Quantification of double positive HSPCs from (g and h) (Represented as mean ± s.e.m., two-tailed t-test, n = 10, P < 0.0001). Bar, 100 μm. Source data provided in Supplementary Table 5.
Extended Data Fig. 2 |. The expression pattern of supt16h and the effect of its knockout on HSPC relevant tissues.
a-c, WISH of embryos from a supt16h+/− incross (IX) for supt16h expression at 0, 2.5, and 6 hpf. d,e, WISH of WT embryos for supt16h expression at 24 and 32 hpf. Insets zoom magnify the DA (red arrowheads). f-k, WISH of WT sibling and supt16h−/− embryos for supt16h expression at 12, 24, and 32 hpf. f-p, WISH of supt16h+/− incross (IX) using probes for posterior lateral mesoderm (PLM) makers scl, and lmo2 (f,g), somitic marker desma (h), sclerotome marker foxc1b and twist1b (i,j), endothelial markers cdh5 and kdrl (k,l), arterial marker efnb2a (m), venous marker flt4 (n), primitive erythroid marker gata1 (o), and primitive leukocyte marker l-plastin (p). q,r, Representative confocal of supt16h−/− and WT sibling embryos on Tg(fli1:GFP) background examining vasculature development. Based on one independent experiment. s,t, Magnified images of (q,r) highlight vein (V) and dorsal aorta (DA) formation. Bar, 100 μm.
Extended Data Fig. 3 |. Characterizing the effect of supt16h on Notch gene expression.
a,b, Gene Ontology Analysis of Biological Components (a) and Molecular Components (b) shows downregulated genes in supt16h−/− embryos based on a log2fold change >1. c, Volcano plot of the differentially expressed genes between WT sibling and supt16h−/− embryos based on RNA-seq. Data representative of 3 (a-c) biological replicates. d-g, WISH of supt16h−/− and WT sibling embryos using probes for notch3 and dla. h,i Representative confocal images along the DA of supt16h−/− and WT sibling embryos on Tg(Tp1:GFP) background at 22 hpf. Bar, 50 μm. j, Mean fluorescence level from (h,i) of Tp1:GFP along the DA calculated in ImageJ (Represented as mean ± s.e.m., two-tailed Student’s t-test, nWT= 15,nMUT=8,P = 0.0373). k, Sorted double positive Tp1:GFP+;fli1:DsRed+ cells from supt16h morphants and uninjected controls at 22 hpf by flow cytometry (Represented as mean ± s.d, two-tailed Studentťs t-test, n = 3,P = 0.0192). l, Gating strategy used to quantify TP1 (Notch- FITC) + endothelial (PE-Cy5) cells. m,n, DFISH of Notch-active (green) and etsrp (red) tissues in supt16h−/− and WT sibling embryos on a Tg(Tp1:GFP) background at 14 hpf. Based on one independent experiment. o-v, Global expression of NICD+ and NICD− embryos that are WT siblings or supt16h−/− (supt16h+/−;hsp70:gal4 x supt16+/−;UAS-myc:NICD) analysed at 28 hpf by NICD immunohistochemistry (IHC) (l-o) and runx1 WISH (p-s). Representative images from two independent experiments. Bar, 100 μm. Blue arrowheads indicate HSPCs. Bar, 100 μm. Source data provided in Supplementary Table 5.
Extended Data Fig. 4 |. The effect of supt16h on transcript elongation and chromatin accessibility.
a, RT-qPCR of 5′ vs 3′ initiation/elongation of Notch genes in WT sibling and supt16h−/− embryos at 32 hpf. Expressions relative to WT sibling (horizontal dotted line) (Represented as mean ± s.d, two-tailed Student’s t-test with Holm-Sidak correction for multiple comparisons, n = 3, ***P < 0.001, **P < 0.01, *P <0.05 lined significance compares WT 5′ to MUT 3′, significance over MUT 5′ compares MUT 5′ to MUT 3′). b, ATAC-seq results plotting the total number of accessible peaks in WT and supt16h−/− embryos at 32 hpf (Represented as mean ± s.d, two-tailed t-test, n = 6, N.S. = not significant). c, ATAC-seq results plotting the number of accessible TSS peaks in WT sibling and supt16h−/− embryos (Represented as mean ± s.d, two-tailed Student’s t-test, n = 6, N.S. = not significant). d, p-values of the differential accessibility of Notch genes based on ATAC-seq log2fold change of supt16h−/− vs WT sibling. e,f, ATAC-seq peak plot of chromatin accessibility in supt16h−/− and WT sibling embryos for notch1a and notch1b. Bottom panel shows peak overlay. g, Plot of ATAC-seq log2fold change by increasing accessibility vs. corresponding RNA-seq log2fold change values. h, Rank order of top 10 differentially accessible genes based on ATAC-seq of supt16h−/− and WT sibling embryos at 32 hpf. i,j, WISH of p53 in WT sibling and supt16h−/− embryos at 36 hpf. k-r, WISH of p53 in embryos injected with supt16h-MO at 14, 18, 28, and 36 hpf. s-v, WISH of runx1 (blue arrowheads) for WT sibling and pS3y- injected with supt16h-MO. Data representative of 2 (i-r) and 3 (a,h) biological replicates. Bar, 100 μm. Source data provided in Supplementary Table 5.
Extended Data Fig. 5 |. Characterizing P53-mediated apoptosis in supt16h−/− embryos.
a,b, Representative confocal of WT sibling and supt16h−/−;Tg(fli1.GFP) and stained with Acridine Orange (AO) at 28 hpf. (arrowheads = TUNEL+;fli1+ cells). c, Quantification of double positive TUNEL+;fli1+ cells for (a,b) (nWT = 15, nMUT= 10, N.S. = not significant). d-g, TUNEL of WT sibling and supt16h−/− crossed onto Tg(fli1.GFP) at 14 and 18 hpf (arrowheads = TUNEL+;fli1+ cells). Confocal images of TUNEL, fli1 and double-positive TUNEL+fli1+ (yellow; indicated by white arrowheads; left), and TUNEL-only cells are shown (right). h,i, Quantification of double positive TUNEL+;fli1+ cells for 14 (h) (nWT = 12, nMUT= 8, N.S. = not significant) and 18 hpf (i) (nWT = 12, nMUT = 8, N.S. = not significant). j-o, TUNEL of WT sibling and supt16h−/− at 14 hpf, 18 hpf, and 28 hpf. Confocal images of TUNEL and DAPI (left) and TUNEL-only cells are shown (right). p-r, Quantification of apoptotic cells based on TUNEL at 14 hpf (nWT = 12, nMUT = 8, N.S. = not significant), 18 hpf (nWT = 15, nMUT = 8, **P = 0.0023), and 28 hpf (nWT = 25, nMUT = 7, ****P < 0.0001). s-v, Brightfield images of WT sibling or supt16h−/− in the context of p53 WT (+/+); HET(+/−); MUT(−/−) embryos at 48, 55, and 70 hpf. w, Kaplan-Meier survival curve for (s-v). x-c′, WISH of p53, runx1, and cmyb for WT embryos treated with 5 gy of ionizing radiation at 6 hpf. d′,e′, AO staining at 24 hpf following treatment of WT embryos with 5 gy of ionizing radiation at 6 hpf. Representative images based on one independent experiment. Dot plot graphs (c, h, i, p, q, r) represented as mean ± s.d., two-tailed Student’s t-test. Bar, 100 μm. Source data provided in Supplementary Table 5.
Extended Data Fig. 6 |. Characterizing the effect of p53 on Notch gene expression and HSPC formation.
a-h, WISH of WT sibling (a,e) and supt16h−/− embryos that are p53+/+ (b,f), p53+/− (c,g), or p53−/− (d,h) for notch1b (a-d) and runx1 (e-h) at 28 hpf. i-l, WISH for runx1 of embryos injected with p53-MO, notch1b-MO, or both MOs at 28 hpf. m-t, WISH of runx1 (m-p) and cmyb (q-t) for WT sibling or mib −/− embryos injected with p53-MO. Blue arrowheads indicate HSPCs. Bar, 100 μm.
Extended Data Fig. 7 |. Characterizing the expression profile and effect of ssrp1aon HSPCs.
a-f, WISH of embryos injected with ssrp1a-MO and probed with efnb2a (a,b), gata1 (c,d), and cdh5 (e,f) at 26 hpf. No effect is seen on dorsal aorta, red blood cell, or vasculature formation upon ssrp1a knockdown. g-o, WISH of supt16h, ssrp1a, and ssrp1b for WT embryos at 14–16 hpf with a dorsal view (g-i), and 24 hpf (j-l) and 32 hpf with a posterior lateral view (m-o). p-w, TUNEL of uninjected (p-s) and ssrp1a-MO (t-w) embryos at 32 hpf. Confocal images of TUNEL and DAPI (left) and TUNEL only (right) are shown. x, Quantification of the number of apoptotic cells in ssrp1a morphants from (p-w) based on TUNEL for the trunk region (Represented as mean ± s.d., one-way ANOVA with post-hoc Tukey, n = 10, P < 0.0001, N.S. = not significant). y, Mean fluorescence level of Tp1:GFP of the DA calculated in ImageJ based on Integrated Density (Represented as mean ± s.d., two-tailed t-test, nWT = 11, nMO = 15, *P = 0.0147, N.S. = not significant). z,a’, WISH of notch1b in WT sibling and ssrp1a−/− embryos at 28 hpf. Data representative of 2 (g-o) biological replicates. Bar, 100 μm. Source data provided in Supplementary Table 5.
Extended Data Fig. 8 |. Characterizing the role of P53 on modulating Notch expression.
a,b, Gene Ontology analysis of the significant p53-ChIP-peaks for the Biological Processes and Pathways affected. c, Plot of p53-ChIP-seq peaks for a known p53-target gene, p21. d, Graph of P-values representing the log2 fold change of the differential binding of p53 to Notch genes between WT sibling and supt16h−/− embryos. No significant effect is observed in biding to Notch genes. e,f, p53-ChIP-seq plots for notch1a and notch1b, graphing WT sibling and supt16h−/− peaks. g, Venn diagram depicting the number of accessible (green) and inaccessible (orange) p53-bound genes based on p53-ChIP-seq and ATAC-seq of WT sibling and supt16h−/− embryos at 32 hpf. Genes possessing significant p53-bound peaks (n = 2 for ChIP-seq, n = 6 for ATAC-seq, two-tailed Student’s t-test, adjusted P > 0.05) were assessed for their accessibility based on ATAC-seq (two-tailed t-test, adjusted P > 0.05), where genes had at least >1 Log2 fold change between WT and supt16h−/− samples. h, The number of upregulated (green) and downregulated (orange) p53-bound genes based on p53-ChIP-seq and RNA-seq of WT sibling and supt16h−/− embryos at 32 hpf. Genes possessing significant p53-bound peaks (n = 2 for ChIP-seq, n = 3 for RNA-seq, two-tailed Student’s t-test, adjusted P > 0.05), where genes had at least >1 Log2 fold change between WT and supt16h−/− samples, were assessed for their expression based on RNA-seq (two-tailed t-test, adjusted P > 0.05). p53 binding stimulates increased gene expression. i, Expression of phc1 in supt16h mutants and WT siblings based on RNA-seq (Represented as mean ± s.d, two-tailed Student’s t-test, n= 3, P= 0.0009). j-q, WISH of phc1 expression in WT sibling and supt16h−/− embryos at 14 (j,k), 18 (l,m), 28 (n,o), and 36 hpf (p,q). r-w, WISH of phc1 expression in uninjected and supt16h-MO injected embryos at 14 (r,s), 18 (t,u), and 28 (v,w). Bar, 200 μm. Source data provided in Supplementary Table 5.
Extended Data Fig. 9 |. Characterizing the effect of phc1 overexpression on Notch signalling.
a-l, WISH of WT sibling and supt16h−/− embryos injected with phc1-MO probed for notch1a, dla, and dlc at 28 hpf. m-o, Representative confocal images of wild-type embryos on a Tg(Tp1:GFP) background injected with 100 and 200 pg of phc1 mRNA at 28 hpf. Insets are magnified images of the DA and intersomitic vessels. Representative images from one independent experiment. p-c′, WISH of wild-type embryos injected with 100 pg of phc1 mRNA probed for at 28 hp for runx1 (p-q), phc1 (r-s), notch1b (t-u), notch3 (v-w), dla (x-y), dlc (z-a′), and dll4 (b-c′). d′, RT-qPCR of Notch genes in WT sibling and embryos injected with 100 pg (r) of phc1 mRNA collected at 28 hpf. No significant changes observed between samples. (Represented as mean ± s.d., two-tailed Student’s t-test with Holm-Sidak correction for multiple comparisons, n = 3). e′-j′, WISH at 28 hpf for phc1 (e′-f′), runx1 (g′-h′), and notch1b (i′-j′) of wild-type embryos injected with fli1ep:phc1 plasmid for transient expression of phc1 in the vasculature. Blue arrowheads indicate HSPCs. Bar, 100 μm.
Extended Data Fig. 10 |. Model of how Supt16h and P53 regulate HSPC specification through notch transcription.
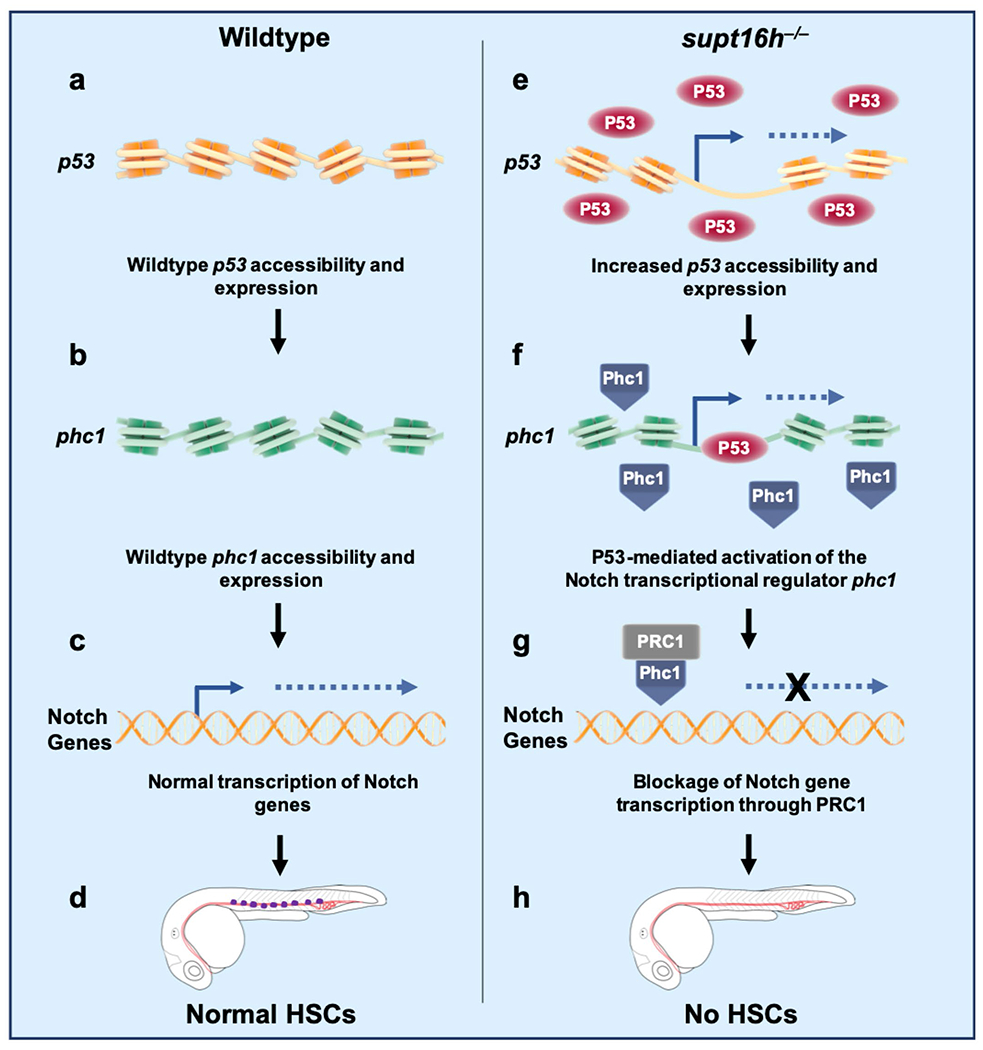
a,b, In a wild-type settng, p53 (a) and phc1 (b) maintain baseline levels of accessibility and transcriptional expression. c,d, This results in normal transcription of Notch genes (c) and allows for proper specification of HSPCs (d). e, In supt16h mutants, the p53 gene locus is highly accessible, resulting in increased p53 mRNA and protein levels. f, p53 then binds to phc1, a repressor of Notch gene expression, to allow for its enhanced expression. g, PHC1, as part of PRC1, inhibits Notch signalling by acting as direct or indirect a transcriptional repressor of Notch genes. h, In the absence of Notch expression, HSPCs fail to specify.
Supplementary Material
Acknowledgements
This work was supported by the National Science Foundation Graduate Research Fellowship Program (grant no. DGE-1650112), UCSD Genetics Training Grant (grant no. T32GM008666-17), National Institutes of Health (grant no. R01-DK074482) and Institute for Basic Science (grant no. IBS-R022-D1). RNA-seq, ATAC-seq and ChIP-seq were conducted at the IGM Genomics Center, University of California, San Diego (MCC grant no. P30CA023100). We thank K. Ong, Y. G. Han, J. Park and S.-W. Jin for their technical assistance, J. Posakony for scientific guidance and the members of the D.T. laboratory for providing helpful comments.
Footnotes
Competing interests
All authors declare no competing interests.
Extended data is available for this paper at https://doi.org/10.1038/s41556-020-00604-7.
Supplementary information is available for this paper at https://doi.org/10.1038/s41556-020-00604-7.
References
- 1.Ciau-Uitz A, Monteiro R, Kirmizitas A & Patient R Developmental hematopoiesis: ontogeny, genetic programming and conservation. Exp. Hematol 42, 669–683 (2014). [DOI] [PubMed] [Google Scholar]
- 2.Bertrand JY et al. Haematopoietic stem cells derive directly from aortic endothelium during development. Nature 464, 108–111 (2010). [DOI] [PMC free article] [PubMed] [Google Scholar]
- 3.Espín-Palazón R et al. Proinflammatory signaling regulates hematopoietic stem cell emergence. Cell 159, 1070–1085 (2014). [DOI] [PMC free article] [PubMed] [Google Scholar]
- 4.Hondele M et al. Structural basis of histone H2A-H2B recognition by the essential chaperone FACT. Nature 499, 111–114 (2013). [DOI] [PubMed] [Google Scholar]
- 5.Saunders A et al. Tracking FACT and the RNA polymerase II elongation complex through chromatin in vivo. Science 301, 1094–1096 (2003). [DOI] [PubMed] [Google Scholar]
- 6.Hsieh F-K et al. Histone chaperone FACT action during transcription through chromatin by RNA polymerase II. Proc. Natl Acad. Sci. USA 110, 7654–7659 (2013). [DOI] [PMC free article] [PubMed] [Google Scholar]
- 7.Kumano K et al. Notch1 but not Notch2 is essential for generating hematopoietic stem cells from endothelial cells. Immunity 18, 699–711 (2003). [DOI] [PubMed] [Google Scholar]
- 8.Kim AD et al. Discrete Notch signaling requirements in the specification of hematopoietic stem cells. EMBO J. 33, 2363–2373 (2014). [DOI] [PMC free article] [PubMed] [Google Scholar]
- 9.Clements WK et al. A somitic Wnt16/Notch pathway specifies haematopoietic stem cells. Nature 474, 220–224 (2011). [DOI] [PMC free article] [PubMed] [Google Scholar]
- 10.Robert-Moreno À et al. Impaired embryonic haematopoiesis yet normal arterial development in the absence of the Notch ligand Jagged1. EMBO J. 27, 1886–1895 (2008). [DOI] [PMC free article] [PubMed] [Google Scholar]
- 11.Vousden KH & Lane DP p53 in health and disease. Nat. Rev. Mol. Cell Biol 8, 275–283 (2007). [DOI] [PubMed] [Google Scholar]
- 12.Levine AJ & Berger SL The interplay between epigenetic changes and the p53 protein in stem cells. Genes Dev. 31, 1195–1201 (2017). [DOI] [PMC free article] [PubMed] [Google Scholar]
- 13.Beckerman R & Prives C Transcriptional regulation by p53. Cold Spring Harb. Perspect. Biol 2, a000935 (2010). [DOI] [PMC free article] [PubMed] [Google Scholar]
- 14.Miller AC, Obholzer ND, Shah AN, Megason SG & Moens CB RNA-seq-based mapping and candidate identification of mutations from forward genetic screens. Genome Res. 23, 679–686 (2013). [DOI] [PMC free article] [PubMed] [Google Scholar]
- 15.Ashburner M et al. Gene Ontology: tool for the unification of biology. Nat. Genet 25, 25–29 (2000). [DOI] [PMC free article] [PubMed] [Google Scholar]
- 16.Thomas PD Expansion of the gene ontology knowledgebase and resources: the Gene Ontology consortium. Nucleic Acids Res. 45, D331–D338 (2017). [DOI] [PMC free article] [PubMed] [Google Scholar]
- 17.Burns CE, Traver D, Mayhall E, Shepard JL & Zon LI Hematopoietic stem cell fate is established by the Notch–Runx pathway. Genes Dev. 19, 2331–2342 (2005). [DOI] [PMC free article] [PubMed] [Google Scholar]
- 18.Grainger S et al. Wnt9a is required for the aortic amplification of nascent hematopoietic stem cells. Cell Rep. 17, 1595–1606 (2016). [DOI] [PMC free article] [PubMed] [Google Scholar]
- 19.Sturgeon CM, Ditadi A, Awong G, Kennedy M & Keller G Wnt signaling controls the specification of definitive and primitive hematopoiesis from human pluripotent stem cells. Nat. Biotechnol 32, 554–561 (2014). [DOI] [PMC free article] [PubMed] [Google Scholar]
- 20.Ruiz-Herguido C et al. Hematopoietic stem cell development requires transient Wnt/β-catenin activity. J. Exp. Med 209, 1457–1468 (2012). [DOI] [PMC free article] [PubMed] [Google Scholar]
- 21.Kobayashi I et al. Jam1a–Jam2a interactions regulate haematopoietic stem cell fate through Notch signalling. Nature 512, 319–323 (2014). [DOI] [PMC free article] [PubMed] [Google Scholar]
- 22.Hadland BK et al. A requirement for Notch1 distinguishes 2 phases of definitive hematopoiesis during development. Blood 10.1182/blood-2004-03-1224 (2004). [DOI] [PMC free article] [PubMed] [Google Scholar]
- 23.Andersson ER, Sandberg R & Lendahl U Notch signaling: simplicity in design, versatility in function. Development 138, 3593–3612 (2011). [DOI] [PubMed] [Google Scholar]
- 24.Bai X et al. TIF1γ controls erythroid cell fate by regulating transcription elongation. Cell 142, 133–143 (2010). [DOI] [PMC free article] [PubMed] [Google Scholar]
- 25.Berghmans S et al. tp53 Mutant zebrafish develop malignant peripheral nerve sheath tumors. Proc. Natl. Acad. Sci. USA 10.1073/pnas.0406252102 (2005). [DOI] [PMC free article] [PubMed] [Google Scholar]
- 26.Ljungman M, Zhang F, Chen F, Rainbow AJ & McKay BC Inhibition of RNA polymerase II as a trigger for the p53 response. Oncogene 18, 583–592 (1999). [DOI] [PubMed] [Google Scholar]
- 27.Lindahl T & Wood RD Quality control by DNA repair. Science 286, 1897–1905 (1999). [DOI] [PubMed] [Google Scholar]
- 28.Itoh M et al. Mind bomb is a ubiquitin ligase that is essential for efficient activation of Notch signaling by Delta. Dev. Cell 4, 67–82 (2003). [DOI] [PubMed] [Google Scholar]
- 29.Orphanides G, LeRoy G, Chang CH, Luse DS & Reinberg D FACT, a factor that facilitates transcript elongation through nucleosomes. Cell 92, 105–116 (1998). [DOI] [PubMed] [Google Scholar]
- 30.Koltowska K et al. Ssrp1a controls organogenesis by promoting cell cycle progression and RNA synthesis. Development 140, 1912–1918 (2013). [DOI] [PMC free article] [PubMed] [Google Scholar]
- 31.Huang H-T et al. A network of epigenetic regulators guides developmental haematopoiesis in vivo. Nat. Cell Biol 15, 1516–1525 (2013). [DOI] [PMC free article] [PubMed] [Google Scholar]
- 32.Busch-Nentwich E et al. Sanger Institute Zebrafish Mutation Project mutant data submission. https://zfin.org/ZDB-ALT-160601-1382 (2013). [Google Scholar]
- 33.Smeenk L et al. Characterization of genome-wide p53-binding sites upon stress response. Nucleic Acids Res. 10.1093/nar/gkn232 (2008). [DOI] [PMC free article] [PubMed] [Google Scholar]
- 34.El-Deiry WS, Kern SE, Pietenpol JA, Kinzler KW & Vogelstein B Definition of a consensus binding site for p53. Nat. Genet 10.1038/ng0492-45 (1992). [DOI] [PubMed] [Google Scholar]
- 35.Le Bouteiller M et al. Notchless-dependent ribosome synthesis is required for the maintenance of adult hematopoietic stem cells. J. Exp. Med 210, 2351–2369 (2013). [DOI] [PMC free article] [PubMed] [Google Scholar]
- 36.Martinez A-M et al. Polyhomeotic has a tumor suppressor activity mediated by repression of Notch signaling. Nat. Genet 41, 1076–1082 (2009). [DOI] [PubMed] [Google Scholar]
- 37.Boyer LA et al. Polycomb complexes repress developmental regulators in murine embryonic stem cells. Nature 441, 349–353 (2006). [DOI] [PubMed] [Google Scholar]
- 38.Bracken AP, Dietrich N, Pasini D, Hansen KH & Helin K Genome-wide mapping of Polycomb target genes unravels their roles in cell fate transitions. Genes Dev. 20, 1123–1136 (2006). [DOI] [PMC free article] [PubMed] [Google Scholar]
- 39.Lee TI et al. Control of developmental regulators by Polycomb in human embryonic stem cells. Cell 125, 301–313 (2006). [DOI] [PMC free article] [PubMed] [Google Scholar]
- 40.Tolhuis B et al. Genome-wide profiling of PRC1 and PRC2 Polycomb chromatin binding in Drosophila melanogaster. Nat. Genet 10.1038/ng1792 (2006). [DOI] [PubMed] [Google Scholar]
- 41.Ohta H et al. Polycomb group gene rae28 is required for sustaining activity of hematopoietic stem cells. J. Exp. Med 195, 759–770 (2002). [DOI] [PMC free article] [PubMed] [Google Scholar]
- 42.Ji YK et al. Defective long-term repopulating ability in hematopoietic stem cells lacking the Polycomb-group gene rae28. Eur. J. Haematol 73, 75–84 (2004). [DOI] [PubMed] [Google Scholar]
- 43.Keller DM et al. A DNA damage-induced p53 serine 392 kinase complex contains CK2, hSpt16, and SSRP1. Mol. Cell 7, 283–292 (2001). [DOI] [PubMed] [Google Scholar]
- 44.Keller DM & Lu H p53 serine 392 phosphorylation increases after UV through induction of the assembly of the CK2·hSPT16·SSRP1 complex. J. Biol. Chem 277, 50206–50213 (2002). [DOI] [PubMed] [Google Scholar]
- 45.Gasparian AV et al. Curaxins: anticancer compounds that simultaneously suppress NF-κB and activate p53 by targeting FACT. Sci. Transl. Med 3, 95ra74 (2011). [DOI] [PMC free article] [PubMed] [Google Scholar]
- 46.Kolundzic E et al. FACT sets a barrier for cell fate reprogramming in Caenorhabditis elegans and human cells. Dev. Cell 10.1016/j.devcel.2018.07.006 (2018). [DOI] [PMC free article] [PubMed] [Google Scholar]
- 47.Rhoades AR & Ruone FT Structural features of nucleosomes reorganized by yeast FACT and its HMG box component, Nhp6. Mol. Cell. Biol 24, 3907–3917 (2004). [DOI] [PMC free article] [PubMed] [Google Scholar]
- 48.Westerfield M The Zebrafish Book. A Guide for the Laboratory Use of Zebrafish (Danio rerio) 5th edn (Univ. Oregon Press, 2007). [Google Scholar]
- 49.North TE et al. Prostaglandin E2 regulates vertebrate haematopoietic stem cell homeostasis. Nature 447, 1007–1011 (2007). [DOI] [PMC free article] [PubMed] [Google Scholar]
- 50.Villefranc JA, Amigo J & Lawson ND Gateway compatible vectors for analysis of gene function in the zebrafish. Dev. Dyn 10.1002/dvdy.21354 (2007). [DOI] [PMC free article] [PubMed] [Google Scholar]
- 51.Lin HF et al. Analysis of thrombocyte development in CD41–GFP transgenic zebrafish. Blood 106, 3803–3810 (2005). [DOI] [PMC free article] [PubMed] [Google Scholar]
- 52.Parsons MJ et al. Notch-responsive cells initiate the secondary transition in larval zebrafish pancreas. Mech. Dev 126, 898–912 (2009). [DOI] [PMC free article] [PubMed] [Google Scholar]
- 53.Bussmann J, Wolfe SA & Siekmann AF Arterial-venous network formation during brain vascularization involves hemodynamic regulation of chemokine signaling. Development 138, 1717–1726 (2011). [DOI] [PMC free article] [PubMed] [Google Scholar]
- 54.Scheer N & Campos-Ortega JA Use of the Gal4-UAS technique for targeted gene expression in the zebrafish. Mech. Dev 80, 153–158 (1999). [DOI] [PubMed] [Google Scholar]
- 55.Lawson ND & Weinstein BM In vivo imaging of embryonic vascular development using transgenic zebrafish. Dev. Biol 248, 307–318 (2002). [DOI] [PubMed] [Google Scholar]
- 56.Andrews S FastQC: a quality control tool for high throughput sequence data. https://www.bioinformatics.babraham.ac.uk/projects/fastqc/ (2010).
- 57.Bolger AM, Lohse M & Usadel B Trimmomatic: a flexible trimmer for Illumina sequence data. Bioinformatics 30, 2114–2120 (2014). [DOI] [PMC free article] [PubMed] [Google Scholar]
- 58.Wang L, Wang S & Li W RSeQC: quality control of RNA-seq experiments. Bioinformatics 10.1093/bioinformatics/bts356 (2012). [DOI] [PubMed] [Google Scholar]
- 59.Li H & Durbin R Fast and accurate long-read alignment with Burrows–Wheeler transform. Bioinformatics 10.1093/bioinformatics/btp698 (2010). [DOI] [PMC free article] [PubMed] [Google Scholar]
- 60.Trapnell C et al. Differential gene and transcript expression analysis of RNA-seq experiments with TopHat and Cufflinks. Nat. Protoc 7, 562–578 (2012). [DOI] [PMC free article] [PubMed] [Google Scholar]
- 61.Wang L, Feng Z, Wang X, Wang X & Zhang X DEGseq: an R package for identifying differentially expressed genes from RNA-seq data. Bioinformatics 10.1093/bioinformatics/btp612 (2010). [DOI] [PubMed] [Google Scholar]
- 62.Lee Y et al. FGF signalling specifies haematopoietic stem cells through its regulation of somitic Notch signalling. Nat. Commun 5, 5583 (2014). [DOI] [PMC free article] [PubMed] [Google Scholar]
- 63.Kim AD et al. Discrete Notch signaling requirements in the specification of hematopoietic stem cells. EMBO J. 10.15252/embj.201488784 (2014). [DOI] [PMC free article] [PubMed] [Google Scholar]
- 64.Robu ME et al. p53 Activation by knockdown technologies. PLoS Genet. 3, 787–801 (2007). [DOI] [PMC free article] [PubMed] [Google Scholar]
- 65.Buenrostro JD, Wu B, Chang HY & Greenleaf WJ ATAC-seq: a method for assaying chromatin accessibility genome-wide. Curr. Protoc. Mol. Biol 2015, 21.29.1–21.29.9 (2015). [DOI] [PMC free article] [PubMed] [Google Scholar]
- 66.Wu J, Anczukow O, Krainer AR, Zhang MQ & Zhang C OLego: fast and sensitive mapping of spliced mRNA-seq reads using small seeds. Nucleic Acids Res. 41, 5149–5163 (2013). [DOI] [PMC free article] [PubMed] [Google Scholar]
- 67.Heinz S et al. Simple combinations of lineage-determining transcription factors prime cis-regulatory elements required for macrophage and B cell identities. Mol. Cell 38, 576–589 (2010). [DOI] [PMC free article] [PubMed] [Google Scholar]
- 68.Thorvaldsdóttir H, Robinson JT & Mesirov JP Integrative Genomics Viewer (IGV): high-performance genomics data visualization and exploration. Brief. Bioinform 14, 178–192 (2013). [DOI] [PMC free article] [PubMed] [Google Scholar]
- 69.Dobin A et al. STAR: ultrafast universal RNA-seq aligner. Bioinformatics 29, 15–21 (2013). [DOI] [PMC free article] [PubMed] [Google Scholar]
Associated Data
This section collects any data citations, data availability statements, or supplementary materials included in this article.
Supplementary Materials
Data Availability Statement
Raw and processed RNA-seq (linkage mapping), RNA-seq (differential expression), ATAC-seq and ChIP-seq data have been deposited into the public functional genomics data repository Gene Expression Omnibus. The accession numbers for these data are GSE106342, GSE127555, GSE106341and GSE116088for RNA-seq (linkage mapping), RNA-seq (differential expression), ATAC-seq and ChIP-seq, respectively. All other data supporting the findings of this study are available from the corresponding author on reasonable request. Source data are provided with this paper.