

Viruses are obligate parasites that depend on the host cell to provide the energy and molecular building blocks to mass produce infectious viral progeny. The processes that govern viral modulation of cellular resources have emerged as critical for successful infection.
KEYWORDS: AMPK, CaMKK, cytomegalovirus
ABSTRACT
Human cytomegalovirus (HCMV) infection modulates cellular metabolism to support viral replication. Calcium/calmodulin-dependent kinase kinase (CaMKK) and AMP-activated protein kinase (AMPK) regulate metabolic activation and have been found to be important for successful HCMV infection. Here, we explored the contributions that specific CaMKK isoforms and AMPK subunit isoforms make toward HCMV infection. Our results indicate that various CaMKK and AMPK isoforms contribute to infection in unique ways. For example, CaMKK1 is important for HCMV infection at a low multiplicity of infection but is dispensable for AMPK activation at the earliest times of infection, which our data suggest is more reliant on CaMKK2. Our results also indicate that HCMV specifically induces the expression of the nonubiquitous AMPKa2 catalytic subunit, found to be important for both HCMV-mediated glycolytic activation and high-titer infection. Furthermore, we find that AMPK-mediated glycolytic activation is important for infection, as overexpression of GLUT4, the high-capacity glucose transporter, partially rescues viral replication in the face of AMPK inhibition. Collectively, our data indicate that HCMV infection selectively induces the expression of specific metabolic regulatory kinases, relying on their activity to support glycolytic activation and productive infection.
IMPORTANCE Viruses are obligate parasites that depend on the host cell to provide the energy and molecular building blocks to mass produce infectious viral progeny. The processes that govern viral modulation of cellular resources have emerged as critical for successful infection. Here, we find that human cytomegalovirus (HCMV) depends on two kinase isoforms to support infection, calcium/calmodulin-dependent kinase kinase 1 (CaMKK1) and the AMP-activated protein kinase a2 (AMPKa2) subunit. We find that HCMV specifically induces expression of the AMPKa2 subunit to induce metabolic activation and drive robust viral replication. These results suggest that HCMV has evolved mechanisms to target specific metabolic regulatory kinase subunits to support productive infection, thereby providing insight into how HCMV hijacks cellular metabolism for its replication and shedding light on potential viral therapeutic vulnerabilities.
INTRODUCTION
Viral infection is known to broadly change the host-cell metabolic network in order to promote an environment conducive to viral replication (1–6). Given its significance to infection, viral remodeling of cellular metabolism is an important host-pathogen interaction. Although many metabolic processes are modulated to promote a proviral environment, many of the mechanisms involved remain unclear. Elucidation of the mechanisms of viral metabolic modulation and how they contribute to infection could spur the development of novel antiviral therapeutic strategies.
Human cytomegalovirus (HCMV) is a betaherpesvirus that is ubiquitous among the world’s human population. HCMV morbidity is low in individuals with healthy immune function, but it causes severe disease in immunocompromised individuals, including AIDS patients (7), cancer patients undergoing immunosuppressive therapies (8–10), and transplant recipients (11–14). Additionally, HCMV is a major cause of birth defects due to congenital infection (15).
HCMV has been found to broadly change the host metabolic network (1, 16–21). These HCMV-induced metabolic changes include activation of glycolysis (1, 2, 16, 17, 20, 22), fatty acid biosynthesis (1, 19), pyrimidine biosynthesis (2, 18), and amino acid metabolism (20, 23). It is known that HCMV infection induces the expression of many proglycolytic enzymes (4), but many questions remain about the specific mechanisms responsible for promoting glycolytic activation and their contributions to the establishment of a proviral environment.
In particular, HCMV infection induces the expression of two important kinases, calcium/calmodulin-dependent kinase kinase (CaMKK) (17) and AMP-activated protein kinase (AMPK) (16). AMPK is classically regulated by reduced levels of ATP during times of cellular stress, where increased concentrations of AMP promote its binding to the gamma subunit, causing a conformational change and allowing for full activation of AMPK via phosphorylation of threonine-172 by liver kinase B1 (LKB1) (24). Increased AMPK activity signals the cell to conserve cellular components by halting energy-consuming pathways such as fatty acid biosynthesis via inhibition of a rate-determining step catalyzed by acetyl coenzyme A (acetyl-CoA) carboxylase (ACC) and by inducing energy-producing pathways such as glycolysis through increased glucose consumption, e.g., via GLUT4 translocation to the cellular membrane (25, 26).
AMPK can also be stimulated independently of AMP/ATP levels through calcium signaling via phosphorylation by CaMKK (27). CaMKK is an upstream calcium-calmodulin cascade kinase, which phosphorylates AMPK at threonine-172, resulting in the activation of AMPK kinase activity and subsequent upregulation of glycolysis (27). Both CaMKK and AMPK have been shown to be important for productive viral infection and successful release of infectious viral progeny (16, 17). Additionally, both CaMKK and AMPK exist as multiple isoforms, expressed from separate genes whose contributions to viral infection are not clear. We therefore set out to study the role that the specific isoforms play in HCMV-mediated glycolytic activation and viral production.
We find that the two isoforms of CaMKK contribute differentially to HCMV infection. Our results indicate that CaMKK2 supports HCMV-mediated AMPK activation at the earliest times of infection, whereas CaMKK1 contributes more to successful virion production at a low multiplicity of infection (MOI). Furthermore, our results indicate that HCMV relies preferentially on the AMPKa2 catalytic subunit, whose expression is substantially induced during HCMV infection and whose CRISPR-mediated inactivation significantly attenuates infection. Finally, we find that AMPK-mediated glycolytic activation is an important functional contribution to infection, as our data show that expression of GLUT4, the high-capacity glucose transporter, can substantially increase viral replication in the face of AMPK inhibition. Our results suggest that HCMV targets specific host kinase subunits to drive metabolic remodeling to support productive infection.
RESULTS
CaMKK2 activity is important for early activation of AMPK during HCMV infection.
Pharmaceutical inhibition of CaMKK by STO-609 inhibits HCMV-induced glycolytic activation and viral production by stalling the early-to-late viral gene transition (17) (Fig. 1A). As STO-609 targets both CaMKK1 and CaMKK2 isoforms (28), we set out to dissect the roles of each of these isoforms in AMPK activation and viral replication. We targeted the CaMKK kinases in BJhT fibroblasts using a lentivirus-delivered CRISPR-Cas9 system, consisting of an expression plasmid encoding Cas9 and a guide sequence designed to target the first exon of the CaMKK1 gene, CAMKK1, or the CaMKK2 gene, CAMKK2. We confirmed CaMKK1 knockout via Western blotting (Fig. 1B), but various anti-CaMKK2 antibodies proved to be nonspecific and did not reliably confirm gene knockout of the CaMKK2 isoform. Therefore, we employed genomic sequencing to confirm the inactivation of each targeted gene (Fig. 1C). In the CaMKK1 knockout cell line, there was a 5-bp deletion and 4-bp insertion, resulting in a premature stop codon in one allele, while the other had a 146-bp deletion including the start codon (Fig. 1C). The CaMKK2 knockout cell line had a 2-bp deletion in one allele and a 737-bp deletion in the other, both resulting in premature stop codons (Fig. 1C).
FIG 1.

CaMKK2 activity is important for early activation of AMPK during HCMV infection. (A) CaMKK induces AMPK activity, leading to successful infection and HCMV-mediated glycolytic activation. The entire process can be halted with the addition of CaMKK inhibitor, STO-609. (B and C) Clonal CaMKK1 and CaMKK2 knockout (KO) cell lines were generated in fibroblast cells via CRISPR genomic editing. (B) Western blot showing CaMKK1 protein expression in parental (par), nontargeting control (NT), CaMKK1 KO, and CaMKK2 KO cells that were mock (M) or HCMV (H) infected. (C) Insertions and deletions introduced are indicated. Nomenclature follows (60). Cells were M or H infected (MOI = 3.0) at 24 (D), 48 (E), and 72 (F) h postinfection (hpi). Expression of P-ACC (Ser79), total ACC, P-AMPKa1/a2 (Thr172), and total AMPKa1/a2 was assessed by Western blotting. GAPDH was used as a loading control. Densitometry analysis was used to quantify the average ratios from independent blots (n = 3 for 24- and 72-hpi blots, n = 2 for 48-hpi blot), which were combined to determine the P-AMPK-to-total AMPK and P-ACC-to-total ACC values shown in panels D to F. BJhT parental cells were used for the generation of all cells used for panels B to F.
Since expression of CaMKK is induced by HCMV infection (17), we next assessed CaMKK isoform activity toward phosphorylation of AMPK and the subsequent phosphorylation of the downstream AMPK target, ACC. HCMV induces the AMPK-dependent phosphorylation of ACC at serine-79 and increases the total amount of ACC (16, 19). Relative ratios of phospho-AMPK to total AMPK (AMPK ratio) and phospho-ACC to total ACC (ACC ratio) were estimated by densitometry analysis (Fig. 1D to F). At 24 h postinfection (hpi), the observed AMPK ratio was reduced by 50% (±0.18% standard error of the mean [SEM]) in HCMV-infected CaMKK2 knockout cells relative to that in infected nontargeting (NT) control cells. In addition, the total amount of AMPK was reduced in the HCMV-infected CaMKK2 knockout cells (Fig. 1D). Combined, these decreases in AMPK and phospho-AMPK corresponded to a 40% (±0.45% SEM) reduction in the observed ACC ratio (Fig. 1D), consistent with substantially reduced HCMV-mediated AMPK activation at this time point.
At 48 hpi, HCMV-induced AMPK phosphorylation in the knockout cells began to approach and even exceed the phosphorylation in the HCMV-infected control cells (Fig. 1E), suggesting that at this time point, inactivation of either CaMKK isoform in isolation did not impact HCMV-mediated induction of AMPK phosphorylation. Consistent with this, ACC phosphorylation was not affected by the loss of either CaMKK isoform (Fig. 1E). It is worth noting that the AMPK ratio was lower in the nontargeting control cells than in the parental control cells. As would be expected, this corresponded to a decreased ACC ratio when comparing the nontargeting versus parental controls (Fig. 1E). This difference could reflect nonspecific effects of CRISPR-mediated targeting, e.g., those associated with lentiviral transduction, Cas9 expression, or puromycin selection.
At 72 hpi, the phosphorylated AMPK ratios in infected knockout cells began to approach levels similar to those of nontargeting control cells, and the ACC ratio began to fall back down but remained higher than the AMPK ratios (Fig. 1F). These data suggest that AMPK expression, phosphorylation, and activity toward the downstream phosphotarget, ACC, are dependent on the activity of CaMKK2 early during infection, i.e., at 24 hpi. However, as infection progresses, AMPK activity toward ACC relies less on CaMKK2 activity.
CaMKK1 is important for HCMV infection at a low MOI.
To assess the roles that CaMKK1 and CaMKK2 play during infection, control and knockout cells were infected at a high MOI of 3.0 for 120 h, at which time cells were harvested for analysis of virion production (Fig. 2A). Upon infection at a high MOI, we found no significant decrease in the viral titer with the loss of either CaMKK1 or CaMKK2 (Fig. 2A). We next tested whether the loss of CaMKK1 or CaMKK2 impacted HCMV infection at a lower MOI of 0.01 (Fig. 2B). After 120 hpi, we observed a significant drop in the titer of virus generated in the CaMKK1 knockout cells compared to that in the nontargeting control cells (Fig. 2B). There was no significant difference between the nontargeting control and the CaMKK2 knockout samples (Fig. 2B). It is worth noting that there was a significant difference in viral titers produced in the parental and nontargeting control cells (Fig. 2B), again suggesting the possibility of nonspecific effects associated with transduction, Cas9 expression, or puromycin selection. Regardless, the viral titer produced in the CaMKK1 knockout cells was significantly less than that in the nontargeting control, while the resulting viral titer from the CaMKK2 knockout cells was not. To further investigate viral defects associated with CaMKK loss, cells were infected at a low MOI of 0.01 for 5, 10, 15, 20, and 25 days (Fig. 2C). Consistent with data presented in Fig. 2B, we found that infection of CaMKK1 knockout cells produced fewer infectious particles than infection of CaMKK2 knockout cells and NT control cells at 20 dpi (Fig. 2C), the time point of peak viral titer for these cell lines (Fig. 2C). While the low MOI replication defect associated with the CaMKK1 cells was consistent between the experiments shown in Fig. 2B and C, the timing of the defect observed differed, i.e., there was a defect at day 5 for experiments shown in Fig. 2B, but no apparent defect until day 20 in those shown in Fig. 2C. Different viral stocks were used for these two experiments, and we speculate the actual titer of the stock used in Fig. 2B was higher than initially calculated, resulting in a higher-than-estimated MOI for Fig. 2B than for Fig. 2C. Consistent with this possibility, the viral titers at 5 days postinfection were higher than would be expected for an infection at an MOI of 0.01. Regardless of the discrepancy in timing, the data consistently support the conclusion that CaMKK1, but not CaMKK2, is important for low MOI infection.
FIG 2.
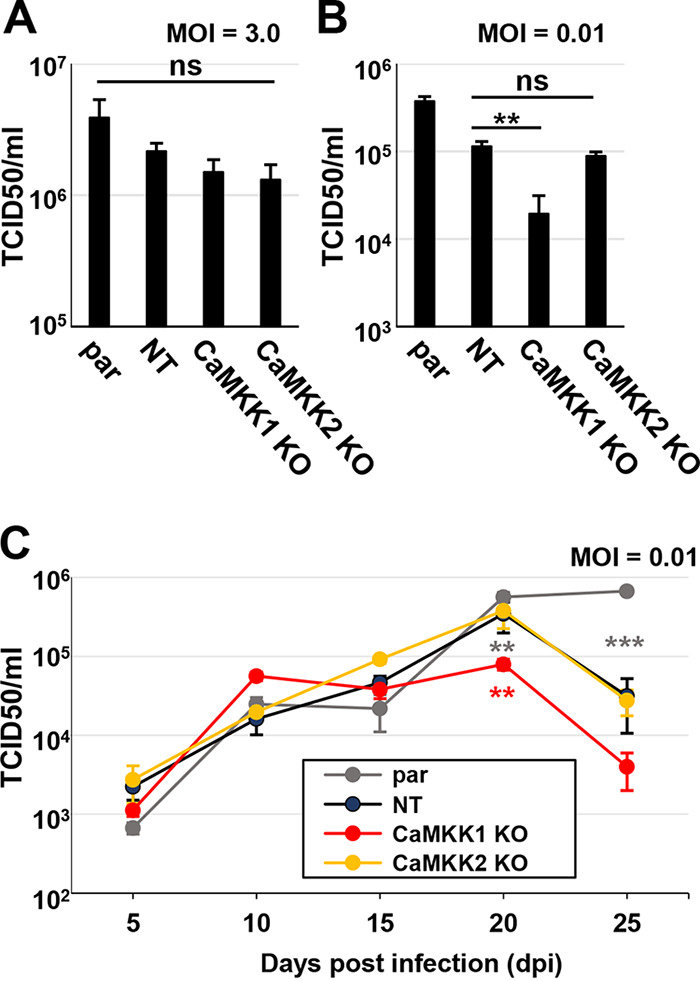
CaMKK1 is important for HCMV infection at a low MOI. (A to C) Parental (par), nontargeting control (NT), CaMKK1 knockout (KO), and CaMKK2 KO cells were infected, and viral titer was assessed by TCID50 at indicated times postinfection. Cells were infected at an MOI of 3.0 (A) or an MOI of 0.01 (B), and virus was harvested at 5 days postinfection (dpi). (C) Cells were infected at an MOI of 0.01, and virus was harvested at 5, 10, 15, 20, and 25 dpi. Multiple statistical comparisons were made by one-way ANOVA followed by Student’s t tests in panels A to C. **, P < 0.01; ***, P < 0.001; ns, not significant. All comparisons are made to nontargeting control (average [avg] ± standard error of the mean [SEM], n = 3). BJhT parental cells were used for the generation of KO cells.
HCMV infection induces AMPKa2 catalytic subunit expression.
Since AMPK is a downstream effector of CaMKK, we next focused on the role of the AMPK catalytic subunit isoforms during HCMV infection. AMPK exists in a closed heterotrimeric complex at basal levels in the cell, and upon decreases in the ATP energy charge, AMPK is phosphorylated and activated (25, 26). There are multiple isoforms of the AMPK alpha catalytic subunits, AMPKa1 and AMPKa2, and regulatory beta and gamma subunits, AMPKb1, AMPKb2, AMPKg1, AMPKg2, and AMPKg3, resulting in the possibility of 12 different AMPK complexes, consisting of one alpha, one beta and, one gamma subunit at any given time per complex (25, 26). Differential expression of AMPK subunit isoforms can affect AMPK function in various cell types (29–32). For example, the AMPK regulatory subunits AMPKg1, AMPKg2, and AMPKg3 have been shown to differentially regulate the rate of AMPK activity in cells (29, 32). Additionally, the AMPK catalytic subunits, AMPKa1 and AMPKa2, exhibit tissue specificity in certain contexts, where the AMPKa1 subunit is generally expressed ubiquitously and the AMPKa2 subunit is expressed mainly in skeletal and cardiac muscles as well as the kidneys in humans (30, 31, 33, 34).
Tissue-specific AMPK expression has been linked to context-specific function. For example, AMPKa2 promotes osteogenesis at a higher rate than AMPKa1 in skeletal tissue (30). Therefore, we hypothesized that the AMPK subunit isoforms may play differential roles during HCMV infection. To examine this hypothesis, we first assessed how HCMV infection impacts AMPK subunit isoform expression in MRC5hT fibroblasts. We observed a 4-fold induction of the AMPKa2, AMPKg2, and AMPKg3 subunits, although the HCMV-mediated induction of the AMPKg3 subunit did not meet the threshold for statistical significance (Fig. 3A). Additionally, over 120 h, protein levels of the AMPKa2 and AMPKb1 subunits were selectively induced by HCMV infection (Fig. 3B). Based on these data, we conclude that HCMV infection can differentially affect AMPK subunit expression at both the RNA and protein levels, with notable increases in AMPKa2 at both the RNA and protein levels.
FIG 3.
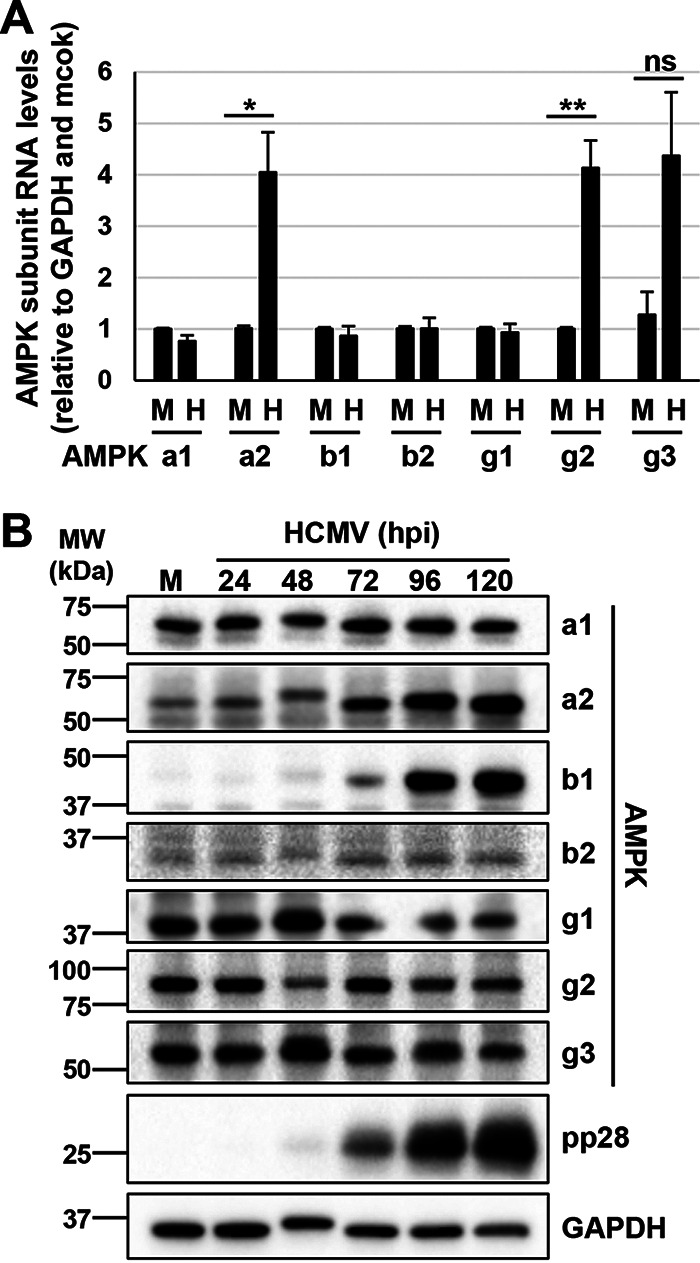
HCMV infection induces expression of the AMPKa2 catalytic subunit. (A and B) MRC5hT cells were mock (M) or HCMV (H) infected (MOI = 3.0) for indicated hours postinfection (hpi). (A) At 48 hpi, RNA was harvested for qPCR analysis for the AMPK subunit isoforms. Signals were normalized to GAPDH and to the mock-infected sample (avg ± SEM, n ≥ 3). Statistical comparisons were made using a Student’s t test. *, P < 0.05; **, P < 0.01; ns, not significant. (B) AMPK subunit isoform protein expression in M- or H-infected parental cells at 24, 48, 72, 96, and 120 hpi, representative of two separate infections.
Since the catalytic subunit drives cellular AMPK activity, we set out to further explore the role of the AMPKa2 subunit during HCMV infection of fibroblasts. Using the same lentiviral delivery system described to knockout the CaMKK isoforms, we targeted the first exon of either the AMPKa1 gene, PRKAA1, or the AMPKa2 gene, PRKAA2 (Fig. 4) in MRC5hT fibroblasts. One AMPKa1 polyclonal knockout cell line (AMPKa1-1) and three AMPKa2 polyclonal knockout cell lines (AMPKa2-1, AMPKa2-2, and AMPKa2-3) were generated, and total AMPKa1/a2 levels in uninfected cells were assessed by Western blotting (Fig. 4A). Compared to the parental cell line, the AMPKa1-1 and AMPKa2-3 polyclonal cell lines had the greatest knockout efficiencies as indicated by lower levels of AMPKa1/a2 in these samples (Fig. 4A). Given the greater reduction in AMPK levels, we monoclonally selected these lines. One AMPKa1 clonal cell line was generated, which had a 17-bp deletion within the guide sequence of one allele and a 2-bp insertion in the other allele at position 82, both of which resulted in the introduction of premature stop codons (Fig. 4B). Two AMPKa2 clonal cell lines were successfully generated, one of which had a single base pair insertion at position 62 in both alleles, resulting in a premature stop codon, and the other cell line had a 77-bp deletion, which included the start codons of both alleles (Fig. 4B). The knockout of AMPKa1 and AMPKa2 was confirmed by Western blotting (Fig. 4C and D). Notably, we observed that the overall phosphorylation of AMPKa1/a2 was less in the AMPKa2-3 polyclonal cells than in the AMPKa1-1 polyclonal cells, although phosphorylation levels in both were reduced relative to that in the parental controls (Fig. 4A). These results suggest that AMPKa2 is the predominately phosphorylated isoform in uninfected cells.
FIG 4.
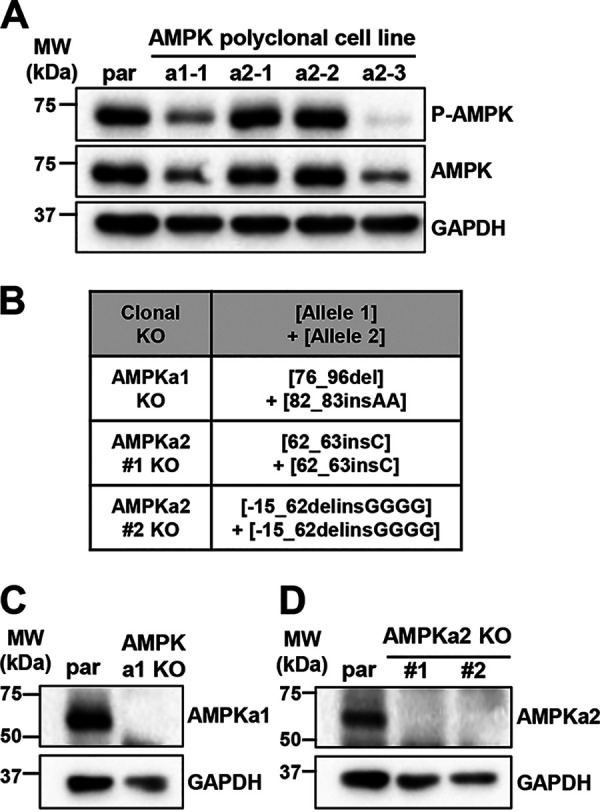
Knockout of AMPK catalytic subunits via CRISPR engineering. (A) Polyclonal AMPKa1 knockout (KO) and AMPKa2 KO MRC5hT fibroblast cell lines were generated. Expression of total AMPKa1/a2 and P-AMPKa1/a2 (Thr172) was assessed by Western blotting and compared to parental (par) cell line expression. (B to D) Clonal AMPKa1 KO and AMPKa2 KO cell lines were generated from AMPKa1-1 and AMPKa2-3 polyclonal cell lines shown in panel A. (B) Clonal AMPKa1 KO and AMPKa2 KO cell lines were generated in fibroblast cells via CRISPR genomic editing followed by monoclonal selection. Insertions and deletions introduced are indicated. Nomenclature follows (60). Expression in KO cells was compared to that in par using antibodies specific to AMPKa1 (C) or AMPKa2 (D). GAPDH was used as a loading control.
AMPKa2 is important for HCMV infection.
We next explored how the AMPKa subunits contribute to HCMV infection. Control, clonal AMPKa1 knockout, or the clonal AMPKa2 knockout cells were infected with HCMV for 72 h, and then the catalytic subunit protein expression levels and total AMPK phosphorylation were assessed (Fig. 5). As previously described (16), we observed an increase in the overall phosphorylation of total AMPK upon HCMV infection in the control cells (Fig. 5A and B). HCMV-mediated AMPK phosphorylation was substantially elevated in the AMPKa1 knockout cells relative to that in control cells, suggesting that AMPKa2 is rapidly phosphorylated in the absence of AMPKa1 (Fig. 5A). HCMV infection did not impact the levels of AMPKa1 in the nontargeting control cells, which is consistent with our data in Fig. 3B. Notably, upon the loss of AMPKa1, we observed increased levels of AMPKa2 during infection and an increase in the overall phospho-AMPK (P-AMPK) ratio, consistent with a potential compensatory induction of AMPKa2 in the absence of AMPKa1 (Fig. 5A). We also analyzed the phosphorylation status of ACC, a well-described target of AMPK kinase activity. As previously published (19), we observed an increase in total ACC expression as well as an induction of its phosphorylation upon HCMV infection in control cells (Fig. 5A). In the AMPKa1 knockout cells, the phosphorylation of ACC remained similar to that in controls (Fig. 5A). In contrast to AMPKa1, AMPKa2 knockout cells did not exhibit a compensatory increase in AMPKa1 levels in either the mock- or HCMV-infected samples (Fig. 5B). In further contrast to the AMPKa1 knockout (KO) cells, the AMPKa2 KO cells exhibited AMPK phosphorylation that was substantially reduced during mock or HCMV infection (Fig. 5B). Infection still induced phosphorylation of ACC in AMPKa2 KO clone number (no.) 2, whereas the levels of ACC phosphorylation were reduced in AMPKa2 clone no. 1 (Fig. 5B). While the reasons for this difference are unclear, they likely reflect clonal differences, e.g., potential differences in AMPKa1 compensation.
FIG 5.

AMPK subunit expression and activity in CRISPR knockout cell lines. (A to D) Cells were mock (M) or HCMV (H) infected (MOI = 3.0, n = 1), and 72 h postinfection (hpi), P-AMPKa1/a2 (Thr172), AMPKa1, AMPKa2, P-ACC (Ser79), and total ACC levels were assessed in the AMPKa1 knockout (KO) (A) and AMPKa2 KO (B) clonal cell lines compared to that in the nontargeting control (NT) cell line via immunoblotting. NS, nonspecific band. Densitometry analysis was used to quantify the ratios of P-AMPK to total AMPK and P-ACC to total ACC in panels A and B. Total AMPKa was calculated by the addition of AMPKa1 and AMPKa2 intensities prior to calculating the ratio. NT cells and AMPKa2 clone no. 1 KO (C), AMPKa2 clone no. 2 KO (D), or AMPKa1 KO (E) cells were infected over the course of 96 h, and AMPKa1/a2 phosphorylation was accessed by Western blotting. Expression of pp28 indicates successful infection; GAPDH was used as a loading control. MRC5hT parental cells were used for the generation of KO cells.
The data generated as described above were harvested at a single time point (72 hpi), and so we next wanted to broaden the scope of analysis by determining AMPK phosphorylation over a time course of infection. AMPK phosphorylation was persistently reduced in the HCMV-infected AMPKa2 knockout cells (at or below nontargeting control levels) until 96 hpi, when the phosphorylation of the remaining AMPKa1 dramatically increased to levels similar to that in the controls (Fig. 5C and D). The phosphorylation of AMPKa2 in the AMPKa1 KO cells gradually increased to similar levels in the nontargeting control, reaching peak phosphorylation sooner, at 72 hpi (Fig. 5E). These data suggest that at early times of infection, AMPKa2 is active, whereas at times approaching the end of infection, AMPKa1 is also substantially activated.
To further explore how the AMPKa1 and AMPKa2 subunits contribute to HCMV infection, we analyzed viral replication in the KO cells relative to that in parental and nontargeting control cells (Fig. 6). As a positive control, the parental and nontargeting control cells were treated with an AMPK inhibitor, compound C (CC) (Fig. 6), which inhibits viral production as previously reported (16). There was no significant decrease in viral titer with the loss of AMPKa1, but we observed a >10-fold loss of viral titer when AMPKa2 was knocked out relative to that in the nontargeting controls (Fig. 6). The magnitude of this decrease was less than that observed with compound C treatment (Fig. 6). Possibilities for this discrepancy include potential anti-HCMV off-target effects associated with compound C treatment or potential compensation for loss of the AMPKa2 subunit by the remaining AMPKa1 subunit, which we found to be active at late times during infection (Fig. 5C and D). Additionally, discrepancies between AMPKa1 activity toward ACC shown in Fig. 5B and viral titers produced in the AMPKa2 KO cells shown in Fig. 6 highlight that AMPKa2’s contribution to HCMV infection is not related to AMPK-mediated ACC phosphorylation. This result was predicted, as AMPK’s phosphorylation of ACC inhibits ACC’s activity, and productive HCMV infection depends on ACC-mediated fatty acid biosynthesis and maintains activated ACC activity despite AMPK’s inhibitory phosphorylation (19). These results also highlight that while AMPK and ACC phosphorylation are useful tools as proxies for AMPK activity, they are inadequate to fully capture the diversity of AMPK activity. Regardless, collectively, our data indicate that expression of AMPKa2 is important for HCMV infection.
FIG 6.
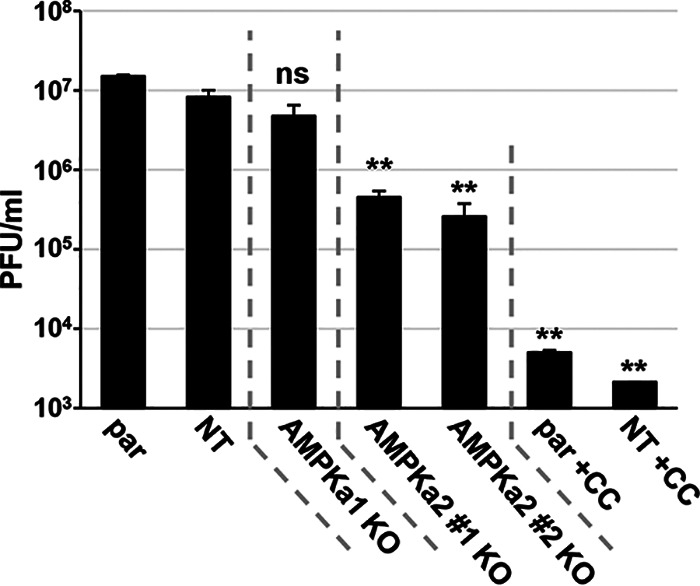
AMPKa2 catalytic subunits contribute to viral production. Parental (par), nontargeting control (NT), AMPKa1 knockout (KO), and AMPKa2 KO cells were infected (MOI = 3.0) for 96 h. Viral titer was quantified by plaque assay. AMPK inhibitor, 5 μM compound C (CC), was used a control for plaque formation in the par and NT cells (avg ± SEM, n ≥ 4). Multiple statistical comparisons were made by one-way ANOVA followed by Tukey post hoc test. **, P < 0.01; ns, not significant versus NT. MRC5hT parental cells were used for the generation of KO cells.
AMPKa2 is important for glycolytic activation during HCMV infection.
It was previously demonstrated that AMPK inhibition decreases both viral replication and HCMV-induced glycolytic activation (16). To test whether this correlation held in the AMPKa2 knockout cells, we measured the rate of lactate secretion, a downstream indicator of glycolysis (Fig. 7). As expected, HCMV induced lactate secretion in the control cells, which was largely prevented through treatment with compound C (Fig. 7). The knockout of AMPKa2 reduced HCMV-induced lactate secretion in both clonal cell lines (Fig. 7). While there were slight increases upon HCMV infection in the KO cells, they were not statistically significant relative to their corresponding mock-infected controls (Fig. 7). Knockout of AMPKa2 also resulted in a reduction of HCMV-induced lactate secreted relative to that from the control cells, although the difference observed for the AMPKa2 clone no. 2 was not statistically significant, which contrasted with the difference observed for the AMPKa2 clone no. 1. The difference between these two clones in HCMV glycolytic activity also correlates with their previously measured AMPK activity, inasmuch as the AMPKa2 clone no. 1 displayed less ACC phosphorylation (Fig. 5B). Collectively, these data suggest that AMPKa2 is important for HCMV-induced glycolytic activation during HCMV infection.
FIG 7.
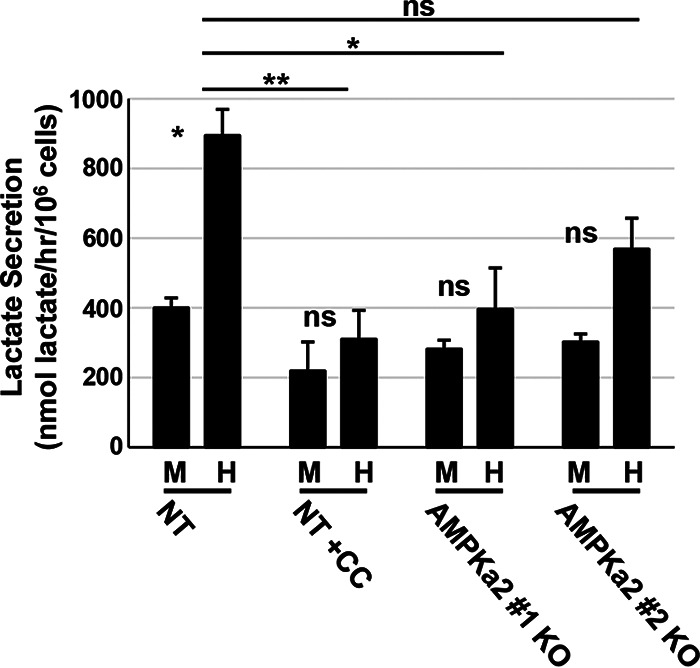
AMPK knockout reduces lactate secretion during HCMV infection. Nontargeting control (NT) and AMPKa2 knockout (KO) clonal cell lines were mock (M) or HCMV (H) infected (MOI = 3.0). At 48 h postinfection (hpi), medium was changed for 1 h and then harvested, and lactate secretion was measured by LC-MS/MS; 5 μM compound C (CC) was used as a control. Samples were normalized to 106 cells/h (avg ± SEM, n = 4). Multiple statistical comparisons were made by one-way ANOVA followed by Tukey post hoc test. *, P < 0.05; **, P < 0.01; ns, not significant. Comparisons were between M and H infection samples unless indicated by a line between sample comparisons. MRC5hT parental cells were used for the generation of KO cells.
GLUT4 overexpression increases HCMV replication in the face of AMPK inhibition.
Previously, it was found that HCMV infection induces expression of the high-capacity glucose transporter, GLUT4, encoded by the gene SLC2A4 (35). Furthermore, AMPK inhibition during HCMV infection can reverse this overexpression at the protein level (16). Given that both STO-609 and compound C inhibit HCMV-mediated AMPK activation (16), we wanted to explore whether GLUT4 could rescue HCMV infection in the presence of these inhibitors. To explore this possibility, we lentivirally transduced MRC5hT fibroblast cells with a GLUT4 expression construct in the face of decreased AMPK activation via inhibition of CaMKK using STO-609 (Fig. 8) or direct AMPK inhibition using compound C (Fig. 9). GLUT4 transduction led to substantial expression of GLUT4 RNA which was maintained during STO-609 treatment (Fig. 8A). To determine how GLUT4 expression impacts glycolysis, we measured glucose consumption in the GLUT4-overexpressing cells in the presence or absence of STO-609 (Fig. 8B). Overexpression of GLUT4 alone increased glucose consumption in HCMV-infected cells (Fig. 8B). STO-609 treatment reduced glucose consumption in all samples (Fig. 8B), suggesting that GLUT4-mediated activation of glycolysis was dependent on CaMKK activity. Furthermore, while GLUT4 overexpression slightly induced viral replication in the absence of STO-609, it did not impact HCMV replication in the presence of STO-609 (Fig. 8C). These results indicate that overexpression of GLUT4 does not rescue glucose consumption or viral replication upon STO-609 treatment.
FIG 8.

GLUT4 overexpression cannot rescue viral infection during CaMKK inhibition. (A to C) MRC5hT fibroblast cells overexpressing doxycycline (Dox)-inducible empty vector (EV) control or GLUT4 were induced with Dox (1 μg/ml) for 48 h and then mock (M) or HCMV (H) infected (MOI = 3.0). CaMKK was inactivated with its inhibitor, 30 µM STO-609 (STO) when indicated. (A) Ninety-six hours postinfection (hpi), RNA was harvested for qPCR analysis of GLUT4 RNA levels and normalized to GAPDH (avg ± SEM, n = 3). (B) Conditioned medium was harvested for analysis of glucose consumption. Measurements were normalized to total cell counts (avg ± SEM, n = 3). (C) Virus was harvested 96 hpi and quantified by TCID50 (avg ± SEM, n = 3). Multiple comparisons were made by one-way ANOVA followed by Student’s t test in panels A and C. *, P < 0.05; **, P < 0.01; ***, P < 0.001; ns, not significant.
FIG 9.

GLUT4 overexpression increases HCMV replication in the face of AMPK inhibition. (A to G) MRC5hT fibroblast cells overexpressing doxycycline (Dox)-inducible empty vector (EV) control or GLUT4 were induced with Dox (1 μg/ml) for 48 h and then mock (M) or HCMV (H) infected (MOI = 3.0). AMPK was inactivated with its inhibitor, 5 μM compound C (CC) when indicated. (A) Ninety-six hours postinfection (hpi), RNA was harvested for qPCR analysis of GLUT4 RNA levels and normalized to GAPDH (avg ± SEM, n = 5). (B) Ninety-six hours postinfection (hpi), protein was harvested and GLUT4 levels assessed by Western blotting. GAPDH was used as a loading control. All samples were normalized to GAPDH and the M-infected EV sample via densitometry analysis; averages from two blots (n = 1, run on two separate occasions). Conditioned medium was harvested for analysis of glucose consumption (C) and lactate secretion (D). Measurements were normalized to total cell counts (avg ± SEM, n = 3). (E) Representative images of cells at 72 hpi, infected with HCMV-GFP. (F) Individual cell GFP intensities were analyzed from images shown in panel E and are presented in a box and whisker plot. (G) Virus was harvested 96 hpi and quantified by TCID50 (avg ± SEM, n = 4). Multiple comparisons were made by one-way ANOVA followed by Student’s t test in panels A and G or Tukey post hoc test in panel F. *, P < 0.05; **, P < 0.01; ***, P < 0.001; ns, not significant.
Next, we assessed whether GLUT4 expression could rescue HCMV replication in the face of compound C-mediated AMPK inhibition. As observed previously, GLUT4 transduction led to the substantial induction of GLUT4 RNA levels and a more moderate increase in GLUT4 protein accumulation (Fig. 9A and B). The difference between the large induction of GLUT4 RNA versus the more modest induction of GLUT4 protein likely reflects known mechanisms of posttranslational control of GLUT4 expression (36); AMPK can also regulate GLUT4 posttranslationally (37). Consistent with this, during infection, RNA levels remained high in GLUT4-overexpressing cells treated with compound C (Fig. 9A), but GLUT4 protein expression was much more inhibited by compound C treatment (Fig. 9B). Importantly, GLUT4 protein expression was induced by HCMV infection; while compound C still reduced GLUT4 levels in the face of the GLUT4 transduction, it did so to a lesser extent than observed in the empty vector (EV) cells (Fig. 9B).
To determine how GLUT4 expression impacts glycolysis, we measured glucose consumption and lactate secretion in the GLUT4-overexpressing cells in the presence or absence of compound C (Fig. 9C and D). Again, overexpression of GLUT4 alone increased glucose consumption in HCMV-infected cells (Fig. 9C). Compound C treatment reduced glucose consumption in all samples (Fig. 9C) but to a lesser extent than with STO-609 treatment (Fig. 8B). Similar effects were observed for lactate secretion (Fig. 9D). Together, these results indicate that GLUT4 overexpression can induce glycolysis and cannot rescue glucose consumption during HCMV infection in the face of CaMKK inhibition with STO-609, but it can partially rescue during more direct AMPK inhibition with compound C.
To test whether GLUT4 expression and glycolytic activation can rescue HCMV replication in the face of AMPK inhibition, cells were infected for 72 h prior to analysis of viral infection using a green fluorescent protein (GFP) reporter virus. Baseline quantification of GFP intensity per cell in the HCMV-GFP-infected empty vector cells decreased approximately 10-fold with compound C treatment (Fig. 9E and F). In the face of compound C treatment, cellular GFP intensities increased approximately 5-fold with GLUT4 overexpression (Fig. 9E and F). To further explore how GLUT4 expression impacted the antiviral effects of compound C, after 96 h of infection, viral replication was measured by 50% tissue culture infective dose (TCID50) assay (Fig. 9G). We observed a significant decrease in viral titer with compound C treatment in the empty vector control cells, but the loss in viral titer was not significant in the GLUT4 overexpressing cells with compound C treatment. In fact, it was almost equal to the amount of virus produced in the untreated EV cells (Fig. 9G). Collectively, these data suggest that overexpressing the high-capacity glucose transporter, GLUT4, cannot rescue viral replication in the face of CaMKK inhibition but can partially rescue HCMV replication in the face of AMPK inhibition, highlighting the importance of the GLUT4 transporter for AMPK-mediated contributions to HCMV infection.
DISCUSSION
Viruses depend on cellular metabolism of the host to support replication and the production of viral progeny. HCMV had been found to induce many cellular metabolic activities that are important for infection (1–6, 21). Despite these findings, many questions remain about the mechanisms responsible for the metabolic alterations associated with HCMV infection. Here, we find that CaMKK1 is important for viral infection at a low MOI, while CaMKK2 is important for AMPK phosphorylation and activity at early times of infection. We further find that HCMV targets specific AMPK isoforms. HCMV infection substantially induces AMPKa2 expression, which contributes to multiple facets of HCMV infection, whereas the more ubiquitously expressed AMPKa1 subunit does not appreciably contribute to infection. Loss of AMPKa2 results in a decrease in the phosphorylation of the downstream AMPK target, ACC, decreased viral titer upon a high MOI, and the reduction of HCMV-induced lactate secretion. Furthermore, we find that AMPK-mediated glycolytic activation is important for infection, given our results that overexpression of GLUT4 in the face of AMPK inhibition rescues viral replication. These findings indicate that HCMV targets specific AMPK kinase isoforms to induce an environment conducive to supporting viral infection.
We find that CaMKK2 is largely dispensable for high-titer infection in fibroblasts (Fig. 2) but is important for phosphorylation of ACC at 24 hpi (Fig. 1D). As ACC is a canonical substrate of AMPK, these data suggest that knockout of CaMKK2 attenuates AMPK activity at early points of infection. In contrast, knockout of CaMKK1 does not impact ACC phosphorylation. This difference in ACC phosphorylation generally agrees with findings that CaMKK2 activates AMPK to a greater extent than CaMKK1 (38). However, given that AMPK phosphorylates a wide variety of substrates (39–45), interpreting global AMPK activity from the abundance of a single phosphorylated substrate is difficult. It is therefore hard to completely rule out CaMKK2-mediated effects on AMPK activation and subsequent viral infection. Aside from being important for wild-type levels of infection at a low MOI, it is currently unclear how CaMKK1 supports viral replication, a question worthy of future study. In contrast to CaMKK1, our data indicate that CaMKK2 shapes AMPK activation during the first 24 h of infection. Recovery of AMPK phosphorylation during later points of infection could be accounted for by other activators of AMPK, such as LKB1, or possible compensation between the two CaMKK isoforms in the KO cell lines. While these changes do not appear to functionally contribute to HCMV infection in fibroblasts, further analysis of these differences could provide insight into how CaMKK2 and other kinases regulate AMPK activity and substrate utilization, an important consideration given AMPK’s importance to proper physiology and various disease states (46). Additionally, CaMKK could have alternative unknown targets associated with HCMV infection. Those targets could be differentially impacted by CaMKK1 or CaMKK2 activity during mock or HCMV infection.
Our results indicate that HCMV specifically induces the expression of the AMPKa2 subunit to support infection. AMPKa2 is preferentially expressed in specific tissues, including human kidneys and skeletal and cardiac muscles, relative to the more ubiquitously expressed AMPKa1 (30, 31, 33, 34). High-titer HCMV infection relies on this induction as we find that that CRISPR-mediated inactivation of AMPKa2 attenuates production of viral progeny (Fig. 6). It is currently unclear why HCMV infection preferentially relies on AMPKa2. A simple explanation is that inducing AMPKa2 subunit expression is an easy way to increase total AMPK activity to support infection. Alternatively, AMPKa2 might exhibit differences with regard to the regulation of the AMPK trimer, localization, or substrate specificity that could preferentially contribute to infection. Important differences between the isoforms have emerged. For example, AMPKa1 primarily localizes to the cytoplasm, although it can sometimes be found in the nucleus, whereas AMPKa2 is predominantly nuclear, and its levels are known to be induced with cellular stress (25, 47–49). Furthermore, mouse knockouts of AMPKa1 or AMPKa2 exhibit differential phenotypes, with AMPKa1 knockout mice exhibiting defective myogenesis, in contrast to those mice in which AMPKa2 was inactivated (50, 51). Reports have also shown that AMPKa1 requires AMPKb2 for stability during overexpression (52); perhaps this could account for the differences in AMPKb1 RNA and protein induction observed in Fig. 3. Many questions still remain about how the alpha AMPK subunits shape AMPK’s response to various cellular stresses and its activity toward specific substrates. These parameters will likely also be significantly impacted by the presence of specific AMPK beta and gamma subunits in AMPK trimers. HCMV infection increases the protein abundance of AMPKb1 relative to that of AMPKb2 and increases the RNA abundance of AMPKg2 and AMPKg3 relative to that of AMPKg1 (Fig. 3). It remains to be determined how the changes in expression of these regulatory subunits contribute AMPK activity toward specific substrates and subsequently to HCMV infection.
Pharmacological inhibition of both CaMKK and AMPK has been found to markedly attenuate HCMV infection (16, 17). Here, we find that CRISPR-mediated inactivation of AMPKa2 or CaMKK1 reduces HCMV infection, although to a much lesser extent than what is observed upon pharmacological inhibition. The simplest explanation for this discrepancy would be that the remaining AMPK alpha subunit or CaMKK isoform is capable of compensating for the lack of its homolog, whereas pharmacological inhibition would be predicted to inhibit all such isoforms. Such compensation could also be selected for via evolutionary pressures during individual monoclonal propagation, i.e., as part of the CRISPR-mediated inactivation process. Attempts to address this possibility, e.g., by knocking out the corresponding and potentially compensating gene, are difficult, as we found that the selection required, which employs treatment of cells with multiple antibiotics, results in a senescent-like response (data not shown). We ran into this issue many times when attempting to rescue CaMKK- and AMPK-associated phenotypes via expression of a Cas9-resistant rescue construct in the knockout cell lines, which would be the preferred control for potential off-target effects, e.g., in contrast to using multiple clones as we did for the AMPKa2 knockouts. However, we repeatedly failed to recover viable cellular populations upon the last antibiotic selection, preventing these types of rescue experiments.
While alternative kinase isoform compensation, e.g., AMPKa1 compensating for AMPKa2, could be a likely contributor to the observed differences in the magnitude of inhibition between CRISPR inactivation and pharmacological inhibition, we cannot discount the possibility that the pharmacological inhibitors previously employed have off-target effects that attenuate infection. Compound C is one of the pharmacological inhibitors commonly used to inhibit AMPK. Given the possibility of off-target effects, we wanted to test the hypothesis that AMPK supports HCMV infection via its glycolytic regulatory role. Part of AMPK’s stimulation of glycolysis is mediated via regulation of GLUT4, the high-capacity glucose transporter. GLUT4 expression and activity are induced by and important for HCMV infection (35). We find that overexpression of GLUT4 partially rescues HCMV infection (Fig. 9), indicating that compound C-mediated inhibition of HCMV infection is partially due to its inhibition of glycolysis. AMPK inhibition by compound C still reduces glycolysis in the face of GLUT4 overexpression (Fig. 9) but to a lesser extent then CaMKK inhibition (Fig. 8B). This is not surprising given that activated AMPK regulates other glycolytic regulatory activities, such as 6-phosphofructo-2-kinase/fructose-2,6-bisphosphatase (PFKFB) (53), and induces GLUT4’s translocation to the cellular membrane to increase glucose uptake (44, 54, 55). Our results also suggest that CaMKK-mediated calcium signaling contributes to HCMV infection in more ways than AMPK signaling and GLUT4-mediated glycolysis alone. Regardless, the fact that GLUT4 can partially rescue HCMV infection in the context of compound C but not STO-609 treatment argues for the importance of this glucose transporter and activated glycolysis as part of AMPK’s contribution to HCMV infection.
Collectively, our data indicate that HCMV tunes the expression of the AMPK catalytic subunits to support infection. Many questions remain about how specific subunits of the AMPK trimer contribute to AMPK activity, regulation, and substrate specificity and how they contribute both to normal cellular physiology and to HCMV infection. CRISPR-mediated approaches can significantly facilitate addressing these questions. With respect to HCMV infection, we find that glycolytic activation is a key piece of how virally induced AMPK contributes to infection. This joins a growing body of evidence that viral-mediated regulation of host metabolism is extensive (1–6). Given the importance to infection, a key question remains as to whether these metabolic dependencies can be therapeutically targeted.
MATERIALS and METHODS
Cell culture and viral infection.
Human 293T cells (ATCC CRL-3216), telomerase-expressing MRC5 (MRC5hT) and BJ (BJhT) fibroblasts (generated via lentiviral transduction, previously described [56]) were cultured in Dulbecco’s modified Eagle medium (DMEM; Invitrogen) supplemented with 10% fetal bovine serum (Atlanta Biologicals), 4.5 g/liter glucose, and 1% penicillin-streptomycin (Pen-Strep; Life Technologies) at 37°C in a 5% (vol/vol) CO2 atmosphere. All experiments were carried out in MRC5hT cells with the exception of the CaMKK knockout experiments, which were performed in BJhT cells. CRISPR engineering techniques were first developed in the BJhT cell line and were transitioned into the MRC5hT cell line once the MRC5hT cells were established. MRC5hT cells are easier to passage and more easily undergo clonal selection than the BJhT cells. Lentiviruses used to generate the pCW EV and pCW GLUT4 cells and all CRISPR cell lines were produced in 293T cells. Prior to HCMV infection, cells were grown to confluence and maintained in serum-free medium for 24 h. Cells were mock or HCMV infected at the predetermined multiplicity of infection (MOI; either 3.0 or 0.01) with HCMV viral strain AD169 (or AD169-GFP where indicated) for an adsorption time of 90 min. The AD169-GFP virus was generated as described previously (57). Afterwards, viral inoculum was removed, cells were washed one time with phosphate-buffered saline (PBS; Invitrogen), and the buffer was replaced with fresh serum-free DMEM for the duration of infection unless otherwise indicated. In the case of the GLUT4 cells infected with AD169-GFP, cells were maintained in phenol red-free DMEM supplemented with GlutaMAX (Invitrogen) after the final medium change in order to image the GFP virus without interference from the phenol red present in typical DMEM. Cells treated with compound C or STO-609 were dosed at the time of viral adsorption and again with the addition of fresh medium after viral inoculum was removed and were maintained until the next medium change for metabolic experiments or until sample harvest for all other experiments. Conditioned medium and cells were harvested for metabolic and viral analyses at predetermined times postinfection. Viral titer was assessed via standard plaque assay or TCID50 when indicated. All viral stocks were propagated in MRC5hT cells and maintained in serum-free DMEM with Pen-Strep present.
Compounds.
Compound C (Millipore Sigma or MedChemExpress) was purchased in solution at a concentration of 10 mM in dimethyl sulfoxide (DMSO) and used at a concentration of 5 μM for all experiments. STO-609 (MedChemExpress) was purchased in solution at a concentration of 10 mM in DMSO and used at a concentration of 30 µM. Hoechst 33342 (Invitrogen) was purchased in solution at a concentration of 10 mg/ml and was diluted 1:2,000 in PBS for use. Doxycycline (Sigma) and puromycin (Millipore Sigma) were purchased as a powder, suspended to 10 mg/ml in water, and used at a final concentration of 1 μg/ml for all experiments.
Lentiviral plasmid generation.
GLUT4 was cloned according to Invitrogen’s Gateway Cloning methods (http://tools.thermofisher.com/content/sfs/manuals/gatewayman.pdf). GLUT4 expression plasmid, pcDNA3.2/v5-DEST (Addgene no. 18087) provided the GLUT4 template substrate which was cloned into donor vector pDONR_221 (Thermo Fisher no. 12536017) using BP Clonase (Invitrogen no. 11789020), creating a GLUT4-containing entry clone. The entry clone was then cloned into destination vector pCW57.1 lentiviral transfer plasmid (Addgene no. 41393) using LR Clonase (Invitrogen no. 11791020), creating the final GLUT4-expressing lentivirus transfer plasmid, pCW57.1_GLUT4.
CRISPR guide sequences listed in Table 1 were annealed via homology arms and cloned into the LentiCRISPRv2 Cas9 expression plasmid according the protocol described previously (58, 59). The LentiCRISPRv2 Cas9 expression plasmid itself was transfected into cells to be used as the nontargeting CRISPR control.
TABLE 1.
CRISPR guide sequences
| Gene | Polyclonal cell line | Guide target sequence (5′→3′)a |
|---|---|---|
| CAMKK1 | CaMKK1 knockout | AGCCATCGATGTGACTCACTTGG |
| CAMKK2 | CaMKK2 knockout | TGTGGTCACCGAGTGTGAGCCGG |
| PRKAA1 | AMPKa1-1 knockout | GAAGATCGGCCACTACATTCTGG |
| PRKAA2 | AMPKa2-1 knockout | GAAGATCGGACACTACGTGCTGG |
| PRKAA2 | AMPKa2-2 knockout | TCAGCCATCTTCGGCGCGCGCGG |
| PRKAA2 | AMPKa2-3 knockout | TACGTGCTGGGCGACACGCTGGG |
PAM sequences are underlined.
Lentiviral transduction and cell line generation.
For each transduction, 293T cells were seeded at 2 × 10⁶ cells per 10-cm dish, 3 dishes per lentiviral construct. After 24 h, each dish of cells was transfected with 2.6 μg lentiviral transfer plasmid, 2.4 μg PAX2 packaging plasmid, and 0.25 μg VSV-G envelope plasmid using Fugene 6 (Promega) transfection reagent. After an additional 24 h, the medium was removed and replaced with 4 ml of fresh medium for 24 h. Then supernatant was filtered through a 0.45-μm syringe filter to remove any debris and dead cells. Filtered lentiviral supernatant was introduced to cells in the presence of 5 μg/ml Polybrene (Millipore Sigma). Three hours later, lentivirus was removed, and freshly filtered lentivirus from a second dish of 293T cells was added without Polybrene. After 3 h more, lentivirus was once again removed and replaced with freshly filtered lentivirus from the final dish of 293T cells without Polybrene and incubated overnight. The following day, lentivirus was replaced with 10 ml of fresh DMEM containing fetal bovine serum (FBS) and Pen-Strep. Seventy-two hours postransduction, cells were selected with 1 μg/ml puromycin (Millipore Sigma) under normal growth conditions. Selection efficiency/efficacy was monitored by cell death of mock-transduced parental cells.
Nontargeting control cells used for comparisons in all CRISPR experiments were polyclonal and did not undergo clonal selection. Clonal selection of CRISPR-transduced cell lines producing knockouts of the CaMKK and AMPK isoforms was carried out by dilution of cells to a single-cell suspension in a 96-well plate. Ninety-six-well plates were monitored for growth; when cells reached confluence, they were expanded into a 24-well plate, a 6-well plate, and finally, a 10-cm dish until cells were ready to be frozen as stocks, extracted for genotyping, and harvested for Western blot analysis to assess knockout. Genomic PCR primers used to genotype clonal knockouts are listed in Table 2. Genotyping was performed via PCR amplification of the genomic locus of interest, gel purification of the PCR product, and subsequent ligation into pCR2.1-TOPO TA vector by a TA Cloning kit (Invitrogen) according to the manufacturer’s protocol. The TOPO construct was transformed into DH10B competent cells, which were grown on LB agar plates containing 50 μg/ml kanamycin and supplemented with 40 μl of 100 mM isopropyl-β-d-thiogalactopyranoside (IPTG) and 40 mg/ml 5-bromo-4-chloro-3-indolyl-β-d-galactopyranoside (X-Gal) and spread over the surface of the plate 1 h prior to plating the transformation. Plasmids were isolated from colorless colonies containing the PCR inserts and sequenced via Sanger sequencing using M13 forward and M13 reverse universal primers (Genewiz). Nomenclature for CRISPR knockout cell genotyping was according to published guidelines (60).
TABLE 2.
Genomic PCR primer sequences
| Gene (primer set no.) | Genomic primer |
|
|---|---|---|
| Direction | Sequence (5′→3′) | |
| PRKAA1 (set 6) | Forward | CGCAGACTCAGTTCCTGGAG |
| Reverse | GCTCCGAAGGAAACCAGTGA | |
| PRKAA1 (set 7) | Forward | ACAGCCGAGAAGCAGAAACA |
| Reverse | CAACGAAGTTTCGCACGGAG | |
| PRKAA2 (set 6) | Forward | ACCCCCTATTTTCACCCCCT |
| Reverse | GAACGAGTCCAGTTCTCCCG | |
| PRKAA2 (set 7) | Forward | AGTCTCCCCTCCCGATTCTT |
| Reverse | CTTGCTCCGACCTCCAGAAA | |
| CAMKK1 | Forward | GCAGACTCTAAGAGGCAGAATTAGA |
| Reverse | ATTCATTCAGGTCATAGGGACAGAC | |
| CAMKK2 | Forward | GCCCACACCTCAGTCTCTTT |
| Reverse | TCTCTTTCTGCAGGTGGCTC | |
Real-time quantitative PCR.
Cellular RNA was extracted using Trizol reagent (Invitrogen) according to the manufacturer’s protocol and then treated with DNase I (Invitrogen) and subsequently used to synthesize cDNA using random hexamer primers (Invitrogen) and Superscript II reverse transcriptase (Invitrogen). Quantitative PCR (qPCR) was carried out using Fast SYBR green master mix (Applied Biosystems), using a 7500 fast real-time PCR system (Applied Biosystems) and StepOne real-time PCR software (Applied Biosystems). Primers used for each reaction are presented in Table 3. Relative RNA levels for indicated genes were measured and normalized to levels of the gene for glyceraldehyde-3-phosphate dehydrogenase (GAPDH) and then to mock or control samples, using the comparative threshold cycle (2−ΔΔCT) method. All calculations were carried out in Microsoft Excel 2016.
TABLE 3.
Real-time quantitative PCR primer sequences
| Gene | Protein name | Primer |
|
|---|---|---|---|
| Direction | Sequence (5′→3′) | ||
| PRKAA1 | AMPKa1 | Forward | GAAGATCGGCCACTACATTC |
| Reverse | CAGCTACTTTATGCCCAGTC | ||
| PRKAA2 | AMPKa2 | Forward | ATTCTGTCTGCTGTGGATTAC |
| Reverse | CGGCTATCTTGGCATTCAT | ||
| PRKAB1 | AMPKb1 | Forward | AAAGTGCTCCGATGTGTC |
| Reverse | CCATCACTCCATCCTTGATAG | ||
| PRKAB2 | AMPKb2 | Forward | GATTTGGAGGACTCCGTAAAG |
| Reverse | TGAAGGACCCAGAGATGAA | ||
| PRKAG1 | AMPKg1 | Forward | CTATGACCTGATTCCCACAAG |
| Reverse | GATCTGTACCAAGGCTGATTTA | ||
| PRKAG2 | AMPKg2 | Forward | CCACAGATTGCCCGTTATT |
| Reverse | GCAGGCTTTGGCATATCA | ||
| PRKAG3 | AMPKg3 | Forward | GCATCAAGAGATGAGCTTCC |
| Reverse | CGTTTCCCACGGATTCTTT | ||
| CAMKK1 | CaMKK1 | Forward | AATGAGCCCGTGGTGTTT |
| Reverse | CAATCCTGGTCTCGGGATTCTT | ||
| CAMKK2 | CaMKK2 | Forward | GCCATGGGTGTGACACTATAC |
| Reverse | GGCCTGACTCTTGATCTTACTG | ||
| SLC2A4 | GLUT4 | Forward | CTGTGCCATCTTGATGACCGTG |
| Reverse | GTTGGAGAAACCAGCGACAGC | ||
| GAPDH | GAPDH | Forward | CATGTTCGTCATGGGTGTGAACCA |
| Reverse | ATGGCATGGACTGTGGTCATGAGT | ||
Immunoblotting.
Cells were harvested in 1× radioimmunoprecipitation assay (RIPA) buffer (10× RIPA = 0.5 M Tris-HCl [pH 7.4], 1.5 M NaCl, 10 mM EDTA, 2.5% deoxycholic acid, 10% Triton X-100) containing a protease inhibitor tablet (Pierce) and PhosSTOP tablet (Sigma) per 10 ml of 1× buffer. Samples were incubated on ice for 20 min and sonicated, and then the insoluble fraction was pelleted and discarded. Soluble proteins were quantified via Bradford assay (Bio-Rad), and samples were normalized to total protein concentration and added to 5× protein loading buffer (0.125 M Tris-HCl [pH 6.8], 2% SDS, 10% glycerol, 5% 2-mercaptoethanol, 0.0004% bromophenol blue) and boiled for 5 min. Proteins were separated on an SDS-PAGE gel (8%, 10%, or 11% depending on protein of interest size) in Tris-glycine running buffer. Samples were transferred to a nitrocellulose membrane in Tris-glycine transfer buffer and stained with Ponceau S to visualize proteins and ensure equal loading. Blots were blocked with 5% dried milk in Tris-buffered saline-Tween 20 (TBST), followed by primary and secondary incubations in 5% bovine serum albumin (BSA) in TBST. Antibodies were used at concentrations recommended by the manufacturers and are listed in Table 4. Blots were developed with enhanced chemiluminescence (ECL; Bio-Rad) and imaged using a Molecular Imager Gel Doc XR+ system (Bio-Rad).
TABLE 4.
Antibodies used for immunoprecipitation experiments
| Antibody | Source or reference |
|---|---|
| GAPDH (D16H11) | Cell Signaling Technology |
| CaMKKa (R-73) | Santa Cruz Biotechnology, Inc. |
| AMPKa1 | Cell Signaling Technology |
| AMPKa2 | Cell Signaling Technology |
| AMPKb1 (71C10) | Cell Signaling Technology |
| AMPKb2 | Cell Signaling Technology |
| AMPKg1 | Cell Signaling Technology |
| AMPKg2 | Cell Signaling Technology |
| AMPKg3 | Cell Signaling Technology |
| AMPKa | Cell Signaling Technology |
| Phospho-AMPK (Thr172) (40H9) | Cell Signaling Technology |
| Phospho-acetyl-CoA carboxylase (Ser79) | Cell Signaling Technology |
| Acetyl-CoA carboxylase (C83B10) | Cell Signaling Technology |
| Glucose transporter GLUT4 | Abcam |
| pp28 | Shenk lab, 63 |
| Goat anti-rabbit IgG secondary | Bio-Rad |
| Goat anti-mouse IgG secondary | Bio-Rad |
Metabolic measurements.
Experiments were carried out as previously described (20); slight changes to the protocol are described in the following section. For GLUT4 metabolic experiments, confluent cells were treated with doxycycline once daily for 2 days. On day 2, cells were also maintained in serum-free medium and, 24 h later, infected at an MOI of 3.0 and treated with compound C or STO-609 when indicated. For AMPK knockout metabolic experiments, confluent cells were maintained in serum-free medium for 24 h, infected at an MOI of 3.0, and treated with compound C when indicated.
For glucose consumption experiments, cells were maintained in serum-free medium for 24 h after infection, and then the medium was exchanged for an additional 24 h, for a total of 48 h postinfection (hpi), at which point, conditioned medium was harvested for glucose measurements. At the time of the last medium exchange, a virgin medium control sample was also collected. Glucose was measured using the HemoCue Glucose 201 system. A standard curve was made by serially diluting the virgin medium sample, which contains a known concentration of glucose (4.5 g/liter) in PBS for a total of six dilutions. Conditioned medium samples were diluted 1/4 in PBS (to ensure signal linearity). Each sample was read using the HemoCue system and normalized to the standard curve and converted to nanomoles. Consumption was calculated by subtracting the virgin medium sample from each medium sample. These values were normalized to nuclear cell counts (per 106 cells) and divided by 24 h to calculate the rate per hour.
For lactate secretion experiments, cells were maintained in serum-free medium for 48 hpi, and then the medium was exchanged 1 h prior to harvesting for lactate measurements. At the time of the final medium exchange, a virgin medium control sample was also collected. The control was diluted 1/8 in high-performance liquid chromatography (HPLC)-grade water. A standard curve was created by diluting a known amount of lactate standard (7.1 mM in HPLC-grade water) into the diluted control sample at a ratio of 1:1 (standard to diluted DMEM) and serially diluting by half 6 times in −75°C 80:20 HPLC-grade methanol to HPLC-grade water. Prior to sample analysis, conditioned media were centrifuged at 4°C for 5 min to pellet any debris. Samples were then diluted 1/4 in −75°C 80:20 HPLC-grade methanol to HPLC-grade water, vortexed briefly, incubated on ice for 10 min, centrifuged at 4°C for 10 min, and then transferred to HPLC sample vials for analysis (see “LC-MS/MS analysis”). Total lactate secreted in each sample was calculated using the standard curve, converted to nanomoles, normalized to nuclear counts (per 106 cells), and divided by 1 h to calculate the hourly rate.
LC-MS/MS analysis.
Lactate was analyzed using reverse-phase chromatography with an ion-paring reagent in a Shimadzu HPLC coupled to a Thermo Quantum triple quadrupole mass spectrometer running in negative mode with selected-reaction monitoring (SRM)-specific scans as previously described (18, 61). Then, liquid chromatography-tandem mass spectrometry (LC-MS/MS) data were analyzed using the publicly available mzRock machine learning toolkit (http://code.google.com/p/mzrock/), which automates SRM/HPLC feature detection, grouping, signal-to-noise classification, and comparison to known metabolite retention times (62).
Nuclear counting and individual cell GFP intensity quantification.
Cell counts for metabolic assay normalization were acquired with Hoechst 33342 (Invitrogen) staining of nuclei, followed by imaging on the Cytation 5 imaging reader. Nuclei were counted using the accompanying Gen5 software (BioTek Instruments, Inc.). Cellular GFP intensities in Fig. 8 were quantified by masking AD169-GFP infected cells based on nuclear staining using Hoechst in the Gen5 software from images acquired using the Cytation 5 imaging reader.
Statistical and densitometry analysis.
Statistical analysis was carried out using JMP statistical analysis software (JMP, Cary, NC). When indicated in the figure legends, a one-way analysis of variance (ANOVA) was performed, followed by Student’s t test or Tukey post hoc test. A P value of <0.05 was considered statistically significant.
Western blot densitometry was measured using Bio-Rad Image Lab software, taking the total band intensity, and ratios were calculated in Microsoft Excel 2016. In Fig. 1D to F, AMPK and ACC ratios were determined by densitometry of all HCMV-infected samples, phosphorylated and total intensities. In Fig. 5A and B, total AMPK was calculated by the addition of AMPKa1 and AMPKa2 densitometry, and then the ratio was determined relative to phospho-AMPK. Finally, the ratios were normalized to the nontargeting control HCMV-infected sample for each time point. In Fig. 9B, all GLUT4 densitometry samples were normalized to GAPDH.
ACKNOWLEDGMENTS
D.M.D. was supported by a postdoctoral fellowship (133137-PF-19-038-01-MPC) from the American Cancer Society. I.R.-S. was supported by a predoctoral fellowship from the American Heart Association. The work was also supported by NIH grants AI127370 and AI50698 to J.M. and by a Research Scholar Grant from the American Cancer Society (grant RSG-15-049-01-MPC).
The funders had no role in study design, data collection and interpretation, or the decision to submit this work for publication.
D.M.D. wrote the manuscript, formatted figures, preformed AMPK and GLUT4 experiments, and revised the figures and manuscript. X.S. contributed to the AMPK qPCR data in Fig. 3B. I.R.-S. performed CaMKK experiments in Fig. 1 and 2. All authors (D.M.D., I.R.-S., X.S., and J.M.) contributed to the conceptualization of this project, designing of experiments, and editing of the manuscript.
REFERENCES
- 1.Munger J, Bennett BD, Parikh A, Feng XJ, McArdle J, Rabitz HA, Shenk T, Rabinowitz JD. 2008. Systems-level metabolic flux profiling identifies fatty acid synthesis as a target for antiviral therapy. Nat Biotechnol 26:1179–1186. doi: 10.1038/nbt.1500. [DOI] [PMC free article] [PubMed] [Google Scholar]
- 2.Munger J, Bajad SU, Coller HA, Shenk T, Rabinowitz JD. 2006. Dynamics of the cellular metabolome during human cytomegalovirus infection. PLoS Pathog 2:e132. doi: 10.1371/journal.ppat.0020132. [DOI] [PMC free article] [PubMed] [Google Scholar]
- 3.Brunton J, Steele S, Ziehr B, Moorman N, Kawula T. 2013. Feeding uninvited guests: mTOR and AMPK set the table for intracellular pathogens. PLoS Pathog 9:e1003552. doi: 10.1371/journal.ppat.1003552. [DOI] [PMC free article] [PubMed] [Google Scholar]
- 4.Sanchez EL, Lagunoff M. 2015. Viral activation of cellular metabolism. Virology 479–480:609–618. doi: 10.1016/j.virol.2015.02.038. [DOI] [PMC free article] [PubMed] [Google Scholar]
- 5.Goodwin CM, Xu S, Munger J. 2015. Stealing the keys to the kitchen: viral manipulation of the host cell metabolic network. Trends Microbiol 23:789–798. doi: 10.1016/j.tim.2015.08.007. [DOI] [PMC free article] [PubMed] [Google Scholar]
- 6.Shenk T, Alwine JC. 2014. Human cytomegalovirus: coordinating cellular stress, signaling, and metabolic pathways. Annu Rev Virol 1:355–374. doi: 10.1146/annurev-virology-031413-085425. [DOI] [PubMed] [Google Scholar]
- 7.Wohl DA, Zeng D, Stewart P, Glomb N, Alcorn T, Jones S, Handy J, Fiscus S, Weinberg A, Gowda D, van der Horst C. 2005. Cytomegalovirus viremia, mortality, and end-organ disease among patients with AIDS receiving potent antiretroviral therapies. J Acquir Immune Defic Syndr 38:538–544. doi: 10.1097/01.qai.0000155204.96973.c3. [DOI] [PubMed] [Google Scholar]
- 8.Teh BW, Khot AS, Harrison SJ, Prince HM, Slavin MA. 2013. A messenger at the door: cytomegalovirus retinitis in myeloma patients with progressive disease. Transpl Infect Dis 15:E134–E138. doi: 10.1111/tid.12106. [DOI] [PubMed] [Google Scholar]
- 9.Tay MR, Lim ST, Tao M, Quek RH, Tay K, Tan TT. 2014. Cytomegalovirus infection and end-organ disease in Asian patients with lymphoma receiving chemotherapy. Leuk Lymphoma 55:182–187. doi: 10.3109/10428194.2013.798867. [DOI] [PubMed] [Google Scholar]
- 10.Kuo CP, Wu CL, Ho HT, Chen CG, Liu SI, Lu YT. 2008. Detection of cytomegalovirus reactivation in cancer patients receiving chemotherapy. Clin Microbiol Infect 14:221–227. doi: 10.1111/j.1469-0691.2007.01895.x. [DOI] [PubMed] [Google Scholar]
- 11.El-Cheikh J, Devillier R, Crocchiolo R, Furst S, Calmels B, Faucher C, Stoppa AM, Granata A, Castagna L, Ladaique P, Lemarie C, Bouabdallah R, Zandotti C, Merlin M, Berger P, Chabannon C, Blaise D. 2013. Impact of pretransplant donor and recipient cytomegalovirus serostatus on outcome for multiple myeloma patients undergoing reduced intensity conditioning allogeneic stem cell transplantation. Mediterr J Hematol Infect Dis 5:e2013026. doi: 10.4084/MJHID.2013.026. [DOI] [PMC free article] [PubMed] [Google Scholar]
- 12.Cobbs CS, Harkins L, Samanta M, Gillespie GY, Bharara S, King PH, Nabors LB, Cobbs CG, Britt WJ. 2002. Human cytomegalovirus infection and expression in human malignant glioma. Cancer Res 62:3347–3350. [PubMed] [Google Scholar]
- 13.Ranganathan P, Clark PA, Kuo JS, Salamat MS, Kalejta RF. 2012. Significant association of multiple human cytomegalovirus genomic loci with glioblastoma multiforme samples. J Virol 86:854–864. doi: 10.1128/JVI.06097-11. [DOI] [PMC free article] [PubMed] [Google Scholar]
- 14.Baryawno N, Rahbar A, Wolmer-Solberg N, Taher C, Odeberg J, Darabi A, Khan Z, Sveinbjornsson B, Fuskevag OM, Segerstrom L, Nordenskjold M, Siesjo P, Kogner P, Johnsen JI, Soderberg-Naucler C. 2011. Detection of human cytomegalovirus in medulloblastomas reveals a potential therapeutic target. J Clin Invest 121:4043–4055. doi: 10.1172/JCI57147. [DOI] [PMC free article] [PubMed] [Google Scholar]
- 15.Pass RF. 2001. Cytomegalovirus, p 2675–2705. In Knipe DM, Howley PM (ed), Fields' virology, 4th ed Lippincott-Williams and Wilkins, New York, NY. [Google Scholar]
- 16.McArdle J, Moorman NJ, Munger J. 2012. HCMV targets the metabolic stress response through activation of AMPK whose activity is important for viral replication. PLoS Pathog 8:e1002502. doi: 10.1371/journal.ppat.1002502. [DOI] [PMC free article] [PubMed] [Google Scholar]
- 17.McArdle J, Schafer XL, Munger J. 2011. Inhibition of calmodulin-dependent kinase kinase blocks human cytomegalovirus-induced glycolytic activation and severely attenuates production of viral progeny. J Virol 85:705–714. doi: 10.1128/JVI.01557-10. [DOI] [PMC free article] [PubMed] [Google Scholar]
- 18.DeVito SR, Ortiz-Riano E, Martinez-Sobrido L, Munger J. 2014. Cytomegalovirus-mediated activation of pyrimidine biosynthesis drives UDP-sugar synthesis to support viral protein glycosylation. Proc Natl Acad Sci U S A 111:18019–18024. doi: 10.1073/pnas.1415864111. [DOI] [PMC free article] [PubMed] [Google Scholar]
- 19.Spencer CM, Schafer XL, Moorman NJ, Munger J. 2011. Human cytomegalovirus induces the activity and expression of acetyl-coenzyme a carboxylase, a fatty acid biosynthetic enzyme whose inhibition attenuates viral replication. J Virol 85:5814–5824. doi: 10.1128/JVI.02630-10. [DOI] [PMC free article] [PubMed] [Google Scholar]
- 20.Rodríguez-Sánchez I, Schafer XL, Monaghan M, Munger J. 2019. The human cytomegalovirus UL38 protein drives mTOR-independent metabolic flux reprogramming by inhibiting TSC2. PLoS Pathog 15:e1007569. doi: 10.1371/journal.ppat.1007569. [DOI] [PMC free article] [PubMed] [Google Scholar]
- 21.Rodríguez-Sánchez I, Munger J. 2019. Meal for two: human cytomegalovirus-induced activation of cellular metabolism. Viruses 11:273. doi: 10.3390/v11030273. [DOI] [PMC free article] [PubMed] [Google Scholar]
- 22.Yu Y, Clippinger AJ, Alwine JC. 2011. Viral effects on metabolism: changes in glucose and glutamine utilization during human cytomegalovirus infection. Trends Microbiol 19:360–367. doi: 10.1016/j.tim.2011.04.002. [DOI] [PMC free article] [PubMed] [Google Scholar]
- 23.Chambers JW, Maguire TG, Alwine JC. 2010. Glutamine metabolism is essential for human cytomegalovirus infection. J Virol 84:1867–1873. doi: 10.1128/JVI.02123-09. [DOI] [PMC free article] [PubMed] [Google Scholar]
- 24.Woods A, Johnstone SR, Dickerson K, Leiper FC, Fryer LG, Neumann D, Schlattner U, Wallimann T, Carlson M, Carling D. 2003. LKB1 is the upstream kinase in the AMP-activated protein kinase cascade. Curr Biol 13:2004–2008. doi: 10.1016/j.cub.2003.10.031. [DOI] [PubMed] [Google Scholar]
- 25.Mihaylova MM, Shaw RJ. 2011. The AMPK signalling pathway coordinates cell growth, autophagy and metabolism. Nat Cell Biol 13:1016–1023. doi: 10.1038/ncb2329. [DOI] [PMC free article] [PubMed] [Google Scholar]
- 26.Kurumbail RG, Calabrese MF. 2016. Structure and regulation of AMPK. Exp Suppl 107:3–22. doi: 10.1007/978-3-319-43589-3_1. [DOI] [PubMed] [Google Scholar]
- 27.Woods A, Dickerson K, Heath R, Hong SP, Momcilovic M, Johnstone SR, Carlson M, Carling D. 2005. Ca2+/calmodulin-dependent protein kinase kinase-beta acts upstream of AMP-activated protein kinase in mammalian cells. Cell Metab 2:21–33. doi: 10.1016/j.cmet.2005.06.005. [DOI] [PubMed] [Google Scholar]
- 28.Tokumitsu H, Inuzuka H, Ishikawa Y, Ikeda M, Saji I, Kobayashi R. 2002. STO-609, a specific inhibitor of the Ca2+/calmodulin-dependent protein kinase kinase. J Biol Chem 277:15813–15818. doi: 10.1074/jbc.M201075200. [DOI] [PubMed] [Google Scholar]
- 29.Willows R, Navaratnam N, Lima A, Read J, Carling D. 2017. Effect of different gamma-subunit isoforms on the regulation of AMPK. Biochem J 474:1741–1754. doi: 10.1042/BCJ20170046. [DOI] [PMC free article] [PubMed] [Google Scholar]
- 30.Wang YG, Han XG, Yang Y, Qiao H, Dai KR, Fan QM, Tang TT. 2016. Functional differences between AMPK alpha1 and alpha2 subunits in osteogenesis, osteoblast-associated induction of osteoclastogenesis, and adipogenesis. Sci Rep 6:32771. doi: 10.1038/srep32771. [DOI] [PMC free article] [PubMed] [Google Scholar]
- 31.Stapleton D, Mitchelhill KI, Gao G, Widmer J, Michell BJ, Teh T, House CM, Fernandez CS, Cox T, Witters LA, Kemp BE. 1996. Mammalian AMP-activated protein kinase subfamily. J Biol Chem 271:611–614. doi: 10.1074/jbc.271.2.611. [DOI] [PubMed] [Google Scholar]
- 32.Ross FA, Jensen TE, Hardie DG. 2016. Differential regulation by AMP and ADP of AMPK complexes containing different gamma subunit isoforms. Biochem J 473:189–199. doi: 10.1042/BJ20150910. [DOI] [PMC free article] [PubMed] [Google Scholar]
- 33.Fagerberg L, Hallström BM, Oksvold P, Kampf C, Djureinovic D, Odeberg J, Habuka M, Tahmasebpoor S, Danielsson A, Edlund K, Asplund A, Sjöstedt E, Lundberg E, Szigyarto CA, Skogs M, Takanen JO, Berling H, Tegel H, Mulder J, Nilsson P, Schwenk JM, Lindskog C, Danielsson F, Mardinoglu A, Sivertsson A, von Feilitzen K, Forsberg M, Zwahlen M, Olsson I, Navani S, Huss M, Nielsen J, Ponten F, Uhlén M. 2014. Analysis of the human tissue-specific expression by genome-wide integration of transcriptomics and antibody-based proteomics. Mol Cell Proteomics 13:397–406. doi: 10.1074/mcp.M113.035600. [DOI] [PMC free article] [PubMed] [Google Scholar]
- 34.Uhlén M, Fagerberg L, Hallström BM, Lindskog C, Oksvold P, Mardinoglu A, Sivertsson Å, Kampf C, Sjöstedt E, Asplund A, Olsson I, Edlund K, Lundberg E, Navani S, Szigyarto CA, Odeberg J, Djureinovic D, Takanen JO, Hober S, Alm T, Edqvist PH, Berling H, Tegel H, Mulder J, Rockberg J, Nilsson P, Schwenk JM, Hamsten M, von Feilitzen K, Forsberg M, Persson L, Johansson F, Zwahlen M, von Heijne G, Nielsen J, Pontén F. 2015. Proteomics. Tissue-based map of the human proteome. Science 347:1260419. doi: 10.1126/science.1260419. [DOI] [PubMed] [Google Scholar]
- 35.Yu Y, Maguire TG, Alwine JC. 2011. Human cytomegalovirus activates glucose transporter 4 expression to increase glucose uptake during infection. J Virol 85:1573–1580. doi: 10.1128/JVI.01967-10. [DOI] [PMC free article] [PubMed] [Google Scholar]
- 36.Sadler JB, Bryant NJ, Gould GW, Welburn CR. 2013. Posttranslational modifications of GLUT4 affect its subcellular localization and translocation. Int J Mol Sci 14:9963–9978. doi: 10.3390/ijms14059963. [DOI] [PMC free article] [PubMed] [Google Scholar]
- 37.Lee JO, Lee SK, Kim JH, Kim N, You GY, Moon JW, Kim SJ, Park SH, Kim HS. 2012. Metformin regulates glucose transporter 4 (GLUT4) translocation through AMP-activated protein kinase (AMPK)-mediated Cbl/CAP signaling in 3T3-L1 preadipocyte cells. J Biol Chem 287:44121–44129. doi: 10.1074/jbc.M112.361386. [DOI] [PMC free article] [PubMed] [Google Scholar]
- 38.Fujiwara Y, Kawaguchi Y, Fujimoto T, Kanayama N, Magari M, Tokumitsu H. 2016. Differential AMP-activated protein kinase (AMPK) recognition mechanism of Ca2+/calmodulin-dependent protein kinase kinase isoforms. J Biol Chem 291:13802–13808. doi: 10.1074/jbc.M116.727867. [DOI] [PMC free article] [PubMed] [Google Scholar]
- 39.Gwinn DM, Shackelford DB, Egan DF, Mihaylova MM, Mery A, Vasquez DS, Turk BE, Shaw RJ. 2008. AMPK phosphorylation of raptor mediates a metabolic checkpoint. Mol Cell 30:214–226. doi: 10.1016/j.molcel.2008.03.003. [DOI] [PMC free article] [PubMed] [Google Scholar]
- 40.Kalender A, Selvaraj A, Kim SY, Gulati P, Brûlé S, Viollet B, Kemp BE, Bardeesy N, Dennis P, Schlager JJ, Marette A, Kozma SC, Thomas G. 2010. Metformin, independent of AMPK, inhibits mTORC1 in a rag GTPase-dependent manner. Cell Metab 11:390–401. doi: 10.1016/j.cmet.2010.03.014. [DOI] [PMC free article] [PubMed] [Google Scholar]
- 41.Kim J, Kundu M, Viollet B, Guan KL. 2011. AMPK and mTOR regulate autophagy through direct phosphorylation of Ulk1. Nat Cell Biol 13:132–141. doi: 10.1038/ncb2152. [DOI] [PMC free article] [PubMed] [Google Scholar]
- 42.McGee SL, Hargreaves M. 2010. AMPK-mediated regulation of transcription in skeletal muscle. Clin Sci (Lond) 118:507–518. doi: 10.1042/CS20090533. [DOI] [PubMed] [Google Scholar]
- 43.Park SH, Gammon SR, Knippers JD, Paulsen SR, Rubink DS, Winder WW. 2002. Phosphorylation-activity relationships of AMPK and acetyl-CoA carboxylase in muscle. J Appl Physiol 92:2475–2482. doi: 10.1152/japplphysiol.00071.2002. [DOI] [PubMed] [Google Scholar]
- 44.Kurth-Kraczek EJ, Hirshman MF, Goodyear LJ, Winder WW. 1999. 5' AMP-activated protein kinase activation causes GLUT4 translocation in skeletal muscle. Diabetes 48:1667–1671. doi: 10.2337/diabetes.48.8.1667. [DOI] [PubMed] [Google Scholar]
- 45.Nakano A, Kato H, Watanabe T, Min KD, Yamazaki S, Asano Y, Seguchi O, Higo S, Shintani Y, Asanuma H, Asakura M, Minamino T, Kaibuchi K, Mochizuki N, Kitakaze M, Takashima S. 2010. AMPK controls the speed of microtubule polymerization and directional cell migration through CLIP-170 phosphorylation. Nat Cell Biol 12:583–590. doi: 10.1038/ncb2060. [DOI] [PubMed] [Google Scholar]
- 46.Steinberg GR, Kemp BE. 2009. AMPK in health and disease. Physiol Rev 89:1025–1078. doi: 10.1152/physrev.00011.2008. [DOI] [PubMed] [Google Scholar]
- 47.Jeon S-M. 2016. Regulation and function of AMPK in physiology and diseases. Exp Mol Med 48:e245. doi: 10.1038/emm.2016.81. [DOI] [PMC free article] [PubMed] [Google Scholar]
- 48.Salt I, Celler JW, Hawley SA, Prescott A, Woods A, Carling D, Hardie DG. 1998. AMP-activated protein kinase: greater AMP dependence, and preferential nuclear localization, of complexes containing the alpha2 isoform. Biochem J 334:177–187. doi: 10.1042/bj3340177. [DOI] [PMC free article] [PubMed] [Google Scholar]
- 49.Okamoto S, Asgar NF, Yokota S, Saito K, Minokoshi Y. 2019. Role of the α2 subunit of AMP-activated protein kinase and its nuclear localization in mitochondria and energy metabolism-related gene expressions in C2C12 cells. Metabolism 90:52–68. doi: 10.1016/j.metabol.2018.10.003. [DOI] [PubMed] [Google Scholar]
- 50.Fu X, Zhao JX, Zhu MJ, Foretz M, Viollet B, Dodson MV, Du M. 2013. AMP-activated protein kinase alpha1 but not alpha2 catalytic subunit potentiates myogenin expression and myogenesis. Mol Cell Biol 33:4517–4525. doi: 10.1128/MCB.01078-13. [DOI] [PMC free article] [PubMed] [Google Scholar]
- 51.Fu X, Zhao JX, Liang J, Zhu MJ, Foretz M, Viollet B, Du M. 2013. AMP-activated protein kinase mediates myogenin expression and myogenesis via histone deacetylase 5. Am J Physiol Cell Physiol 305:C887–C895. doi: 10.1152/ajpcell.00124.2013. [DOI] [PMC free article] [PubMed] [Google Scholar]
- 52.Ross FA, MacKintosh C, Hardie DG. 2016. AMP-activated protein kinase: a cellular energy sensor that comes in 12 flavours. FEBS J 283:2987–3001. doi: 10.1111/febs.13698. [DOI] [PMC free article] [PubMed] [Google Scholar]
- 53.Marsin AS, Bertrand L, Rider MH, Deprez J, Beauloye C, Vincent MF, Van den Berghe G, Carling D, Hue L. 2000. Phosphorylation and activation of heart PFK-2 by AMPK has a role in the stimulation of glycolysis during ischaemia. Curr Biol 10:1247–1255. doi: 10.1016/S0960-9822(00)00742-9. [DOI] [PubMed] [Google Scholar]
- 54.Habegger KM, Hoffman NJ, Ridenour CM, Brozinick JT, Elmendorf JS. 2012. AMPK enhances insulin-stimulated GLUT4 regulation via lowering membrane cholesterol. Endocrinology 153:2130–2141. doi: 10.1210/en.2011-2099. [DOI] [PMC free article] [PubMed] [Google Scholar]
- 55.Yamaguchi S, Katahira H, Ozawa S, Nakamichi Y, Tanaka T, Shimoyama T, Takahashi K, Yoshimoto K, Imaizumi MO, Nagamatsu S, Ishida H. 2005. Activators of AMP-activated protein kinase enhance GLUT4 translocation and its glucose transport activity in 3T3-L1 adipocytes. Am J Physiol Endocrinol Metab 289:E643–E649. doi: 10.1152/ajpendo.00456.2004. [DOI] [PubMed] [Google Scholar]
- 56.Xu S, Schafer X, Munger J. 2016. Expression of oncogenic alleles induces multiple blocks to human cytomegalovirus infection. J Virol 90:4346–4356. doi: 10.1128/JVI.00179-16. [DOI] [PMC free article] [PubMed] [Google Scholar]
- 57.Wang D, Bresnahan W, Shenk T. 2004. Human cytomegalovirus encodes a highly specific RANTES decoy receptor. Proc Natl Acad Sci U S A 101:16642–16647. doi: 10.1073/pnas.0407233101. [DOI] [PMC free article] [PubMed] [Google Scholar]
- 58.Shalem O, Sanjana NE, Hartenian E, Shi X, Scott DA, Mikkelson T, Heckl D, Ebert BL, Root DE, Doench JG, Zhang F. 2014. Genome-scale CRISPR-Cas9 knockout screening in human cells. Science 343:84–87. doi: 10.1126/science.1247005. [DOI] [PMC free article] [PubMed] [Google Scholar]
- 59.Sanjana NE, Shalem O, Zhang F. 2014. Improved vectors and genome-wide libraries for CRISPR screening. Nat Methods 11:783–784. doi: 10.1038/nmeth.3047. [DOI] [PMC free article] [PubMed] [Google Scholar]
- 60.den Dunnen JT, Antonarakis SE. 2001. Nomenclature for the description of human sequence variations. Hum Genet 109:121–124. doi: 10.1007/s004390100505. [DOI] [PubMed] [Google Scholar]
- 61.Smith B, Schafer XL, Ambeskovic A, Spencer CM, Land H, Munger J. 2016. Addiction to coupling of the warburg effect with glutamine catabolism in cancer cells. Cell Rep 17:821–836. doi: 10.1016/j.celrep.2016.09.045. [DOI] [PMC free article] [PubMed] [Google Scholar]
- 62.Melamud E, Vastag L, Rabinowitz JD. 2010. Metabolomic analysis and visualization engine for LC-MS data. Anal Chem 82:9818–9826. doi: 10.1021/ac1021166. [DOI] [PMC free article] [PubMed] [Google Scholar]
- 63.Silva MC, Yu Q-C, Enquist L, Shenk T. 2003. Human cytomegalovirus UL99-encoded pp28 is required for the cytoplasmic envelopment of tegument-associated capsids. J Virol 77:10594–10605. doi: 10.1128/jvi.77.19.10594-10605.2003. [DOI] [PMC free article] [PubMed] [Google Scholar]