

We evaluated human-like the efficacy of intravenous doses of fosfomycin of 8 g every 8 h (8 g/Q8h) and of amikacin (15 mg/kg/Q24h) in monotherapy and in combination against six fosfomycin-heteroresistant Escherichia coli isolates using a hollow-fiber infection model (HFIM). Six fosfomycin-heteroresistant E. coli isolates (four with strong mutator phenotype) and the control strain E. coli ATCC 25922 were used.
KEYWORDS: Escherichia coli, fosfomycin, amikacin, heteroresistance, hollow-fiber infection model
ABSTRACT
We evaluated human-like the efficacy of intravenous doses of fosfomycin of 8 g every 8 h (8 g/Q8h) and of amikacin (15 mg/kg/Q24h) in monotherapy and in combination against six fosfomycin-heteroresistant Escherichia coli isolates using a hollow-fiber infection model (HFIM). Six fosfomycin-heteroresistant E. coli isolates (four with strong mutator phenotype) and the control strain E. coli ATCC 25922 were used. Mutant frequencies for rifampin (100 mg/liter), fosfomycin (50 and 200 mg/liter), and amikacin (32 mg/liter) were determined. Fosfomycin and amikacin MICs were assessed by agar dilution (AD), gradient strip assay (GSA), and broth microdilution (BMD). Fosfomycin and amikacin synergies were studied by checkerboard and time-kill assays at different concentrations. The efficacies of fosfomycin (8 g/Q8h) and amikacin (15 mg/kg/Q24h) alone and in combination were assessed using an HFIM. Five isolates were determined to be resistant to fosfomycin by AD and BMD, but all were determined to be susceptible by GSA. All isolates were determined to be susceptible to amikacin. Antibiotic combinations were synergistic in two isolates, and no antagonism was detected. In time-kill assays, all isolates survived under fosfomycin at 64 mg/liter, although at 307 mg/liter only the normomutators and two hypermutators survived. Four isolates survived under 16 mg/liter amikacin, and none survived at 45 mg/liter. No growth was detected under combination conditions. In HFIM, fosfomycin and amikacin monotherapies failed to sterilize bacterial cultures; however, the combination of fosfomycin and amikacin yielded a rapid eradication. There may be a risk of treatment failure of fosfomycin-heteroresistant E. coli isolates using either amikacin or fosfomycin in monotherapy. These results support that the amikacin-fosfomycin combination can rapidly decrease bacterial burden and prevent the emergence of resistant subpopulations against fosfomycin-heteroresistant strains.
INTRODUCTION
Bacterial resistance has been progressively rising in recent decades, translating into increased morbidity and mortality worldwide (1, 2). Fosfomycin is an old antimicrobial with activity against multidrug-resistant Gram-positive and Gram-negative bacteria (3, 4).
The performance and interpretation of fosfomycin susceptibility testing in Enterobacterales according to CLSI and EUCAST recommendations is sometimes difficult to implement in the daily routine of clinical laboratories and is highly dependent on multiple factors (5–8). These interpretations become even more complicated in the presence of fosfomycin-heteroresistant isolates. Heteroresistance is a phenotypic phenomenon that is defined in numerous ways, and its frequency in clinical isolates varies widely depending on the study (9, 10). In general, heteroresistance is considered to be the presence of subpopulations showing different levels of susceptibility to an antibiotic. Nicoloff et al. demonstrated for several antimicrobial agents, but not specifically for fosfomycin, that the high prevalence of antibiotic heteroresistance is mainly caused by spontaneous tandem amplification, typically involving known resistance genes (11). Recently, we observed that fosfomycin heteroresistance may be related to a hypermutator phenotype, sometimes based on a genetic background of mutations in DNA repair system genes, which when combined with preexisting mutations in fosfomycin-resistance-related genes can increase the possibility of fosfomycin-resistant subpopulations appearing in the total bacterial population.
Furthermore, non-pharmacokinetic/pharmacodynamic (non-PK/PD) in vitro studies have demonstrated that fosfomycin-heteroresistant isolates can survive at high fosfomycin concentrations, depending on the fosfomycin MICs of subpopulations, mutation rates, and the bacterial inoculum. Nevertheless, the real impact of fosfomycin-heteroresistant isolates on clinical outcome is still unknown (12). Numerous in vitro and in vivo studies have shown the efficacy of a fosfomycin-amikacin combination against multidrug-resistant bacteria (13–17). However, the effectiveness of this combination has not been explored against fosfomycin-heteroresistant strains.
The main purpose of our study was to study the efficacy of humanized fosfomycin and amikacin intravenous doses alone and in combination against six fosfomycin-heteroresistant Escherichia coli isolates in a hollow-fiber infection model (HFIM).
(This study was previously published in part in the Abstract Book of the 30th ECCMID 2020, abstract 3443.)
RESULTS
Rifampin, fosfomycin, and amikacin mutant frequency estimation.
The results of mutant frequency estimations are shown in Fig. S1 in the supplemental material. The Ec3203 and Ec50406 isolates and the control strain showed mutant frequencies to rifampin below 10−7 and were classified as normomutator isolates. C59, C61, C74, and P45 were classified as hypermutator isolates based on mutant frequencies to rifampin above 10−7. On the other hand, higher fosfomycin-resistant mutant frequencies were observed among normomutators than hypermutators (mean mutant frequencies on fosfomycin at 50 mg/liter of 7.83 × 10⁻³ versus 3.43 × 10⁻⁵ and on fosfomycin at 200 mg/liter of 1.51 × 10⁻⁵ versus 7.09 × 10⁻⁸, respectively). Mutant frequencies to amikacin at 32 mg/liter were below 10−7 in all isolates. P45, Ec50406, and the control strain did not present any resistant bacterial populations at 32 mg/liter of amikacin.
Bacterial susceptibility.
The fosfomycin MICs determined by broth microdilution (BMD), agar dilution (AD), and gradient strip assay (GSA) and the amikacin MICs determined by BMD and GSA are shown in Table 1 (fosfomycin GSA results are shown in Fig. S2). All of the isolates were considered resistant to fosfomycin by BMD with MIC values between 64 and ≥512 mg/liter, except for C59 and the control strain, with MICs of 16 and 2 mg/liter, respectively. Similar results were observed by AD. However, by GSA, after following the EUCAST recommendation for disk diffusion assays to ignore isolated colonies inside the inhibition zone, all isolates were categorized as susceptible, with MIC values below 8 mg/liter. Up to eleven 2-fold dilution differences in fosfomycin MIC values were observed between the two methods in the Ec3203 isolate. Conversely, there were no discrepancies between amikacin clinical categories obtained by BMD or GSA in any isolate. All were considered susceptible by both methods (BMD MICs, 8 to 2 mg/liter; GSA MICs, 2 to 1 mg/liter). The greatest differences between amikacin MICs depending on the method used were observed in C59, C61, and C74 isolates, with two 2-fold dilution differences.
TABLE 1.
Fosfomycin and amikacin MICs as determined by broth microdilution, gradient strip assay, and agar dilution (only fosfomycin) and their corresponding clinical categoriesa
| Isolate | Fosfomycin MIC (mg/liter) |
Amikacin MIC (mg/liter) |
|||||
|---|---|---|---|---|---|---|---|
| BMD | AD | GSA |
BMD | GSA |
|||
| MP | SP | MP | SP | ||||
| Control strain | |||||||
| ATCC 25922 | 2 (S) | 2 (S) | 0.5 (S) | 1 (S) | 2 (S) | 2 (S) | NF |
| Heteroresistant (hypermutable) | |||||||
| C59 | 16 (S) | 32 (S) | 0.125 (S) | 16 (S) | 8 (S) | 2 (S) | NF |
| C61 | 256 (R) | 64 (R) | 0.25 (S) | 32 (S) | 8 (S) | 2 (S) | NF |
| C74 | 256 (R) | 128 (R) | 0.25 (S) | 32 (S) | 8 (S) | 2 (S) | NF |
| P45 | 64 (R) | 64 (R) | 0.06 (S) | 16 (S) | 2 (S) | 1 (S) | NF |
| Heteroresistant (normomutable) | |||||||
| Ec3203 | 512 (R) | 256 (R) | 0.25 (S) | 512 (R) | 4 (S) | 2 (S) | NF |
| Ec50406 | ≥512 (R) | 256 (R) | 4 (S) | 512 (R) | 4 (S) | 1 (S) | NF |
S, susceptible; R resistant; NF, not found. MICs were determined by broth microdilution (BMD), gradient strip assay (GSA), and agar dilution (only fosfomycin) (AD). MP, main population; SP, subpopulation.
Whole-genome sequencing.
Whole-genome sequencing analysis showed many different polymorphisms in the amino acid sequences (see Table S1 in the supplemental material). Detailed results are presented in the supplemental material. A list of nonsynonymous mutations found in genes related to E. coli DNA repair system and fosfomycin-related resistance is shown in Table S2.
Synergy assay.
According to the fractional inhibitory concentration index (FICI) results (means ± the standard deviations [SD]), synergy between fosfomycin and amikacin was observed for C59 (0.22 ± 0.08), C61 (0.14 ± 0.02), C74 (0.22 ± 0.07), P45 (0.23 ± 0.04), Ec3203 (0.33 ± 0.14), and Ec50406 (0.50 ± 0.01) strains, and no interaction was found for ATCC 25922 (0.63 ± 0.22) strain (Fig. 1; see also Table S4 in the supplemental material). Inhibition scores (that is, the average zero interaction potency [ZIP] scores) from the full dose-response matrices classed the antibiotic combinations as additive in C59, C61, P45, and Ec50406 isolates and in the control strain, with scores between 4.5 and 7.5%. In C74 and Ec3203 isolates, the ZIP scores were 14.33 and 19.76%, respectively, which was interpreted as a synergistic interaction between the two drugs. No antagonistic ZIP scores were obtained for any replicate.
FIG 1.
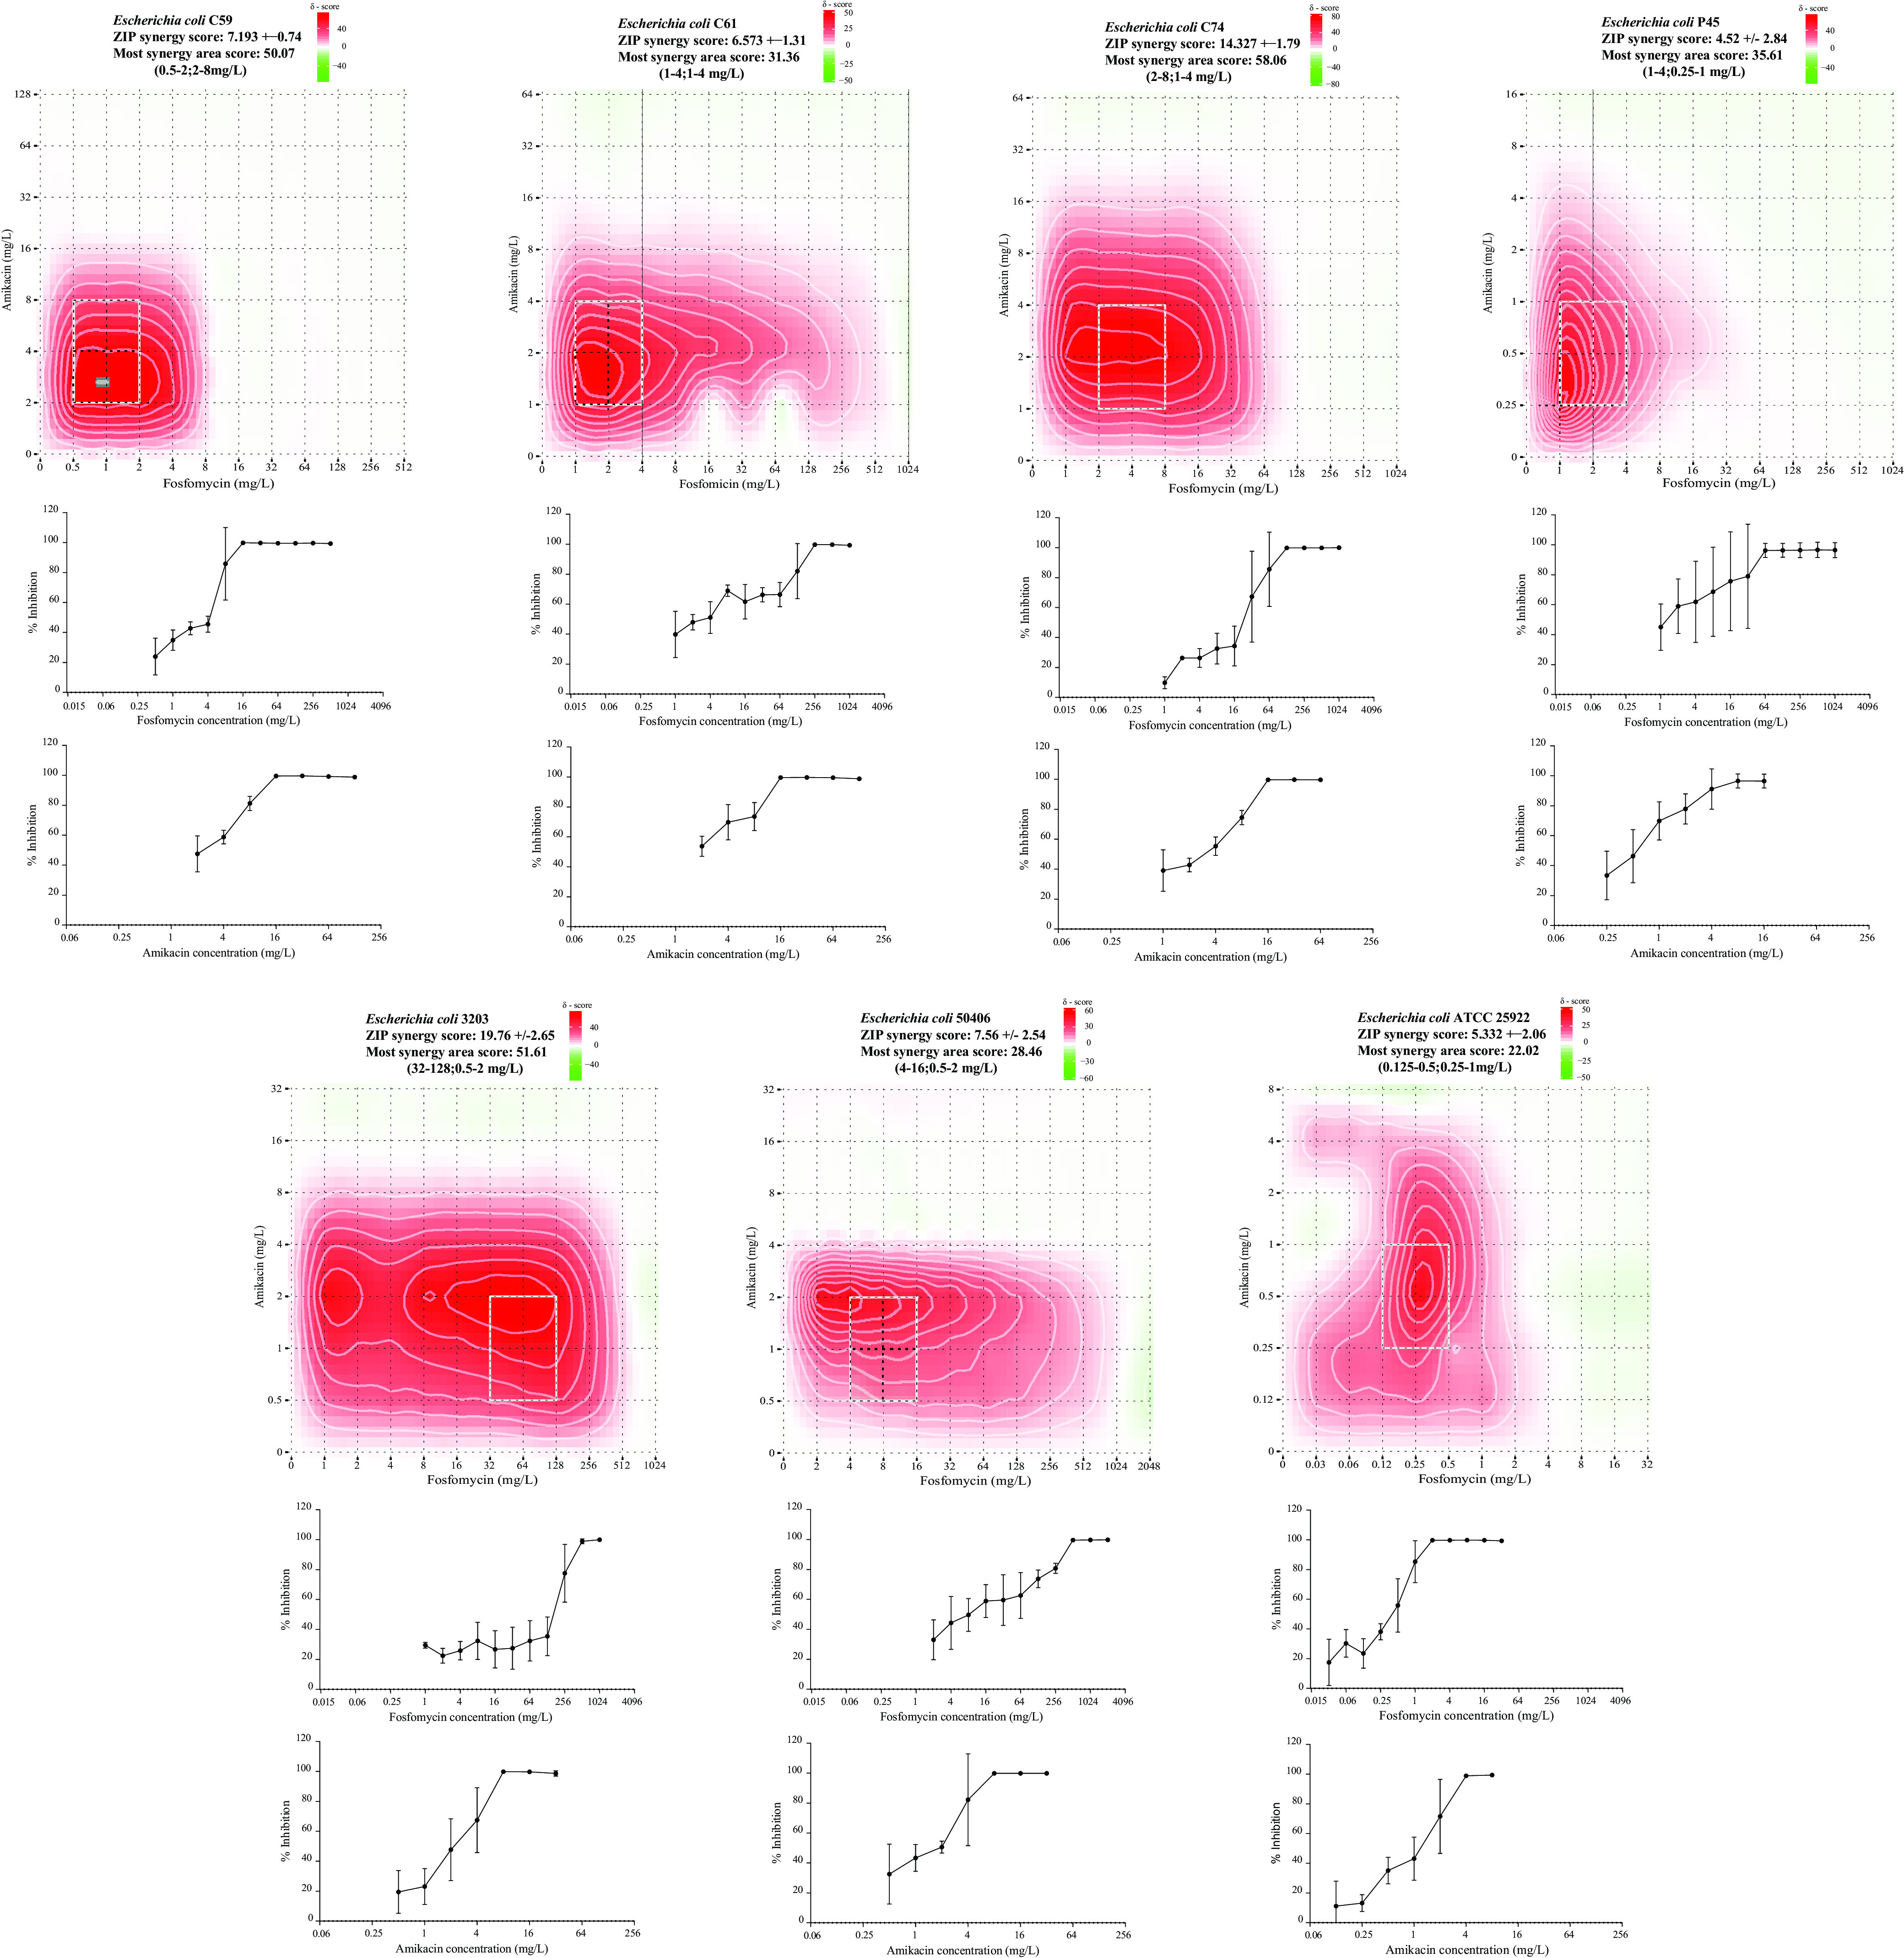
Drug interaction scores were calculated and are represented as δ scores on heatmaps obtained from the full ZIP model matrix analysis of the checkerboard assays using different fosfomycin and amikacin concentration ranges. The full matrix averages of three replicates are expressed as ZIP score ± the SD. Red and green areas represent synergy and antagonism, respectively. White rectangles show the maximum synergy area. Dose-response curves for fosfomycin and amikacin (mean ± SD) are found below each heatmap.
ZIP scores in the most synergistic area of the summary matrix for each isolate were all >15%. The areas with the highest bacterial inhibition scores were observed for amikacin concentrations below 8 mg/liter (0.25 to 8 mg/liter) combined with fosfomycin concentrations below 16 mg/liter (0.125 to 16 mg/liter), except in isolate Ec3203, where the most synergistic fosfomycin concentrations were higher (32 to 128 mg/liter). The strongest inhibition scores from the most synergistic areas of the summary matrices were observed in C59 and Ec3203 isolates, with values of >50%. The most synergistic area scores for C59 and Ec3203 were observed at fosfomycin concentration ranges of 0.5 to 2 mg/liter and 32 to 128 mg/liter combined with amikacin concentrations between 2 and 8 mg/liter and between 0.5 and 2 mg/liter, respectively. ZIP scores and most synergistic area scores for each isolate are summarized in Table S4.
In vitro fosfomycin and amikacin activity by time-kill assays.
Fosfomycin time-kill assays showed that all hypermutator isolates were able to survive after 48 h at fosfomycin concentrations of 64 mg/liter (see Fig. S3 in the supplemental material), although at 307 mg/liter fosfomycin-resistant subpopulations were only detected in C74 and P45 isolates. At 64 and 307 mg/liter, fosfomycin-resistant subpopulations were detected in the normomutator isolates, Ec3203 and Ec50406. The control strain did not survive any fosfomycin exposure. Isolates that grew after 48 h at any antibiotic concentration presented fosfomycin MICs of ≥1,024 mg/liter by GSA.
Time-kill assays with amikacin (see Fig. S4) at 16 mg/liter showed that almost all isolates survived under these conditions, except for P45 and Ec50406, although none of the isolates grew at the maximum amikacin concentration tested (45 mg/liter). The control strain survived after 48 h at 16 mg/liter of amikacin. The MICs of isolates that survived after 48 h with amikacin were determined to be ≥16 mg/liter by GSA.
In the combination experiments with fosfomycin and amikacin, no growth was detected in the isolates, including the control strain, after the first 6 h (see Fig. S5). In addition, while fosfomycin-resistant subpopulations were detected in all isolates growing at 64 mg/liter after 48 h in drug-free controls, the emergence of amikacin-resistant subpopulations was not observed.
Hollow-fiber infection model.
(i) Fosfomycin and amikacin pharmacokinetics. The observed versus predicted concentrations of fosfomycin and amikacin concentrations in the HFIM after fosfomycin (8 g/Q8h) and amikacin (15 mg/kg/Q24h) dosages are shown in Fig. S6A and C in the supplemental material. Correlations between predicted and observed fosfomycin and amikacin pharmacokinetic profiles in the HFIM are shown in Fig. S6B and D for fosfomycin (R2 = 0.96; intercept, 17.939 [95% CI, 7.14 to 28.78]; slope, 1.06 [95% CI, 0.889 to 0.99]) and amikacin (R2 = 0.97; intercept, −0.81 [95% CI, −1.64 to 0.01]; slope, 0.97 [95% CI, 0.93 to 1.01]).
(ii) Fosfomycin and amikacin in monotherapy. The fosfomycin monotherapy regimen (8 g/Q8h [24 g/day]) failed to eradicate bacterial cultures of all clinical isolates (see fosfomycin MICs of the main and subpopulations in Table 1). While Ec3203 and Ec50406 (normomutators) showed a mild or no decrease in bacterial concentration after fosfomycin exposure, the hypermutators showed strong bacterial reduction (1 to 5 log10 CFU/ml). However, both hypermutators and normomutators showed rapid growth of fosfomycin-resistant bacterial populations during the first 24 h of treatment (Fig. 2). The presence of fosfomycin-resistant subpopulations was also observed in the control assays (without fosfomycin) in the first 24 h. Fosfomycin treatment was rapidly bactericidal only against the control strain, where no bacterial growth was detected beyond the first 2 h of the assay.
FIG 2.
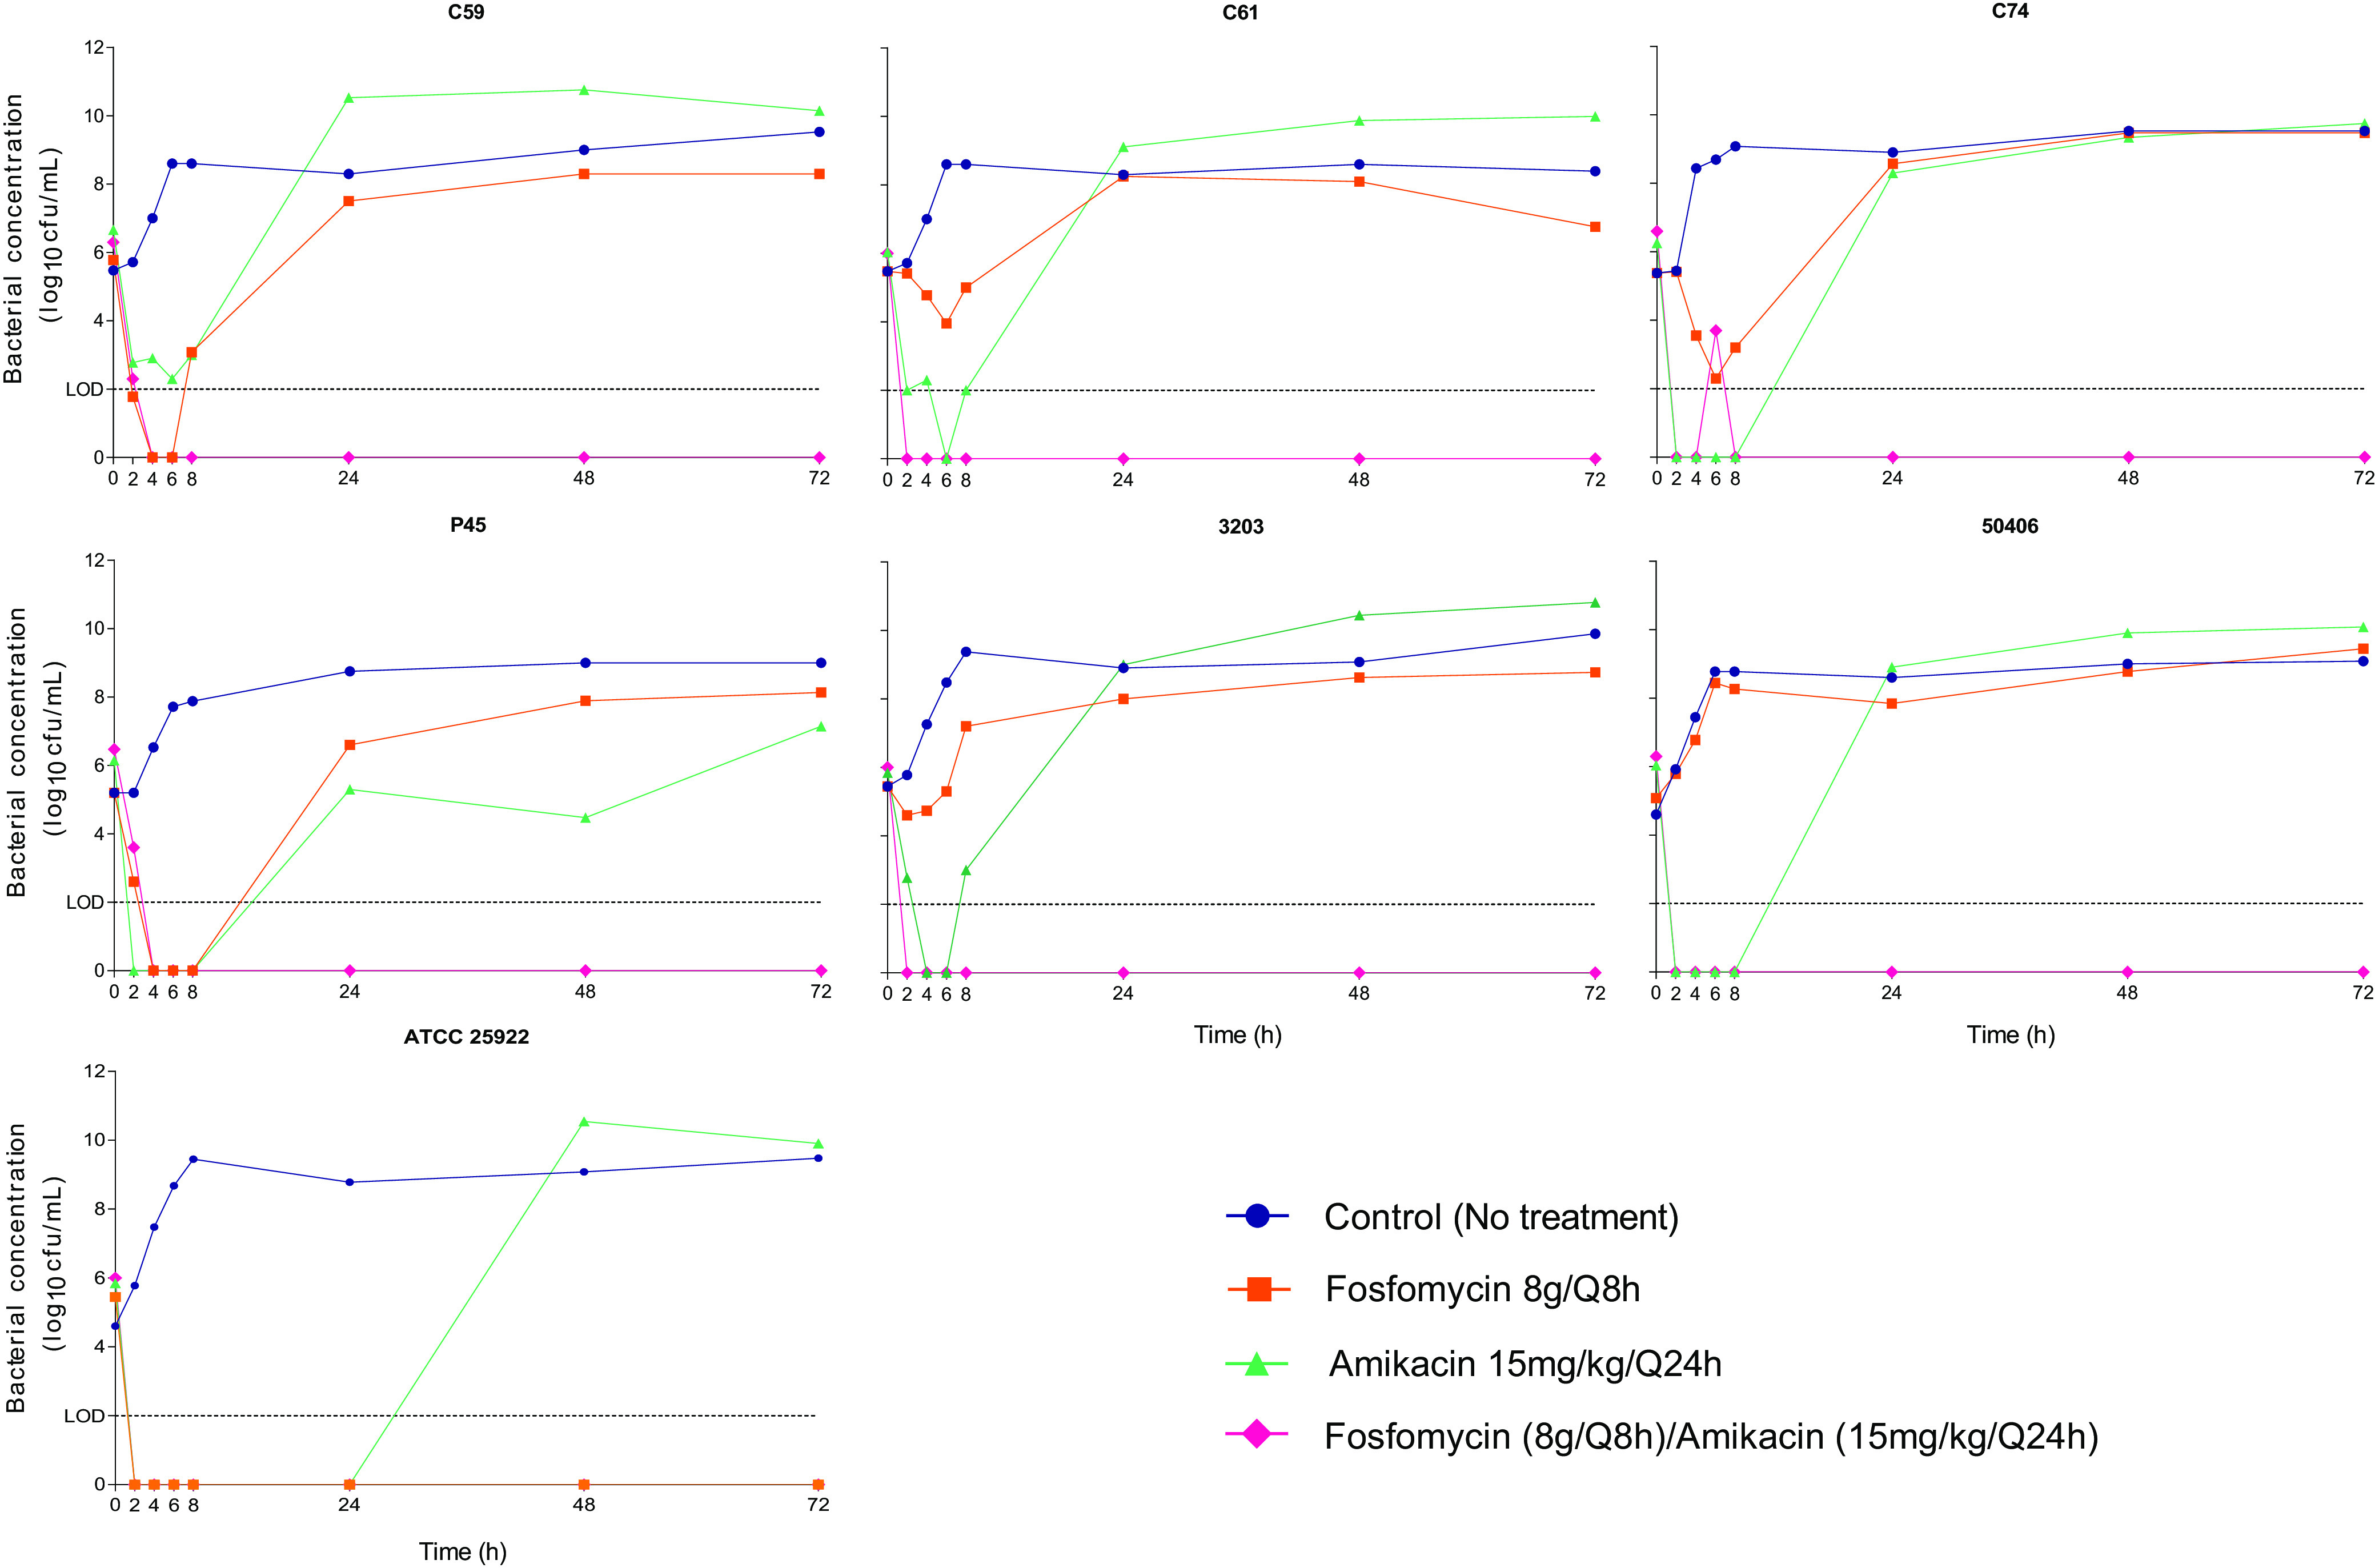
HFIM of fosfomycin-heteroresistant E. coli isolates and the control strain E. coli ATCC 25922 mimicking a fosfomycin dosage of 8 g/Q8h, an amikacin dosage of 15 mg/kg/Q24h, and dosages of fosfomycin (8 g/Q8h) and amikacin (15 mg/kg/Q24h) in combination. Filled symbols indicate total bacterial population concentrations. The limit of detection (LOD) was set at 2 log10 CFU/ml.
Amikacin monotherapy (15 mg/kg/Q24h) likewise failed to eradicate the bacterial burden in the HFIM (Fig. 2). A strong decrease in bacterial concentration was observed, with bacterial reductions ranging from approximately 2 to 5 log10 CFU/ml. However, all isolates (see amikacin MICs in Table 1), including the control strain, survived amikacin treatment after the emergence of amikacin-resistant populations, and stable amikacin-resistant subpopulations able to grow at a concentration of 32 mg/liter were detected in every isolate except for Ec50406 and the control strain. Bacterial growth under an amikacin regimen was detected in the first 24 h, except in the control strain, which showed delayed regrowth. Isolates that grew in the drug-containing plates after 72 h in each monotherapy study presented stable resistance, with MICs of ≥1,024 mg/liter for fosfomycin and ≥16 mg/liter for amikacin by GSA.
(iii) Fosfomycin-amikacin combination. The combination of fosfomycin with amikacin yielded rapid eradication of the bacterial cultures (Fig. 2). A >5-log10 CFU/ml reduction was observed in all isolates in the first 8 h of the assay. There was no further bacterial regrowth during the experiment (72 h). No fosfomycin- or amikacin-resistant subpopulations were detected in any isolate under combination treatment. No differences were detected in the efficacy of combination treatment among fosfomycin-heteroresistant strains (normomutators versus hypermutators).
DISCUSSION
From a clinical perspective, only EUCAST has recommendations to clarify the fosfomycin heteroresistance phenotype and suggests ignoring colonies present in the inhibition zone of the disk diffusion assay (6). However, this common phenotype among Enterobacterales (from 3 to 41%) is poorly understood specially under a therapeutic point of view, and thus the efficacy of fosfomycin alone or in combination with other antimicrobial agents against fosfomycin-heteroresistant isolates should be clarified (10, 18).
In the present study, the activity of fosfomycin alone and in combination with amikacin was evaluated against unrelated E. coli strains, 4 hypermutators and 2 normomutators, all with a fosfomycin heteroresistance phenotype. Among the normomutator isolates, no deletions or insertions were detected in the investigated DNA repair system genes, only polymorphisms of unknown impact. Nevertheless, these isolates presented mutations in glpT, the major E. coli uptake system for glycerol-3-phosphate, which is involved in fosfomycin intake (8, 19). This finding would partially explain the behavior of isolates in the presence of fosfomycin, since the frequency of spontaneous fosfomycin-resistant mutants has been shown to be increased in glpT alleles. In this genetic background, mutations in other fosfomycin-resistance-related genes may appear and predispose bacteria to select fosfomycin-resistant subpopulations in a stepwise manner. Nevertheless, inactivation of glpT alone does not explain the fosfomycin heteroresistance phenotype, so additional factors must be involved.
Even though all isolates presented fosfomycin MICs below 8 mg/liter by GSA when the EUCAST recommendation to ignore subpopulations within the inhibition zone was followed, the high-fosfomycin-dosing regimen failed to eradicate bacterial growth in the HFIM. Large fosfomycin-resistant subpopulations emerged in all assays with fosfomycin MICs ≥1,024 mg/liter. Fosfomycin monotherapy succeeded only against the control strain ATCC 25922, which is consistent with previous observations (20). Abbott et al., using a dynamic bladder infection in vitro model to assess high and low urinary fosfomycin exposures after a single or three repeat oral doses against 16 Enterobacterales clinical isolates (8 E. coli, 4 Enterobacter cloacae, and 4 Klebsiella pneumoniae isolates), showed that the factors that seem to predict better bacterial regrowth under fosfomycin oral treatment were the presence of a baseline high-level heteroresistance and the bacterial species (21).
Amikacin was selected as companion drug because is commonly used alone or as part of a combination therapy to treat serious infections caused by aerobic Gram-negative bacilli (22). Also, an intravenous amikacin once-daily dosage facilitates administration and possible combination with other drugs (23, 24). The absence of a negative interaction observed with fosfomycin in the synergy assays together within a therapeutic range supported the election of this antimicrobial for the subsequent experiments.
Regarding monotherapy with amikacin, resistant subpopulations grew in C59, C61, C74, P45, and Ec3203. These isolates resulted in stable resistance to amikacin after consecutive passages on amikacin-free plates. Despite the susceptibility to amikacin and the absence of resistant subpopulations in the controls (without amikacin), bacterial regrowth occurred in Ec50406 and the control strain. We suggest that unstable aminoglycoside resistance could explain the latter results. This has been observed previously, linked to the presence of compensatory mutations after point mutations and small deletions in genes related to small colony variants (11). Also, in consonance with our results, amikacin monotherapy failure against amikacin-susceptible Enterobacteriaceae has been previously observed. Yu et al., in an in vitro PK/PD study (25) against two amikacin-susceptible (MICs of 1 and 4 mg/liter), KPC2-producing K. pneumoniae strains, showed that amikacin monotherapies (7.5 or 15 mg/kg, administered as a single dose) failed to prevent the emergence of amikacin-resistant strains. Similarly, Bulman et al. showed, using an mcr-1- and blaNDM-5-carrying E. coli strain susceptible to amikacin (MIC = 4 mg/liter), a rapid emergence of amikacin-resistant strains after the administration of a simulated amikacin dose of 15 mg/kg in an HFIM (26). As in our study, we cannot rule out the possibility that these amikacin-resistant strains may failed to emerge in vivo due to any fitness cost or the presence of an immune system.
Several PK/PD studies have demonstrated that fosfomycin in monotherapy could fail even against fosfomycin-susceptible Gram-negative bacilli (20, 27–29), but in combination with different antimicrobials, including amikacin, has shown efficacy against multidrug-resistant E. coli, K. pneumoniae, and P. aeruginosa clinical isolates (16, 17, 27, 30, 31). Despite the different organisms and antimicrobial exposures, our results agree with those previously observed by Sime et al. in an HFIM in which the combination of aerosolized amikacin and fosfomycin effectively suppressed growth of resistant P. aeruginosa and K. pneumoniae strains (16).
Although adverse events are well known with amikacin, once-daily administration combined with a safe drug such as fosfomycin limits the length of antibiotic therapy and may reduce any potential adverse events. Despite of their methodological differences, checkerboard and time-kill assay results showed the most synergistic values using fosfomycin and amikacin combinations below maximum serum concentrations. Lower fosfomycin/amikacin dosing should be explored with the aim of minimizing potential adverse events in humans. The present study has several limitations. First, the HFIM fails to take into account the host immune response, where the exposure-response relationship may be different. Even so, the HFIM is qualified to be used in drug development programs as an additional and complementary tool along with existing methodology to inform the selection of dose and treatment regimen, including combinations of two or more drugs, to maximize bactericidal effects and minimize the emergence of drug resistance (32, 33). Another important limitation of the HFIM is that only two fixed fosfomycin and amikacin dosages were used, and we cannot rule out the possibility of preventing the emergence of resistance with lower fosfomycin or amikacin exposure.
In conclusion, the findings presented here demonstrate that there may be a risk of treatment failure of fosfomycin-heteroresistant isolates using either amikacin or fosfomycin in monotherapy. The results also support the amikacin-fosfomycin combination as able to rapidly decrease bacterial burden and prevent the the emergence of resistant subpopulations against fosfomycin-heteroresistant strains.
MATERIALS AND METHODS
Microorganisms.
A total of six fosfomycin-heteroresistant E. coli isolates (C59, C61, C74, P45, Ec3203, and Ec50406) belonging to sequence types ST68, ST1727, ST2522, ST12, ST131, and ST11151 were used. Isolates C59, C61, C74, and P45 were human commensals from feces and pathogenic isolates from urine cultures derived from previous studies (12), selected for their strong mutator phenotype. E. coli strains Ec3203 and Ec50406 were isolates collected from bacteremic urinary tract infections at the University Hospital Virgen Macarena. E. coli ATCC 25922 was used as the control strain.
Drugs.
Fosfomycin disodium salt (Sigma-Aldrich, Tres Cantos, Spain) and amikacin (Sigma-Aldrich) standard laboratory powder were used for mutant frequency estimations, susceptibility testing, synergy and time-kill assays, preparation of drug-containing agar plates, and bioanalytical methods. Rifampin (Sigma-Aldrich) was used exclusively for mutant frequency estimations. Portions (25 mg/liter) of glucose-6-phosphate (G6P; Sigma-Aldrich) were added to the media used for susceptibility testing, quantification of bacterial subpopulations in time-kill assays, and the HFIM. Clinical intravenous formulations of fosfomycin (Laboratorios ERN, Barcelona, Spain) and amikacin (Normon, Tres Cantos, Spain) were used for the HFIM experiments.
Rifampin, fosfomycin, and amikacin mutant frequency estimations.
The frequencies of spontaneous mutation to rifampin, fosfomycin, and amikacin were calculated for all isolates. Mutant frequencies to rifampin in C59, C61, C74, and P45 isolates were obtained from our previous study (12). Rifampin-, fosfomycin-, and amikacin-resistant mutant frequencies were determined as previously described (7). Select concentrations of rifampin (100 mg/liter), amikacin (32 mg/liter), and fosfomycin (50 and 200 mg/liter, with 25 mg/liter G6P) were used to estimate the frequencies of resistant subpopulations. Experiments were performed in duplicate. According to rifampin mutant frequencies, the strains were considered weak or normomutators if their frequency was 4 × 10⁻⁸ ≤ f < 4 × 10⁻⁷ and strong mutators if f ≥ 4 × 10⁻⁷ (34).
Susceptibility tests.
Fosfomycin MICs were determined by using BMD, AD, and GSA. Amikacin MICs were done using BMD and GSA. BMD and AD methods were performed using EUCAST recommendations. GSA was performed by streaking a 0.5 McFarland inoculum on Mueller-Hinton agar (MHA) and then applying the fosfomycin (bioMérieux, Madrid, Spain) or amikacin (Liofilchem, Roseto degli Abruzzi, Italy) test strips, followed by incubation at 37°C for 24 h. According to the EUCAST indications of ignoring isolated colonies within the inhibition zone for the disk diffusion method, the fosfomycin MICs of the main bacterial population and the subpopulations with increased MICs were recorded for the GSA. The MIC value at the intersection of the strip and the main bacterial population zone of inhibition was considered. The main bacterial population was the dense uniform biomass on the plate observable to the naked eye. MICs of subpopulations or spotted colonies with increased MICs were also recorded. Spotted colonies were considered as the appearance of distinct colonies growing within the clear zone of inhibition in the GSA (12). EUCAST recommendations and susceptibility breakpoints were followed.
Whole-genome sequencing analysis.
Whole-genome sequencing (see the supplemental material) was used to analyze changes in the amino acid sequences of proteins involved in some proteins implicated in DNA protection and repair systems or fosfomycin resistance and to identify acquired antimicrobial resistance genes and/or chromosomal mutations in order to complete information on the resistome (ResFinder 3.2, https://cge.cbs.dtu.dk/services/ResFinder/) and clonal relationships (https://cge.cbs.dtu.dk/services/MLST/; http://enterobase.warwick.ac.uk).
Synergy assay.
Fosfomycin and amikacin synergies were studied using the checkerboard assay, in triplicate. Briefly, flat-bottom 96-well plates were used, with an initial inoculum of 5 × 10⁵ CFU/ml (100 μl/well). Twofold dilutions of fosfomycin and amikacin were prepared in the range of 2,048 to 0.5 mg/liter and 64 to 0.25 mg/liter, respectively. One bacterium-free well and one drug-free well were used as negative and growth controls. Plates were incubated for 24 h at 37°C, and the optical density was quantified spectrophotometrically at 595 nm (Infinite200 Pro plate reader; Tecan). Interactions between the two antibiotics evaluated using the fractional inhibitory concentration indices (ΣFICs). ΣFIC = FICantibiotic A + FICantibiotic B, where FIC is the MIC of the substance in combination/MIC of the substance alone. The correlation between the ΣFIC and the effect of the combination was interpreted as follows: synergy of FICI ≤ 0.5, no interaction of FICI < 0.5 to 4 and antagonism of a FICI of >4 (35). Also, the degree of drug synergy over the full dose-response matrix was analyzed using the zero interaction potency (ZIP) response surface model (36). Detailed description of data analysis is presented in supplemental material. Depending on the ZIP scores, drug interactions were considered antagonistic (≤10%), additive (±10%), or synergistic (>10%). Model construction and synergy studies were performed using SynergyFinder (37).
In vitro fosfomycin and amikacin activity by time-kill assays.
In vitro fosfomycin and amikacin activity, alone and in combination, was assessed by time-kill assays. A starting bacterial inoculum of 5 × 10⁵ CFU/ml in 20 ml was used. The activity of fosfomycin and amikacin alone at concentrations of 64 and 16 mg/liter (lowest concentrations of fosfomycin and amikacin in the nonsusceptible category according to EUCAST breakpoints) and at 307 and 45 mg/liter (mean maximum plasma concentrations in humans at steady-state after a dose of fosfomycin 8 g/Q8h and amikacin 15 mg/kg/Q24h [23, 38–40]), respectively, were determined. The activity of the two antimicrobials in combination was assessed using 64 mg/liter of fosfomycin and 16 mg/liter of amikacin.
Bacterial growth was quantified at 0, 2, 6, 24, and 48 h after incubation with shaking at 37°C. Samples were washed in saline to avoid the carryover effect and then diluted and plated on drug-free (total viable population) and on fosfomycin (64 mg/liter) and amikacin (32 mg/liter) MHA plates (resistant population count). The limit of detection was 2 log10 CFU/ml. When growth was observed after 48 h, up to three colonies were selected to assess fosfomycin and amikacin MICs using the GSA. The isolates were serially passaged three times on drug-free plates to assess the stability of the phenotype.
Hollow-fiber infection model.
Fosfomycin, amikacin alone and in combination against all isolates were investigated in an HFIM as previously described (32). Polyethersulfone hemofilters where used as hollow-fiber cartridges (Aquamax HF03, Nikkiso, Belgium). The fosfomycin and amikacin concentration-time profiles were adjusted to mimic those observed in human plasma after intravenous administration of 8 g/Q8h and 15 mg/kg/Q24h [23, 38–40]), respectively. Since plasma protein binding of fosfomycin has been reported to be negligible and of amikacin between 0 and 11% (23, 38, 39), it was assumed that the drug concentrations used in the HFIM constituted the unbound fraction. A one-compartment PK model was fitted to the in vitro fosfomycin and amikacin concentration data. Based on the in silico simulations in ADAPT (17), antimicrobial concentration-time profiles were executed in the HFIM by adjusting the flow rates to replicate target concentrations and half-lives (elimination half-life of 4 h for fosfomycin and 2 h for amikacin [23, 38, 39]). The extracapillary space of each HFIM was inoculated with 50 ml of bacterial suspension using an inoculum of ∼106 CFU/ml and incubated at 37°C. Bacterial densities were determined at 0, 2, 4, 6, 8, 24, 48, and 72 h. Serial dilutions were then plated on both drug-free and drug-containing MHA plates (fosfomycin at 64 mg/liter or amikacin at 32 mg/liter) to count total and resistant bacterial populations, respectively. The same method was performed for the fosfomycin-amikacin combination, adapting the HFIM to the respective half-lives and doses as previously described (41).
Resistant bacterial populations were selected by plating them simultaneously onto both fosfomycin (64 mg/liter) and amikacin (32 mg/liter) MHA plates and then comparing them with total bacterial populations on drug-free MHA plates. When growth was observed after 72 h, up to three colonies were selected to assess fosfomycin and amikacin MICs using the GSA. The isolates were serially passaged three times on drug-free plates to assess the stability of the phenotype.
Drug concentrations.
The fosfomycin and amikacin concentrations were determined using an UHPLC/MS-MS Triple-Quadrupole 6420 mass spectrometer (Agilent Technologies, Santa Clara, CA) during the first dosing interval and at steady state. One milliliter was drawn from the central compartment at days 1 and 2 at selected time points from the monotherapy and combination experiments. Samples were immediately stored at −80°C until analysis.
Fosfomycin concentrations were measured using tandem mass spectroscopy as described by Li et al. (42). The interday assay coefficient of variation for fosfomycin in broth was ≤10%, with an accuracy range of 91.5 to 109.9%. The lower limit of quantification assay for broth was 1 mg/liter, with precision of coefficient of variation of <15% and accuracy range of 88.5 to 112.8%. The assay was linear over its working range (1 to 1,000 mg/liter).
Amikacin concentrations were measured using tandem mass spectroscopy as previously described by Dijkstra et al. (43). The interday assay coefficient of variation of amikacin in broth was ≤8.5%, with an accuracy range of 94.6 to 102.8%. The lower limit of quantification assay for broth was 1 mg/liter, with a coefficient of variation for precision <10% and an accuracy range of 93.2 to 104.1%. The assay was linear over its working range (1 to 250 mg/liter).
Supplementary Material
ACKNOWLEDGMENTS
This study was supported by Plan Nacional de I+D+i 2013-2016 and Instituto de Salud Carlos III, Subdirección General de Redes y Centros de Investigación Cooperativa, Ministerio de Economía, Industria y Competitividad, Spanish Network for Research in Infectious Diseases (PI16/01824, REIPI RD12/0015/0010, and REIPI RD16/0016/0001), cofinanced by European Development Regional Fund “A Way to Achieve Europe” (Operative Program Intelligent Growth 2014-2020).
The funders had no role in the design, collection of data, analysis, and writing of the manuscript or the decision to publish.
J.R.-B. has been a scientific coordinator of a research project, funded by AstraZeneca, unrelated to the present study and a speaker at accredited educational activities funded by Merck through unrestricted grants. J.R.-B. and A.P. received funding for research from COMBACTE-NET (grant 115523), COMBACTE-CARE (grant 115620), and COMBACTE-MAGNET (grant 115737) projects under the Innovative Medicines Initiative, the European Union, and EFPIA companies in kind.
Footnotes
Supplemental material is available online only.
REFERENCES
- 1.Cassini A, Högberg LD, Plachouras D, Quattrocchi A, Hoxha A, Simonsen GS, Colomb-Cotinat M, Kretzschmar ME, Devleesschauwer B, Cecchini M, Ouakrim DA, Oliveira TC, Struelens MJ, Suetens C, Monnet DL, Strauss R, Mertens K, Struyf T, Catry B, Latour K, Ivanov IN, et al. 2019. Attributable deaths and disability-adjusted life-years caused by infections with antibiotic-resistant bacteria in the EU and the European Economic Area in 2015: a population-level modeling analysis. Lancet Infect Dis 19:56–66. doi: 10.1016/S1473-3099(18)30605-4. [DOI] [PMC free article] [PubMed] [Google Scholar]
- 2.O’Neill J. 2016. Review on antibiotic resistance. antimicrobial resistance: tackling a crisis for the health and wealth of nations. Review on Antimicrobial Resistance, London, United Kingdom. https://amr-review.org/sites/default/files/160525_Final%20paper_with%20cover.pdf. [Google Scholar]
- 3.Zilberberg MD, Nathanson BH, Sulham K, Shorr AF. 2020. Antimicrobial susceptibility and cross-resistance patterns among common complicated urinary tract infections in U.S. hospitals, 2013 to 2018. Antimicrob Agents Chemother 64:e00346-20. doi: 10.1128/AAC.00346-20. [DOI] [PMC free article] [PubMed] [Google Scholar]
- 4.Demirci-Duarte S, Unalan-Altintop T, Eser OK, Cakar A, Altun B, Sancak B, Gur D. 2020. Prevalence of O25b-ST131 clone and fosfomycin resistance in urinary Escherichia coli isolates and their relation to CTX-M determinant. Diagn Microbiol Infect Dis 98:115098. doi: 10.1016/j.diagmicrobio.2020.115098. [DOI] [PubMed] [Google Scholar]
- 5.Clinical Laboratory Standard Institute. 2020. Performance standards for antimicrobial susceptibility testing, 30th ed. CLSI supplement M100. Clinical and Laboratory Standards Institute, Wayne, PA. [Google Scholar]
- 6.European Committee on Antimicrobial Susceptibility Testing. 2021. Breakpoint tables for interpretation of MICs and zone diameters, version 11.0. EUCAST, Basel, Switzerland. [Google Scholar]
- 7.Ballestero-Téllez M, Docobo-Pérez F, Portillo-Calderón I, Rodríguez-Martínez JM, Racero L, Ramos-Guelfo MS, Blázquez J, Rodríguez-Baño J, Pascual A. 2017. Molecular insights into fosfomycin resistance in Escherichia coli. J Antimicrob Chemother 72:1303–1309. doi: 10.1093/jac/dkw573. [DOI] [PubMed] [Google Scholar]
- 8.Castañeda-García A, Blázquez J, Rodríguez-Rojas A. 2013. Molecular mechanisms and clinical impact of acquired and intrinsic fosfomycin resistance. Antibiotics 2:217–236. doi: 10.3390/antibiotics2020217. [DOI] [PMC free article] [PubMed] [Google Scholar]
- 9.Andersson DI, Nicoloff H, Hjort K. 2019. Mechanisms and clinical relevance of bacterial heteroresistance. Nat Rev Microbiol 17:479–496. doi: 10.1038/s41579-019-0218-1. [DOI] [PubMed] [Google Scholar]
- 10.Lucas AE, Ito R, Mustapha MM, McElheny CL, Mettus RT, Bowler SL, Kantz SF, Pacey MP, Pasculle AW, Cooper VS, Doi Y. 2017. Frequency and mechanisms of spontaneous fosfomycin nonsusceptibility observed upon disk diffusion testing of Escherichia coli. J Clin Microbiol 56:e01368-17. doi: 10.1128/JCM.01368-17. [DOI] [PMC free article] [PubMed] [Google Scholar]
- 11.Nicoloff H, Hjort K, Levin BR, Andersson DI. 2019. The high prevalence of antibiotic heteroresistance in pathogenic bacteria is mainly caused by gene amplification. Nat Microbiol 4:504–514. doi: 10.1038/s41564-018-0342-0. [DOI] [PubMed] [Google Scholar]
- 12.Portillo-Calderón I, Ortiz-Padilla M, Rodríguez-Martínez JM, de Gregorio-Iaria B, Blázquez J, Rodríguez-Baño J, Pascual A, Docobo-Pérez F. 2020. Contribution of hypermutation to fosfomycin heteroresistance in Escherichia coli. J Antimicrob Chemother 75:2066–2075. doi: 10.1093/jac/dkaa131. [DOI] [PubMed] [Google Scholar]
- 13.Sugathan S, Mandal J. 2019. An in vitro experimental study of the effect of fosfomycin in combination with amikacin, ciprofloxacin, or meropenem on biofilm formation by multidrug-resistant urinary isolates of Escherichia coli. J Med Microbiol 68:1699–1706. doi: 10.1099/jmm.0.001061. [DOI] [PubMed] [Google Scholar]
- 14.Lee S-Y, Park Y-J, Yu JK, Jung S, Kim Y, Jeong SH, Arakawa Y. 2012. Prevalence of acquired fosfomycin resistance among extended-spectrum β-lactamase-producing Escherichia coli and Klebsiella pneumoniae clinical isolates in Korea and IS26-composite transposon surrounding fosA3. J Antimicrob Chemother 67:2843–2847. doi: 10.1093/jac/dks319. [DOI] [PubMed] [Google Scholar]
- 15.Vergara-López S, Carmen Domínguez M, Carmen Conejo M, Pascual Á, Rodríguez-Baño J. 2015. Prolonged treatment with large doses of fosfomycin plus vancomycin and amikacin in a case of bacteremia due to methicillin-resistant Staphylococcus epidermidis and IMP-8 metallo-β-lactamase-producing Klebsiella oxytoca. J Antimicrob Chemother 70:313–315. doi: 10.1093/jac/dku341. [DOI] [PubMed] [Google Scholar]
- 16.Sime FB, Johnson A, Whalley S, Santoyo-Castelazo A, Montgomery AB, Walters KA, Lipman J, Hope WW, Roberts JA. 2017. Pharmacodynamics of aerosolized fosfomycin and amikacin against resistant clinical isolates of Pseudomonas aeruginosa and Klebsiella pneumoniae in a hollow-fiber infection model: experimental basis for combination therapy. Antimicrob Agents Chemother 61:e01763-16. doi: 10.1128/AAC.01763-16. [DOI] [PMC free article] [PubMed] [Google Scholar]
- 17.Yu W, Zhou K, Guo L, Ji J, Niu T, Xiao T, Shen P, Xiao Y. 2017. In vitro pharmacokinetics/pharmacodynamics evaluation of fosfomycin combined with amikacin or colistin against KPC2-producing Klebsiella pneumonia. Front Cell Infect Microbiol 7:246. doi: 10.3389/fcimb.2017.00246. [DOI] [PMC free article] [PubMed] [Google Scholar]
- 18.Kaase M, Szabados F, Anders A, Gatermann SG. 2014. Fosfomycin susceptibility in carbapenem-resistant Enterobacteriaceae from Germany. J Clin Microbiol 52:1893–1897. doi: 10.1128/JCM.03484-13. [DOI] [PMC free article] [PubMed] [Google Scholar]
- 19.Law CJ, Enkavi G, Wang DN, Tajkhorshid E. 2009. Structural basis of substrate selectivity in the glycerol-3-phosphate: phosphate antiporter GlpT. Biophys J 97:1346–1353. doi: 10.1016/j.bpj.2009.06.026. [DOI] [PMC free article] [PubMed] [Google Scholar]
- 20.VanScoy B, McCauley J, Bhavnani SM, Ellis-Grosse EJ, Ambrose PG. 2016. Relationship between fosfomycin exposure and amplification of Escherichia coli subpopulations with reduced susceptibility in a hollow-fiber infection model. Antimicrob Agents Chemother 60:5141–5145. doi: 10.1128/AAC.00355-16. [DOI] [PMC free article] [PubMed] [Google Scholar]
- 21.Abbott IJ, Van Gorp E, Wijma RA, Meletiadis J, Roberts JA, Peleg AY, Mouton JW. 2020. Oral fosfomycin efficacy with variable urinary exposures following single and multiple doses against Enterobacterales: the importance of heteroresistance for growth outcome. Antimicrob Agents Chemother 64:e01982-19. doi: 10.1128/AAC.01982-19. [DOI] [PMC free article] [PubMed] [Google Scholar]
- 22.Kumana CR, Yuen KY. 1994. Parenteral aminoglycoside therapy: selection, administration, and monitoring. Drugs 47:902–913. doi: 10.2165/00003495-199447060-00004. [DOI] [PubMed] [Google Scholar]
- 23.Medicamentos y Productos Sanitarios. 2011. Amikacina. Agencia Española de Medicamentos y Productos Sanitarios, Madrid, Spain. [Google Scholar]
- 24.Munckhof WJ, Grayson ML, Turnidge JD. 1996. A meta-analysis of studies on the safety and efficacy of aminoglycosides given either once daily or as divided doses. J Antimicrob Chemother 37:645–663. doi: 10.1093/jac/37.4.645. [DOI] [PubMed] [Google Scholar]
- 25.Yu W, Zhou K, Guo L, Ji J, Niu T, Xiao T, Shen P, Xiao Y. 2017. In vitro pharmacokinetics/pharmacodynamics evaluation of fosfomycin combined with amikacin or colistin against KPC2-producing Klebsiella pneumoniae. Front Cell Infect Microbiol 7:246. doi: 10.3389/fcimb.2017.00246. [DOI] [PMC free article] [PubMed] [Google Scholar]
- 26.Bulman ZP, Chen L, Walsh TJ, Satlin MJ, Qian Y, Bulitta JB, Peloquin CA, Holden PN, Nation RL, Li J, Kreiswirth BN, Tsuji BT. 2017. Polymyxin combinations combat Escherichia coli harboring mcr-1 and blaNDM-5: preparation for a postantibiotic era. mBio 8:e00540-17. doi: 10.1128/mBio.00540-17. [DOI] [PMC free article] [PubMed] [Google Scholar]
- 27.Docobo-Pérez F, Drusano GL, Johnson A, Goodwin J, Whalley S, Ramos-Martín V, Ballestero-Tellez M, Rodriguez-Martinez JM, Conejo MC, Van Guilder M, Rodríguez-Baño J, Pascual A, Hope WW. 2015. Pharmacodynamics of fosfomycin: insights into clinical use for antimicrobial resistance. Antimicrob Agents Chemother 59:5602–5610. doi: 10.1128/AAC.00752-15. [DOI] [PMC free article] [PubMed] [Google Scholar]
- 28.Diep JK, Sharma R, Ellis-Grosse EJ, Abboud CS, Rao GG. 2017. Evaluation of activity and emergence of resistance of polymyxin B and ZTI-01 (fosfomycin for injection) against KPC-producing klebsiella pneumoniae. Antimicrob Agents Chemother 62:e01815-17. doi: 10.1128/AAC.01815-17. [DOI] [PMC free article] [PubMed] [Google Scholar]
- 29.Louie A, Maynard M, Duncanson B, Nole J, Vicchiarelli M, Drusano GL. 2018. Determination of the dynamically linked indices of fosfomycin for Pseudomonas aeruginosa in the hollow fiber infection model. Antimicrob Agents Chemother 62:e02627-17. doi: 10.1128/AAC.02627-17. [DOI] [PMC free article] [PubMed] [Google Scholar]
- 30.Zhao M, Bulman ZP, Lenhard JR, Satlin MJ, Kreiswirth BN, Walsh TJ, Marrocco A, Bergen PJ, Nation RL, Li J, Zhang J, Tsuji BT. 2017. Pharmacodynamics of colistin and fosfomycin: a “treasure trove” combination combats KPC-producing Klebsiella pneumoniae. J Antimicrob Chemother 72:1985–1990. doi: 10.1093/jac/dkx070. [DOI] [PMC free article] [PubMed] [Google Scholar]
- 31.Yu W, Shen P, Bao Z, Zhou K, Zheng B, Ji J, Guo L, Huang C, Xiao Y. 2017. In vitro antibacterial activity of fosfomycin combined with other antimicrobials against KPC-producing Klebsiella pneumoniae. Int J Antimicrob Agents 50:237–241. doi: 10.1016/j.ijantimicag.2017.03.011. [DOI] [PubMed] [Google Scholar]
- 32.Bulitta JB, Hope WW, Eakin AE, Guina T, Tam VH, Louie A, Drusano GL, Hoover JL. 2019. Generating robust and informative nonclinical in vitro and in vivo bacterial infection model efficacy data to support translation to humans. Antimicrob Agents Chemother 63:1–25. doi: 10.1128/AAC.02307-18. [DOI] [PMC free article] [PubMed] [Google Scholar]
- 33.Cavaleri M, Manolis E. 2015. Hollow fiber system model for tuberculosis: the European medicines agency experience. Clin Infect Dis 61:S1–S4. doi: 10.1093/cid/civ484. [DOI] [PubMed] [Google Scholar]
- 34.Baquero M-R, Nilsson AI, del Carmen Turrientes M, Sandvang D, Galán JC, Martínez JL, Frimodt-Møller N, Baquero F, Andersson DI. 2004. Polymorphic mutation frequencies in Escherichia coli: emergence of weak mutators in clinical isolates. J Bacteriol 186:5538–5542. doi: 10.1128/JB.186.16.5538-5542.2004. [DOI] [PMC free article] [PubMed] [Google Scholar]
- 35.Odds FC. 2003. Synergy, antagonism, and what the chequerboard puts between them. J Antimicrob Chemother 52:1–1. doi: 10.1093/jac/dkg301. [DOI] [PubMed] [Google Scholar]
- 36.Yadav B, Wennerberg K, Aittokallio T, Tang J. 2015. Searching for drug synergy in complex dose-response landscapes using an interaction potency model. Comput Struct Biotechnol J 13:504–513. doi: 10.1016/j.csbj.2015.09.001. [DOI] [PMC free article] [PubMed] [Google Scholar]
- 37.Ianevski A, Giri AK, Aittokallio T. 2020. SynergyFinder 2.0: visual analytics of multidrug combination synergies. Nucleic Acids Res 48:W488–W493. doi: 10.1093/nar/gkaa216. [DOI] [PMC free article] [PubMed] [Google Scholar]
- 38.Pfausler B, Spiss H, Dittrich P, Zeitlinger M, Schmutzhard E, Joukhadar C. 2004. Concentrations of fosfomycin in the cerebrospinal fluid of neurointensive care patients with ventriculostomy-associated ventriculitis. J Antimicrob Chemother 53:848–852. doi: 10.1093/jac/dkh158. [DOI] [PubMed] [Google Scholar]
- 39.Committee for Medicinal Products for Human Use, EMA. 2020. Fosfomycin-containing medicinal products. European Medicines Agency, Amsterdam, The Netherlands. https://www.ema.europa.eu/en/medicines/human/referrals/fosfomycin-containing-medicinal-products. [Google Scholar]
- 40.Jenkins A, Thomson AH, Brown NM, Semple Y, Sluman C, MacGowan A, Lovering AM, Wiffen PJ. 2016. Amikacin use and therapeutic drug monitoring in adults: do dose regimens and drug exposures affect either outcome or adverse events? A systematic review. J Antimicrob Chemother 71:2754–2759. doi: 10.1093/jac/dkw250. [DOI] [PubMed] [Google Scholar]
- 41.Blaser J. 1985. In vitro model for simultaneous simulation of the serum kinetics of two drugs with different half-lives. J Antimicrob Chemother 15:125–130. doi: 10.1093/jac/15.suppl_A.125. [DOI] [PubMed] [Google Scholar]
- 42.Li L, Chen X, Dai X, Chen H, Zhong D. 2007. Rapid and selective liquid chromatographic/tandem mass spectrometric method for the determination of fosfomycin in human plasma. J Chromatogr B Analyt Technol Biomed Life Sci 856:171–177. doi: 10.1016/j.jchromb.2007.05.037. [DOI] [PubMed] [Google Scholar]
- 43.Dijkstra JA, Sturkenboom MG, van Hateren K, Koster RA, Greijdanus B, Alffenaar J-WC. 2014. Quantification of amikacin and kanamycin in serum using a simple and validated LC-MS/MS method. Bioanalysis 6:2125–2133. doi: 10.4155/bio.14.191. [DOI] [PubMed] [Google Scholar]
Associated Data
This section collects any data citations, data availability statements, or supplementary materials included in this article.