

Abstract
Objective
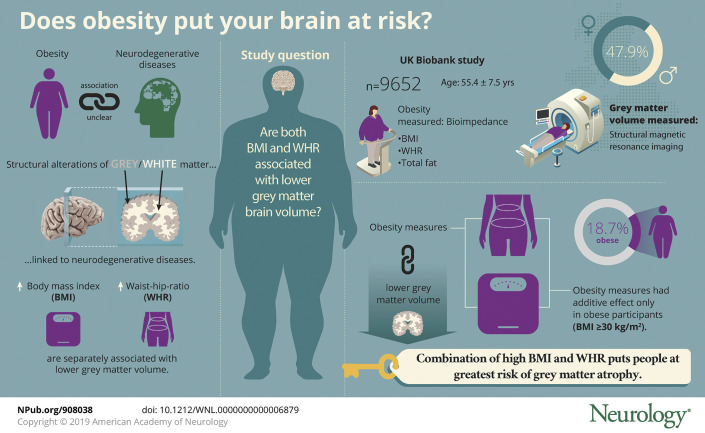
To examine the association of body mass index (BMI) and waist-to-hip ratio (WHR) with brain volume.
Methods
We used cross-sectional data from the UK Biobank study (n = 9,652, age 55.4 ± 7.5 years, 47.9% men). Measures included BMI, WHR, and total fat mass as ascertained from bioimpedance. Brain images were produced with structural MRI.
Results
After adjustment for a range of covariates, higher levels of all obesity measures were related to lower gray matter volume: BMI per 1 SD (β coefficient −4,113, 95% confidence interval [CI] −4,862 to −3,364), WHR (β coefficient −4,272, 95% CI −5,280 to −3,264), and fat mass (β coefficient −4,590, 95% CI −5,386 to −3,793). The combination of overall obesity (BMI ≥30 kg/m2) and central obesity (WHR >0.85 for women, >0.90 for men) was associated with the lowest gray matter compared with that in lean adults. In hypothesis-free testing with a Bonferroni correction, obesity was also related to various regional brain volumes, including caudate, putamen, pallidum, and nucleus accumbens. No associations between obesity and white matter were apparent.
Conclusion
The combination of heightened BMI and WHR may be an important risk factor for gray matter atrophy.
In the absence of effective treatment modalities, the primary prevention of neurodegenerative diseases, including dementia, has gathered much research interest1–3 but remains poorly understood. Obesity was associated with lower rates of dementia in a large-scale study of >2 million adults,4 although cohort studies with extended follow-up have shown null findings5 or even the reverse gradient.6 That weight loss is common in the preclinical phase (up to a decade before diagnosis) of dementia6,7 may go some way to explaining these apparently paradoxical findings.
The mechanisms underlying the association between obesity and neurodegenerative diseases are not well known. Structural alterations in gray and white matter have been linked to episodic memory decline and dementia risk.8 Various small-scale imaging studies9–16 have shown that higher levels of body mass index (BMI) and waist-to-hip ratio (WHR) are linked to lower gray matter volume. Although studies have examined BMI and WHR (as a marker of central obesity) separately, there has been no investigation of the joint effects, which may be important given the existing evidence in relation to other disease outcomes.17 Some data have suggested greater risk of cardiovascular disease in participants with both elevated BMI and WHR,17 which may be of relevance to neurodegenerative disorders given the apparent vascular origin.
The aim of this study was to examine the joint associations of BMI and WHR with brain structure using cross-sectional data from a large-scale population based imaging study of >9,000 adults.
Methods
Participants
Participants 40 to 69 years of age were recruited in 2006 to 2010 as part of the UK Biobank study and attended 1 of 22 clinical assessment centers in England, Wales, and Scotland.18
Standard protocol approvals, registrations, and patient consents
Ethics approval was provided by the National Health Service, National Research Ethics Service (reference 11/NW/0382). Participants provided written informed consent.
Obesity measures
Body weight and fat mass were collected with a Tanita (Tokyo, Japan) BC418MA body composition analyzer using bioimpedance.19 Nurses measured standing height using a Seca (Hamburg, Germany) height measure with the head positioned in the Frankfort plane. BMI was calculated with the standard formula (weight in kilograms divided by height in meters squared). To account for the fact that taller individuals tend to have more fat and lean mass, height-adjusted indices were used to create a fat index score (created by dividing fat mass in kilograms by height in meters1.2).20 Waist and hip circumferences were measured with a Seca 200 measuring tape using standard procedures. Participants were excluded from bioimpedance measures if they were pregnant, using a pacemaker, wheelchair-bound, an amputee, unable to grip the handles of the Tanita analyzer, unable to stand, wearing a plaster cast, or unwilling to remove their shoes.
Structural MRI
In 2014, 100,000 participants from the original UK Biobank sample were invited back for brain, heart, and body imaging.21 Approximately 10,000 were scanned between 2014 and 2016; processed data were used in the present analyses. Total gray and white volumes were measured with structural MRI across 3 imaging centers that were equipped with identical scanners (Siemens Skyra 3T running VD13A SP4 with a Siemens 32-channel RF receive head coil, Munich, Germany). The MRI protocols have been described in detail elsewhere.21 For each scan, Siemens auto-align software determined the field-of-view, which aligns a scout scan to an atlas. If auto-align failed, the radiographer set the alignment. Structural images were acquired with straight sagittal orientation (i.e., with the field of view aligned to the scanner axes), with a resolution of 1 × 1 × 1 mm and a field of view of 208 × 256 × 256 matrix, over a duration of 5 minutes, and with 1-mm isotropic resolution using a 3-dimensional magnetization-prepared rapid-acquisition gradient echo.21 Information on structural image segmentation and data normalization is provided in detail elsewhere.22 Publicly available image processing tools were used to process the data largely taken from FSL (the FMRIB Software Library). The output of the standard biobank processing pipeline was used for the present analyses. Data were normalized for head size.
Covariates
Covariates were chosen a priori on the basis of previous evidence.4–6 During the clinic visit, data were collected via self-report for age, sex, smoking history, frequency of alcohol intake (daily or almost daily, 1–2 times a week or monthly, never or almost never), educational attainment (college/degree, A-level, O-level, CSEs or equivalent, National Vocational Qualifications/Higher National Diploma or equivalent, other professional qualification, none), physical activity, and self-reported physician-diagnosed heart disease, hypertension, and major depression.
Statistical analysis
In all our analyses, underweight participants (BMI <18.5 kg/m2, n = 41) were removed because this subsample was too small to analyze in its own right and inclusion within the healthy weight category may have introduced bias (i.e., large weight loss may be a marker of disease onset). In addition, we removed 1 participant with self-reported diagnosis of dementia or cognitive impairment to avoid reverse causation. We modeled the associations between various measures of obesity (per 1-SD increase) and brain structure (total gray and white volume) using multiple linear regression. β Coefficients were adjusted for age, sex, smoking, alcohol consumption, physical activity, education, heart disease, hypertension, and depression. We tested for nonlinearity by fitting a squared term for each obesity measure. We selectively examined effect modification by fitting interaction terms for age (3 categories) and sex only. In doing so, the joint effects of overall (BMI ≥ 30 kg/m2) and central (WHR >0.8 for women, >0.9 for men) obesity on brain structure were examined by creating 6 groups (reference category BMI <25 kg/m2 without central obesity, BMI <25 kg/m2 with central obesity, BMI 25–<30 kg/m2 without central obesity, BMI 25–<30 kg/m2 with central obesity, BMI ≥30 kg/m2 without central obesity, BMI ≥30 kg/m2 with central obesity). Analyses were performed with SPSS version 22 (SPSS Inc, Chicago, IL).
Data availability statement
All bona fide researchers can apply to use the UK Biobank resource for health-related research that is in the public interest (ukbiobank.ac.uk/register-apply/).
Results
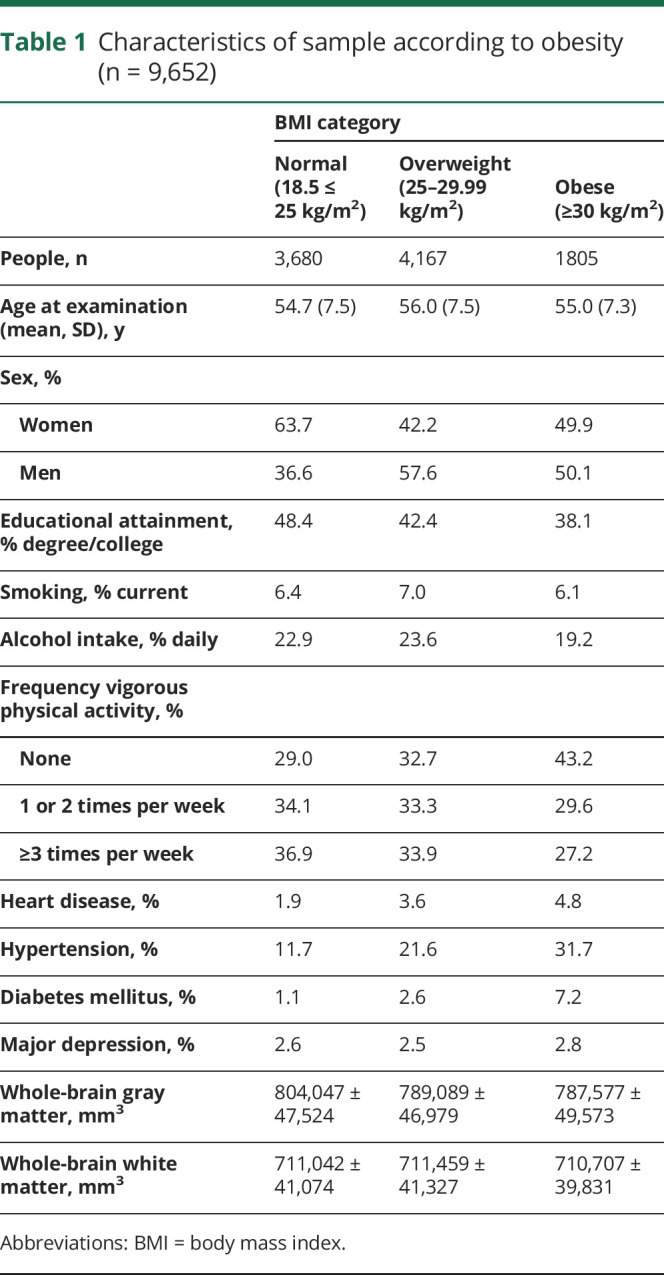
The flow of study participants into the analytic sample is depicted in figure 1. The analytical sample comprised 9,652 healthy adults (age 55.3 ± 7.5 years, 47.9% men). Obesity was apparent in 18.7% of the sample. As anticipated, obese people were less likely to have a degree and to be physically active; they also had a higher prevalence of heart disease and hypertension (table 1).
Figure 1. Flowchart describing sample selection.
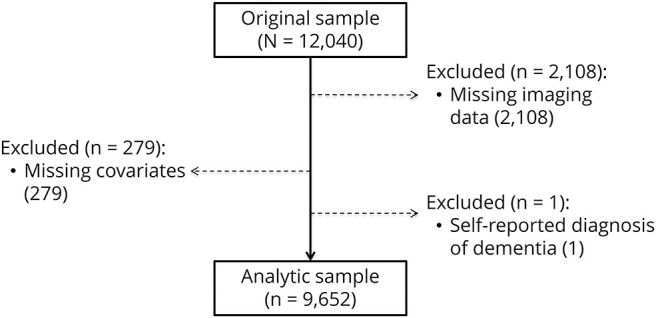
Table 1.
Characteristics of sample according to obesity (n = 9,652)
Higher levels of all obesity indicators were associated with lower gray matter volume after adjustment for covariates (table 2). No associations with white matter were observed at conventional levels of statistical significance. The linear nature of the BMI–gray matter association was similar across age categories (figure 2) (p for interaction = 0.50) and sex (p for interaction = 0.23).
Table 2.
β Coefficients for the association between markers of adiposity and brain volume (n = 9,652)
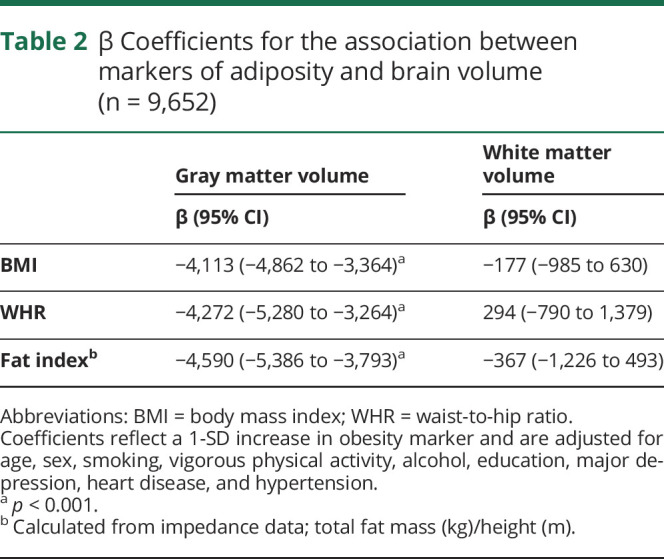
Figure 2. Association between body mass index and gray matter volume relative to age.

Data are presented as means adjusted for age, sex, smoking, vigorous physical activity, alcohol, education, major depression, heart disease, and hypertension.
Next, we conducted a series of sensitivity analyses. First, diabetes mellitus is likely to be on the intermediate pathway between obesity and brain atrophy. To test its role, we additionally controlled for a diagnosis of diabetes mellitus (sample prevalence 2.9%). Participants with diabetes mellitus demonstrated lower gray matter volume (β = −14,200, 95% confidence interval [CI] −18,595 to −9,804) compared to those without the condition. When we added diabetes mellitus to the models featured in table 2, the associations between BMI and gray matter (β = −3,847, 95% CI −4,600 to −3,093) and WHR and gray matter (β = −3,942, 95% CI −4,954 to −2,930) were, in fact, only partially attenuated (≈6%–8%).
Second, data were available on “fluid intelligence” (a task with 13 logic/reasoning-type questions and a 2-minute time limit23) in a subsample of participants (n = 3,477). We conducted a sensitivity analysis on obesity and gray matter volume with additional adjustment for fluid intelligence score in this subsample. Again, results remained largely unchanged: 1-SD unit increase in BMI (β = −3,292, 95% CI −4,560 to −2025), WHR (β = −3,661, 95% CI −5,322 to −2000), and fat index (β = −3,448; 95% CI −4,790 to −2,107).
Third, we examined the combined influences of BMI and WHR on brain volume. Within normal and overweight BMI categories, there were no differences in gray matter volume between participants with and those without central obesity. Within obese participants (BMI ≥30 kg/m2) with central obesity (present in 72%), however, there was evidence of lower gray matter volume compared with those who were not categorized as centrally obese (β = −4,496, 95% CI, −8,820 to −172, p = 0.04) (figure 3). These differences were marginally attenuated with further adjustment for total body fat percentage (β = −3,907, 95% CI, −8,246 to 432, p = 0.078).
Figure 3. Body mass index and waist-to-hip in relation to gray matter brain volume.

Data are presented as means adjusted for age, sex, smoking, vigorous physical activity, alcohol, education, major depression, heart disease, and hypertension.
Lastly, an exploratory analysis was conducted to examine associations between obesity and 7 specific brain region volumes using partial correlations. These tests were hypothesis free, and, owing to their frequency, we applied a Bonferroni correction. Obesity was associated with a lower volume of the caudate (only WHR), putamen (only BMI and total fat mass), pallidum, and nucleus accumbens regions (p < 0.001) (table 3).
Table 3.
Partial correlations between measures of adiposity and specific brain volumes

Discussion
The aim of the present paper was to examine associations between obesity and brain volumes, taking advantage of a considerably larger study population than in previous work. Our main finding was that people with obesity, as ascertained with BMI and WHR, had a lower gray matter volume. BMI and WHR appeared to have additive effects only in obese (BMI ≥30 kg/m2) participants, although associations appeared to be driven partly by total body fat percentage. For the first time, we also found apparent associations of obesity with specific brain regions, relationships that need detailed replication with other datasets.
The association between obesity and health outcomes has been controversial,24,25 and this might be partly explained by specific health effects of different fat depots. BMI is thought to be more reflective of fat stored peripherally, whereas WHR is an indicator of fat located viscerally and potentially considered a greater risk factor for heart disease.26 Epidemiological studies of mortality risk have tested whether WHR can provide additional predictive utility over and above BMI, although results have been mixed.17,25,27,28 The present data suggest that the combination of high BMI and high WHR is associated with greater gray matter atrophy. Visceral fat is thought to be a major site for inflammatory cytokine production and has been linked to other vascular risk factors (hypertension, diabetes mellitus)29 that may be important mechanisms in brain atrophy.13,30,31 Associations between obesity and gray matter volume were only partly explained by diabetes mellitus in the present study. In contrast, subcutaneous fat in the hips and legs has been linked to healthier metabolic profiles,32 which may provide partial support for the concept of metabolically healthy obesity. Indeed, our data suggested that obese participants (BMI ≥30 kg/m2) without central obesity had a gray matter volume similar to that of overweight participants.
Hippocampal atrophy is thought to be particularly relevant to the etiology of neurodegenerative diseases such as Alzheimer disease,33 although we did not observe consistent associations with obesity. Previous work has hypothesized obesity–gray matter associations specifically in areas involved in behavioral control, reward processing (e.g., the prefrontal cortex in the frontal lobe or striatum with caudate nucleus, globus pallidus, and putamen), homeostasis (hypothalamus), and motor control (cerebellum and gyrus precentralis). These areas could conceivably be linked to obesogenic behavior such as appetite and satiety regulation.15 The present results confirm earlier work15 by demonstrating associations between obesity and smaller volumes in some of these specific areas of the brain (i.e., caudate, putamen). Structural brain abnormalities that disrupt appetite regulation/reward could precede the development of obesity. Although brain imaging data were collected after measures of obesity, these were essentially cross-sectional analyses; therefore, we are unable to speculate on the direction of the association.
Our study of course has its limitations. Chronic disease was based on self-report of physician diagnosis, although previous work has demonstrated the validity of this approach.34 As in any observational study, the possibility of residual confounding cannot be excluded. Only ≈5% of the target population took part in UK Biobank,35 and study members typically showed more favorable risk profiles than the nonresponders. Thus, the issue of selection is likely to be much more serious in the present study. Highly select groups of the population, however, tend to reveal the same risk factor–disease associations as those seen in the general population.36 On balance, therefore, while the prevalence of selected characteristics will differ in the UK Biobank, risk factor–health outcome associations should not.
Obesity was associated with lower gray matter brain volumes. It is unclear whether structural brain abnormalities drive obesity or whether obesity induces changes in gray matter volume that play a mechanistic role in future risk of neurodegeneration.
Glossary
- BMI
body mass index
- CI
confidence interval
- WHR
wait-to-hip ratio
Appendix 1. Author contributions

Study funding
This research has been conducted using the UK Biobank Resource under application 23,476. M.H. acknowledges support from the National Institute for Health Research Leicester Biomedical Research Centre. G.D.B. is supported by the UK Medical Research Council (MR/P023444/1) and the US National Institute on Aging (1R56AG052519-01, 1R01AG052519-01A1).
Disclosure
The authors report no disclosures relevant to the manuscript. Go to Neurology.org/N for full disclosures.
References
- 1.Beydoun MA, Beydoun HA, Wang Y. Obesity and central obesity as risk factors for incident dementia and its subtypes: a systematic review and meta-analysis. Obes Rev 2008;9:204–218. [DOI] [PMC free article] [PubMed] [Google Scholar]
- 2.Anstey KJ, Cherbuin N, Budge M, Young J. Body mass index in midlife and late-life as a risk factor for dementia: a meta-analysis of prospective studies. Obes Rev 2011;12:e426–e437. [DOI] [PubMed] [Google Scholar]
- 3.Emmerzaal TL, Kiliaan AJ, Gustafson DR. 2003-2013: A decade of body mass index, Alzheimer's disease, and dementia. J Alzheimers Dis 2015;43:739–755. [DOI] [PubMed] [Google Scholar]
- 4.Qizilbash N, Gregson J, Johnson ME, et al. BMI and risk of dementia in two million people over two decades: a retrospective cohort study. Lancet Diabetes Endocrinol 2015;3:431–436. [DOI] [PubMed] [Google Scholar]
- 5.Batty GD, Galobardes B, Starr JM, Jeffreys M, Davey Smith G, Russ TC. Examining if being overweight really confers protection against dementia: sixty-four year follow-up of participants in the Glasgow University Alumni Cohort Study. J Negat Results Biomed 2016;15:19. [DOI] [PMC free article] [PubMed] [Google Scholar]
- 6.Singh-Manoux A, Dugravot A, Shipley M, et al. Obesity trajectories and risk of dementia: 28 years of follow-up in the Whitehall II Study. Alzheimers Dement 2018;14:178–186. [DOI] [PMC free article] [PubMed] [Google Scholar]
- 7.Knopman DS, Edland SD, Cha RH, Petersen RC, Rocca WA. Incident dementia in women is preceded by weight loss by at least a decade. Neurology 2007;69:739–746. [DOI] [PubMed] [Google Scholar]
- 8.Nyberg L. Functional brain imaging of episodic memory decline in ageing. J Intern Med 2017;281:65–74. [DOI] [PubMed] [Google Scholar]
- 9.Pannacciulli N, Del Parigi A, Chen K, Le DS, Reiman EM, Tataranni PA. Brain abnormalities in human obesity: a voxel-based morphometric study. Neuroimage 2006;31:1419–1425. [DOI] [PubMed] [Google Scholar]
- 10.Raji CA, Ho AJ, Parikshak NN. Brain structure and obesity. Hum Brain Mapp 2010;31:353–364. [DOI] [PMC free article] [PubMed] [Google Scholar]
- 11.Yokum S, Ng J, Stice E. Relation of regional gray and white matter volumes to current BMI and future increases in BMI: a prospective MRI study. Int J Obes (Lond) 2012;36:656–664. [DOI] [PMC free article] [PubMed] [Google Scholar]
- 12.Debette S, Beiser A, Hoffmann U, et al. Visceral fat is associated with lower brain volume in healthy middle-aged adults. Ann Neurol 2010;68:136–144. [DOI] [PMC free article] [PubMed] [Google Scholar]
- 13.Debette S, Seshadri S, Beiser A, et al. Midlife vascular risk factor exposure accelerates structural brain aging and cognitive decline. Neurology 2011;77:461–468. [DOI] [PMC free article] [PubMed] [Google Scholar]
- 14.Kurth F, Levitt JG, Phillips OR, et al. Relationships between gray matter, body mass index, and waist circumference in healthy adults. Hum Brain Mapp 2013;34:1737–1746. [DOI] [PMC free article] [PubMed] [Google Scholar]
- 15.Janowitz D, Wittfeld K, Terock J, et al. Association between waist circumference and gray matter volume in 2344 individuals from two adult community-based samples. Neuroimage 2015;122:149–157. [DOI] [PubMed] [Google Scholar]
- 16.Taki Y, Kinomura S, Sato K, et al. Relationship between body mass index and gray matter volume in 1,428 healthy individuals. Obesity 2008;16:119–124. [DOI] [PubMed] [Google Scholar]
- 17.Hamer M, O'Donovan G, Stensel D, Stamatakis E. Normal-weight central obesity and risk for mortality. Ann Intern Med 2017;166:917–918. [DOI] [PubMed] [Google Scholar]
- 18.Sudlow C, Gallacher J, Allen N, et al. UK Biobank: an open access resource for identifying the causes of a wide range of complex diseases of middle and old age. PLoS Med 2015;12:e1001779. [DOI] [PMC free article] [PubMed] [Google Scholar]
- 19.Ortega LS, Bradbury KE, Cross AJ, Morris JS, Gunter MJ, Murphy N. A prospective investigation of body size, body fat composition and colorectal cancer risk in the UK Biobank. Sci Rep 2017;7:17807. [DOI] [PMC free article] [PubMed] [Google Scholar]
- 20.Bann D, Kuh D, Wills AK, Adams J, Brage S, Cooper R. Physical activity across adulthood in relation to fat and lean body mass in early old age: findings from the Medical Research Council National Survey of Health and Development, 1946-2010. Am J Epidemiol 2014;179:1197–1207. [DOI] [PMC free article] [PubMed] [Google Scholar]
- 21.Miller KL, Alfaro-Almagro F, Bangerter NK, et al. Multimodal population brain imaging in the UK Biobank prospective epidemiological study. Nat Neurosci 2016;19:1523–1536. [DOI] [PMC free article] [PubMed] [Google Scholar]
- 22.Alfaro-Almagro F, Jenkinson M, Bangerter NK, et al. Image processing and quality control for the first 10,000 brain imaging datasets from UK Biobank. Neuroimage 2018;166:400–424. [DOI] [PMC free article] [PubMed] [Google Scholar]
- 23.Lyall DM, Cullen B, Allerhand M, et al. Cognitive test scores in UK Biobank: data reduction in 480,416 participants and longitudinal stability in 20,346 participants. PLoS One 2016;11:e0154222. [DOI] [PMC free article] [PubMed] [Google Scholar]
- 24.Flegal KM, Kit BK, Orpana H, Graubard BI. Association of all-cause mortality with overweight and obesity using standard body mass index categories: a systematic review and meta-analysis. JAMA 2013;309:71–82. [DOI] [PMC free article] [PubMed] [Google Scholar]
- 25.Sahakyan KR, Somers VK, Rodriguez-Escudero JP, et al. Normal-weight central obesity: implications for total and cardiovascular mortality. Ann Intern Med 2015;163:827–835. [DOI] [PMC free article] [PubMed] [Google Scholar]
- 26.Emdin CA, Khera AV, Natarajan P, et al. Genetic association of waist-to-hip ratio with cardiometabolic traits, type 2 diabetes, and coronary heart disease. JAMA 2017;317:626–634. [DOI] [PMC free article] [PubMed] [Google Scholar]
- 27.Wormser D, Wormser D, Kaptoge S, et al. Separate and combined associations of body-mass index and abdominal adiposity with cardiovascular disease: collaborative analysis of 58 prospective studies. Lancet 2011;377:1085–1095. [DOI] [PMC free article] [PubMed] [Google Scholar]
- 28.Czernichow S, Kengne AP, Stamatakis E, Hamer M, Batty GD. Body mass index, waist circumference and waist-hip ratio: which is the better discriminator of cardiovascular disease mortality risk? Evidence from an individual-participant meta-analysis of 82 864 participants from nine cohort studies. Obes Rev 2011;12:680–687. [DOI] [PMC free article] [PubMed] [Google Scholar]
- 29.Despres JP. Intra-abdominal obesity: an untreated risk factor for type 2 diabetes and cardiovascular disease. J Endocrinol Invest 2006;29(suppl):77–82. [PubMed] [Google Scholar]
- 30.Korf ES, van Straaten EC, de Leeuw FE, et al. Diabetes mellitus, hypertension and medial temporal lobe atrophy: the LADIS study. Diabet Med 2007;24:166–171. [DOI] [PubMed] [Google Scholar]
- 31.den Heijer T, Vermeer SE, van Dijk EJ, et al. Type 2 diabetes and atrophy of medial temporal lobe structures on brain MRI. Diabetologia 2003;46:1604–1610. [DOI] [PubMed] [Google Scholar]
- 32.Manolopoulos KN, Karpe F, Frayn KN. Gluteofemoral body fat as a determinant of metabolic health. Int J Obes (Lond) 2010;34:949–959. [DOI] [PubMed] [Google Scholar]
- 33.Karas GB, Burton EJ, Rombouts SA, et al. A comprehensive study of gray matter loss in patients with Alzheimer's disease using optimized voxel-based morphometry. Neuroimage 2003;18:895–907. [DOI] [PubMed] [Google Scholar]
- 34.Pierce MB, Zaninotto P, Steel N, Mindell J. Undiagnosed diabetes: data from the English Longitudinal Study of Ageing. Diabet Med 2009;26:679–685. [DOI] [PubMed] [Google Scholar]
- 35.Fry A, Littlejohns TJ, Sudlow C, et al. Comparison of sociodemographic and health-related characteristics of UK Biobank participants with those of the general population. Am J Epidemiol 2017;186:1026–1034. [DOI] [PMC free article] [PubMed] [Google Scholar]
- 36.Batty GD, Shipley M, Tabák A, et al. Generalizability of occupational cohort study findings. Epidemiology 2014;25:932–933. [DOI] [PubMed] [Google Scholar]
Associated Data
This section collects any data citations, data availability statements, or supplementary materials included in this article.
Data Availability Statement
All bona fide researchers can apply to use the UK Biobank resource for health-related research that is in the public interest (ukbiobank.ac.uk/register-apply/).