We thank Melsen et al. for their interest in our study. Their remarks allow us to clarify key aspects of our work on human bone marrow NK cell biology.1
Our study reports the unsupervised single-cell analysis of NK cells from eight healthy donors and eight acute myeloid leukemia (AML) patients.1 First, we detected an adaptive NK cell subset that correlated with the cytomegalovirus (CMV) positivity status of the donors. In agreement with previous studies, not all CMV-seropositive donors possessed this additional NK cell population, at least at the transcriptomic level.2 We further showed that healthy human bone marrow NK cells encompassed three transcriptionally distinct populations in all donors, one CD56dim (hNK_Bm1) subset and two CD56bright (hNK_Bm2 and hNK_Bm3) subsets. Machine learning algorithms supported the robustness of our analysis and further validated this segregation.
We then explored the heterogeneity of the bone marrow NK cell compartment in AML patients at diagnosis and revealed patient-dependent transcriptomic profiles of NK cells that prevented subset assignment. However, the transcriptomic signature revealed a profound impact associated with AML on bone marrow NK cells. In particular, downregulation of CD160 mRNA expression was observed in AML patients compared to healthy donors and was confirmed at the protein level. Remarkably, higher CD160 levels correlated with better survival, suggesting that CD160 could be a marker of interest in AML.
Finally, we uncovered a developmental path between the three bone marrow NK cell subsets identified in healthy donors using the pseudotime algorithm Monocle DDRTree, which computationally orders the transcriptomic profiles of cells along a trajectory without prior information about their clustering. hNK_Bm3 intersected with two pseudotime branches, giving rise to CD56dim-hNK_Bm1 and CD56bright-hNK_Bm2, which resembled the NK1 and NK2 subsets that we previously described in the spleen and blood, respectively.3 CD56bright hNK_Bm3 was thus referred to as NK0. When we reanalyzed a previous dataset,3 NK0 cells were also found in the spleen (CD56bright-hNK_Sp3), and this subset was predicted to give rise to both NK1-like CD56dim-hNK_Sp1 and NK2-like CD56bright-hNK_Sp2 cells. These results were further strengthened by a transcriptional maturity gradient, with NK0 cells being the less mature bone marrow NK cell subset. NK0 cells could be distinguished from NK2/CD56bright-NK_Bm2 cells based on higher levels of CD52 and CD127 and lower levels of CD160 expression.
Melsen et al. recently used bulk RNA-seq and provided the transcriptomic profile of a purified CD69+ CXCR6+ NK cell population in human lymphoid tissues, further referred to as lymphoid tissue NK (ltNK) cells.4 In their comment on our findings,5 they proposed that the hNK_Bm2 subset that we identified1 corresponded to the tissue-resident ltNK subsets that they found earlier4. We explored this possibility along two distinct axes, as follows.
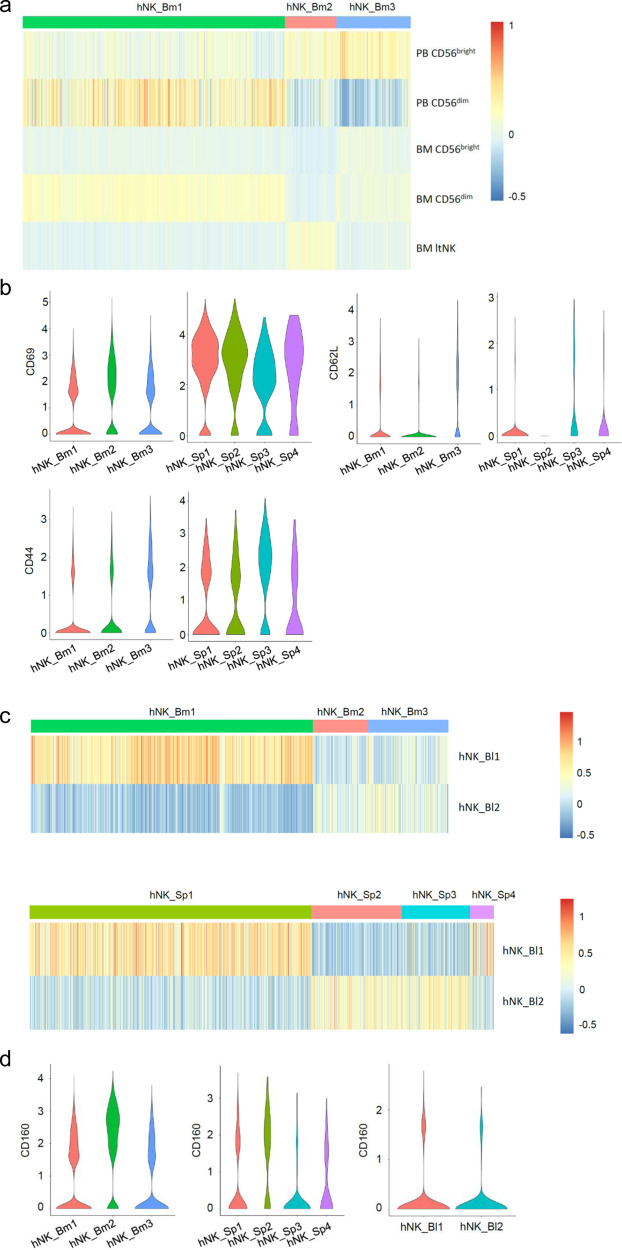
As previously published,1 the comparison of both datasets revealed that “the transcriptomes of the hNK_Bm3 and hNK_Sp3 tissue-resident subsets (NK0) were not enriched in the transcriptomic signature of ltNK cells”. In addition, we now show here (Fig. 1a) that hNK_Bm1 cells resembled the CD56dim NK cell transcriptomic profile isolated from the peripheral blood by Hanna et al.,6 while both hNK_Bm2 and bone marrow NK0 (hNK_Bm3) cells had a stronger enrichment in the CD56bright signature. These gene signature enrichments were relatively weak when comparing our NK cell subsets to the bone marrow CD56dim and CD56bright identified by Melsen et al., but the findings still confirmed that the profiles of hNK_Bm1 cells and BM CD56dim cells matched.7 In addition, the bone marrow NK0 (hNK_Bm3) gene signature did not appear similar to that of ltNK cells, as we previously stated.1 Despite the weakness of this transcriptomic relatedness, the ltNK signature was enriched to some extent in the hNK_Bm2 population, as indicated by Melsen et al. in their commentary.5 However, our study1 and those of Melsen et al.4,7 did not compare the same cells. While we performed a nonsupervised analysis of unsorted CD45+CD3−CD19−CD56+ human bone marrow NK cells by single-cell RNA-seq, while Melsen et al. sorted their populations from a CD45+CD3−CD19−CD7+CD56+ gate and performed bulk RNA-seq sequencing.4 This difference would explain why ltNK cells exhibit a transcriptomic signature that is significantly different from that of bone marrow-derived CD56bright and CD56dim NK cells, even though these cells constitute an intermediate NK cell population in terms of CD56 expression.5 This finding is consistent with CD7 expression that goes beyond NK cells and is observed on progenitor and mature ILCs.8 It is not clear whether the ltNK population constitutes bona fide NK cells.
Fig. 1.
a Heatmap showing the hNK_Bm1, hNK_Bm2, and hNK_Bm3 gene expression profiles of peripheral blood (PB) NK cells from Hannah et al.6 and for bone marrow (BM) NK cells from Melsen et al.7 b Violin plot representing the distribution of module scores for CD69, CD62L, and CD44 for each indicated NK cell subset grouped by tissue of origin. c Heatmap showing the hNK_Bl1 and hNK_Bl2 gene expression profiles of each of the three healthy human bone marrow and the four splenic NK cell subsets. d Violin plot representing the distribution of the module score for CD160 for each indicated NK cell subset grouped by tissue of origin.
-
(2)
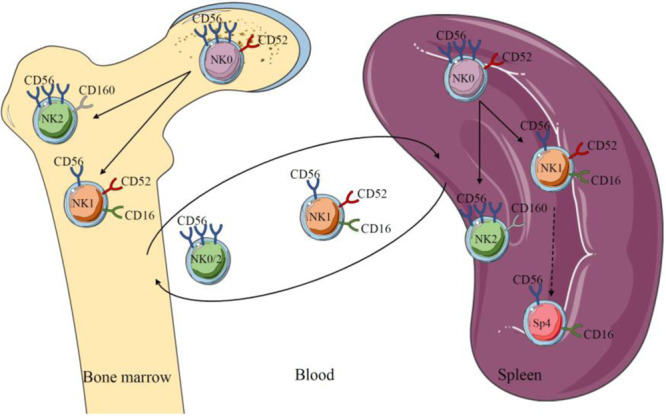
We showed that hNK_Bm2 cells resembled hNK_Sp2 cells and that hNK_Bm3 cells were similar to hNK_Sp3 cells.1,3 In addition, we found no difference in CD69 expression between the hNK_Bm2 and hNK_Bm3 subsets but an enrichment in CD44- and CD62L-encoding adhesion molecules associated with homing and anchorage in the bone marrow in the hNK_Bm3 transcriptomic signature (ref. 1 and Fig. 1b). We thus originally proposed that NK0 cells (hNK_Bm3 and hNK_Sp3) were tissue resident. However, tissue residency features do not only rely on the expression of few surface molecules but should be demonstrated by formal recirculation experiments. In the absence of such formal demonstration, NK0 (hNK_Bm3 and hNK_Sp3) cells should rather be referred to as a “tissue-specific” rather than a “tissue-resident” NK cell subset. However, we reanalyzed our data and compared the blood, splenic and bone marrow NK cell subsets. Both hNK_Bm2 and bone marrow NK0 (hNK_Bm3) cells exhibited similar enrichment in the hNK_Bl2 transcriptomic profile (Fig. 1c, upper panel). The same pattern was observed when comparing the hNK_Sp2 and splenic NK0 (hNK_Sp3) subsets to the hNK_Bl2 subset (Fig. 1c, lower panel). These results suggested that an intermediate NK0/NK2 CD56bright subset could be found in the blood. We stated and showed at both the transcriptomic and protein levels that CD160 and CD52 could be used to differentiate NK0 (CD52+CD160−) and NK2 (CD52−CD160+) CD56bright subsets in the spleen and bone marrow.1,3 However, in line with its absence at the transcriptomic level in the blood (not found in the hNK_Bl2 gene signature) (Fig. 1d) and in agreement with Melsen et al. comment,5 we should have made it more clear that CD160 was not present in the blood at the protein level. As such, we would like to offer a modified version of our original Supplementary Fig. 4, in which the blood contains two subsets of NK cells, one resembling CD56dim-NK1 cells and one resembling CD56bright-NK0/2 cells, the latter subset representing an intermediate population between tissue-specific “true” CD56bright (NK2) cells and NK0 progenitors1 (Fig. 2).
Fig. 2.

Schematic representation of NK0 CD56bright subset differentiation into NK1 CD56dim and NK2 CD56bright subsets in the bone marrow and spleen. Dichotomous cell surface expression of CD52 and CD160 distinguished the NK0/CD56bright subset from the NK2/CD56bright subset in organs. In the blood, the NK1 subset is present with a CD56bright-NK0/2 subset, and the latter represents an intermediate population between tissue-specific “true” CD56bright cells and progenitors. HuNK_Sp4 appears to be a more mature state of NK1 cells that was found only in the spleen.
In conclusion, given the current data available, we maintain that across all healthy donors, only two subsets of NK cells were found in the blood, while three were identified in the bone marrow and spleen. A minor subset of the CD56bright/NK0 NK cell population expressing CD52 possibly generates both the CD56dim-like/NK1 NK cell subset and the other CD56bright/NK2 NK cell subset expressing CD160.
Competing interests
E.V. is a cofounder and employee of Innate Pharma. The authors declare no competing interests.
Contributor Information
Emilie Narni-Mancinelli, Email: narni@ciml.univ-mrs.fr.
Eric Vivier, Email: vivier@ciml.univ-mrs.fr.
References
- 1.Crinier A. et al. Single-cell profiling reveals the trajectories of natural killer cell differentiation in bone marrow and a stress signature induced by acute myeloid leukemia. Cell. Mol. Immunol.18, 1290–1304 (2021). [DOI] [PMC free article] [PubMed]
- 2.Schlums, H. et al. Cytomegalovirus infection drives adaptive epigenetic diversification of NK cells with altered signaling and effector function. Immunity42, 443–456 (2015). [DOI] [PMC free article] [PubMed] [Google Scholar]
- 3.Crinier, A. et al. High-dimensional single-cell analysis identifies organ-specific signatures and conserved NK cell subsets in humans and mice. Immunity49, 971–86 e5 (2018). [DOI] [PMC free article] [PubMed] [Google Scholar]
- 4.Melsen, J. E., Lugthart, G., Lankester, A. C. & Schilham, M. W. Human circulating and tissue-resident CD56(bright) natural killer cell populations. Front. Immunol.7, 262 (2016). [DOI] [PMC free article] [PubMed] [Google Scholar]
- 5.Melsen, J. E., Lugthart, G., van Ostaijen-ten Dam, M. M. & Schilham, M. W. Comment to: Single-cell profiling reveals the trajectories of natural killer cell differentiation in bone marrow and a stress signature induced by acute myeloid leukemia. Cell. Mol. Immunol.18, 1348–1349 (2021). [DOI] [PMC free article] [PubMed]
- 6.Hanna, J. et al. Novel insights on human NK cells’ immunological modalities revealed by gene expression profiling. J. Immunol.173, 6547–6563 (2004). [DOI] [PubMed] [Google Scholar]
- 7.Melsen, J. E. et al. Human bone marrow-resident natural killer cells have a unique transcriptional profile and resemble resident memory CD8(+) T cells. Front. Immunol.9, 1829 (2018). [DOI] [PMC free article] [PubMed] [Google Scholar]
- 8.Lim, A. I. et al. Systemic human ILC precursors provide a substrate for tissue ILC differentiation. Cell168, 1086–100 e10 (2017). [DOI] [PubMed] [Google Scholar]


